Page 1 PERFORMANCE HIGHLIGHTS MARCH 2014.
60
Page 1 www.canarabank.com PERFORMANCE HIGHLIGHTS MARCH 2014
-
Upload
conrad-simon -
Category
Documents
-
view
215 -
download
1
Transcript of Page 1 PERFORMANCE HIGHLIGHTS MARCH 2014.

Page 1www.canarabank.com
PERFORMANCE
HIGHLIGHTS
MARCH 2014

Page 2www.canarabank.com
HIGHLIGHTS – March’2014 • Net profit for Q4FY14 at ` 611 crore up by 49.4% over previous quarter (Q3FY14) net profit level of ` 409 crore.
• Gross NPA Ratio down to 2.49% from 2.57% as at March 2013 and from 2.79% at Dec’13.
• Net NPA ratio down to 1.98% from 2.18% as at March 2013 and from 2.39% at Dec’13 .
• Record Cash Recovery at ` 5494 crore compared to ` 4006 crore last year.
• Recovery from technically written off accounts at ` 1247 crore (16.8% of outstanding amount).
• Upgradation at ` 2853 crore compared to ` 852 crore last year.
• Provision Coverage ratio increased to 60.11% from 57.39% at Dec’13.
• Increase in CASA ratio (domestic) to 25.9% from 25.1% last year. Savings deposits increased to ` 85536 crore, with a y-o-y growth of 20.2%.

Page 3www.canarabank.com
HIGHLIGHTS – March’2014• Robust growth in retail business- MSME (35%), MSE (38%), Retail Lending (45%), Housing Loans (50%), Vehicle Loans (62%) and other personal loans (58%).
• Mandatory norms complied under Priority Credit, Agriculture, MSE (Accounts and Amount), Minority Communities and Weaker Section.
• Core fee income (excluding treasury trading profit) up by ` 792 crore to ` 3269 crore (32% y.o.y) from ` 2477 crore last year.
• Total Business up by ` 1.24 lakh crore (20.7% y.o.y) to ` 7.22 lakh crore.
• Total Deposits up by 18.2% y-o-y to ` 4.21 lakh crore.
• Advances (net) up by 24.3% y-o-y to ` 3.01 lakh crore.
• Record addition of 1027 branches, taking the total to 4755.
• Record addition of 2786 ATMs, taking number to 6312.
• 100% onsite ATMs for all 3728 branches opened upto March 2013.
• Record increase in E-transactions to 44% from 27% last year.

Page 4www.canarabank.com
HIGHLIGHTS – March’2014
• Total income for the full year increased by16.8% to `43480 crore.
• Income from loans/advances increased by 16.7% to `28457 crore.
• Net Int. Income for the FY14 at `8944 crore increased by 13.5% y.o.y and 39.6% Q.o.Q
• Operating Profit for the full year at `6796 crore, recorded an increase of 15.4% y.o.y and 38.3% Q.o.Q.
• Total provision increased to `4358 crore in FY14 compared to `3018 crore in FY13 with a growth of 44.4% y.o.y.
• Net profit for the full year `2438 crore.
• The Board has recommended a dividend of 110% for the full year, including an interim dividend of 65% declared in January 2014.
• Thrust on Asset Quality/NPA reduction, Recovery, CASA, Retail Business & Fee Income.

Page 5www.canarabank.com
PERFORMANCE HIGHLIGHTS- BUSINESS
Parameters MAR’13 JUNE’13 SEP’13 Dec’13 MAR’1
4SEQ(%)
y.o.yGrowth(%)
Deposits 355856 381972 391613 408924 420723 2.9 18.2
Advances 242177 249891 281104 287700 301067 4.6 24.3
Business 598033 631863 672717 696624 721790 3.6 20.7
C-D Ratio 68.05 65.42 71.78 70.36 71.56 1.2 3.5
Amt. in ` Crore
Note : SEQ- Sequential Quarter – Q4FY14 over
Q3FY14

Page 6www.canarabank.com
PERFORMANCE HIGHLIGHTS- OVERSEAS BUSINESS
Parameters
MAR’ 13 MAR’ 14 y.o.yGrowth
(%)
USD Mn
` Crs USD Mn
` Crs
Deposits 2225 13749 3647 21870 59.07
Advances 2433 15037 3243 19224 27.84
Gross Income 113 637 187 1092 71.43
Gross Expenditure 80 450 146 851 89.11
Gross Profit 33 187 41 242 29.41
Overseas Business constitute 5.7% of the Total Business compared to 4.8% last year
Page 7www.canarabank.com
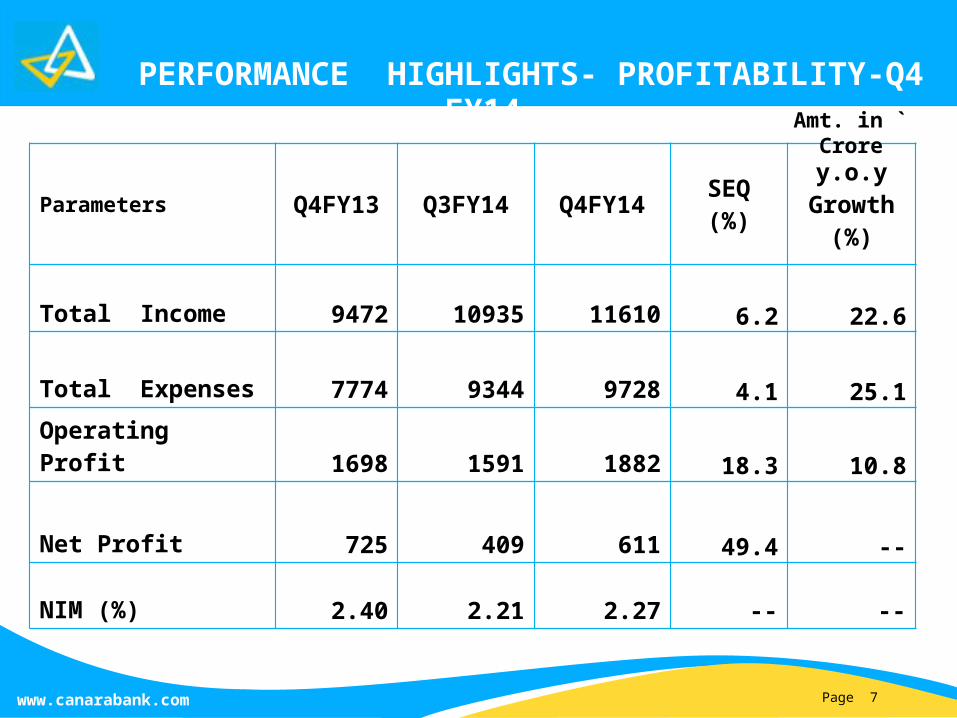
PERFORMANCE HIGHLIGHTS- PROFITABILITY-Q4 FY14
ParametersQ4FY1
3 Q3FY14 Q4FY14 SEQ(%)
y.o.yGrowth
(%)
Total Income 9472 10935 11610 6.2 22.6
Total Expenses 7774 9344 9728 4.1 25.1
Operating Profit 1698 1591 1882 18.3 10.8
Net Profit 725 409 611 49.4 --
NIM (%) 2.40 2.21 2.27 -- --
Amt. in ` Crore

Page 8www.canarabank.com
PERFORMANCE HIGHLIGHTS- PROFITABILITY- MAR’14
ParametersM ar’13
(12 months)
Dec’13(9
months)
Mar’14(12
months)
SEQ(%)
y.o.yGrowth
(%)
Total Income 37231 31871 43480 36.4 16.8
Total Expenses 31341 26957 36684 36.1 17.0Operating Profit 5890 4914 6796 38.3 15.4
Net Profit 2872 1827 2438 33.4 --
NIM (%) 2.40 2.21 2.27 -- --Business Per Employee 14.20 14.34 14.42 -- --
Amt. in ` Crore
Page 9www.canarabank.com
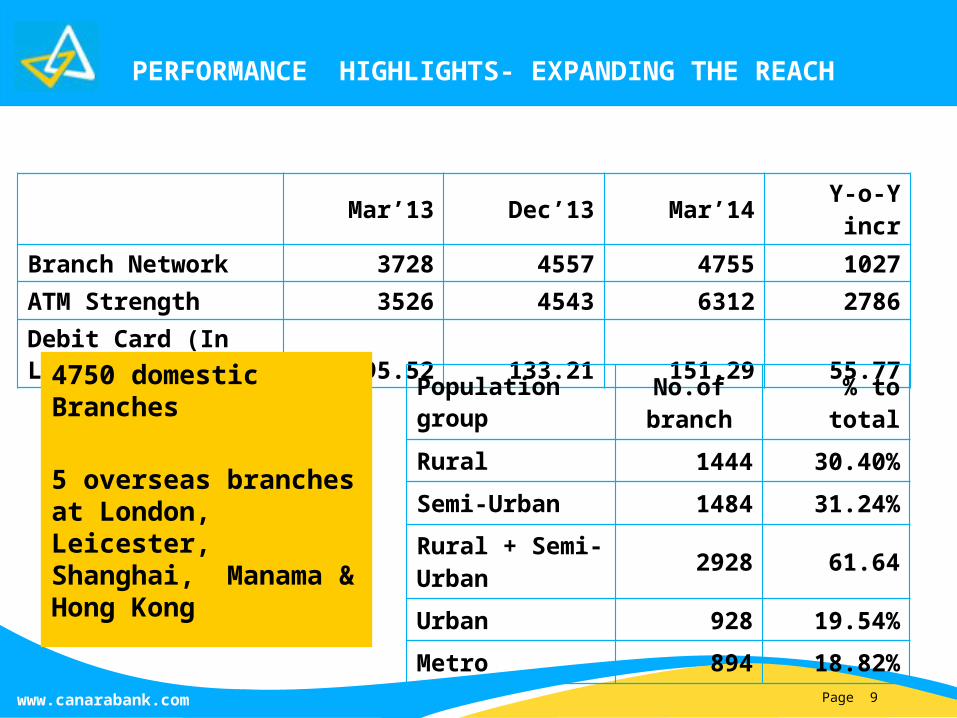
PERFORMANCE HIGHLIGHTS- EXPANDING THE REACH
Mar’13 Dec’13 Mar’14 Y-o-Y incrBranch Network 3728 4557 4755 1027ATM Strength 3526 4543 6312 2786Debit Card (In Lakh) 95.52 133.21 151.29 55.77
4750 domestic Branches
5 overseas branches at London, Leicester, Shanghai, Manama & Hong Kong
Population group
No.of branch
% to total
Rural 1444 30.40%
Semi-Urban 1484 31.24%
Rural + Semi-Urban 2928 61.64
Urban 928 19.54%
Metro 894 18.82%

Page 10www.canarabank.com
BUSINESS
SEGMENTS

Page 11www.canarabank.com
SEGMENT WISE DEPOSITS
Parameters MAR’13 JUN’13 SEP’13 DEC’13 MAR’1
4SEQ (%)
y.o.yGrowth(%)
Total Deposits35585
6 381972 391613 408924 420723 2.89 18.23
Current 14893 14374 15208 14793 17744 19.95 19.14
Saving 71168 73938 80070 79671 85536 7.36 20.19
CASA 86061 88312 95278 9446510327
9 9.33 20.01
CASA (%)Dom 25.1% 24.2% 25.6% 24.3% 25.9% 1.6 0.8
Term Deposits
269795 293659 296335 314460
317443 0.95 17.66
- PRDs + CDs71725 51253 54205 63727 64443 1.12 -10.2
% PRDs +CDs to Total Deposits
20.16 13.42 13.84 15.58 15.32 -0.26 -4.84
Amt. in ` Crore

Page 12www.canarabank.com
BROAD BASED CREDIT GROWTH Y.o.Y
Credit Segments Mar’13Y.o.Y
DEC’13Y.o.Y
Mar’14Y.o.Y
Priority Sector 17% 33% 24%
Agriculture 28% 29% 20%
MSME 6% 46% 35%
MSE 10% 50% 38%
Retail -7% 55% 45%
Housing -17% 71% 50%
Vehicle 18% 58% 62%
Other Personal Loans 13% 50% 58%

Page 13www.canarabank.com
LOANS & ADVANCES SEGMENT
Parameters MAR’13 JUN’13 SEP’13 DEC’1
3MAR’1
4SEQ(%)
y.o.yGrowth (%)
Advances (Net) 242177 249891 281104
287700
301067 4. 65 24.32
Total Priority 78998 83085 88280 93018 97762 5.10 23.75
Agriculture 40786 43292 44042 45703 48797 6.77 19.64
- Direct Agriculture
37984 40195 39995 41787 44268 5.94 16.54
- Indirect Agri 2802 3097 4047 39165 4529 15.65 61.63
Other Priority 11804 12100 12603 12848 13345 3.87 13.05
MSME 37017 37173 43464 47678 50040 4.95 35.18
MSE 26612 27873 31773
34773
36703 5.55 37.92
Retail Credit 23084 25231 30274 32847 33529 2.08 45.25
Amt. in ` Crore

Page 14www.canarabank.com
ACHIEVEMENT UNDER MANDATED TARGETS – PRIORITY SECTOR
Achieved the mandated targets in respect of
Total priority credit (42.52% against 40% norm)
Agriculture (21.22% against 18% norm)
Direct agriculture ( 19.25% against 13.5% norm)
Credit to specified minority communities (18.19% against 15% norm)
Weaker Section (12.99% against 10% norm)
M&SE (38% y.o.y growth against 20% norm)
Number of Micro Enterprises accounts (99.9% growth against 10% norm)
Mandated Targets under Priority Sector

Page 15www.canarabank.com
Performance of Retail Advances
Type of Advance
MAR’13 JUN’13 SEP’13 DEC’13 MAR’14 SEQ(
%)
y.o.yGrowth
(%)
Housing loan 13134 14406 18392 20042 19684 -1.79 49.87
Vehicle loan 1913 2092 2344 2791 3099 11.04 62.00
Other Pers Loan 3694 4317 4867 5223 5845 11.91 58.23
Education loan 4343 4416 4671 4791 4901 2.30 12.85
Grand total 230842523
13027
43284
73352
9 2.08 45.25
Amt. in ` Crore

Page 16www.canarabank.com
EXPOSURE - INFRASTRUCTURE
Parameters MAR’13
SEPT’13 DEC’13 MAR’14
% Share Total Adv
SEQ(%)
y.o.yGrowth (%)
Roads 5726 5271 6529 6980 2.30 6.91 21.90
Ports 619 597 1112 1092 0.36 -1.80 76.41
Airports 1507 1355 1380 1827 0.60 32.39 21.23
Power (Generation, Transmission & Distribution)
32076 38707 38414 38294 12.62 -0.31 19.39
Telecom 6512 6960 7190 6572 2.17 -8.60 0.92
Other Infrastructure
2086 3431 2849 2983 0.98 4.70 43.00
Total Infrastructure
48525 56322 57474 57748 19.03 0.48 19.01
Amt. in ` Crore

Page 17www.canarabank.com
Parameters
MAR’13
SEPT’13 DEC’13 MAR’1
4
% Share
Total
Adv
SEQ(%)
y.o.yGrowth
(%)
-Power Generation
14234
18754 19334 20003 6.59 3.46 40.53
-Power Transmission 1280 2171 2286 2215 0.73 -3.11 73.05-Power Distribution
16562
17782 16794 16076 5.30 -4.28 -2.93
Total Power
32076
38707 38414 38294 12.62 -0.31 19.39
Of which SEBs
21454
28317 23927 23002 7.58 -3.87 7.22
Amt. in ` Crore
EXPOSURE - POWER SECTOR & AVIATION
Exposure to Aviation
1907 1862 1833 1761 0.58
-3.90
-7.66

Page 18www.canarabank.com
EXPOSURE TO CAPITAL MARKET
Parameters MAR’13 SEPT’13 DEC’13 MAR’14 SEQ(%)
y.o.yGrowth
(%)
Outstanding 2330 2296 2312 2210 -4.41 -5.15
EXPOSURE TO NBFCs
HFCs 6925 10963 11433 8144 -28.77 17.61
Private 11102 14433 14740 12163 -17.48 9.56
Public 5398 5296 5119 5536 8.15 2.56
Total 23426 30692 31293 26163 -16.39 11.68
EXPOSURE TO COMMERCIAL REAL ESTATE
Outstanding 1618 2825 3176 3483 9.67 115.3
Amt. in ` Crore
EXPOSURE TO OTHER SECTORS

Page 19www.canarabank.com
FINANCIALS
Page 20www.canarabank.com
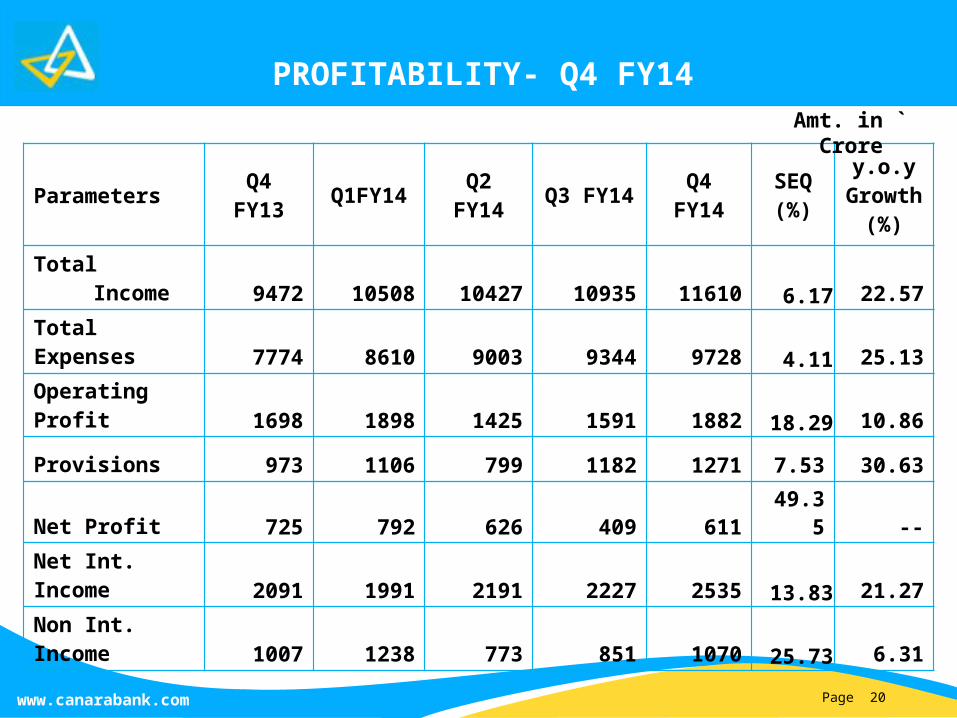
PROFITABILITY- Q4 FY14
Parameters Q4 FY13 Q1FY14 Q2
FY14Q3
FY14Q4
FY14SEQ (%)
y.o.yGrowth (%)
Total Income 9472 10508 10427 10935 11610 6.17 22.57
Total Expenses 7774 8610 9003 9344 9728 4.11 25.13Operating Profit 1698 1898 1425 1591 1882 18.29 10.86
Provisions 973 1106 799 1182 1271 7.53 30.63
Net Profit 725 792 626 409 61149.3
5 --Net Int. Income 2091 1991 2191 2227 2535 13.83 21.27Non Int. Income 1007 1238 773 851 1070 25.73 6.31
Amt. in ` Crore

Page 21www.canarabank.com
PROFITABILITY – MAR’14
Parameters Mar’13 9M FY14 Mar’14 SEQ (%)y.o.y
Growth (%)
Total Income 37231 31871 43480 36.4 16.8
Total Expenses 31341 26957 36684 36.1 17.0
Operating Profit 5890 4914 6796 38.3 15.4
Provisions 3018 3087 4358 41.2 44.4
Net Profit 2872 1827 2438 33.4 --
Net Int. Income 7879 6409 8944 39.6 13.5
Non Int. Income 3153 2863 3933 37.4 24.7
Amt. in ` Crore

Page 22www.canarabank.com
BREAK-UP : INCOME – Q4 FY14
Parameters Q4FY13 Q1
FY14Q2
FY14Q3
FY14Q4
FY14SEQ (%)
y.o.yGrowth (%)
Interest onAdvances 6073 6450 6964 7360 7683 4.39 26.52Interest onInvestments 2307 2482 2597 2575 2598 0.89 12.62Other InterestIncome 85 338 93 149 259
73.83
202.56
Total InterestIncome 8465 9270 9654 10084 10540 4.52 24.51Non - Interest Income 1007 1238 773 851 1070 25.73 6.31
Total Income 9472 10508 10427 10935 11610 6.17 22.57
Amt. in ` Crore

Page 23www.canarabank.com
BREAK-UP : INCOME – MAR’14
Parameters Mar’13 9M FY14 Mar’14 SEQ (%)
y.o.yGrowth
(%)
Interest onAdvances 24380 20774 28457 37.0 16.7
Interest onInvestments 9112 7653 10251 33.9 12.5
Other InterestIncome 586 580 839 44.7 43.3
Total InterestIncome 34078 29008 39548 36.3 16.1Non - Interest Income 3153 2863 3933 37.4 24.7
Total Income 37231 31871 43480 36.4 16.8
Amt. in ` Crore
Page 24www.canarabank.com
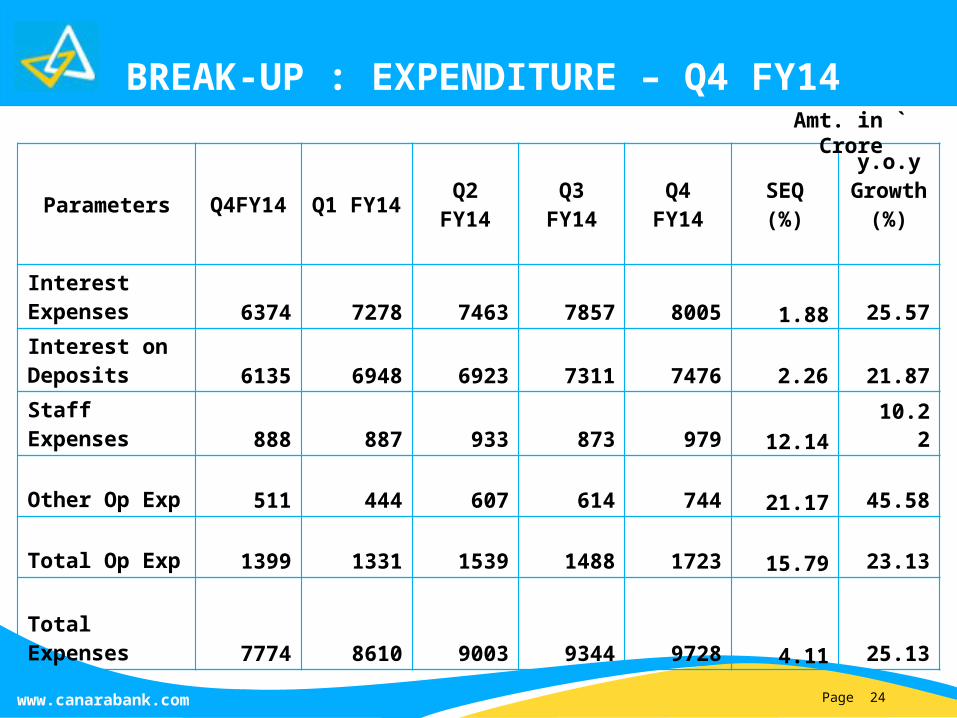
BREAK-UP : EXPENDITURE – Q4 FY14
Parameters Q4FY14
Q1 FY14
Q2 FY14
Q3 FY14
Q4 FY14
SEQ (%)
y.o.yGrowth (%)
Interest Expenses 6374 7278 7463 7857 8005 1.88 25.57
Interest onDeposits 6135 6948 6923 7311 7476 2.26 21.87
Staff Expenses 888 887 933 873 979 12.14
10.22
Other Op Exp 511 444 607 614 744 21.17 45.58
Total Op Exp 1399 1331 1539 1488 1723 15.79 23.13
Total Expenses 7774 8610 9003 9344 9728 4.11 25.13
Amt. in ` Crore
Page 25www.canarabank.com
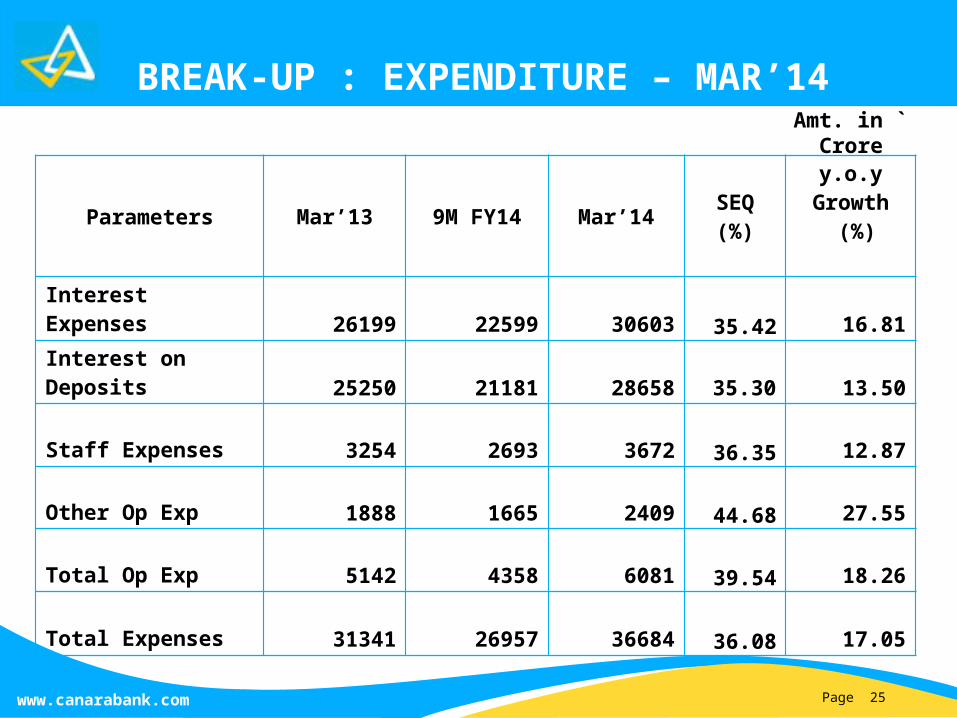
BREAK-UP : EXPENDITURE – MAR’14
Parameters Mar’13 9M FY14 Mar’14 SEQ (%)
y.o.yGrowth
(%)
Interest Expenses 26199 22599 30603 35.42 16.81
Interest onDeposits 25250 21181 28658 35.30 13.50
Staff Expenses 3254 2693 3672 36.35 12.87
Other Op Exp 1888 1665 2409 44.68 27.55
Total Op Exp 5142 4358 6081 39.54 18.26
Total Expenses 31341 26957 36684 36.08 17.05
Amt. in ` Crore

Page 26www.canarabank.com
BREAK-UP: NON-INTEREST INCOME
ParametersMar’13 9M
FY14 Mar’14y.o.y
Growth (%)
Com & Exchange 798 656 940 17.79 -Govt. Business 72 48 91 26.39 -Bancassurance 43 26 47 9.30
Profit from Exch. Transactions 464 444 670 44.40Rent – Lockers 59 65 67 13.56Dividend Income 57 51 70 22.81
Recovery in W/Off A/cs 301 314 425 41.20Service Charges & Oth. Msc Inc 798 744 1097 37.47Total (Excluding Treasury Trading Profit) 2477 2274 3269 31.97
Amt. in ` Crore
Total Non- Interest Income including Treasury Trading Profit stands at ` 3933 crore (25% y.o.y)
Page 27www.canarabank.com
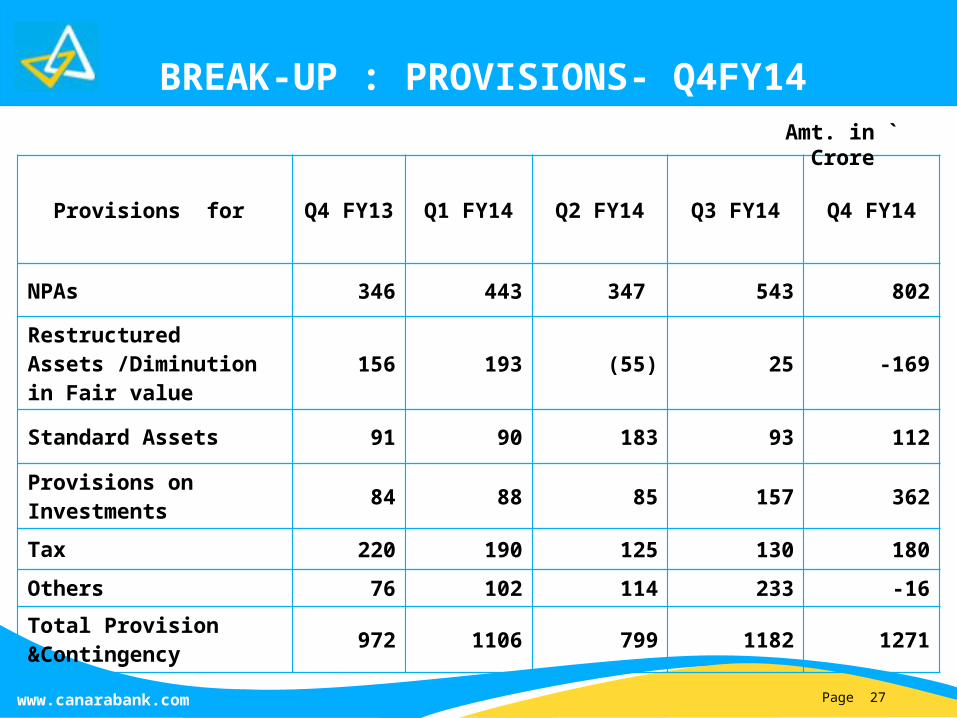
BREAK-UP : PROVISIONS- Q4FY14
Provisions for Q4 FY13 Q1 FY14 Q2 FY14 Q3 FY14 Q4 FY14
NPAs 346 443 347 543 802
Restructured Assets /Diminution in Fair value
156 193 (55) 25 -169
Standard Assets 91 90 183 93 112
Provisions onInvestments
84 88 85 157 362
Tax 220 190 125 130 180
Others 76 102 114 233 -16
Total Provision &Contingency
972 1106 799 1182 1271
Amt. in ` Crore
Page 28www.canarabank.com
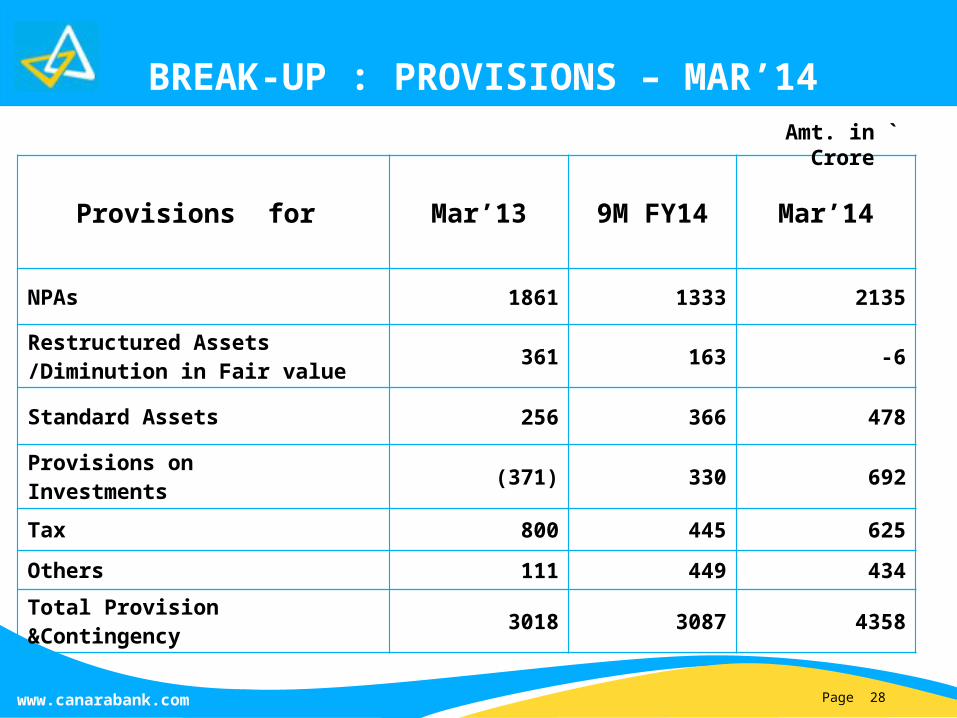
BREAK-UP : PROVISIONS – MAR’14
Provisions for Mar’13 9M FY14 Mar’14
NPAs 1861 1333 2135
Restructured Assets /Diminution in Fair value
361 163 -6
Standard Assets 256 366 478
Provisions onInvestments
(371) 330 692
Tax 800 445 625
Others 111 449 434
Total Provision &Contingency 3018 3087 4358
Amt. in ` Crore
Page 29www.canarabank.com
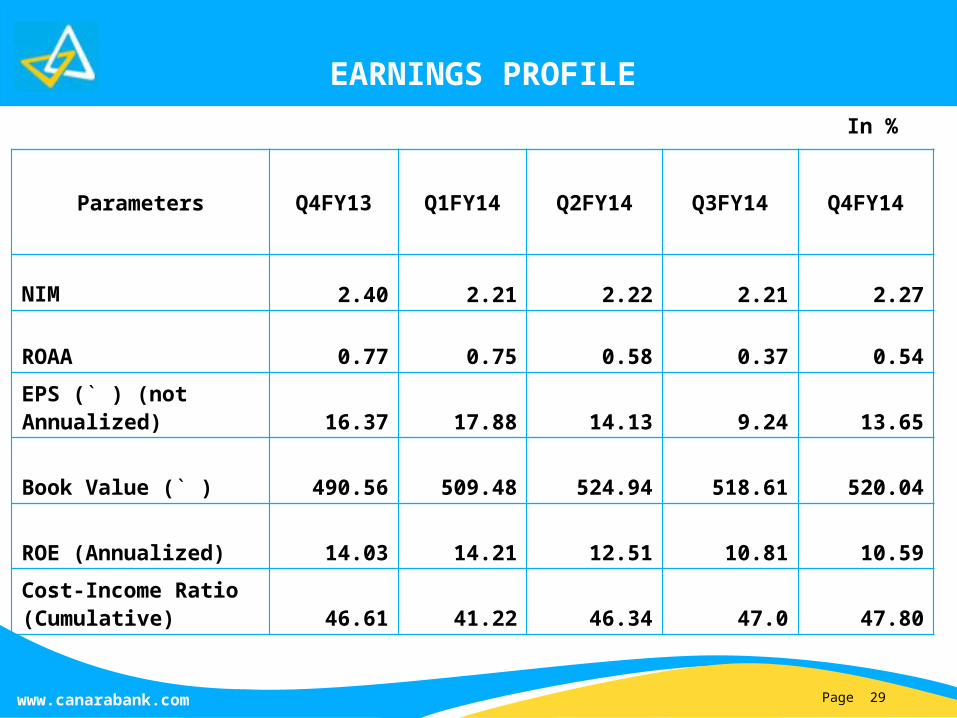
EARNINGS PROFILE
In %
Parameters Q4FY13 Q1FY14 Q2FY14 Q3FY14 Q4FY14
NIM 2.40 2.21 2.22 2.21 2.27
ROAA 0.77 0.75 0.58 0.37 0.54
EPS (` ) (not Annualized) 16.37 17.88 14.13 9.24 13.65
Book Value (` ) 490.56 509.48 524.94 518.61 520.04
ROE (Annualized) 14.03 14.21 12.51 10.81 10.59
Cost-Income Ratio (Cumulative) 46.61 41.22 46.34 47.0 47.80
Page 30www.canarabank.com
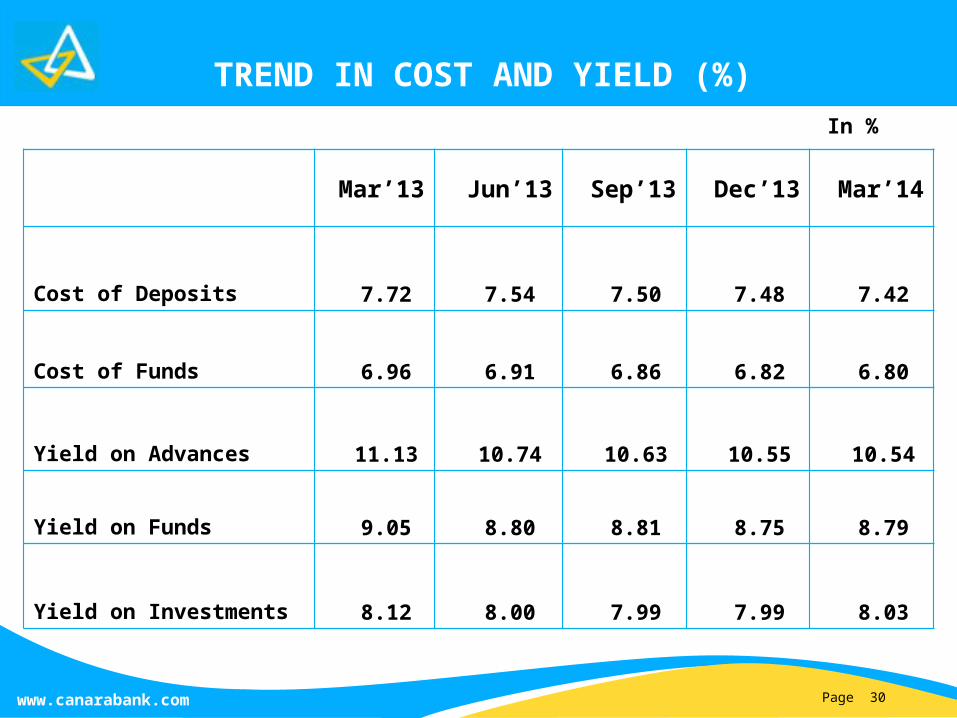
TREND IN COST AND YIELD (%)
Mar’13 Jun’13 Sep’13 Dec’13 Mar’14
Cost of Deposits 7.72 7.54 7.50 7.48 7.42
Cost of Funds 6.96 6.91 6.86 6.82 6.80
Yield on Advances 11.13 10.74 10.63 10.55 10.54
Yield on Funds 9.05 8.80 8.81 8.75 8.79
Yield on Investments 8.12 8.00 7.99 7.99 8.03
In %

Page 31www.canarabank.com
Investment classification
Parameters MAR’13% Share in Total
PortfolioDEC’13 Mar’14
% Share in Total
Portfolio
SLR 102003 84% 112003 108095 85
Non SLR 18700 15% 18279 18758 15Total (Domestic)
120703 99.6%
130282 126853 100
Held For Trading 741 1% 720 157 0.1Available For Sale 47105 39% 38704 40575 32Held To Maturity 72699 60% 90105 85242 67
M.DURATION4.73
yrs --4.65
yrs4.63
yrs --
Total (Global) 121133 --13035
9 126828 --
Amt. in ` Crore

Page 32www.canarabank.com
ASSET
QUALITY

Page 33www.canarabank.com
ASSET QUALITY
Mar’13 June’13 Sep’13 Dec’13 Mar’1
4
Gross NPA 6260 7329 7475 8074 7570
Gross NPA Ratio (%) 2.57 2.91 2.64 2.79 2.49
Net NPA 5278 6209 6459 6870 5965
Net NPA Ratio (%) 2.18 2.48 2.30 2.39 1.98
Cash Recovery (cumulative) 4006 888 1923 3135 5494
Cash Recovery of ` 5494 crore during the year
Amt. in ` Crore

Page 34www.canarabank.com
GROSS NPA MOVEMENT - Yearly (` in crore)
PARTICULARS31.03.201
331.12.2013 31.03.2014
Opening Gross NPA 4032 6260 6260Additions 5819 6309 8444Sub Total 9851 12569 14704Less: Reduction (a+b+c+d)) 3591 4495 7134a) Write Off (Including Addn Prudential Write-off) 1535 1188 1591b) Upgradation 852 2061 2853c) Recovery from Book Liability 1204 1246 1980
d) Recovery from sale of Assets to ARCs - 710Gross NPA - Closing Balance 6260 8074 7570Gross Advances 243936 289833 303441Gross NPA % 2.57 2.79 2.49
Net NPA 5278 6870 5965Net NPA % 2.18 2.39 1.98Total Cash Recovery (incl.rec. in Wr.-off a/cs, recovery in Current Year slippage & U/A interest) 4006 3135 5494
Recovery under Loss Assets ( Loss asset as at 31.03.2013 - Rs.4176 Cr.) 309 245
754(18 %)
Recovery in Technically written off a/cs (Tech. written off amount as at 31.03.2013 –Rs.7396 Cr.) 334 474
1247(16.8%)

Page 35www.canarabank.com
GROSS NPA MOVEMENT- Quarterly
Parameters MAR’13 JUN’13 SEPT’13 DEC’13 MAR’14
Gross NPAs: Opening Balance 6090 6260 7329 7475 8074
Additions: Fresh Slippages 1086 2688 1520 2100 2135
Sub Total 7176 8948 8849 95751020
9
Less: Reduction (a+b+c+d) 916 1620 1374 1501 2639a. Recovery for Movement (excluding recovery in Written-off a/cs, recovery in Current Year slippage & Unapplied interest) 459 339 505 406 1451
b. Upgradation 73 1020 386 655 792
c. ECGC Settled/Int Sus. (-)12 - (-)5 1 -7d. Write off (Including Additional Prudential Write-off) 396 260 488 439 403
Gross NPA-Closing Balance 6260 7329 7475 8074 7570
Amt. in ` Crore
Page 36www.canarabank.com
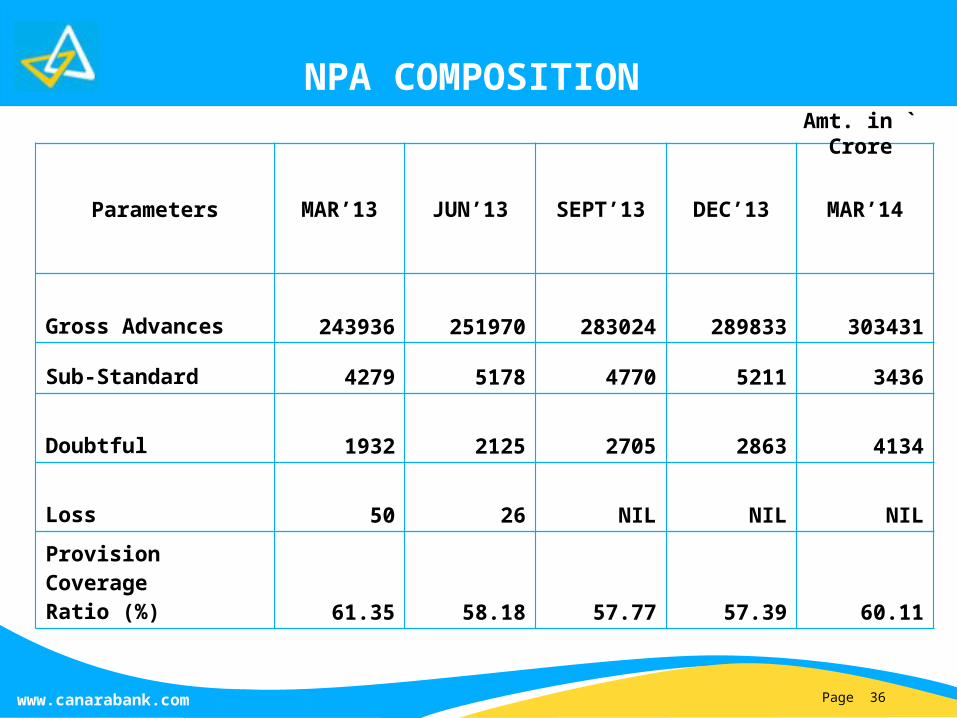
NPA COMPOSITION
Parameters MAR’13 JUN’13 SEPT’13 DEC’13 MAR’14
Gross Advances 243936 251970 283024 289833 303431
Sub-Standard 4279 5178 4770 5211 3436
Doubtful 1932 2125 2705 2863 4134
Loss 50 26 NIL NIL NIL
Provision CoverageRatio (%) 61.35 58.18 57.77 57.39 60.11
Amt. in ` Crore

Page 37www.canarabank.com
SECTORQ4
FY13
Q1
FY14
Q2
FY14
Q3
FY14
Q4
FY14
% to total
Slippages
Micro & Small Ent. 283 278 278 282 38 1.78
Agriculture 183 265 196 243 719 33.69
Other Priority Sector 104 184 116 125 74 3.47
Total Priority Sector 570 727 590 650 831 38.94
Medium Industries 66 48 58 91 73 3.42
Large Industries 185 796 700 544 920 43.11
Other Non-Priority 199 1010 152 817 221 10.36
Total Non-Priority 450 1855 910 1452 1214 56.89
Total (Domestic) 1019 2582 1500 2101 2046 95.88
Overseas 60 106 20 - 88 4.12
Total (Global) 1079 2688 1520 2101 2134 100.00
SECTOR-WISE NPA SLIPPAGES
Amt. in ` Crore
Page 38www.canarabank.com
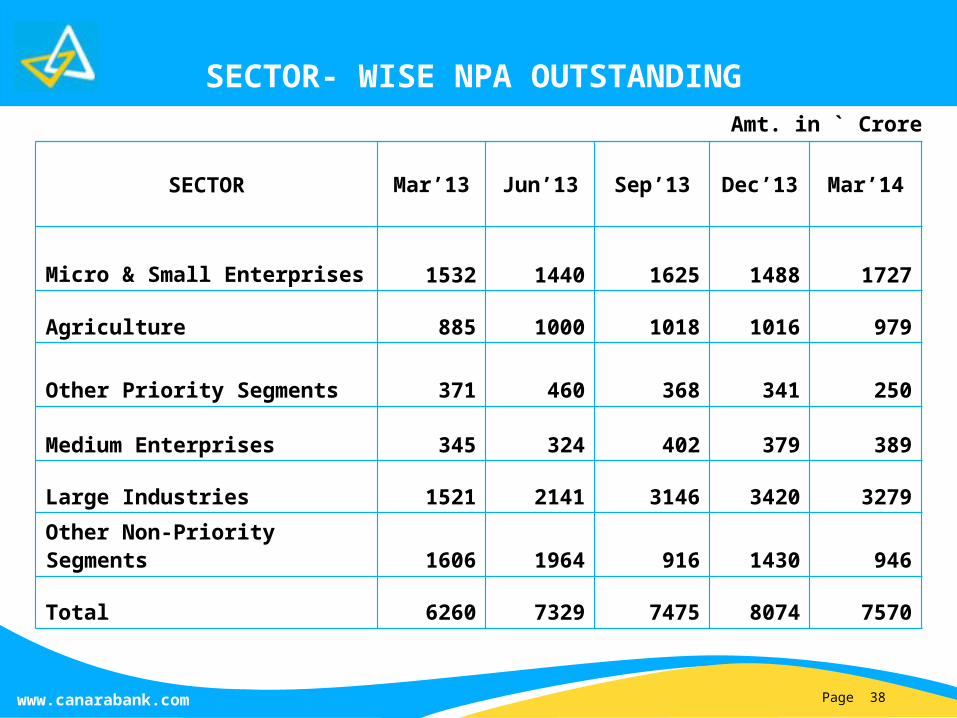
SECTOR- WISE NPA OUTSTANDING
SECTOR Mar’13 Jun’13 Sep’13 Dec’13 Mar’14
Micro & Small Enterprises 1532 1440 1625148
8 1727
Agriculture 885 1000 1018101
6 979
Other Priority Segments 371 460 368 341 250
Medium Enterprises 345 324 402 379 389
Large Industries 1521 2141 3146342
0 3279
Other Non-Priority Segments 1606 1964 916
1430 946
Total 6260 7329 7475807
4 7570
Amt. in ` Crore
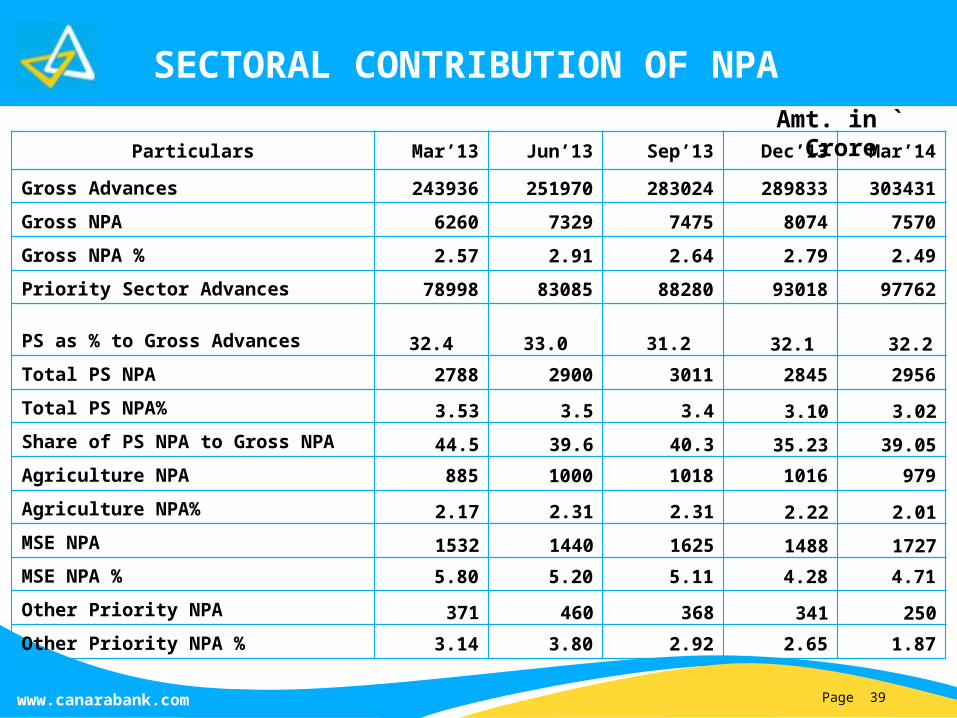
Page 39www.canarabank.com
Particulars Mar’13 Jun’13 Sep’13 Dec’13 Mar’14
Gross Advances24393
625197
0 28302428983
3 303431
Gross NPA 6260 7329 7475 8074 7570
Gross NPA % 2.57 2.91 2.64 2.79 2.49
Priority Sector Advances 78998 83085 88280 93018 97762
PS as % to Gross Advances 32.4 33.0
31.2 32.1
32.2
Total PS NPA 2788 2900 3011 2845 2956
Total PS NPA% 3.53 3.5 3.4 3.10 3.02
Share of PS NPA to Gross NPA 44.5 39.6 40.3 35.23 39.05
Agriculture NPA 885 1000 1018 1016 979
Agriculture NPA% 2.17 2.31 2.31 2.22 2.01
MSE NPA 1532 1440 1625 1488 1727
MSE NPA % 5.80 5.20 5.11 4.28 4.71
Other Priority NPA 371 460 368 341 250
Other Priority NPA % 3.14 3.80 2.92 2.65 1.87
SECTORAL CONTRIBUTION OF NPA Amt. in ` Crore

Page 40www.canarabank.com
RESTRUCTURED ASSETSAmt. in `
Crore
Restructured PA Restructured NPA
Total Restructured
A/cs
No of A/Cs Amount
No of A/Cs Amount
No of A/Cs Amount
A/c Restructured position upto 31.03.2013 13081 15901 7099 2212 20180 18113A/c Restructured in Q1 2013-14 125 1365 9 318 134 1683A/c Restructured in Q2 2013-14 3416 973 59 26 3475 999A/c Restructured in Q3 2013-14 3032 3402 54 52 3086 3454
A/c Restructured in Q4 2013-14 3323 1307 47 125 3370 1432Change in Balance and / or closure of acct during FY 13-14 -3117 -2700 -1038 224 -4155 -2476Total Restructued accounts as on 31.03.2014 19860 20248 6230 2957 26090 23205
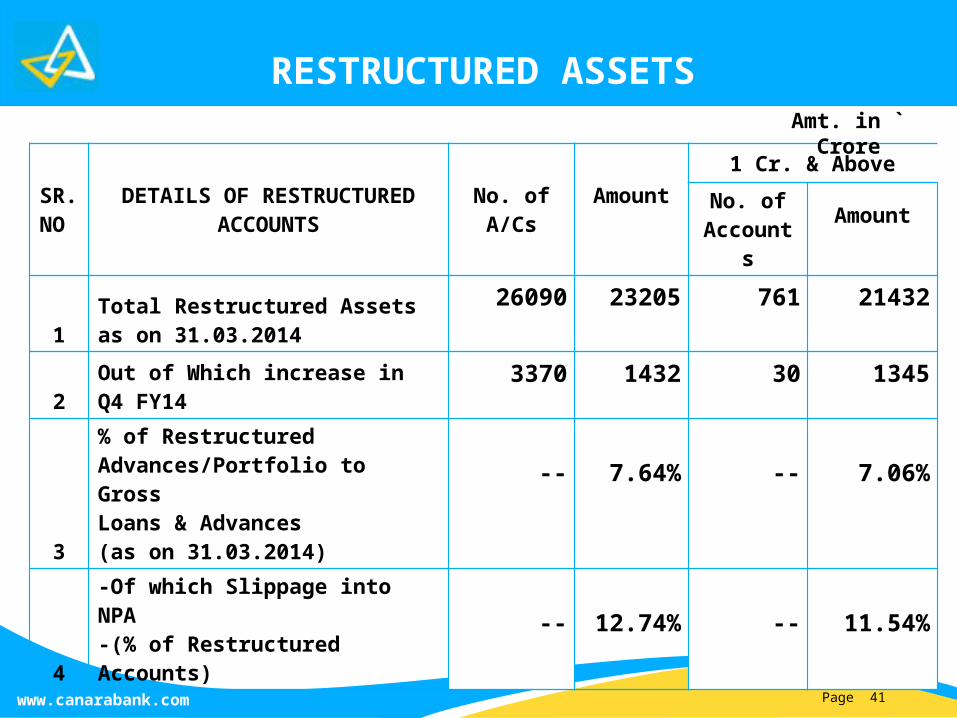
Page 41www.canarabank.com
RESTRUCTURED ASSETS
SR.NO
DETAILS OF RESTRUCTUREDACCOUNTS
No. ofA/Cs
Amount1 Cr. & Above
No. ofAccount
s
Amount
1Total Restructured Assets as on 31.03.2014
26090 23205 761 21432
2Out of Which increase in Q4 FY14
3370 1432 30 1345
3
% of RestructuredAdvances/Portfolio to GrossLoans & Advances (as on 31.03.2014)
-- 7.64% -- 7.06%
4
-Of which Slippage into NPA-(% of Restructured Accounts)
-- 12.74%
-- 11.54%
Amt. in ` Crore

Page 42www.canarabank.com
RESTRUCTURED ASSETS UNDER CDR
POSITION AS ON A/C Amount
MARCH-2013 78 9104
JUNE- 2013 84 12314
SEPTEMBER-2013 91 12932
DECECEMBER-2013 94 12185
MARCH-2014 96 10446
Amt. in ` Crore
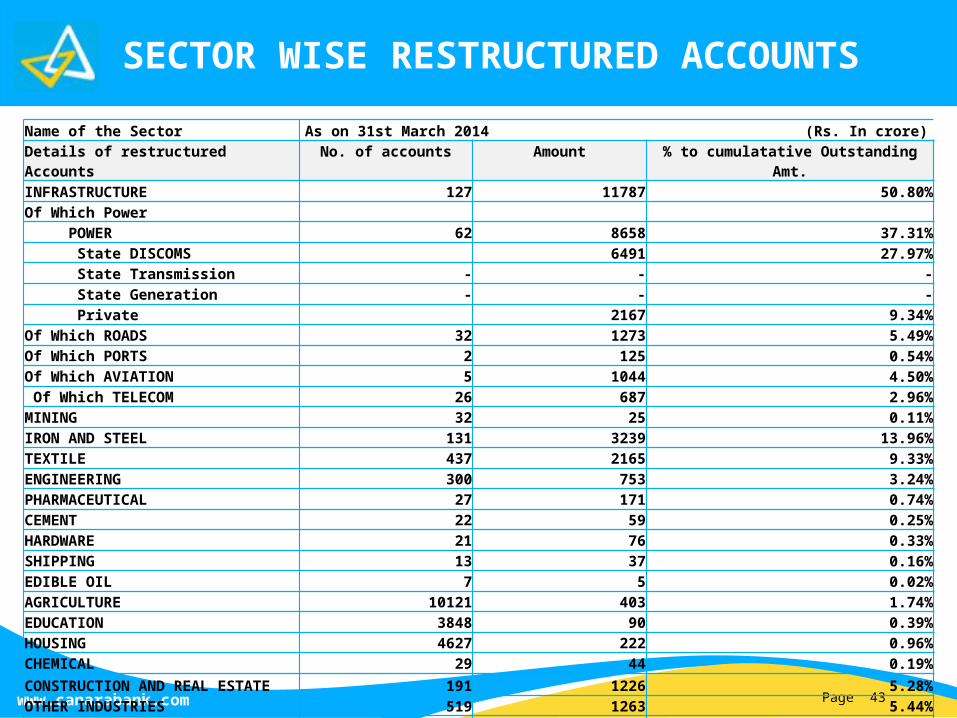
Page 43www.canarabank.com
SECTOR WISE RESTRUCTURED ACCOUNTS
Name of the Sector As on 31st March 2014 (Rs. In crore)Details of restructured Accounts
No. of accounts Amount % to cumulatative Outstanding Amt.
INFRASTRUCTURE 127 11787 50.80%Of Which Power POWER 62 8658 37.31% State DISCOMS 6491 27.97% State Transmission - - - State Generation - - - Private 2167 9.34%Of Which ROADS 32 1273 5.49%Of Which PORTS 2 125 0.54%Of Which AVIATION 5 1044 4.50% Of Which TELECOM 26 687 2.96%MINING 32 25 0.11%IRON AND STEEL 131 3239 13.96%TEXTILE 437 2165 9.33%ENGINEERING 300 753 3.24%PHARMACEUTICAL 27 171 0.74%CEMENT 22 59 0.25%HARDWARE 21 76 0.33%SHIPPING 13 37 0.16%EDIBLE OIL 7 5 0.02%AGRICULTURE 10121 403 1.74%EDUCATION 3848 90 0.39%HOUSING 4627 222 0.96%CHEMICAL 29 44 0.19%CONSTRUCTION AND REAL ESTATE 191 1226 5.28%OTHER INDUSTRIES 519 1263 5.44%OTHER SERVICES 5638 1640 7.07%TOTAL 26090 23205 100.00%

Page 44www.canarabank.com
AMOUNT RESTRUCTURED DURING Q4 FY14
No. of Accounts Amount
Agriculture
1732 24
MSME
557 78
Housing
791 21
Large Advances
48 752
Others
242 557
Total 3370 1432
Amt. in ` Crore

Page 45www.canarabank.com
SECTOR WISE RESTRUCTURED ADVANCES OUTSTANDING
AS AT MARCH 2014
No. of Accounts Amount
Agriculture10121 403
MSME5661 617
Housing8475 312
Large Advances552 12827
Others1277 9046
Total 26086 23205
Amt. in ` Crore

Page 46www.canarabank.com
CAPITAL ADEQUACY – NEW BASEL III NORMS
Capital Adequacy
Ratio
CRAR of 10.63% at MAR 2014 Vs. 9% norm
CET ratio at 7.41% vs. 5% norm
Tier I ratio at 7.68% vs. 6.5% norm
Tier II ratio at 2.95%
Govt. holding at 69%
Paid-up Capital at ` 461.26 crore
Sufficient headroom available for raising further capital.Plans to raise `1500 crore equity capital by way of QIP or
preferential allotment

Page 47www.canarabank.com
CAPITAL ADEQUACY – BASEL III
BASEL II BASEL III
Particulars Mar'13 JUN’13 SEPT’13 DEC-13 Mar'14
Risk-weighted Assets
243348 260699 273066 302533 312226
Tier I Capital 23776 23260 23273 22609 23991
Tier I Ratio%
9.77%
CET: 8.51%
AT I: 0.41%
Tier I: 8.92%
CET: 8.13%
AT I: 0.39%
Tier I:8.52%
CET: 7.13%
AT I: 0.35%
Tier I:7.48%
CET: 7.41%
AT I: 0.27%
Tier I:7.68%
Tier II Capital 6388 5762 5724 7097 9205Tier II Ratio% 2.63% 2.21 2.10 2.35 2.95%Total Capital 30164 29022 28997 29706 33196
CRAR% 12.40% 11.13% 10.62% 9.83% 10.63%
Amt. in ` Crore
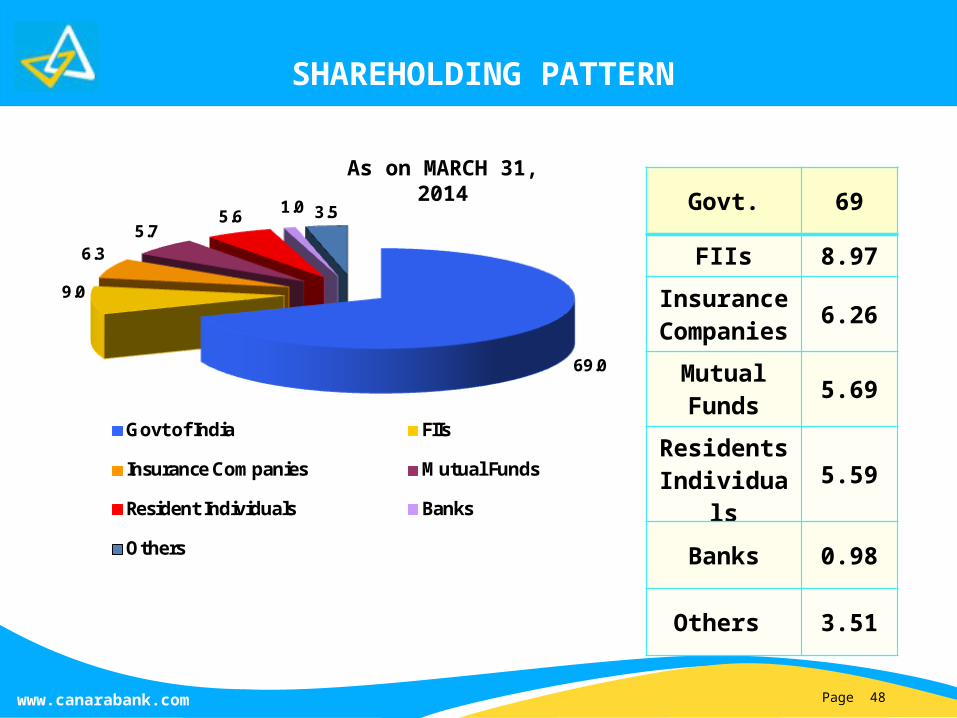
Page 48www.canarabank.com
SHAREHOLDING PATTERN
69.0
9.0
6.35.7
5.6 1.0 3.5
Govt of India FIIs
Insurance Companies Mutual Funds
Resident Individuals Banks
Others
As on MARCH 31, 2014 Govt. 69
FIIs 8.97
Insurance Companie
s6.26
Mutual Funds 5.69
Residents Individual
s5.59
Banks 0.98
Others 3.51

Page 49www.canarabank.com
FINANCIAL INCLUSION
Holistic Approac
h to Financi
al Inclusio
n
• During the year, the Bank opened 257 branches in financial inclusion/ unbanked villages taking the total tally of FI branches to 532. Apart from branches, the Bank also has 514 Ultra Small Branches and engaged 2402 Business Correspondent Agents for financial inclusion activities.
• Under more than 2000 population category, the Bank covered all the allotted 1624 villages in 23 States.
• Basic Savings Bank Deposits (BSBD) accounts increased to 85.46 lakh, with outstanding deposit balance of `1647 crore.
• In built OD facility provided to 3.22 lakh beneficiaries, amounting to `114 crore. Provided life insurance coverage to 61247 group/BSBD account holders.
• Exposure under Self-Help Groups (SHGs) increased to ` 1902 crore under 92117 SHG accounts.
• Exposure under General Credit Cards increased to ` 832 crore under 3.89 lakh accounts.
Page 50www.canarabank.com
• 60 Financial Literacy Centres have been set up to provide financial education to the poor and the common man.
• 20 Micro Finance Branches in urban areas are operational to cater to the needs of the urban poor. These branches have garnered a business of ` 344 crore.
• 1500 Farmers Clubs opened by the Bank.
• Participating in the Direct Benefit Transfer system in 48 districts in first phase and opened 69232 accounts of DBT beneficiaries & Aadhaar seeded and mapped in 58931 accounts.
• Participated in DBT implementation in 78 districts (Phase II) and opened 60370 accounts DBT beneficiaries and Aadhaar seeded and mapped in 44419 accounts.
• Under DBTLPG 40.38 lakh transactions done with a total credit received ` 250 crore.
• Aadhaar seeding increased from 5.60 lakh as on 31.03.2013 to 39.92 lakh as on 31.03.2014.
FINANCIAL INCLUSION
Holistic Approac
h to Financi
al Inclusio
n

Page 51www.canarabank.com
NEW PRODUCTS
Loans against Property, Home Loan Plus, Housing Loan to High Networth Individuals, Special Housing Loan Scheme to NRIs and Housing loans to agriculturalists launched.
CANARA MSE PRAGATI, CANARA MSE UNNATI, CANARA MSE SATKAR and FLAVOUR were launched for financing Micro and Small Enterprises with attractive lending terms.
Vidya Turant – An online instant loan sanction facility to students and Vidya Sahay Scheme-bridge loan Scheme launched.
Canara SB Gen-Y, Canara Jeevandhara, Canara Savings Defence Product, Canara Power Plus, Canara Privilege, Canara Payroll Package Scheme, Canara Dhanvarsha RD–Flex launched under deposit products.
New Products/Schemes

Page 52www.canarabank.com
IMPORTANT CUSTOMER-FRIENDLY TECHNOLOGY INITIATIVES
Canara Bank RuPay Debit Card, Canara Club Card –Debit, Canara Secured Credit Card, Canara Elite Debit Card and EMV Chip Cards under debit and credit cards launched.
Canara e-infobook–an electronic passbook in English, Hindi and 4 Regional Languages –Kannada, Telugu, Tamil and Malayalam launched on mobile platforms-Android, Windows8 & iOS.
Missed call to 092892 92892 to know account balance for domestic customers and 9192892 92892 for NRI customers and missed call to 092891 92891 to know last 3 transactions.
Launched e-KYC service to reduce risk of identity fraud, documentary forgery and paperless KYC verification.
Net Banking online User Creation and Login Password by Retail Customers.
New Products/Schemes

Page 53www.canarabank.com
Online Savings Bank and PPF account opening launched.
e-Hundi Collection through IMPS facility of NPCI and Institutional Fee Payment through ATM.
Acceptance of donations through ATM, Net Banking and Mobile Banking for Religious & Philanthropic Trusts/Institutions.
Enlarged Online payment facility through Aggregators for 17 Institutions.
Implemented New Generation RTGS and continuous release of NEFT messages as per the directives of RBI.
New Products/Schemes
IMPORTANT CUSTOMER-FRIENDLY TECHNOLOGY INITIATIVES

Page 54www.canarabank.com
EXPANDED CLIENTELE BASE
5.5 Crore
Strong Cliente
le Base
Mar’13 DEC’13 Mar’14 Y-o-Y
Increase
% Y-o-Y
Growth
Clientele Base 470 539 555 85 18.09
No. of Deposit A/cs 417 476 489 72 17.26
No. of Borrowal A/cs 53 63 66 13 24.53
85 lakhs Clientele added Y-o-Y
(In Lakhs)

Page 55www.canarabank.com
MAJOR EVENTS
Celebrating 108th Founder’s Day on 19th Nov 2013 by dedicating 108 branches and 108 ATMs to the nation, inaugurated by Hon’ble Chief Minister of Karnataka, Shri Siddaramaiah in the presence of Shri K.H. Muniyappa, Hon'ble Union Minister of State (MSME-Independent Charge)

Page 56www.canarabank.com
MAJOR AWARDS/ACCOLADES IN FY14Golden Peacock Award for Excellence in Corporate Governance 2013.
Golden Peacock Award for excellence in CSR 2013.
‘SKOCH AWARD’ under Corporate Social Responsibility.
C&MD was conferred Mahatma Gandhi Pravasi Gold Samman Award during the Global Achievers’ Conclave organized by NRI Welfare Society of India at House of Lords, London.
‘Jury Award for New Initiatives under MSME’ instituted by Chamber of Indian MSME under Banking Excellence Awards 2013.
Best Bank Award for implementation of Rural Self Employment Training Institutes by the Ministry of Rural Development, Govt. of India.

Page 57www.canarabank.com
MAJOR AWARDS/ACCOLADES IN FY14
Life Time Achievement Awards, Global HR Excellence Awards (Award for Best Strategy in Line with Business) and 8th Employer Branding Awards 2014 (Award for Excellence in Training) instituted by World HRD Congress during February 2014.
Global CSR Excellence and Leadership Awards 2014 from CSR World Congress.
Best Home Loan Provider Award from Outlook Money for 2013.
“Finger Print based Biometric Authorization for CBS” declared as winner for secure IT 2014 award.
‘Corporate Collateral Awards’ under various categories by Public Relations Council of India.

Page 58www.canarabank.com
GOALS – MAR’15
• Aims to reach an aggregate business figure of ` 8.5 lakh crore, with a deposit growth of 16-17% and advances growth of 19-20% as at March 2015.
• Plans to take the number of branches from 4755 to 6000 and number of ATMs from 6312 to 10,000 by Mar’2015.
• Opening a branch at Johannesburg (South Africa) in May’14 and plans to open New York (USA) branch by June’14 and 8 other international centres by March 2015, such as, DIFC (Dubai), Qatar Financial Centre (Qatar), Frankfurt (Germany), Sao Paulo (Brazil), Dar-es-Salaam (Tanzania), Tokyo (Japan), Abuja (Nigeria) and Jeddah (Saudi Arabia).
• The Bank has identified 11 another centres, such as, Kingsbury, East Ham & Birmingham (U.K), Mexico City (Mexico), Istanbul (Turkey), Jakarta (Indonesia) Kigili (Rwanda), Singapore, Auckland (New Zealand), Sydney (Australia), Ontario (Canada) for opening in the medium term.
PLANS
Page 59www.canarabank.com
GOALS – MAR’15
• Thrust on CASA, NPA and Recovery, Fee Income, Credit–Priority, SME and Retail to continue.
• Technology and business process reengineering initiatives.
• Project ‘Shikhar’ aimed at rejuvenating the Bank by focusing on several themes like energizing branches and customer service, increasing sales from branches, growing a robust asset base and revamping the operating model is in progress. Global Management Consulting firm viz., M/s Boston Consulting Group (India) Private Limited (BCG) is assisting the Bank in this transformation journey.
• M/s KPMG Advisory Services Ltd appointed for comprehensive assessment and to draw roadmap for the Bank’s subsidiaries/ Associates.
• Aiming at Gross NPA ratio approx. 2% and Net NPA ratio approx. 1 -1.25%.
• To improve NIM to 2.50%
PLANS

Page 60www.canarabank.com