Page 1 of 36 - thoracic.org · Respiratory Effects of Indoor Heat and the Interaction with Air...
36
Respiratory Effects of Indoor Heat and the Interaction with Air Pollution in COPD Meredith C McCormack 1,2 , Andrew J Belli 1 , Darryn Waugh 3 , Elizabeth C Matsui 4 , Roger D Peng 5 , D’Ann LWilliams 2 ,Laura Paulin 1 , Anik Saha 1 , Charles M Aloe 4, Gregory B Diette 1,2 , Patrick N Breysse 6 , Nadia N Hansel 1,2 1 Johns Hopkins University School of Medicine, Department of Medicine, Division of Pulmonary and Critical Care, Baltimore, MD; 2 Johns Hopkins Bloomberg School of Public Health, Department of Environmental Health Sciences, Baltimore, MD; 3 Johns Hopkins University, Department of Earth and Planetary Sciences, Baltimore, MD; 4 Johns Hopkins University School of Medicine, Department of Pediatrics, Division of Allergy and Immunology, Baltimore, MD; 5 Johns Hopkins Bloomberg School of Public Health, Department of Biostatistics, Baltimore, MD; 6 Work conducted while affiliated with the Department of Environmental Health Sciences, Johns Hopkins University, Bloomberg School of Public Health, Baltimore, MD, USA; currently employed by the Centers for Disease Control and Prevention. Patrick Breysse is serving in his personal capacity. The opinions expressed in this article are the author’s own and do not reflect the views of the Centers for Disease Control, the Department of Health and Human Services and the US government Corresponding Author: Meredith C. McCormack, MD MHS Associate Professor of Medicine Pulmonary and Critical Care Medicine Johns Hopkins University 1830 East Monument Street, 5th Floor Baltimore, MD 21205 Tel: (410) 502-2806 Fax: (410) 955-0036 [email protected] Author Contributions: MCM, GBD, PNB, ECM, NNH provided substantial contributions to conception and design, acquisition of data, and analysis and interpretation of data. AJB, CMA, ECM, LP, DW, AS, RDP contributed to data analysis and interpretation of data. DLW contributed to data acquisition. All authors contributed to revising the manuscript critically for important intellectual content and provided final approval of the version to be published. Sources of Support: Funding provided by the National Institutes of Health-NIEHS (R21ES024021, R21ES015781, R21ES025840, R01 ES022607, R01 ES023500), NIH-NIAID (K24AI114769), and NIH-NHLBI (R01 ES023500), NIEHS/Environmental Protection Agency (P50ES015903/RD83213901; P01ES018176/ RD83451001), NIH-NIMHD (P50 MD010431/RD83615201) Running Title: Indoor heat and air pollution in COPD Descriptor: 6.2 Indoor Air Key Words: COPD, particulate matter, nitrogen dioxide, climate change, heat Word Count: 2997 Page 1 of 36
Transcript of Page 1 of 36 - thoracic.org · Respiratory Effects of Indoor Heat and the Interaction with Air...

Respiratory Effects of Indoor Heat and the Interaction with Air Pollution in COPD
Meredith C McCormack1,2
, Andrew J Belli1, Darryn Waugh
3, Elizabeth C Matsui
4, Roger D Peng
5,
D’Ann LWilliams2,Laura Paulin
1, Anik Saha
1, Charles M Aloe
4, Gregory B Diette
1,2, Patrick N
Breysse6, Nadia N Hansel
1,2
1Johns Hopkins University School of Medicine, Department of Medicine, Division of Pulmonary
and Critical Care, Baltimore, MD; 2Johns Hopkins Bloomberg School of Public Health,
Department of Environmental Health Sciences, Baltimore, MD; 3 Johns Hopkins University,
Department of Earth and Planetary Sciences, Baltimore, MD; 4Johns Hopkins University School
of Medicine, Department of Pediatrics, Division of Allergy and Immunology, Baltimore, MD; 5Johns Hopkins Bloomberg School of Public Health, Department of Biostatistics, Baltimore, MD;
6Work conducted while affiliated with the Department of Environmental Health Sciences, Johns
Hopkins University, Bloomberg School of Public Health, Baltimore, MD, USA; currently
employed by the Centers for Disease Control and Prevention. Patrick Breysse is serving in his
personal capacity. The opinions expressed in this article are the author’s own and do not
reflect the views of the Centers for Disease Control, the Department of Health and Human
Services and the US government
Corresponding Author:
Meredith C. McCormack, MD MHS
Associate Professor of Medicine
Pulmonary and Critical Care Medicine
Johns Hopkins University
1830 East Monument Street, 5th Floor
Baltimore, MD 21205
Tel: (410) 502-2806 Fax: (410) 955-0036
Author Contributions: MCM, GBD, PNB, ECM, NNH provided substantial contributions to
conception and design, acquisition of data, and analysis and interpretation of data. AJB, CMA,
ECM, LP, DW, AS, RDP contributed to data analysis and interpretation of data. DLW contributed
to data acquisition. All authors contributed to revising the manuscript critically for important
intellectual content and provided final approval of the version to be published.
Sources of Support: Funding provided by the National Institutes of Health-NIEHS
(R21ES024021, R21ES015781, R21ES025840, R01 ES022607, R01 ES023500), NIH-NIAID
(K24AI114769), and NIH-NHLBI (R01 ES023500), NIEHS/Environmental Protection Agency
(P50ES015903/RD83213901; P01ES018176/ RD83451001), NIH-NIMHD (P50
MD010431/RD83615201)
Running Title: Indoor heat and air pollution in COPD
Descriptor: 6.2 Indoor Air
Key Words: COPD, particulate matter, nitrogen dioxide, climate change, heat
Word Count: 2997
Page 1 of 36

Abstract:
Rationale: There is limited evidence of the effect of exposure to heat on COPD morbidity and
the interactive effect between indoor heat and air pollution has not been established.
Objectives: To determine the effect of indoor and outdoor heat exposure on COPD morbidity
and to determine whether air pollution concentrations modify the effect of temperature.
Methods: Sixty-nine participants with COPD were enrolled in a longitudinal cohort study and
data from the 601 participant days that occurred during the warm weather season were
included in the analysis. Participants completed home environmental monitoring with
measurement of temperature, relative humidity, and indoor air pollutants and simultaneous
daily assessment of respiratory health with questionnaires and portable spirometry.
Measurements and Main Results: Participants had moderate to severe COPD and spent the
majority of their time indoors. Increases in maximum indoor temperature were associated with
worsening of daily Breathlessness, Cough, and Sputum Scores (BCSS) and increases in rescue
inhaler use. The effect was detected on the same day and lags of 1 and 2 days. The detrimental
effect of temperature on these outcomes increased with higher concentrations of indoor fine
particulate matter and nitrogen dioxide (p<0.05 for interaction terms). On days that
participants went outdoors, increases in maximum daily outdoor temperature were associated
with increases in BCSS scores after adjusting for outdoor pollution concentrations.
Conclusions: For patients with COPD that spend the majority of their time indoors, indoor heat
exposure during warmer months represents a modifiable environmental exposure that may
contribute to respiratory morbidity. In the context of climate change, adaptive strategies that
Page 2 of 36

include optimization of indoor environmental conditions are needed to protect this high risk
group from adverse health effects of heat.
Abstract Word Count: 277
Page 3 of 36

Understanding health effects of climate change has been identified as a research priority by the
American Thoracic Society and other leading health organizations (1-7). The anticipated
increases in temperature are one aspect of climate change that has been associated with
adverse health consequences. Global average temperatures are projected to increases by 1.4-
5.8% by the end of the century and heat waves are projected to be more frequent and intense
and longer lasting.(8) It is critical to understand health implications of heat exposure to protect
those at greatest risk.(9)
Previous population level studies have demonstrated that heat waves are associated
with increases in mortality (10, 11) and that certain populations, including those with
underlying respiratory and cardiac disease, are likely at increased risk (12, 13). Studies
investigating impact of heat on morbidity using hospitalization and emergency visit records
have also identified high risk subgroups.(14-17) To date, disease-specific indicators of
morbidity have not been assessed and studies have rarely used individual-level exposure
assessment(18). Very few studies have investigated the effect of indoor temperature on
respiratory health and the interactive effect between indoor temperature and indoor air
pollution is unknown. It is important to understand the effects of the indoor environment as
individuals spend the majority of their time indoors and this is projected to increase in the
context of climate change (8, 19). Further, there are actions that can reduce indoor heat
exposure, such as air conditioning, cooling centers, and energy efficient building designs, and
these can be deployed immediately at the individual and local level.
In order to develop strategies to protect individuals from adverse consequences of heat
exposure, it is necessary to improve our understanding of specific health consequences among
Page 4 of 36

high risk groups. In the present study, we sought to understand the health effects of heat
among individuals with COPD, using disease-specific respiratory health outcomes. We
hypothesized that 1) increases in indoor and outdoor temperature during the warmer months
would be associated with increases in daily respiratory symptoms and rescue medication use
and decreases in lung function among participants with COPD, and 2) increases in air pollution
exposure would modify the effects of temperature, enhancing the detrimental effects of
increases in temperature on these daily indicators of COPD morbidity.
Methods
Participant Recruitment and Study Design
Participants provided written informed consent and the Johns Hopkins Medical Institutional
Review Board approved the protocol. Participants and methods were previously described.(20)
Briefly, participants were former smokers with COPD recruited from the Baltimore area and
studied at baseline, 3 and 6 months as part of the COPD and Domestic Endotoxin Study. To
determine health effects of heat, we restricted analysis to the warm weather season, defined
as the time between the first and last day that the maximum outdoor temperature exceeded 90
degrees Fahrenheit (F) in Baltimore for each calendar year. Sixty-nine of 84 participants had
monitoring during this warm weather season. Fifty –four had one week of monitoring and
fifteen had two weeks of monitoring. Participants completed health and demographic
questionnaires and spirometry was performed according to American Thoracic Society (ATS)
criteria (21, 22).
Page 5 of 36
Environmental Monitoring of Heat and Air Quality
A home environmental assessment was completed, including a home inspection and
continuous environmental monitoring over a one-week period to capture daily indoor
temperature and humidity, and weekly particulate matter (PM) and nitrogen dioxide (NO2).
Participants completed a daily activity diary during the environmental monitoring period. Air
sampling occurred in the main living area, identified as a room other than the bedroom where
the participant reported spending the most time. Additional methods are provided in the online
supplementary materials and a prior publication (21). Outdoor temperature, humidity, and
pollution concentrations (PM, NO2 and ozone) were obtained from publicly available datasets
provided by National Oceanic and Atmospheric Administration (NOAA) and the Environmental
Protection Agency (EPA) (Table E1).(23, 24)
COPD Daily Respiratory Health Outcomes
Participants performed daily questionnaires and spirometry during home environmental
monitoring. The validated Breathlessness, Cough, and Sputum Scale (BCSS) contains three
questions that each assess a symptom using a Likert-type scale ranging from 0 to 4. A change in
total score of 0.3-0.4 is mild while a change of 1.0 is considered substantial (25). Handheld
spirometry was also performed daily (PiKo-1, nSpire Health, Inc). Frequency of rescue inhaler
medication use was captured in a daily diary as 0, 1, 2, 3 or >4 times daily.
Page 6 of 36
Statistical Analysis
Descriptive statistics were analyzed using Spearman correlations, chi square tests, and t-tests.
At each time point, daily maximum temperature was used as the primary exposure variables in
generalized estimating equations models (22) to account for repeated measures. Models for
indoor and outdoor temperature were run separately and adjusted for age, sex, education, visit
(baseline, 3 or 6 months), and baseline percent predicted FEV1. Pack years of smoking were
used to account for disease severity for models in which the primary outcome was lung
function.
Models were constructed to account for pollutant concentrations; models of indoor
temperature included indoor daily average humidity and weekly average indoor PM2.5 and NO2.
Models of outdoor temperature included daily average outdoor humidity, PM2.5, NO2, and
ozone. Lag terms were created to assess same day and subsequent day health effects. To assess
effect modification, interaction terms were created between pollution and temperature
variables. To illustrate temperature effects at given pollution concentrations, models were used
to calculate the outcomes of interest for pollutant concentrations at the 25th
, 50th
, and 75th
percentiles using average or mode values for other variables.
Interaction terms and stratified models were created to investigate whether time spent
outdoors modified the effect of outdoor temperature on COPD. Sensitivity analyses were
performed using the 95th percentile values of temperature rather than maximum values and
excluding extreme outliers. Analyses were performed with Stata SE statistical software, version
11.0 (Stata Corp, College Station, TX). Statistical significance was defined as a p value less than
0.05.
Page 7 of 36

Results
Study participants were older individuals with moderate and severe COPD and impaired
pulmonary function (Table 1). Between 2009 and 2011, there were 601 participant study days
in the warm weather season. Participants spent a substantial amount of time indoors and only
went outdoors on 46% of these days. On the days that participants went outdoors, the mean (+
SD) time outdoors was 2.0 (+ 2.1) hours. The mean ± (SD) daily maximum indoor and outdoor
temperature were 80 + 7⁰ F and 85 + 9 ⁰ F, respectively (Figure 1). There was only moderate
correlation between daily indoor and outdoor maximum temperatures (Spearman’s rho= 0.44,
p-value <0.01).
Eighty-five percent of participants had either central air conditioning or window units.
Central air conditioning was reported to have been used on 50% of study days and window air
conditioning unit use was reported on 18% of days. Participants reported that they did not use
air conditioning at all on 37% of study days that occurred during the warm season. The
maximum indoor temperature was lower on days that participants reported using central air
conditioning compared to days that they did not (mean (SD) 81.4 (6.4) versus 79.0 (7.0)⁰ F,
respectively, P<0.01)
Effect of Indoor Temperature on COPD Morbidity
Increases in maximum daily indoor temperature were associated with increases in symptoms,
measured using the Breathlessness, Cough, and Sputum Scale (BCSS), and with increases in
frequency of rescue inhaler use. These associations persisted even after accounting for indoor
Page 8 of 36

pollutant concentrations, including indoor NO2 and indoor PM2.5. For example, a 10 degree F
increase in indoor temperature was associated with a 0.38 (95% CI 0.01-0.67; p-value = 0.01)
increase in BCSS score, even after adjustment for indoor relative humidity, PM2.5, and NO2.
Inclusion of lag terms in these models suggested that increases in indoor temperatures had an
immediate (same-day) effect and also an effect that was detectable at 1-2 days post-exposure.
We found no detectable effect of daily changes in indoor temperature on daily
measurements of lung function, using either morning or evening FEV1 (evening values shown in
Table 2). Sensitivity analyses conducted excluding extreme temperature outliers (over 110° F)
and using the 95th
percentile value of daily indoor temperature yielded similar results (Table
E2). Evaluation of interaction terms and stratified models suggested an enhanced effect of
indoor temperature on use of rescue inhalers among participants that had more advanced
COPD (coefficient 0.27, p-value 0.06 for FEV1 <50% predicted; coefficient 0.01, p-value 0.816
among those with FEV1 > 50% predicted; p-interaction 0.048) but did not suggest that disease
severity influenced the effect of indoor heat on symptoms. Stratified models also suggested an
enhanced effect of indoor temperature on symptoms and rescue inhaler use on days that
participants did not go outdoors (Table E3).
Interactive Effect of Indoor Pollution and Indoor Temperature
In models investigating the effect of indoor temperature on BCSS and on rescue inhaler use,
significant positive interactions were detected between PM2.5 and temperature (interaction
term p-value <0.001 in both models). Similarly, significant positive interactions were also
Page 9 of 36

detected between indoor NO2 and temperature (interaction term p-value <0.05 in BCSS model
and <0.001 in rescue inhaler model).
To illustrate the positive interactive effect, Table 3 provides estimates of the effect a 10⁰
F increase in temperature at given percentiles of indoor pollutant concentrations and
demonstrates that the effect of temperature is larger with increasing indoor pollutant
concentrations. For example, a participant residing in a home that had an indoor PM2.5
concentration at the 25th percentile of the study homes (5 µg/m3) would experience an
increased in BCSS score of 0.4 (indicative of a mild increase in symptoms) for every 10⁰ F degree
increase in indoor temperature while an individual in a home at the 75th percentile (16 µg/m3)
would experience an increase in BCSS of 1 (indicative of a severe increase in symptoms)(25).
Models investigating lung function as the outcome did not demonstrate an interactive effect
between indoor temperature and pollutants.
Effect of Outdoor Temperature on COPD Morbidity
Daily maximum outdoor temperature was not significantly associated with respiratory
symptoms, rescue medication use, or lung function in the overall cohort (Table 4). As
participants reported going outdoors on less than half of the study days in the warm weather
season, we performed analyses stratified by days that participants reported going outdoors and
assessed for interaction by time outdoors. Stratified models suggested a significant association
between increasing outdoor temperature and respiratory symptoms on days that participants
went outdoors. There were no statistically significant interactions between outdoor
temperature and outdoor air pollutants, including PM2.5, NO2, and ozone (data not shown).
Page 10 of 36

Discussion
The present study is among the first to describe the effect of heat exposure on disease-specific
morbidity outcomes among those with COPD, a group that has been identified as high risk for
detrimental health effects of heat, and the first to report an interactive effect between indoor
temperature and indoor pollution.
In a cohort of participants with moderate to severe COPD, we found that increases in
home indoor temperature during warmer weather were associated with increases in daily
indicators of COPD morbidity, including respiratory symptoms and rescue inhaler medication
use. There was a positive interaction between temperature and indoor air pollution, including
PM2.5 and NO2, such that the effect of indoor heat was greater in the presence of higher indoor
air pollutant concentrations.
In this study population, participants spent a great deal of time indoors and ventured
outdoors on only half of the study days. Outdoor temperature was associated with increased
respiratory symptoms on these days. In the context of the anticipated increase in temperatures
related to climate change, these findings suggest that adaptive strategies targeting the indoor
environment provide an opportunity to minimize health risks for those with COPD.
Our results are consistent with and extend previous findings that have demonstrated
adverse health consequences of heat exposure. Previous studies have largely used ambient
data to assign exposure and linked this to population health effects with compelling results.
Such studies have identified elderly individuals and those with underlying cardiac and
respiratory diseases, including COPD, as at increased risk for adverse health effects of heat
Page 11 of 36

exposure (12, 15, 26-29).
For example, a time series study across 12 US cities demonstrated increases in deaths
attributable to COPD during hot weather with differences between hot and cold cities. In cold
cities, hot temperatures were associated with an increase in the risk of death attributable to
COPD by as much as 25% (12) with immediate, same-day effects. In hot cities, the effect of hot
temperatures was attenuated and delayed with a 6% increase in COPD deaths at lags of 3 and 4
days.
A study in New York City examined COPD morbidity using hospitalization data and found
that the same-day risk of COPD hospitalization increased by 7.6% for every one ºC increase
above a threshold temperature of 29ºC (17) and that there was a detectable but smaller
association between temperature and respiratory hospitalization when applying a 1-day lag.
Other studies have used Medicare data to provide estimates of effect that are
representative of a broader portion of the U.S. population (30, 31). In a study that included 12.5
million elderly individuals in 213 urban US counties, there was a 4.7% increased risk of
hospitalization for COPD for every 10⁰F increase in ambient temperature and findings were not
attributable to air pollution health effects (30). Heat and respiratory hospitalizations were most
strongly associated on the day of exposure in this study but the effect was still present and
significant at a lag of 1 day and no longer detectable at 2 days. The ecologic design of such
studies and the potential for bias due to measurement error in exposure assignment has been a
limitation that is now addressed in the present study, which provides individual level data.
Researchers who previously investigated the interactive effect of temperature and air
pollution reported mixed results with little evidence for differences in COPD outcomes. For
Page 12 of 36
example, in a study conducted in Brisbane Australia, PM10 modified the effect of temperature
on respiratory hospital admissions but there was no interactive effect for respiratory
emergency visits (32). Basu and colleagues examined temperature and mortality in California
and did not find that pollution modified the effect of temperature (33). In a study of 9 European
cities included in the EuroHEAT project, the effect of heat on overall mortality and
cardiovascular mortality were increased on high PM10 and high ozone days but the interactive
effect of these pollutants and heat on respiratory mortality was less evident (34).
Ren and colleagues analyzed data from 98 urban communities in the US National
Morbidity, Mortality, and Air Pollution Study and found that ozone modified the risk for
cardiovascular mortality. However, their results did not include respiratory mortality as an
outcome measure. Zanobetti and coauthors studied 9 U.S. cities during the warm season and
did find evidence that outdoor PM2.5 or ozone modified the relationship between increasing
outdoor temperature and risk of death (35).
In the present study, we did not find an interaction between the effects of outdoor
temperature and ozone or PM. However, there was a consistent signal demonstrating that
increases in indoor pollution enhanced the adverse effect of increasing indoor temperature on
COPD symptoms and rescue medication use. To our knowledge, this is the first study to report
interactive effects of indoor temperature and air pollution on COPD morbidity.
Previous studies linking outdoor heat with hospitalization or death have demonstrated
same-day health effects of heat exposure or lag times of one day (15). Our findings suggest the
health effect of indoor heat exposure is immediate and may persist for one to two days. While
the mechanisms of health effects in COPD remain incompletely understood, proposed
Page 13 of 36
mechanisms include both thermoregulatory responses(36) and bronchoconstrictive effects of
heat.
Patients with COPD may have impaired ability to respond to heat stress. It has been
proposed that heatstroke leads to increases in intravascular coagulation due to release of Il-1 or
IL-6 into the systemic circulation with activation of microvascular thrombosis which may trigger
a respiratory distress syndrome (37, 38). Studies in asthma suggest that breathing hot humid air
may result in bronchoconstriction and increased airways resistance that is mediated via
cholinergic pathways (39, 40). We did not detect an association between indoor heat and FEV1.
This may suggest that either that bronchoconstriction did not impact the airways resistance
captured by the FEV1 outcome measurement or that bronchoconstriction was not the
mechanism by which participants were affected by heat.
Limitations
As this study was limited to the Baltimore region, the results may not be generalizable to other
areas of the country. We used education as an indicator of socioeconomic status as household
income was not reflective of socioeconomic status in our largely retired population and this
approach may have resulted in some misclassification of socioeconomic status. Indoor air
monitoring did not include ozone as previous studies in Baltimore city have documented that
this exposure is typically low in homes (41).
While each participant had comprehensive and daily characterization of the indoor
environment and COPD health outcomes, outdoor measurements of temperature and pollutant
concentrations were obtained from central site monitors, which may have resulted in
Page 14 of 36

measurement error in assigning outdoor exposure to each individual. This may have
contributed to the weaker associations between outdoor temperature and COPD morbidity
although the daily activity diary data would suggest that the small amount of time spent
outdoors was also a key contributing factor.
Conclusions
Findings of the present study suggest that additional indoor cooling may improve COPD
respiratory health during warmer months and that consideration should be given when
traveling outdoors in warmer weather. Further, our findings that increases in indoor air
pollution exaggerated adverse health effects of indoor heat exposure highlight the opportunity
to improve COPD health through optimization of the indoor environment. The participants
with COPD in this study spent the overwhelming majority of their time indoors during warm
weather days.
Although 86% of participants had some form of air conditioning available, air
conditioning was not used on 37% of study days. While we did not find that education level was
associated with the use of air conditioning, we were limited in our ability to understand the
extent to which use of air conditioning was influenced by financial hardship.
Addressing barriers to air conditioning use may have potential health benefit for those
with COPD and future studies may be needed to fully elucidate the impact of air conditioning
use on respiratory health in COPD. However, while air conditioning may provide a short-term
solution for this high risk group(42), it is not without consequences. The use of air conditioning
ultimately contributes to the cycle that perpetuates climate change and the steady rise in
Page 15 of 36

outdoor temperatures.(43) Further, the associated costs are problematic for disadvantaged
populations in the United States and around the world.
Ultimately, in addition to adaptive strategies at the individual and population level,
mitigation strategies are needed at a policy level to intercept the alarming rise in outdoor
temperatures. To effectively address this will require the interdisciplinary work of urban
planners, public health, engineers, economists and climate scientists in addition to medical
practitioners to provide the foundation for such policy.
Page 16 of 36

Acknowledgements:
The authors thank the study participants and the study staff for their contributions.
Page 17 of 36

References
1. Portier CH, Thigpen Tart K, Carter SR, Dilworth CH, Grambsch AE, Gohlke J, Hess J, Howard
SN, Luber G, Lutz JT, et al. A Human Heath Perspective on Climate Change: A Report
Outlining the Research Needs on the Human Health Effects of Climate Change. 2010.
Research Triangle Park, NC, Environmental Health Perspectives/National Institute of
Environmental Health Sciences. doi:10.1289/ehp.1002272. Proc Am Thorac Soc 2015.
2. Huang C, Street R, Chu C. Adapting to climate change. JAMA 2015; 313: 727.
3. Pinkerton KE, Rom WN, Akpinar-Elci M, Balmes JR, Bayram H, Brandli O, Hollingsworth JW,
Kinney PL, Margolis HG, Martin WJ, Sasser EN, Smith KR, Takaro TK. An official American
Thoracic Society workshop report: Climate change and human health. Proc Am Thorac Soc
2012; 9: 3-8.
4. World Health Organization. Atlas of health and climate. World Health Organization, Geneva.
2012. Available at http://www.who.int/globalchange/publications/atlas/report/en/.
Accessed January 18, 2016.
5. Bernstein AS, Rice MB. Lungs in a warming world: climate change and respiratory health.
Chest 2013; 143: 1455-1459.
6. Crowley RA, Health, Public Policy Committee of the American College of P. Climate Change
and Health: A Position Paper of the American College of Physicians. Ann Intern Med 2016.
7. Patz JA, Frumkin H, Holloway T, Vimont DJ, Haines A. Climate change: challenges and
opportunities for global health. JAMA 2014; 312: 1565-1580.
8. Meehl GA, Tebaldi C. More intense, more frequent, and longer lasting heat waves in the 21st
century. Science 2004; 305: 994-997.
9. Kovats RS, Hajat S. Heat stress and public health: a critical review. Annu Rev Public Health
2008; 29: 41-55.
10. Robine JM, Cheung SL, Le RS, Van OH, Griffiths C, Michel JP, Herrmann FR. Death toll
exceeded 70,000 in Europe during the summer of 2003. C R Biol 2008; 331: 171-178.
11. Whitman S, Good G, Donoghue ER, Benbow N, Shou W, Mou S. Mortality in Chicago
attributed to the July 1995 heat wave. Am J Public Health 1997; 87: 1515-1518.
12. Braga AL, Zanobetti A, Schwartz J. The effect of weather on respiratory and cardiovascular
deaths in 12 U.S. cities. Environ Health Perspect 2002; 110: 859-863.
13. Basu R. High ambient temperature and mortality: a review of epidemiologic studies from
2001 to 2008. Environ Health 2009; 8: 40.
14. Turner LR, Barnett AG, Connell D, Tong S. Ambient temperature and cardiorespiratory
morbidity: a systematic review and meta-analysis. Epidemiology 2012; 23: 594-606.
Page 18 of 36

15. Anderson GB, Dominici F, Wang Y, McCormack MC, Bell ML, Peng RD. Heat-related
emergency hospitalizations for respiratory diseases in the Medicare population. Am J Respir
Crit Care Med 2013; 187: 1098-1103.
16. Michelozzi P, Accetta G, De Sario M, D'Ippoliti D, Marino C, Baccini M, Biggeri A, Anderson
HR, Katsouyanni K, Ballester F, Bisanti L, Cadum E, Forsberg B, Forastiere F, Goodman PG,
Hojs A, Kirchmayer U, Medina S, Paldy A, Schindler C, Sunyer J, Perucci CA, Group PC. High
temperature and hospitalizations for cardiovascular and respiratory causes in 12 European
cities. Am J Respir Crit Care Med 2009; 179: 383-389.
17. Lin S, Luo M, Walker RJ, Liu X, Hwang SA, Chinery R. Extreme high temperatures and
hospital admissions for respiratory and cardiovascular diseases. Epidemiology 2009; 20:
738-746.
18. Basu R, Samet JM. An exposure assessment study of ambient heat exposure in an elderly
population in Baltimore, Maryland. Environ Health Perspect 2002; 110: 1219-1224.
19. National Research Council. Climate Change, the Indoor Environment, and Health.
Washington, DC: The National Academies Press, 2011. Climate Change, the Indoor
Environment, and Health 2015.
20. Hansel NN, McCormack MC, Belli AJ, Matsui EC, Peng RD, Aloe C, Paulin L, Williams DL,
Diette GB, Breysse PN. In-home air pollution is linked to respiratory morbidity in former
smokers with chronic obstructive pulmonary disease. Am J Respir Crit Care Med 2013; 187:
1085-1090.
21. Hankinson JL, Odencrantz JR, Fedan KB. Spirometric reference values from a sample of the
general U.S. population. Am J Respir Crit Care Med 1999; 159: 179-187.
22. Miller MR, Hankinson J, Brusasco V, Burgos F, Casaburi R, Coates A, Crapo R, Enright P, van
der Grinten CP, Gustafsson P, Jensen R, Johnson DC, MacIntyre N, McKay R, Navajas D,
Pedersen OF, Pellegrino R, Viegi G, Wanger J. Standardisation of spirometry. Eur Respir J
2005; 26: 319-338.
23. National Oceanic and Atmospheric Administration. National Centers for Environmental
Information. Available from: http://www.nodc.noaa.gov/General/temperature.html.
Accessed last January 18, 2016.
24. United States Environmental Protecation Agency. Air Quality System database. Available
from: https://aqs.epa.gov/api. Accessed last January 18, 2016.
25. Leidy NK, Rennard SI, Schmier J, Jones MK, Goldman M. The breathlessness, cough, and
sputum scale*: The development of empirically based guidelines for interpretation. CHEST
Journal 2003; 124: 2182-2191.
26. Anderson BG, Bell ML. Weather-related mortality: how heat, cold, and heat waves affect
mortality in the United States. Epidemiology (Cambridge, Mass ) 2009; 20: 205-213.
27. Zanobetti A, O'Neill MS, Gronlund CJ, Schwartz JD. Summer temperature variability and
long-term survival among elderly people with chronic disease. Proc Natl Acad Sci U S A
2012; 109: 6608-6613.
Page 19 of 36
28. Monteiro A, Carvalho V, Oliveira T, Sousa C. Excess mortality and morbidity during the July
2006 heat wave in Porto, Portugal. International journal of biometeorology 2013; 57: 155-
167.
29. Liu L, Breitner S, Pan X, Franck U, Leitte AM, Wiedensohler A, von Klot S, Wichmann HE,
Peters A, Schneider A. Associations between air temperature and cardio-respiratory
mortality in the urban area of Beijing, China: a time-series analysis. Environmental health : a
global access science source 2011; 10: 51.
30. Anderson GB, Dominici F, Wang Y, McCormack MC, Bell ML, Peng RD. Heat-related
emergency hospitalizations for respiratory diseases in the Medicare population. Am J Respir
Crit Care Med 2013; 187: 1098-1103.
31. Gronlund CJ, Zanobetti A, Schwartz JD, Wellenius GA, O'Neill MS. Heat, heat waves, and
hospital admissions among the elderly in the United States, 1992-2006. Environmental
health perspectives 2014; 122: 1187-1192.
32. Ren C, Williams GM, Tong S. Does particulate matter modify the association between
temperature and cardiorespiratory diseases? Environ Health Perspect 2006; 114: 1690-
1696.
33. Basu R, Feng WY, Ostro BD. Characterizing temperature and mortality in nine California
counties. Epidemiology 2008; 19: 138-145.
34. Analitis A, Michelozzi P, D'Ippoliti D, De'Donato F, Menne B, Matthies F, Atkinson RW,
Iniguez C, Basagana X, Schneider A, Lefranc A, Paldy A, Bisanti L, Katsouyanni K. Effects of
heat waves on mortality: effect modification and confounding by air pollutants.
Epidemiology 2014; 25: 15-22.
35. Zanobetti A, Schwartz J. Temperature and mortality in nine US cities. Epidemiology 2008;
19: 563-570.
36. Kenny GP, Yardley J, Brown C, Sigal RJ, Jay O. Heat stress in older individuals and patients
with common chronic diseases. CMAJ 2010; 182: 1053-1060.
37. el-Kassimi FA, Al-Mashhadani S, Abdullah AK, Akhtar J. Adult respiratory distress syndrome
and disseminated intravascular coagulation complicating heat stroke. Chest 1986; 90: 571-
574.
38. Malik AB, Johnson A, Tahamont MV, van der Zee H, Blumenstock FA. Role of blood
components in mediating lung vascular injury after pulmonary vascular thrombosis. Chest
1983; 83: 21S-24S.
39. Hayes D, Jr., Collins PB, Khosravi M, Lin RL, Lee LY. Bronchoconstriction triggered by
breathing hot humid air in patients with asthma: role of cholinergic reflex. Am J Respir Crit
Care Med 2012; 185: 1190-1196.
40. Aitken ML, Marini JJ. Effect of heat delivery and extraction on airway conductance in normal
and in asthmatic subjects. Am Rev Respir Dis 1985; 131: 357-361.
Page 20 of 36

41. Diette GB, Hansel NN, Buckley TJ, Curtin-Brosnan J, Eggleston PA, Matsui EC, McCormack
MC, Williams DL, Breysse PN. Home indoor pollutant exposures among inner-city children
with and without asthma. Environ Health Persp 2007; 115: 1665-1669.
42. Ostro B, Rauch S, Green R, Malig B,Basu R. The effects of temperature and use of air
conditioning on hospitalizations, Am J Epidemiol 2010;172:1053-1061.
43. Davis LW, Gertler PJ. Contributions of air conditioning adoption to future energy use under
global warming. Proceedings of the National Academy of Sciences 2015; 112:19: 5962-
5967.
Page 21 of 36

Table 1. Participant characteristics (n=69)*
Age (years) 69 (8)
Sex, (% male) 57
White race (%) 90
Smoking (pack years) 56 (30)
Baseline post-bronchodilator
FEV1 % predicted 54 (16)
Gold Stage %
II
III
IV
48
40
12
Daily Health Assessment Average Values (mean (SD))*
BCSS score 2.7 (2.2)
Inhaler use (puffs/day) 0.88 (1.3)
Morning FEV1 (liters) 1.3 (0.6)
Evening FEV1 (liters) 1.3 (0.6)
Environmental characteristics*
N= 601 study days
Daily maximum indoor temperature (°F) 80.1 (6.7)
Daily average indoor relative humidity (%) 40.8 (8.5)
Weekly average indoor PM2.5 (µg/m3) 13.1 (15.4)
Weekly average indoor NO2 (ppb) 11.3 (11.7)
Days of reported central air conditioning use 50%
Days of reported window unit air conditioning use 18%
Days reported with no air conditioning use 37%
Days that participants went outdoors 47%
Time outdoors on days that participants went outdoors (hours) 1.95 (2.07)
Daily maximum outdoor temperature (⁰ F) 84.9 (9.9)
Page 22 of 36
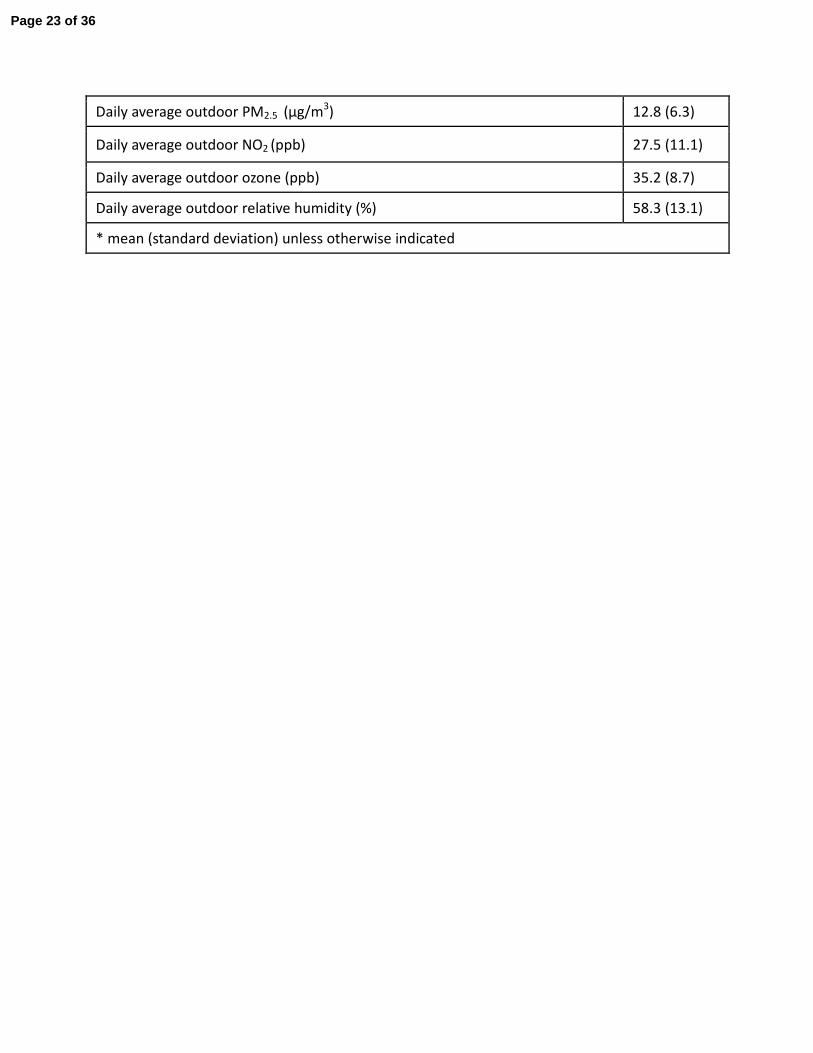
Daily average outdoor PM2.5 (µg/m3) 12.8 (6.3)
Daily average outdoor NO2 (ppb) 27.5 (11.1)
Daily average outdoor ozone (ppb) 35.2 (8.7)
Daily average outdoor relative humidity (%) 58.3 (13.1)
* mean (standard deviation) unless otherwise indicated
Page 23 of 36

Table 2. Association between Indoor Temperature and COPD Symptoms, Rescue Medication
Use, and Lung Function
Coefficient
**
95% Confidence
Interval
p-value
Breathlessness, Cough, and Sputum Scale
Daily Temperature (limited model*) 0.30 0.00, 0.59 0.048
Daily Temperature (with humidity,
NO2, PM2.5)
0.38 0.01, 0.67 0.013
Lag 0 0.30 0.00, 0.59 0.048
Lag 1 0.36 0.01, 0.70 0.042
Lag 2 0.48 0.12, 0.85 0.010
Lag 3 0.10 -0.27, 0.47 0.602
Rescue Inhaler Use
Daily Temperature (limited model*) 0.26 0.09, 0.42 0.002
Daily Temperature (with humidity,
NO2, PM2.5)
0.23 0.06, 0.41 0.008
Lag 0 0.26 0.09, 0.42 0.002
Lag 1 0.17 -0.02, 0.36 0.077
Lag 2 0.21 -0.01, 0.42 0.058
Lag 3 -0.02 -0.24, 0.20 0.845
Lung Function (evening FEV1)
Daily Temperature (limited model*) -0.02 -0.05, 0.02 0.419
Daily Temperature (with humidity,
NO2, PM2.5)
-0.01 -0.05, 0.02 0.439
Lag 0 -0.02 -0.05, 0.02 0.419
Lag 1 -0.01 -0.04, 0.03 0.610
Lag 2 -0.01 -0.05, 0.02 0.418
Lag 3 -0.02 -0.06, 0.02 0.262
*models include visit, age, gender, education, baseline FEV1 (pack years was used instead of
baseline FEV1 in the lung function models)
** changes are expressed per 10⁰F increase in indoor temperature
Page 24 of 36
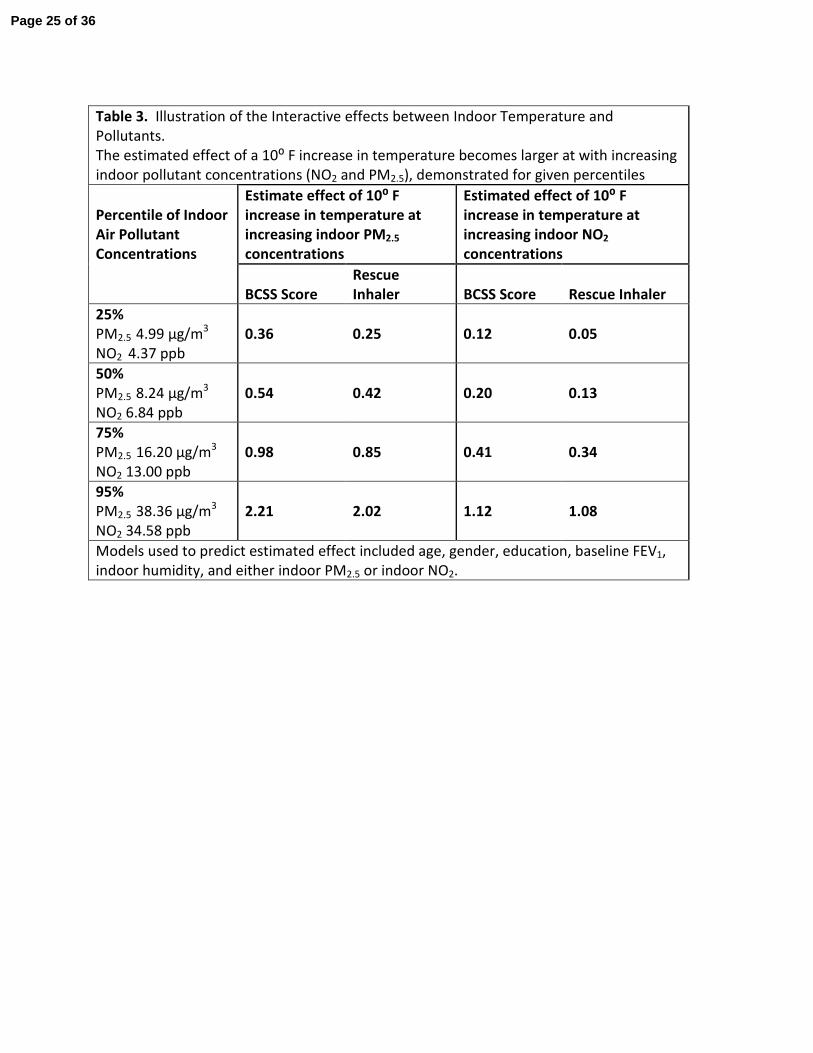
Table 3. Illustration of the Interactive effects between Indoor Temperature and
Pollutants.
The estimated effect of a 10⁰ F increase in temperature becomes larger at with increasing
indoor pollutant concentrations (NO2 and PM2.5), demonstrated for given percentiles
Percentile of Indoor
Air Pollutant
Concentrations
Estimate effect of 10⁰ F
increase in temperature at
increasing indoor PM2.5
concentrations
Estimated effect of 10⁰ F
increase in temperature at
increasing indoor NO2
concentrations
BCSS Score
Rescue
Inhaler BCSS Score Rescue Inhaler
25%
PM2.5 4.99 µg/m3
NO2 4.37 ppb
0.36 0.25 0.12 0.05
50%
PM2.5 8.24 µg/m3
NO2 6.84 ppb
0.54 0.42 0.20 0.13
75%
PM2.5 16.20 µg/m3
NO2 13.00 ppb
0.98 0.85 0.41 0.34
95%
PM2.5 38.36 µg/m3
NO2 34.58 ppb
2.21 2.02 1.12 1.08
Models used to predict estimated effect included age, gender, education, baseline FEV1,
indoor humidity, and either indoor PM2.5 or indoor NO2.
Page 25 of 36

Table 4. Daily Maximum Outdoor Temperature and COPD Health Outcomes stratified by whether
the participant went outdoors on a given day *
Overall (N=485)
Days Participants
stayed indoors
(N=250)
Days participants went
outdoors (N=229)
p-value for
interaction
Outcomes
Coefficient
(95%
Confidence
Interval)
P-
Value
Coefficient
(95%
Confidence
Interval)
P-
Value
Coefficient
(95%
Confidence
Interval)
P-
Value
BCSS 0.13
(-0.06, 0.32)
0.18 0.00
(-0.29, 0.29)
0.985 0.38
(0.122, 0.628)
0.004 0.045
Rescue
inhaler
0.01
(-0.09, 0.10)
0.912 0.01
(-0.14, 0.16)
0.899 0.03
(-0.10, 0.17)
0.619 0.554
Evening
FEV1**
0.00
(-0.02, 0.03)
0.830 0.01
(-0.03, 0.04)
0.749 -0.01
(-0.06, 0.03)
0.534 0.477
Multivariate analysis adjusted for age, sex, education, baseline lung function or smoking history,
visit, outdoor PM2.5, outdoor NO2, outdoor ozone, outdoor relative humidity
**N=479 for overall, 187 for days indoors, 211 for days participants went outdoors for Evening
FEV1
Page 26 of 36

Figure Legend:
Figure 1. Distribution of Maximum Indoor and Outdoor Daily Temperature Values. Distribution
of daily indoor and outdoor maximum temperatures during the warm weather season.
Participants spent most of their times indoors and went outside on only 47% of study days and
spent about 2 hours outdoors on those days. Maximum daily indoor temperatures averaged
80⁰F while maximum daily outdoor temperature averaged 85⁰ F.
Page 27 of 36

[Type here]
Figure 1. Distribution of Maximum Indoor and Outdoor Daily Temperature Values
Facts for the text: 602 participant study days in the warm season Days over 90: 38/85 in 2009, 64/122 in 2010, 47/111 in 2011
020
40
60
80
40
Freq
uenc
y
60 80 100 120
Temperature F
Outdoor
Indoor
Page 28 of 36

Online Data Supplement
Respiratory Effects of Indoor Heat and the Interaction with Air Pollution in COPD
Meredith C McCormack, Andrew J Belli, Darryn Waugh, Elizabeth C Matsui, Roger D Peng,
D’Ann LWilliams, Laura Paulin, Anik Saha, Charles M Aloe, Gregory B Diette, Patrick N Breysse,
Nadia N Hansel
Page 29 of 36

Methods:
Participant Recruitment and Study Design
Participants provided written informed consent and the Johns Hopkins Medical
Institutional Review Board approved the protocol. Participants and methods were previously
described.(1) Briefly, participants were former smokers with COPD recruited from the Baltimore
area. Inclusion criteria included: 1) age ≥ 40 years, 2) post bronchodilator FEV1 ≤ 80%
predicted, 3) FEV1/FVC <70%, and 4) >10 pack years smoking, but having quit >1 year prior to
enrollment with an exhaled carbon monoxide level ≤6 ppm. (2)
Participants were studied at baseline, 3 and 6 months. To determine health effects of
heat exposure, we defined a warm weather season as the time during each calendar year
between the first and last day that the maximum outdoor temperature exceeded 90 degrees
Farenheit (F) and restricted analysis to data collected during this time period. Sixty-nine of the
84 participants had monitoring during this warm weather season. Sixty-nine of 84 participants
had monitoring during this warm weather season. Fifty –four had one week of monitoring and
fifteen had two weeks of monitoring.
At baseline, participants completed health and demographic questionnaires and
spirometry was performed according to American Thoracic Society (ATS) criteria (3, 4).
Demographics included education as a surrogate for socioeconomic status as many participants
were older and no longer worked, making annual household income less reliable.
Environmental monitoring of heat and air quality
Temperature and humidity were measured using HOBO (Onset, Inc. Poccosette, MA) hourly
temperature and humidity loggers. Indoor air sampling for PM2.5 (PM with aerodynamic size ≤
2.5 μm) and NO2 was performed as described previously (1). PM2.5 was collected using 4 L/min
Page 30 of 36
SKC personal environmental monitoring (PEM) impactors (SKC, Eighty-four, PA) loaded with 37-
mm, 2.0-μm pore size, PALL Teflo PTFE membrane filters with polypropylene support rings (Pall
Corp. Ann Arbor, MI). Filters were pre and post-weighed in a temperature and humidity control
room using a Mettler-Toledo UP-5 microbalance (Mettler-Toledo, Columbus, OH). The limit of
detection (LOD) for PM2.5 was 0.64 μg/m3. NO2 was measured using a passive sampler (Ogawa
badge) loaded with filters coated with triethanolamine (TEA) and detected
spectrophotometrically. The LOD for NO2 was 0.52 ppb. Indoor PM2.5 and NO2 values were
available as week-long average values. Archived hourly (DSI 3505) temperature and humidity
were accessed from the National Oceanic and Atmospheric Administration (NOAA) National
Climatic Data Center website using data from the Science Center in the Inner Harbor.(5) Daily
average outdoor PM2.5, NO2, and ozone data were obtained from the Environmental Protection
Agency’s (EPA) Aerometric Information Retrieval Service (now referred to as the Air Quality
System database).(6) Data from the monitoring station closest to the participant’s home was
used and in the case of missing data, values from the next closest monitoring site were applied.
COPD daily respiratory health outcomes
Participants performed daily measurements during home environmental monitoring.
The Breathlessness, Cough, and Sputum Scale (BCSS) contains three questions that each assess
a symptom using a Likert-type scale ranging from 0 to 4 (higher scores indicating more severe
symptoms). A change in total score of 0.3-0.4 is considered mild while a change of 1.0 is
considered substantial(7). Handheld spirometry was also performed daily (PiKo-1, nSpire
Health, Inc). The frequency of rescue inhaler medication use was captured in a daily diary as 0,
1, 2, 3 or >4 times daily.
Page 31 of 36

Statistical Analysis
Descriptive statistics were analyzed using Spearman correlations, chi square tests, and t-
tests, as appropriate. At each time point, daily maximum temperature was used as the primary
exposure variables in generalized estimating equations models (8) to account for repeated
measures. The GEE family was Gaussian, link was identity, and correlation was exchangeable.
Models for indoor and outdoor temperature were run separately. Models were adjusted for
age, sex, education, visit (baseline, 3 or 6 months), and baseline percent predicted FEV1. Pack
years of smoking was included to account for disease severity for models in which the primary
outcome was lung function. Models were constructed to account for pollutant concentrations;
models of indoor temperature included indoor daily average humidity and weekly average
indoor PM2.5 and NO2. Models of outdoor temperature included daily average outdoor
humidity, PM2.5, NO2, and ozone. Lag terms were created to assess same day and subsequent
day health effects. To assess whether pollution modified the effect of heat exposure,
interaction terms were created between pollution and temperature variables. To illustrate
temperature effects at given pollution concentrations, the main models were used to calculate
the outcomes of interest for pollutant concentrations at the 25th
, 50th
, and 75th
percentiles and
average or mode values were applied for other variables. Interaction terms and stratified
models were also created to investigate whether time spent outdoors modified the effect of
outdoor temperature on COPD. Sensitivity analyses were performed using the 95th
percentile
values of temperature rather than the maximum values. All analyses were performed with
StataSE statistical software, version11.0 (Stata Corp, College Station, TX). Statistical significance
was defined as a p value less than 0.05.
Page 32 of 36

Table E1. Methods used to create environmental exposure variables
Exposure Variable Source Method Time interval of exposure
assessment
Indoor Temperature Participant
homes
HOBO (Onset,
Inc.
Poccosette,
MA)
Hourly average values during 24
hour period from 8 am to 8 am to
create maximum and 95th
percentile
daily values
Indoor Humidity Participant
homes
HOBO (Onset,
Inc.
Poccosette,
MA)
Hourly average values during 24
hour period from 8 am to 8 am to
create maximum and 95th
percentile
daily values
Indoor PM2.5 Participant
homes
PEMS with
pumps
Integrated 5- 7 day gravimetric
sample
Indoor NO2 Participant
homes
Ogawa passive
badges
5- 7 day average
Outdoor
Temperature
NOAA(5) available
dataset
Hourly average values used to
create maximum and 95th
percentile
values
Outdoor Humidity NOAA(5) available
dataset
Hourly average values used to
create maximum and 95th
percentile
values
Outdoor PM EPA(6) available
dataset
24 hour daily average values
Outdoor NO2 EPA(6) available
dataset
24 hour daily average values
Outdoor Ozone EPA(8) available
dataset
24 hour daily average values
Page 33 of 36

Table E2. Sensitivity Analyses for Daily Indoor Temperature and COPD Health Outcomes
95th
percentile Daily Temperature
used as the exposure variable
Maximum daily temperature used as
the exposure variable with extreme
outliers values over 110⁰ F excluded
Outcomes
Coefficient
(95% Confidence
Interval) p-value
Coefficient
(95% Confidence
Interval) p-value
BCSS 0.40
(0.09, 0.70) 0.01
0.46
(0.15, 0.77) 0.004
Rescue inhaler 0.27
(0.10, 0.45) 0.003
0.26
(0.08, 0.44) 0.005
Evening FEV1 -0.01
(-0.05, 0.03) 0.55
0.00
(-0.04, 0.04) 0.92
**Multivariate analysis adjusted for age, sex, education, baseline lung function or smoking
history, visit, indoor humidity, NO2, PM2.5
Page 34 of 36
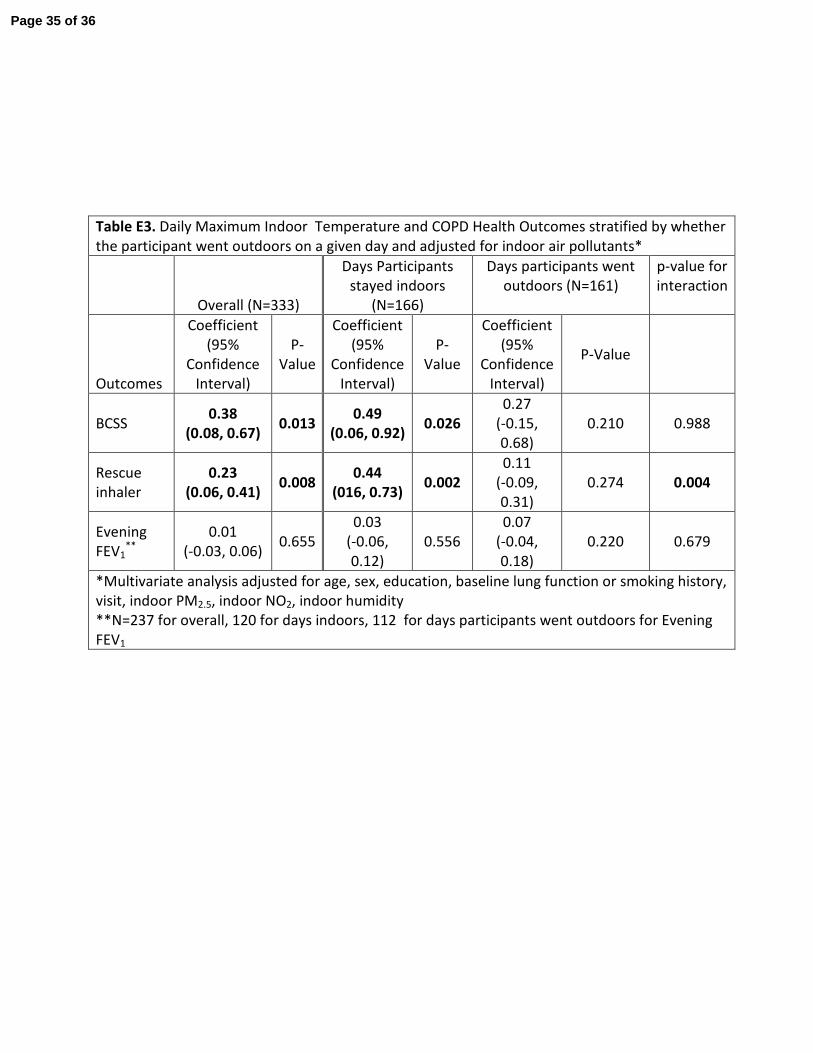
Table E3. Daily Maximum Indoor Temperature and COPD Health Outcomes stratified by whether
the participant went outdoors on a given day and adjusted for indoor air pollutants*
Overall (N=333)
Days Participants
stayed indoors
(N=166)
Days participants went
outdoors (N=161)
p-value for
interaction
Outcomes
Coefficient
(95%
Confidence
Interval)
P-
Value
Coefficient
(95%
Confidence
Interval)
P-
Value
Coefficient
(95%
Confidence
Interval)
P-Value
BCSS 0.38
(0.08, 0.67) 0.013
0.49
(0.06, 0.92) 0.026
0.27
(-0.15,
0.68)
0.210 0.988
Rescue
inhaler
0.23
(0.06, 0.41) 0.008
0.44
(016, 0.73) 0.002
0.11
(-0.09,
0.31)
0.274 0.004
Evening
FEV1**
0.01
(-0.03, 0.06) 0.655
0.03
(-0.06,
0.12)
0.556
0.07
(-0.04,
0.18)
0.220 0.679
*Multivariate analysis adjusted for age, sex, education, baseline lung function or smoking history,
visit, indoor PM2.5, indoor NO2, indoor humidity
**N=237 for overall, 120 for days indoors, 112 for days participants went outdoors for Evening
FEV1
Page 35 of 36

Reference List
1. Hansel NN, McCormack MC, Belli AJ, Matsui EC, Peng RD, Aloe C, Paulin L, Williams DL, Diette
GB, Breysse PN. In-home air pollution is linked to respiratory morbidity in former
smokers with chronic obstructive pulmonary disease. Am J Respir Crit Care Med 2013;
187: 1085-1090.
2. Middleton ET, Morice AH. Breath carbon monoxide as an indication of smoking habit. Chest
2000; 117: 758-763.
3. Hankinson JL, Odencrantz JR, Fedan KB. Spirometric reference values from a sample of the
general U.S. population. Am J Respir Crit Care Med 1999; 159: 179-187.
4. Miller MR, Hankinson J, Brusasco V, Burgos F, Casaburi R, Coates A, Crapo R, Enright P, van
der Grinten CP, Gustafsson P, Jensen R, Johnson DC, MacIntyre N, McKay R, Navajas D,
Pedersen OF, Pellegrino R, Viegi G, Wanger J. Standardisation of spirometry. Eur Respir J
2005; 26: 319-338.
5. National Oceanic and Atmospheric Administration. National Centers for Environmental
Information. Available from: http://www.nodc.noaa.gov/General/temperature.html.
Accessed last January 18, 2016.
6. United States Environmental Protecation Agency. Air Quality System database.
Available from: https://aqs.epa.gov/api. Accessed last January 18, 2016.
7. Leidy NK, Rennard SI, Schmier J, Jones MK, Goldman M. The breathlessness, cough, and
sputum scale*: The development of empirically based guidelines for interpretation.
CHEST Journal 2003; 124: 2182-2191.
8. Diggle PJ, Heagerty P, Liang KY, Zeger S. The analysis of longitudinal data, 2nd ed. Oxford:
Oxford University Press; 2002.
Page 36 of 36