Paediatrics - NHS England · PDF fileMeasuring Harm Paediatric Serious Harm Key Indicators...
40
Paediatrics PEWS & Deteriorating Patients Linda Clerihew
Transcript of Paediatrics - NHS England · PDF fileMeasuring Harm Paediatric Serious Harm Key Indicators...

Paediatrics
PEWS & Deteriorating Patients Linda Clerihew

Aim
30% reduction in avoidable harm measured by the
Paediatric Serious Harm Key Indicators
by December 2015
SPSP
2007
SPSPP
2010
McQIC
2013

Measuring Harm
Paediatric Serious Harm Key Indicators
Paediatric Trigger Tool,
Avoidable Harm Tool
Datix, SER
complaints, feedback
The unreported

Paediatric Serious Harm Key Indicators
Category Operational Definition Outcome measure of
Serious Safety Event Datix >4 All
Serious Medication Event Datix >4 Medicines safety
Unplanned Admission to ICU All in hospital Deteriorating patient
CLABSI All healthcare HAI
VAP PICU only HAI
Child protection harm In development MDT working

Deteriorating Patient - Unplanned admission to ICU
• Is not the same as PREVENTABLE admission to ICU
• ? How many can be prevented

2000 excess deaths <19yo per annum in UK compared with Sweden

Identifiable failures in 26%
potentially avoidable in further 43%

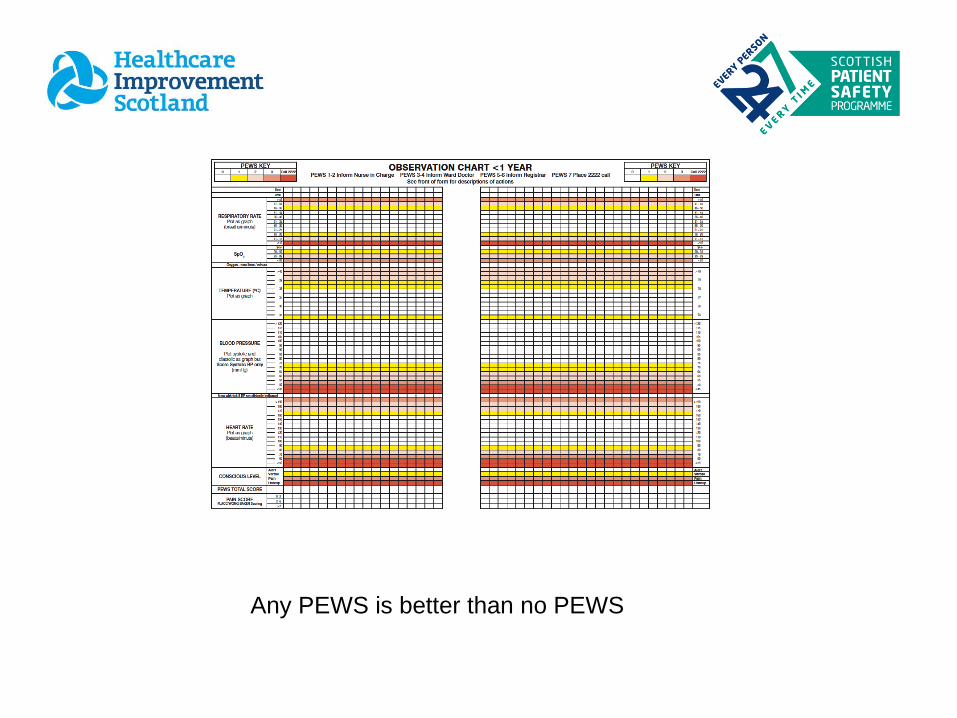
Any PEWS is better than no PEWS

Watchers
80% of acute admissions to HDU score < 3
– why admit to HDU

SBAR
Safety Briefs & Hospital Huddles

Bed state & prediction
Staff state & prediction
Organisation safety threats
High PEWS/watchers;
child protection,
CAMHS
absconsion
Mitigation plan in place?
The Huddle


Even though it was my first day on the
ward I now know that even as a student I have something to
contribute
I know how to pull the
emergency buzzer
I understand that I need to know
my environment
I Know that I am part of a team and there are
other people to help me

Unplanned admissions to ICU
• RHSC Edinburgh– more rapid escalation, ↓ LOS in ICU, trend to reduced mortality
• Tayside – significant reduction, multifactorial
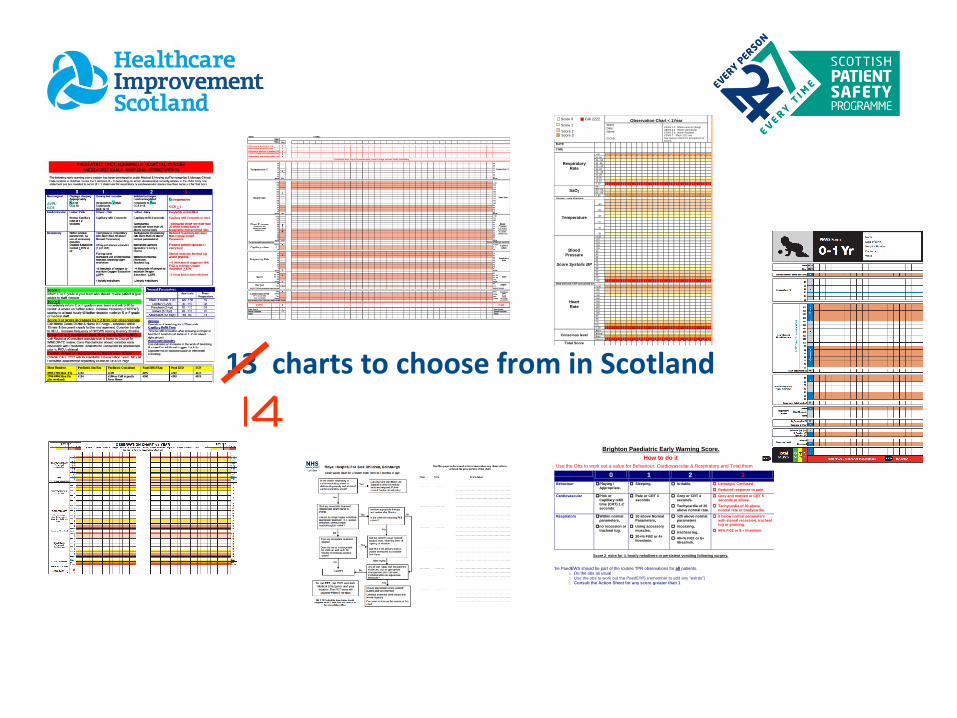
13 charts to choose from in Scotland
Observation Chart < 1Year
Ward: Date: Name: D.O.B.
CEWS 1-2 Inform nurse in charge CEWS 3-4 Inform ward doctor CEWS 5-6 Inform Registrar CEWS 7 Place 2222 call See reverse of form for descriptions of actions
DATE
TIME
Respiratory Rate
>56
51-55
46 - 50
41 -45
36 - 40
31-35
26 - 30
21-25
16-20
11-15
< 10
SaO2 94+
90 - 93
85 - 89
< 85
Oxygen – note litres/min
Temperature
>40
39
38
37
36
35
Blood Pressure
Score Systolic BP
>120
115
110
105
100
95
90
85
80
75
70
65
60
55
50
<45
Note with tick if BP not carried out
Heart Rate
>190
180
170
160
150
140
130
120
110
100
90
80
70
60
< 59
Conscious level
Alert
Verbal
Pain
Unresp
Total Score
Score 0 Call 2222
Score 1
Score 2 Score 3
Brighton Paediatric Early Warning Score.
How to do it
Use the Obs to work out a value for Behaviour, Cardiovascular & Respiratory and Total them
0 1 2 3
Behaviour Playing / Appropriate.
Sleeping. Irritable.
Lethargic/ Confused
Reduced response to pain.
Cardiovascular Pink or Capillary refill time (CRT) 1-2 seconds
Pale or CRT 3 seconds
Grey or CRT 4 seconds.
Tachycardia of 20 above normal rate.
Grey and mottled or CRT 5 seconds or above.
Tachycardia of 30 above normal rate or bradycardia.
Respiratory Within normal parameters,
no recession or tracheal tug.
10 above Normal Parameters,
Using accessory muscles,
30+% Fi02 or 4+ litres/min.
>20 above normal parameters
recessing,
tracheal tug.
40+% Fi02 or 6+ litres/min.
5 below normal parameters with sternal recession, tracheal tug or grunting.
50% Fi02 or 8 + litres/min.
Score 2 extra for ¼ hourly nebulisers or persistent vomiting following surgery.
The PaedEWS should be part of the routine TPR observations for all patients. o Do the obs as usual o Use the obs to work out the PaedEWS (remember to add any “extras”) o Consult the Action Sheet for any score greater than 1

Where do we start?
• What’s the evidence
• What age ranges
• What parameters do you score
• What parameters do you not score
• Track and trigger / weighted scores

Age ranges used across Scotland

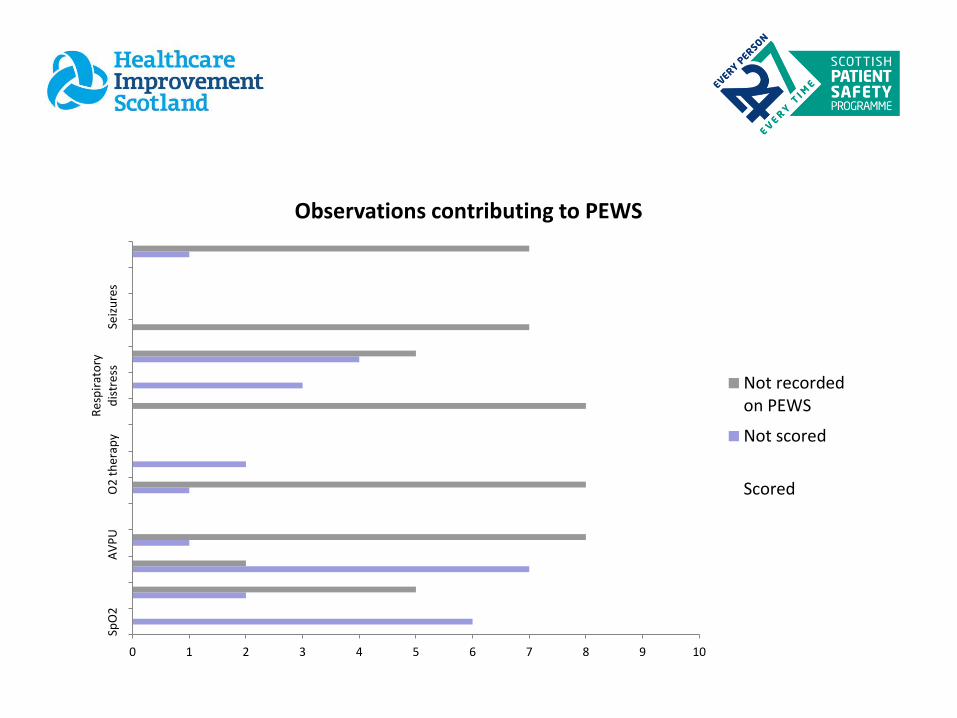
Observations which contribute to the Paediatric Early warning Score (PEWS)
0 1 2 3 4 5 6 7 8 9 10
SpO
2A
VP
UO
2 t
her
apy
Re
spir
ato
ryd
istr
ess
Seiz
ure
s
Observations contributing to PEWS
Not recordedon PEWS
Not scored
Scored

0 1 2 3 4 5 6 7 8 9 10
Sco
red
No
t sc
ore
dN
ot
reco
rde
do
n P
EWS
Observations contributing to PEWS
Blood sugar
Pain score
Seizures
Urine Volume
Dr / Nurseconcern
Respiratory distress
Capillary refill

Observations contributing to PEWS
0 1 2 3 4 5 6 7 8 9 10
SpO2
Respiratory Rate
Heart rate
AVPU
Temperature
Blood pressure
O2 therapy
Work of Breathing
Capillary refill
Respiratory distress
Dr / Nurseconcern

Evidence


Scottish PEWS

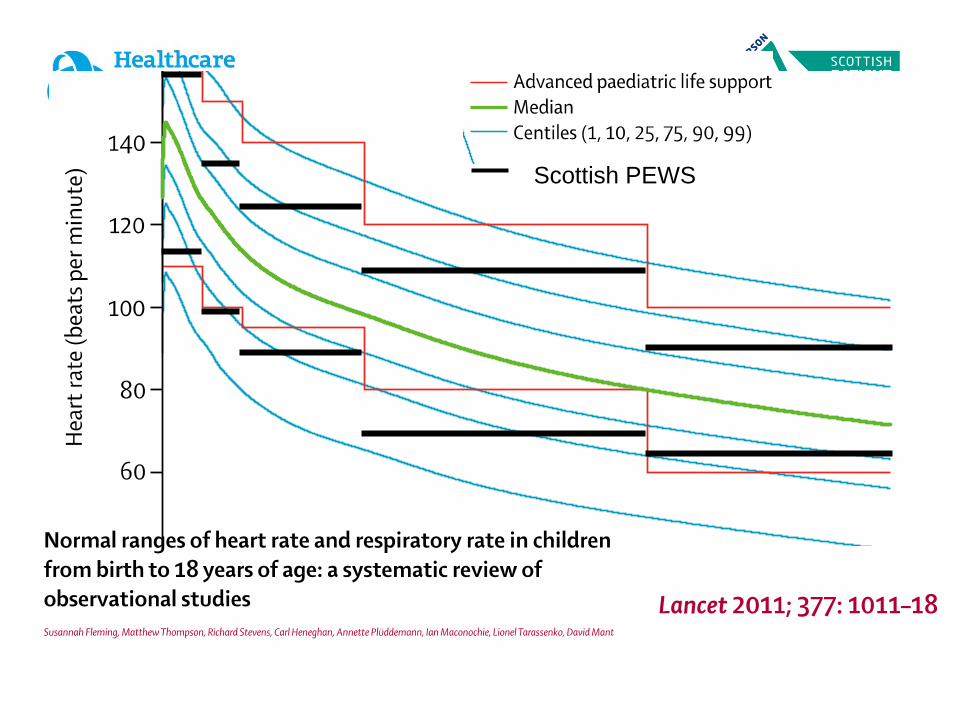
Scottish PEWS


PEWS scale
•Increased frequency of observation recording •Escalation of help required
•Nurse to doctor •Doctor to consultant
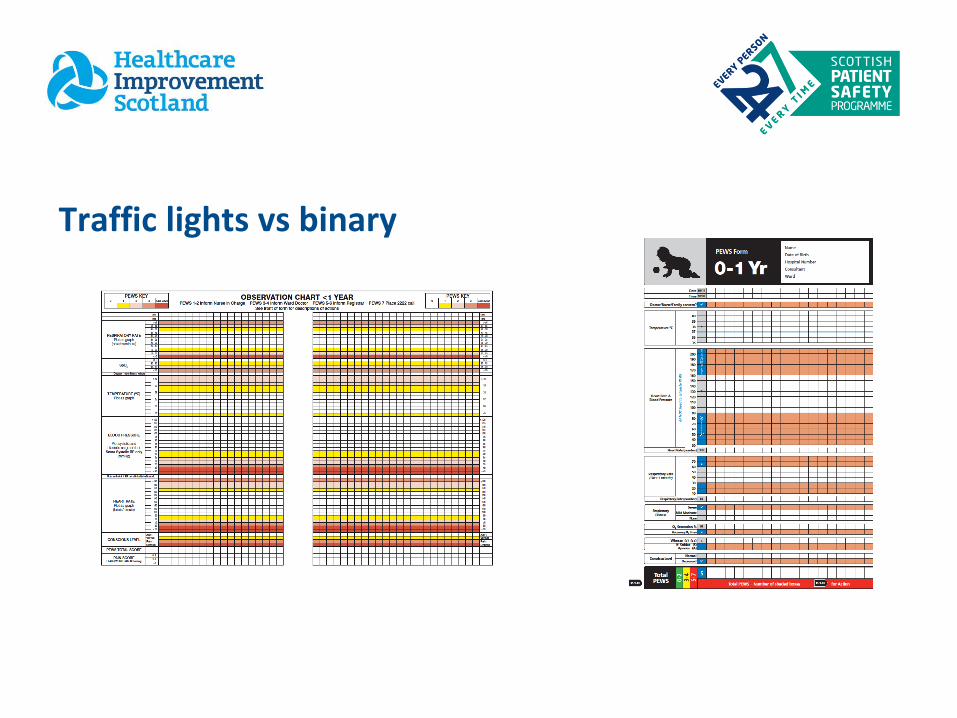
Traffic lights vs binary
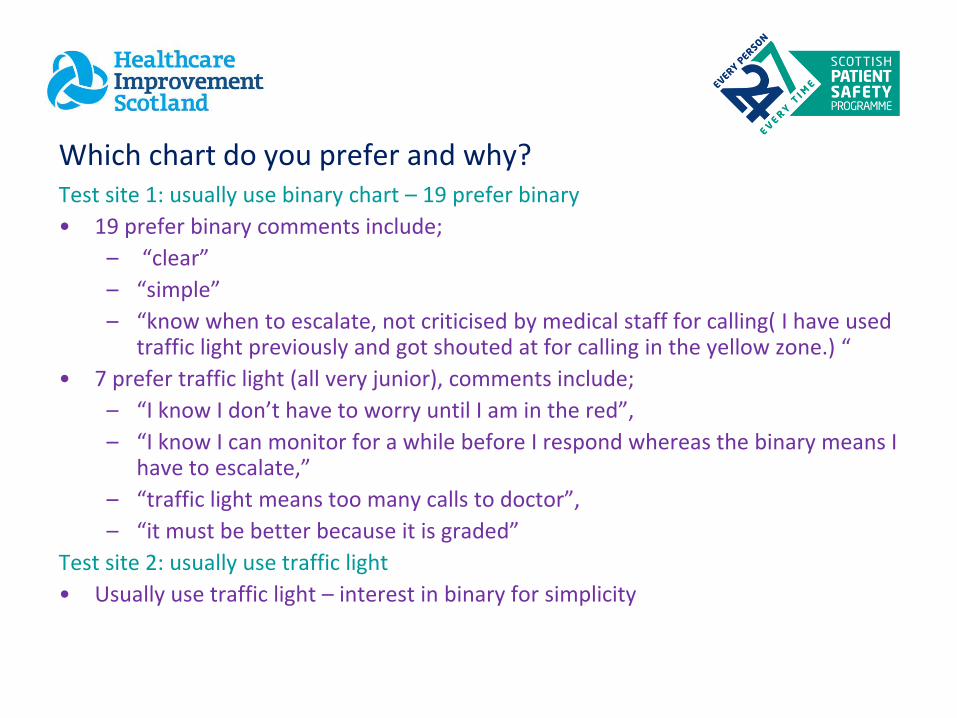
Which chart do you prefer and why? Test site 1: usually use binary chart – 19 prefer binary
• 19 prefer binary comments include;
– “clear”
– “simple”
– “know when to escalate, not criticised by medical staff for calling( I have used traffic light previously and got shouted at for calling in the yellow zone.) “
• 7 prefer traffic light (all very junior), comments include;
– “I know I don’t have to worry until I am in the red”,
– “I know I can monitor for a while before I respond whereas the binary means I have to escalate,”
– “traffic light means too many calls to doctor”,
– “it must be better because it is graded”
Test site 2: usually use traffic light
• Usually use traffic light – interest in binary for simplicity

Test site 1 - usually use binary test site 2 usually use traffic light
Test site 3 & 4 – unable to complete test – resistance to moving to different chart – not laid out
the way we want it

Which chart is best?
• All boards showing >95% reliability for completion of charts correctly
– Have a chart
– Correct age chart
– Correct score
• Variable reliability for appropriate escalation but in the main >90% in all boards

PEWS action monitoring
Inform nurse in charge
Inform nurse in charge & Doctor
Inform nurse in charge & Senior Doctor
Consider 2222 / crash call

The agreed way forward
• Score for: temp, HR, BP,CRT, RR, sats, O2 delivery, AVPU
• Traffic light scoring system
• Record other things but don’t score eg resp effort, BM
• Automatic triggers – watchers/staff or parental concern, <V of AVPU
• Disputes agreed with reference to NEWS
• 5 age groups - <1, 1-2, 2-5, 5-12, >12

Making it work – ensuring we don’t introduce new risk
• All boards look at last 10 deteriorating patients (150-200 cases)
– Does NPEWS recognise earlier or later – would management change compared with your current system
• Testing in board 1 followed by 11 others one at a time
• 2 boards continuing on their current charts ( both more binary type charts) but aware of national work and are moving to scoring same parameters and ranges
• SAS running in background switch on board by board

Validating
• Electronic validation not the same as paper chart with human factors
• What is the aim? –
– can validate electronically for prehospital for admission/ICU/death
– Can validate in ICU deterioration
– Big piece of work to do in ward deterioration but some centres have electronic data able to run comparisons of charts
• Further research needed for human factors elements
•
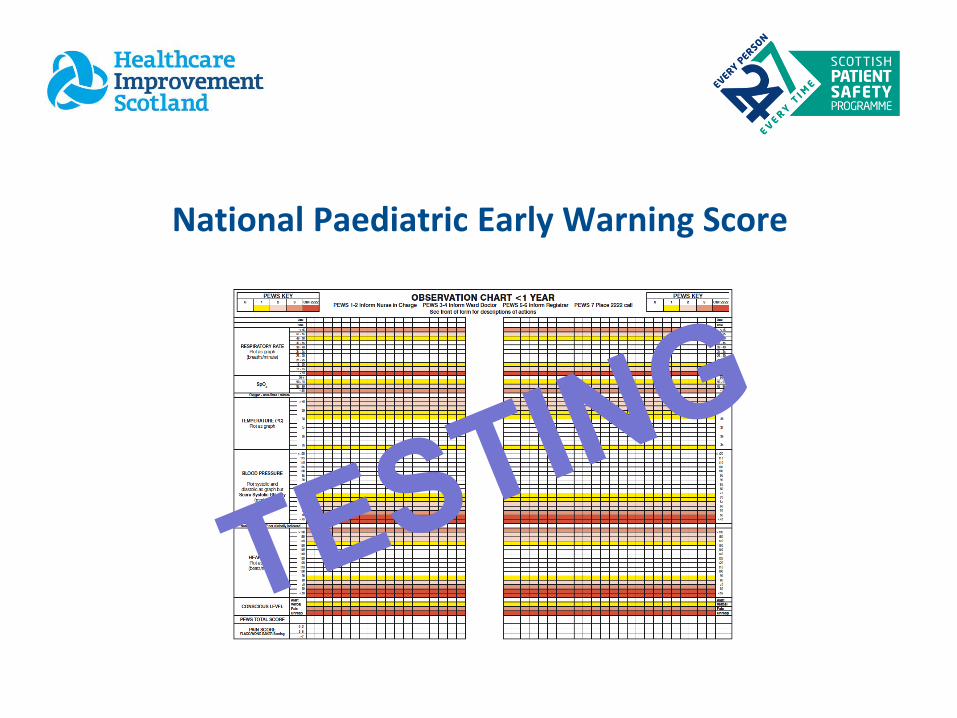
National Paediatric Early Warning Score
Thank-you