PACKAGING DYNAMICS #4 of 5 - Westpak, Inc · PDF filepolyurethane foam will compress up to 80%...
56
Edmund Tang Laboratory Manager Presenter Herb Schueneman President & CEO Presenter PACKAGING DYNAMICS #4 of 5 Dynamic Cushion Testing for Shock Absorption and Vibration Attenuation July 2015
Transcript of PACKAGING DYNAMICS #4 of 5 - Westpak, Inc · PDF filepolyurethane foam will compress up to 80%...
Edmund Tang Laboratory Manager
Presenter
Herb Schueneman President & CEO
Presenter
PACKAGING DYNAMICS #4 of 5 Dynamic Cushion Testing for Shock Absorption and
Vibration Attenuation
July 2015
2
Agenda
• Review of Webinars #1 – 3
• Cushion Systems Defined
• Vibration Dynamics of Cushion Systems
• Shock Dynamics of Cushion Systems
• Designing the Optimum Cushion System
o Selecting Cushion Thickness
o Static Loading Determination
o The Use of Ribs (non-linear cushions)
• Other Issues: (fabrication factors, nesting, corner protection, test procedures, etc.)

Review of Webinar #1
• History and background of Packaging Dynamics
• Terminology and Lingo
– Time domain vs. frequency domain
– Single degree of freedom spring mass system
• Common Packaging Dynamic hazards
– Vibration
– Impact (shocks and drops)
– Compression (static and dynamic)
3

Review of Webinar #1 : Shock Input and Response
4
Input
Response
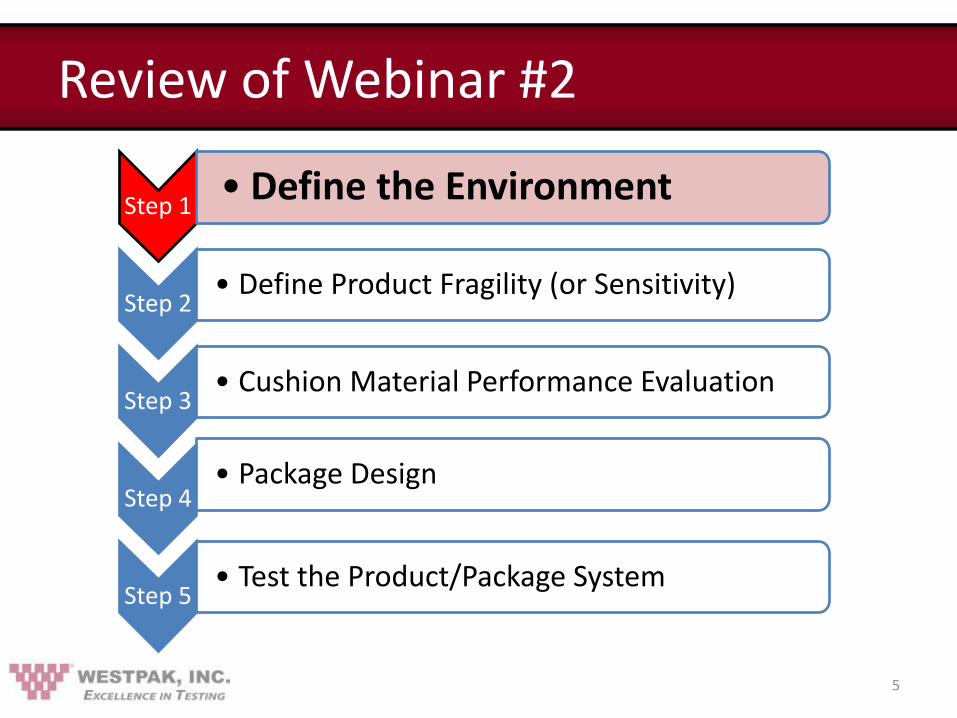
Review of Webinar #2
5
Step 1 • Define the Environment
Step 2 • Define Product Fragility (or Sensitivity)
Step 3 • Cushion Material Performance Evaluation
Step 4 • Package Design
Step 5 • Test the Product/Package System

Review of Webinar #2
6
Define the Distribution Environment by QUANTIFYING all the
Hazards Capable of Causing Damage to the Product.
• Impacts: determine the anticipated drop height range, number, and orientation of the likely impacts.
• Vibration: Determine the vibration spectrum that envelopes all the vehicles in which the product will likely travel.
• Temperature & Humidity: Determine extreme levels and likelihood of occurrence.
• Top Load Compression: Quantify the max stack height and duration in distribution and storage.
• Altitude: Determine the maximum altitude exposure (minimum pressure) for both truck and aircraft shipment.
Review of Webinar #2
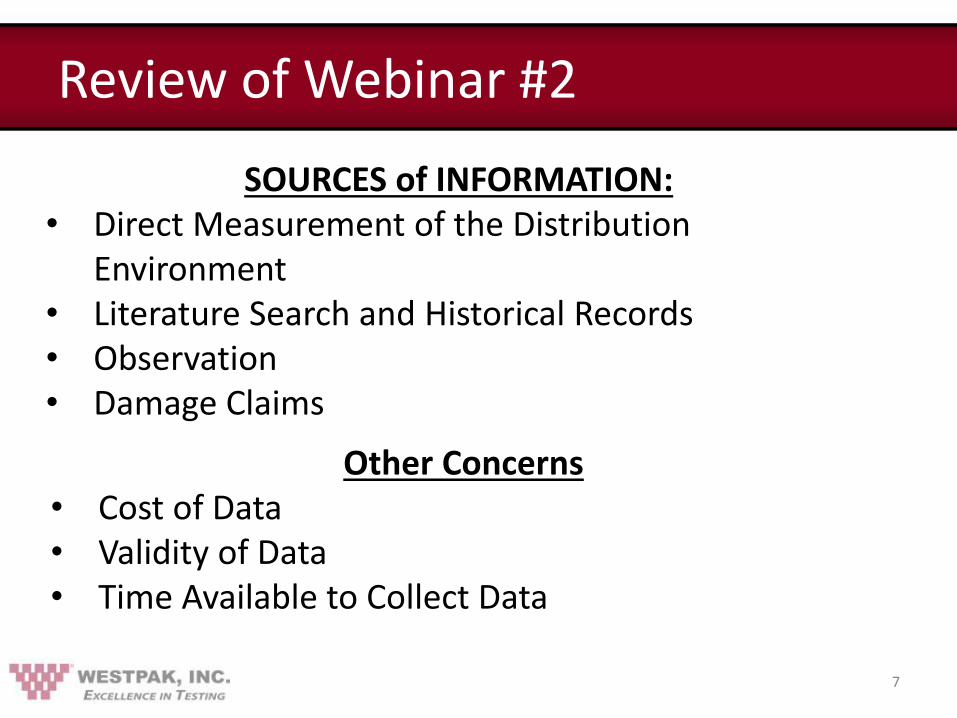
7
SOURCES of INFORMATION: • Direct Measurement of the Distribution
Environment • Literature Search and Historical Records • Observation • Damage Claims
Other Concerns • Cost of Data • Validity of Data • Time Available to Collect Data

Review of Webinar #3
Step 1 • Define the Environment
Step 2 • Define Product Fragility (or Sensitivity)
Step 3 • Cushion Material Performance Evaluation
Step 4 • Package Design
Step 5 • Test the Product/Package System
8
9
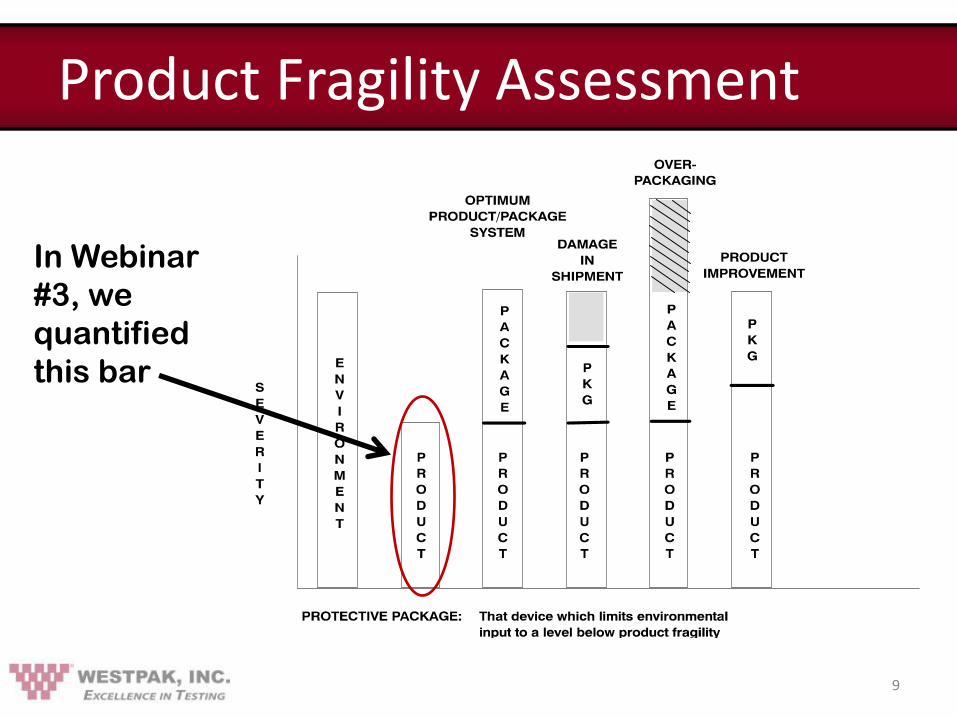
Product Fragility Assessment
In Webinar
#3, we
quantified
this bar

10
Cushion Test & Design
In this
Webinar #4,
we will
quantify this
bar
11
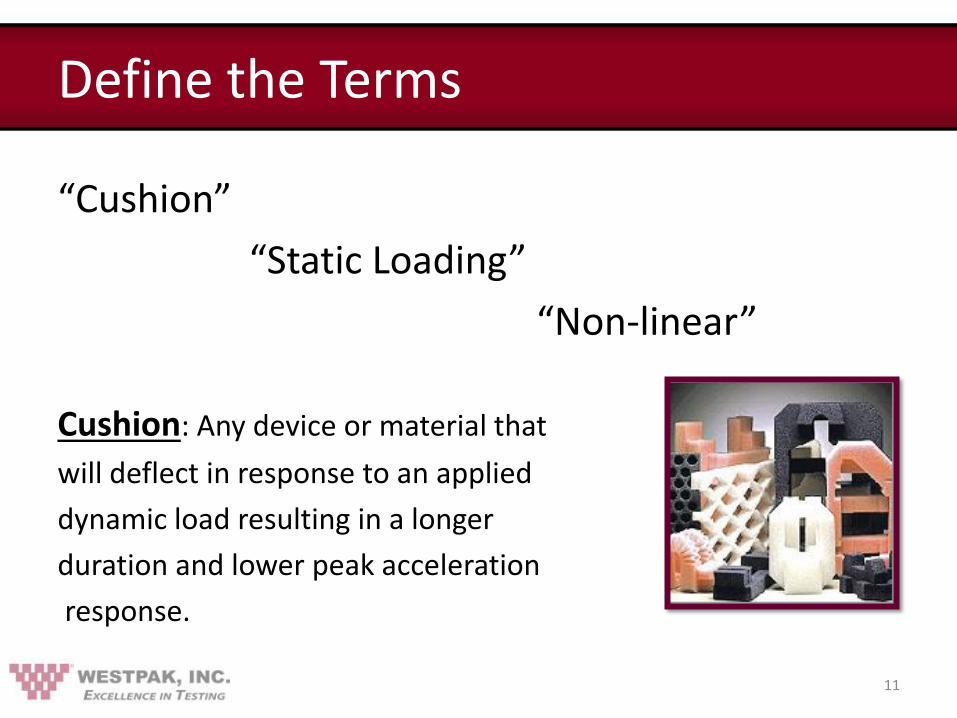
Define the Terms
“Cushion”
“Static Loading”
“Non-linear”
Cushion: Any device or material that
will deflect in response to an applied
dynamic load resulting in a longer
duration and lower peak acceleration
response.

12
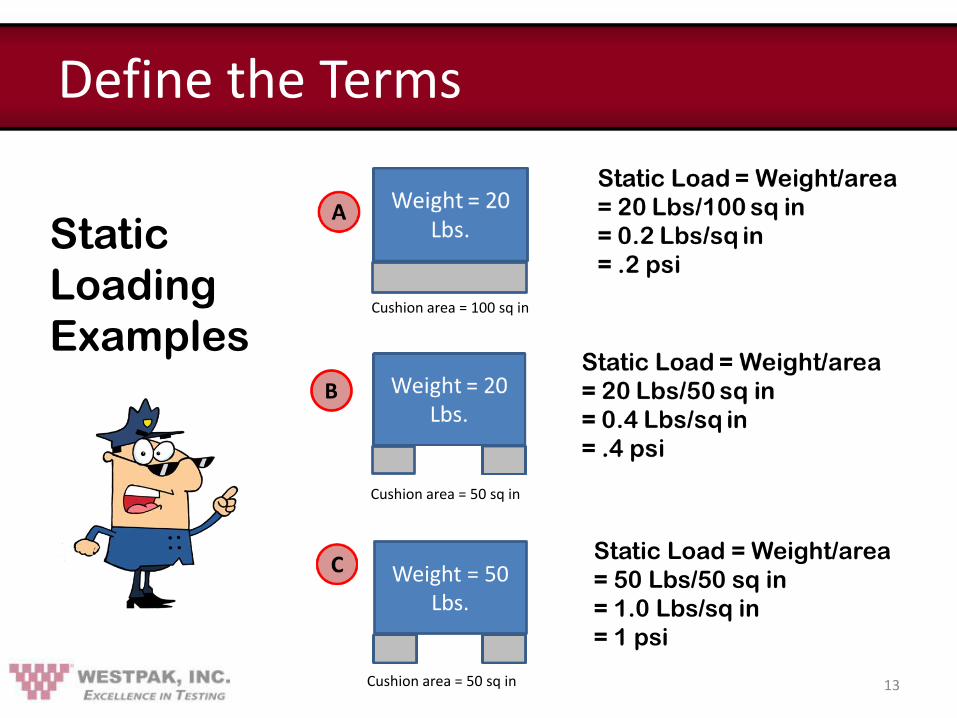
Define the Terms
Static Loading: (product weight / cushion area)
Normally expressed in pounds/square inch (psi)
or
Kilograms/square meter (kg/m^2)
or
Grams/square centimeter (g/cm^2)
Most commonly used cushion materials (polymer foams) function best in the loading range of 0.5 to 2.0 psi.
13
Define the Terms
Static
Loading
Examples
Weight = 50 Lbs.
Static Load = Weight/area
= 50 Lbs/50 sq in
= 1.0 Lbs/sq in
= 1 psi
B
Cushion area = 50 sq in
Cushion area = 100 sq in
Cushion area = 50 sq in

14
Define the Terms
To determine cushion area from a target Static Stress level, simply reverse the formula:
Cushion area = Mass (Product weight)/Static Loading
EXAMPLE: Product weight = 47 pounds
Desired static stress loading = 0.75 psi
Cushion area = Mass/loading
= 47 lbs / 0.75 psi
= 63 sq in
15
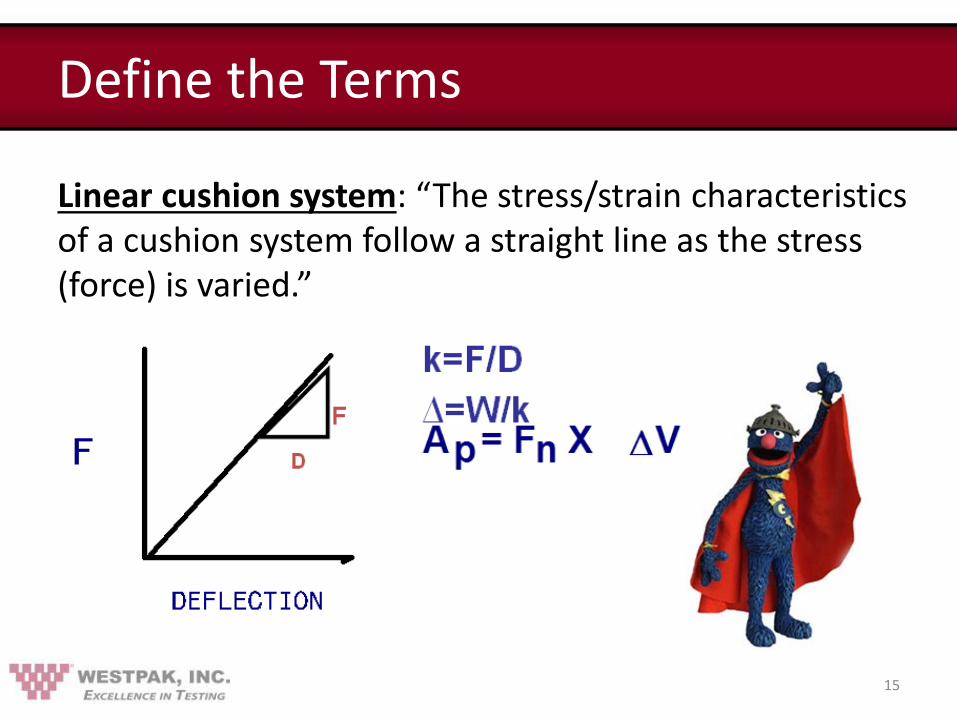
Define the Terms
Linear cushion system: “The stress/strain characteristics of a cushion system follow a straight line as the stress (force) is varied.”
16
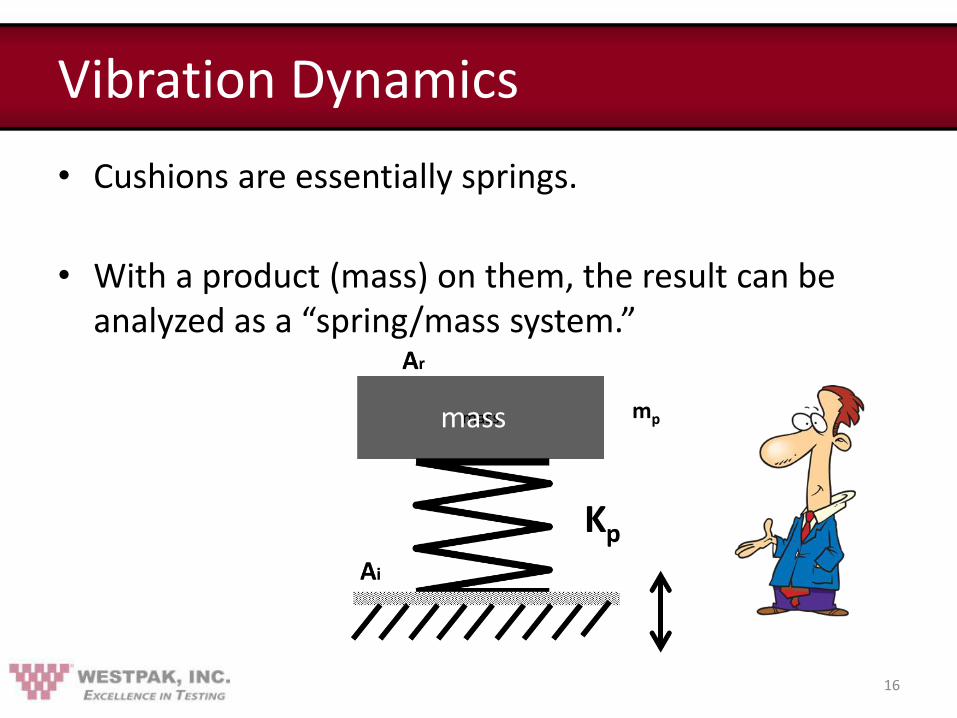
Vibration Dynamics
• Cushions are essentially springs.
• With a product (mass) on them, the result can be analyzed as a “spring/mass system.”
mp mass
17
Vibration Dynamics
• Vibration DAMPING is a primary cushion function
• What is the DYNAMIC SPRING RATE of the cushion?
• In the last Webinar, we demonstrated how to determine the PRODUCT vibration sensitivity.
• Now we need to determine the CUSHION vibration characteristics for optimum package system design.
18
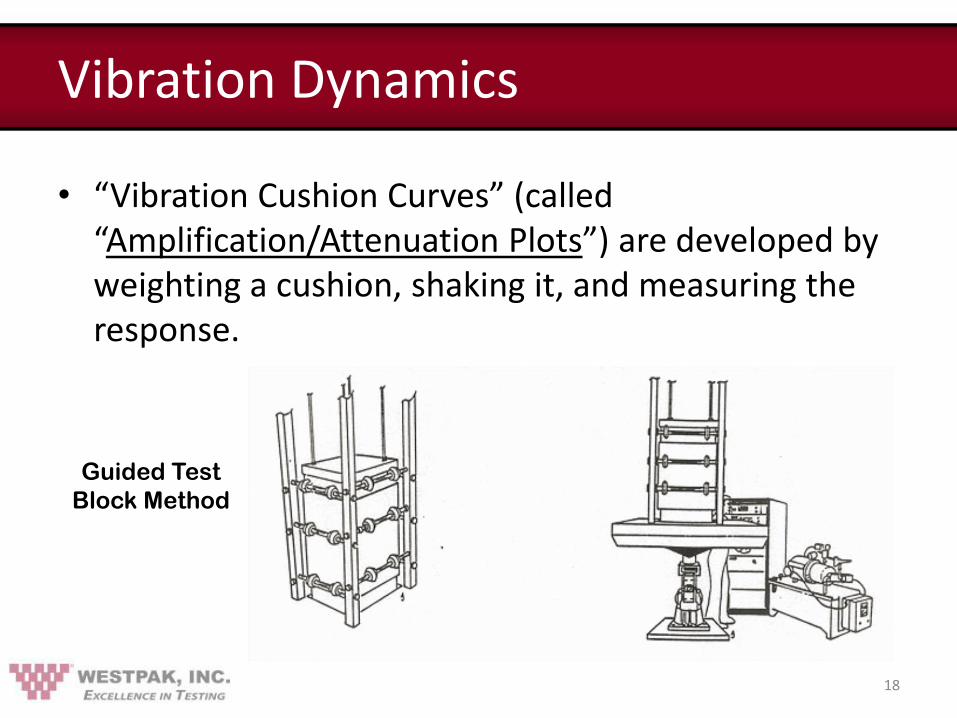
Vibration Dynamics
• “Vibration Cushion Curves” (called “Amplification/Attenuation Plots”) are developed by weighting a cushion, shaking it, and measuring the response.
Guided Test
Block Method

19
Vibration Dynamics
Alternate
Method
MASS
CUSHION
VIBRATION TABLE VIBRATION TABLE
CUSHION
MASS
CUSHION
RESPONSE
INPUT
MASS ADHERED TO FOAM
SO THAT THE "SPRING"
(CUSHION) WORKS IN BOTH
TENSION AND COMPRESSION
MASS ISOLATED BETWEEN
2 "SPRINGS" (CUSHIONS)
THAT WORK ONLY
IN COMPRESSION.
METHOD AMETHOD B
ACCELEROMETER
ACCELEROMETER
In this model, the mass is
adhered to the cushion so
that the “spring” (cushion)
works in both tension and
compression.
In this model, the mass is
isolated between 2
“springs” (cushions) so
that the cushions work in
compression only.
T-C MODEL C-C MODEL
20
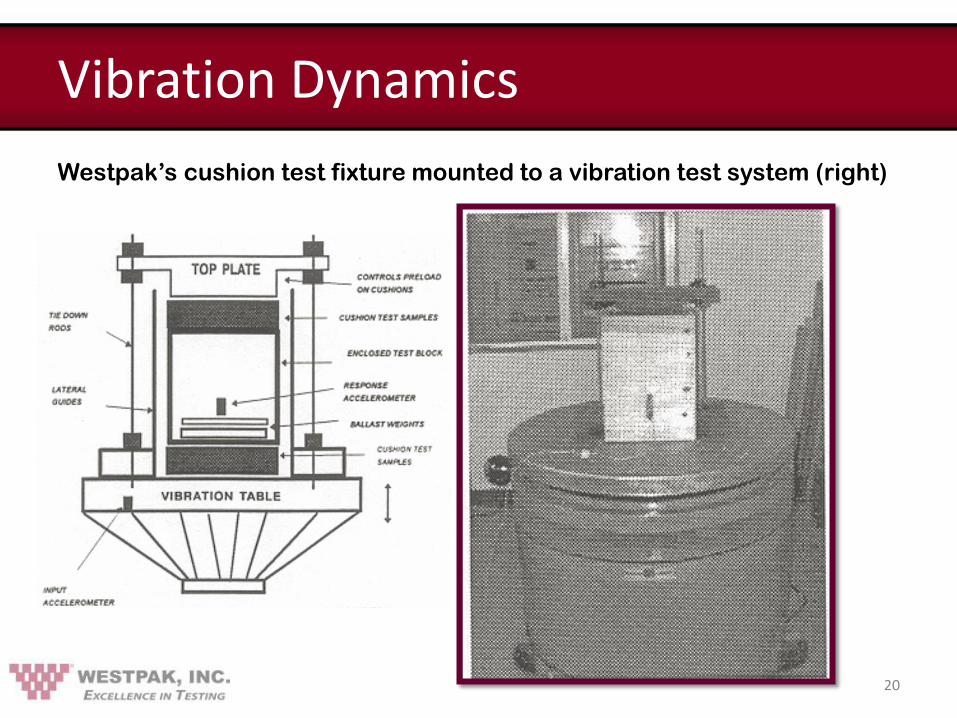
Vibration Dynamics
Westpak’s cushion test fixture mounted to a vibration test system (right)

21
Vibration Dynamics
For either method, the Spring/Mass system is excited (random or sine vibration) and the response/input ratio is plotted as a function of frequency.
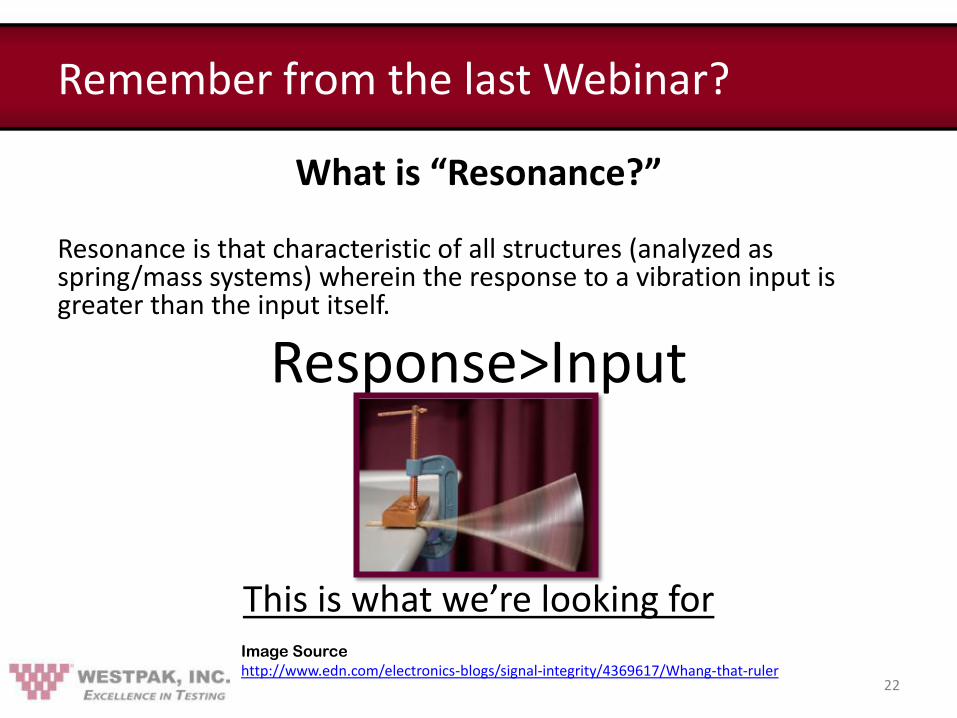
Remember from the last Webinar?
What is “Resonance?” Resonance is that characteristic of all structures (analyzed as spring/mass systems) wherein the response to a vibration input is greater than the input itself.
Response>Input
This is what we’re looking for
22
Image Source http://www.edn.com/electronics-blogs/signal-integrity/4369617/Whang-that-ruler
23
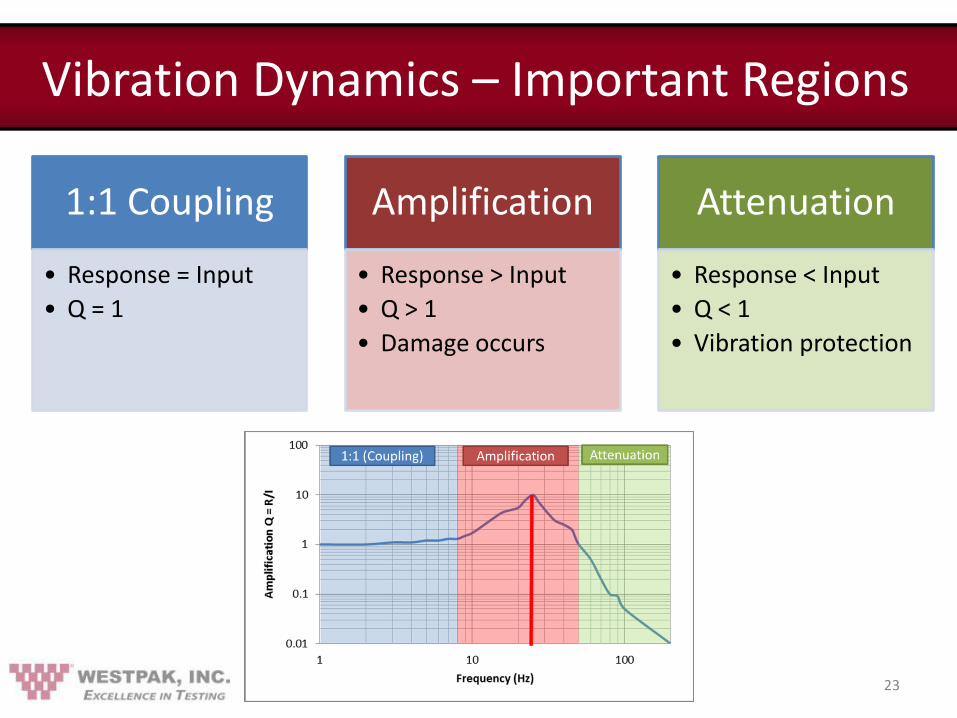
Vibration Dynamics – Important Regions
1:1 Coupling
• Response = Input
• Q = 1
Amplification
• Response > Input
• Q > 1
• Damage occurs
Attenuation
• Response < Input
• Q < 1
• Vibration protection

Vibration Dynamics
• How do we build an Amplification / Attenuation (A/A) plot to design a package? – Load your cushion at a specific loading utilizing the
fixture previously described – Excite your cushion with vibration – Identify your three important regions from the
Transmissibility Plot • 1:1 Coupling • Amplification • Attenuation
– Repeat for all static loadings • Typically minimum of 5 loadings
24

Vibration Dynamics – T Plots
25

26
Vibration Dynamics Amplification / Attenuation Plot
• Point pick the three important regions in the Transmissibility Plots to build an A/A Plot.
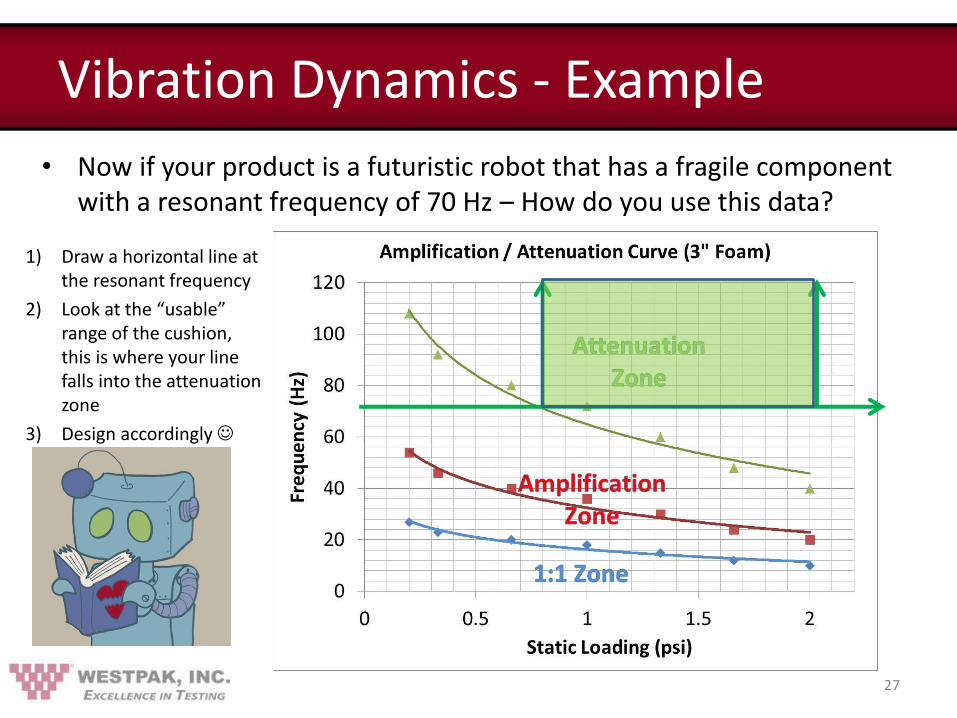
Vibration Dynamics - Example
• Now if your product is a futuristic robot that has a fragile component with a resonant frequency of 70 Hz – How do you use this data?
27
1) Draw a horizontal line at the resonant frequency
2) Look at the “usable” range of the cushion, this is where your line falls into the attenuation zone
3) Design accordingly
28
QUESTIONS??

29
Impact (shock) Dynamics
• This characteristic is measured using instrumented impacts resulting in a cushion curve.
• Typical procedures include:
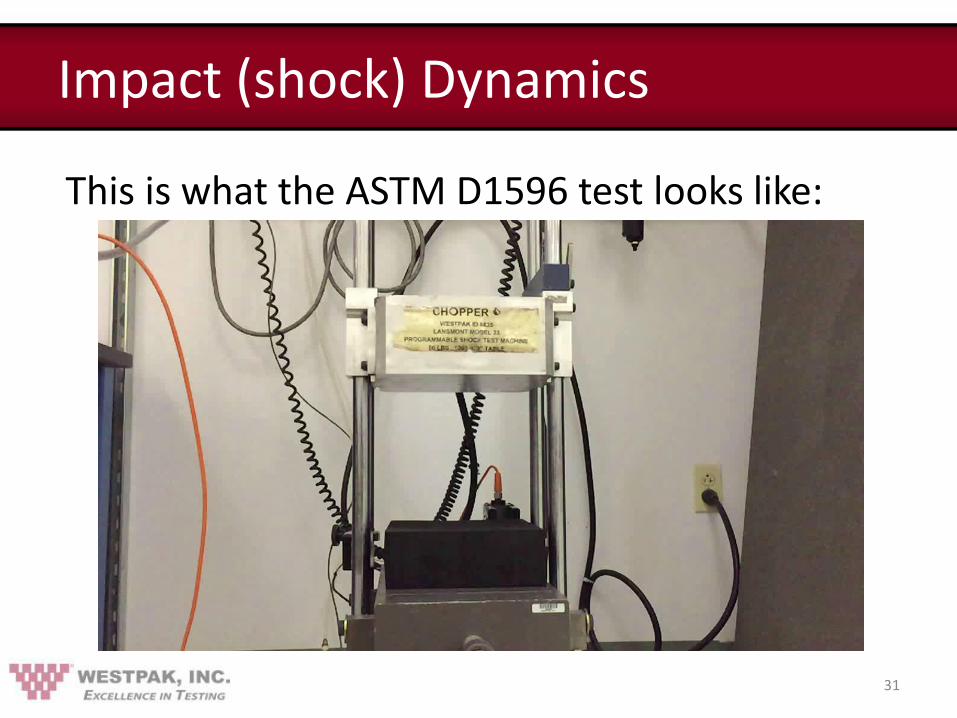
– ASTM D1596
– ASTM D4168
– MIL STD 26514E

Impact (shock) Dynamics
• How do we build a cushion curve plot to design a package? – Load your cushion at a specific loading
– Impact (shock) your cushion and record peak decelerations (G’s) • Throw out first value
• Average next four values
– Repeat for the other static loadings • Typically minimum of 5 loadings
– Repeat for other thicknesses • (if desired [optional])
30
31
Impact (shock) Dynamics
This is what the ASTM D1596 test looks like:
32
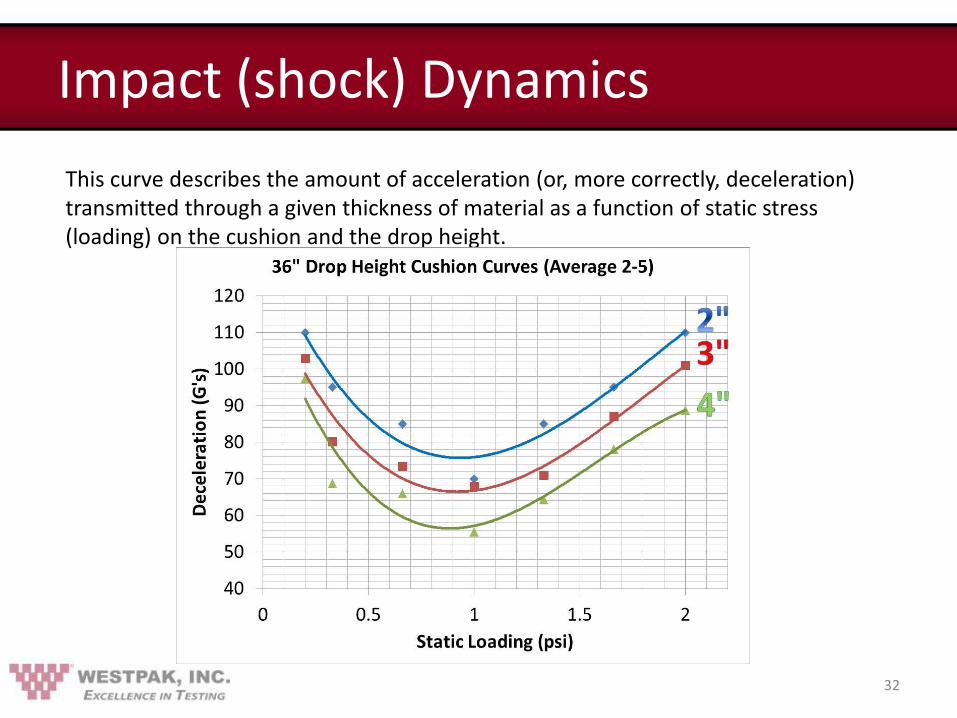
Impact (shock) Dynamics
This curve describes the amount of acceleration (or, more correctly, deceleration) transmitted through a given thickness of material as a function of static stress (loading) on the cushion and the drop height.

33
Impact (shock) Dynamics
A cushion curve shows peak acceleration on the vertical axis and static stress on the horizontal axis (static stress = weight/bearing area). Each curve is drawn from a minimum of 5 test points (static stress levels) and each test point is the average of the last 4 of 5 acceleration readings (impacts) of the cushion material.

Underloaded
• On the left side of the curve, the object does not have sufficient force (mass) to deflect the cushion and therefore resembles dropping a product onto a rigid surface
– Underloaded cushion
– Short pulse duration with high deceleration levels
34
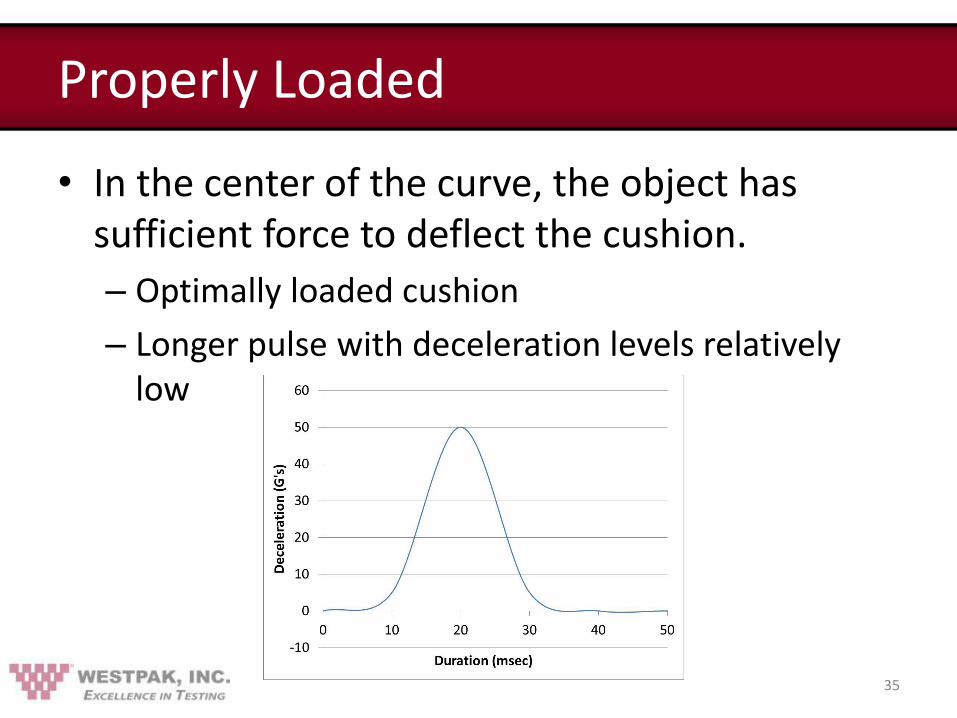
Properly Loaded
• In the center of the curve, the object has sufficient force to deflect the cushion.
– Optimally loaded cushion
– Longer pulse with deceleration levels relatively low
35
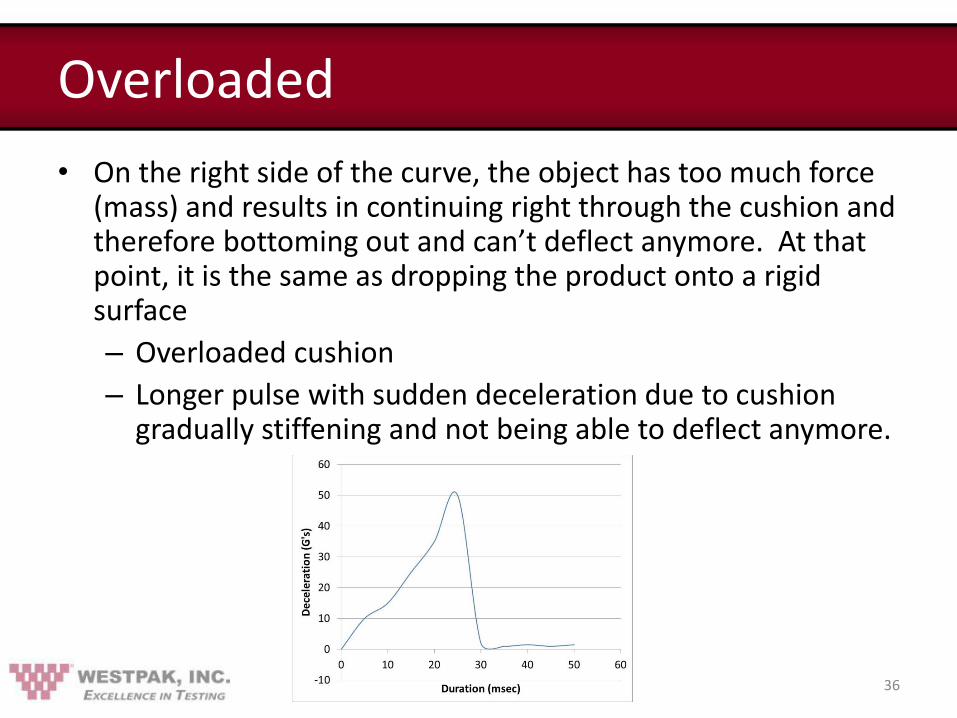
Overloaded
• On the right side of the curve, the object has too much force (mass) and results in continuing right through the cushion and therefore bottoming out and can’t deflect anymore. At that point, it is the same as dropping the product onto a rigid surface
– Overloaded cushion
– Longer pulse with sudden deceleration due to cushion gradually stiffening and not being able to deflect anymore.
36

37
Impact (shock) Dynamics
It is desirable to use cushions in the lower portion ("belly") of the curve where performance is optimum. When the product critical acceleration, weight and design drop height are known, the usable static stress range of cushion area can be determined for a given material and thickness.

38
Impact (shock) Dynamics - Example
• Now if your product is a futuristic laser that has a fragile component with a critical acceleration (Ac) of 70 G’s – How do you use this data?
1) Draw a horizontal line at the Critical Acceleration
2) Look at the “usable” range of the cushion, this is where your line is UNDER 70 G’s
3) Design accordingly
3” Range
4” 4”

39
Designing the Optimum Cushion System
Selecting Cushion Thickness
Assume the cushion material behaves as a linear spring and look solely at the total deflection necessary to achieve the required deceleration from the design drop height. This deflection is estimated by: ∆x = 2h / (A - 2) where: ∆x = cushion deflection in cm (or inches) h = drop height in cm (or inches) A = the required deceleration level (G's)

40
Designing the Optimum Cushion System
• ∆x = theoretical deflection necessary, not the overall cushion thickness.
• Most foam cushions will compress 40 to 60% before "bottoming out".
• More flexible materials such as polyurethane foam will compress up to 80% before it bottoms out.

41
Designing the Optimum Cushion System
DESIGN EXAMPLE: A product has a fragility of 50 G's and a design drop height of 90 cm. (35 inches). The theoretical deflection is calculated from the formula: ∆x = (2 x 90) / (50-2) = 3.75 The resulting theoretical deflection is 3.75 cm Total cushion thickness necessary for the individual materials is: MATERIAL OPTIMUM STRAIN % TOTAL THICKNESS
cm inches EPS foam 40% 9.4 (3.75/.4) 3.7 PE foam 50% 7.5 (3.75/.5) 3.0 Polyurethane foam 70% 5.4 (3.75/.7) 2.1

42
Designing the Optimum Cushion System
Static Loading Determination • The optimum static stress loading is determined from a Cushion
Curve and the Amplification/Attenuation Plot for that material.
• Any portion of the cushion curve that lies below the product fragility level will define a static stress loading capable of transmitting less than the critical acceleration to the product.
• For optimum material usage, it is normally desirable to load the cushion to the highest static stress allowed by the curves.

43
Designing the Optimum Cushion System
Static Loading
Determination
Impact (Shock) Ac = 70 G’s
Vibration Fn = 70 Hz
Combined Range 0.80 psi < RANGE < 1.33 psi
Range: Range > 0.80 Hz
Range: 0.66 psi < Range < 1.33 psi
44
Designing the Optimum Cushion System
Points to remember!!! • Don’t ignore vibration. It’s 100% certain and
can be very destructive.
• Sometimes the Vibe & Impact loadings don’t overlap. In this case, rely on the Vibe loading value.
• The procedure used for running cushion curves may have a significant effect on the usefulness of the data.
• The use of ribs in the cushion design can have a very positive result on the design effectiveness.

45
Designing the Optimum Cushion System
The Use of Ribs (non-linear cushions)
Ribbed (non-linear)
design
Rectangular (linear)
design
46
Designing the Optimum Cushion System
The Use of Ribs (non-linear cushions)
1. In general, the depth of a rib should be approximately 1/2 to 2/3 total cushion thickness.
2. The cross sectional area of material at zero deflection should yield a static loading of 2 or more times the optimum static stress obtained from a cushion curve for that material, thickness and drop height.
3. The cross sectional area of a rib at 25% total deflection should be approximately equal to that which would give the optimum loading for that material from a representative cushion curve.
47
Designing the Optimum Cushion System
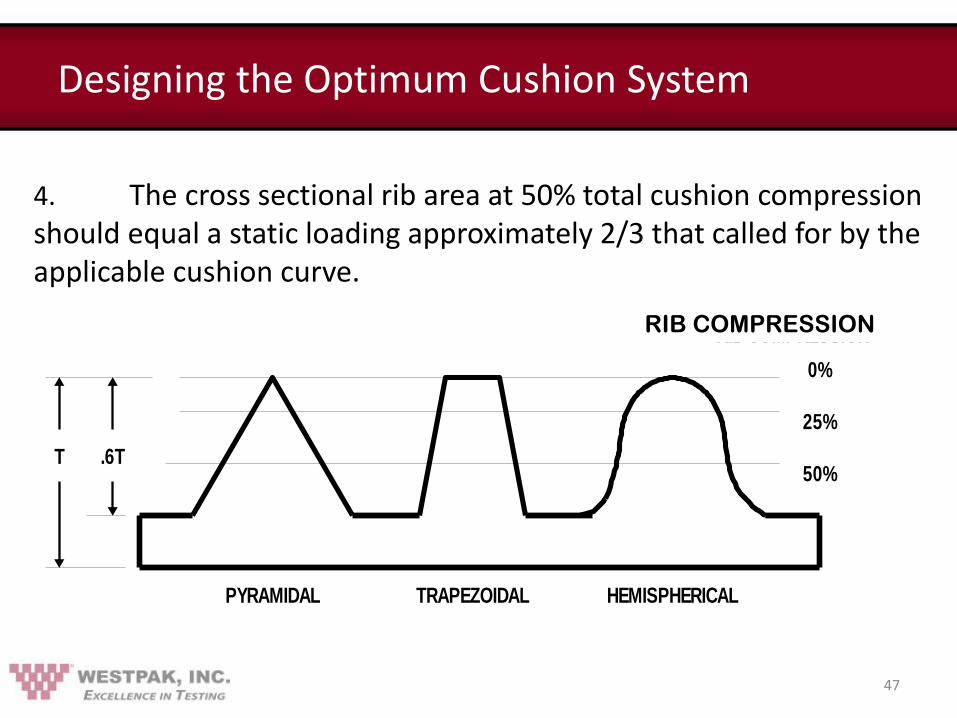
4. The cross sectional rib area at 50% total cushion compression should equal a static loading approximately 2/3 that called for by the applicable cushion curve.
RIB COMPRESSION
50%
25%
0%
.6TT
PYRAMIDAL TRAPEZOIDAL HEMISPHERICAL
RIB COMPRESSION

48
Designing the Optimum Cushion System
The Use of Ribs (non-linear cushions)
• Most rib designs are trapezoidal in cross section.
• From a theoretical standpoint the best rib design is a pyramidal cross section.
• A hemispherical cross section also is a good theoretical design.
• Vibration response of a cushion material can be substantially improved through the use of ribs.
49
Designing the Optimum Cushion System
The Use of Ribs (non-linear cushions)
• High static loading at the peak of the rib will result in a lower natural frequency for the cushion system.
• The force levels associated with environmental vibration are relatively small and therefore the deflection of the cushion is correspondingly small.
• Deflection will occur at the point of maximum stress and if this is the peak of the rib, that area will strongly influence the vibration characteristics of the entire package system.

50
Other Issues:
FABRICATION FACTORS • Sustainability: don’t glue foam to corrugated, etc.
• Highest yield = lowest cost
• Package suppliers have the best ideas for this.
NESTING • Cushions are bulky. Nesting is vital for shipping & storage.
CORNER PROTECTION • Most impacts in distribution are on the corners of shipping
containers.
• “Void corners” are a big source of damage during shipment for otherwise well designed product/package systems.

51
Other Issues:
TEST PROCEDURES
• Different cushion test procedures will result in different design data. Learn to use the data best suited for your purpose.
• Different finished package test procedures will likewise give potentially different test results.
OTHER ISSUES
• Deformable cushion systems are harder to evaluate than (nearly) 100% rebounding systems.
• However, similar design and evaluation techniques can be used.
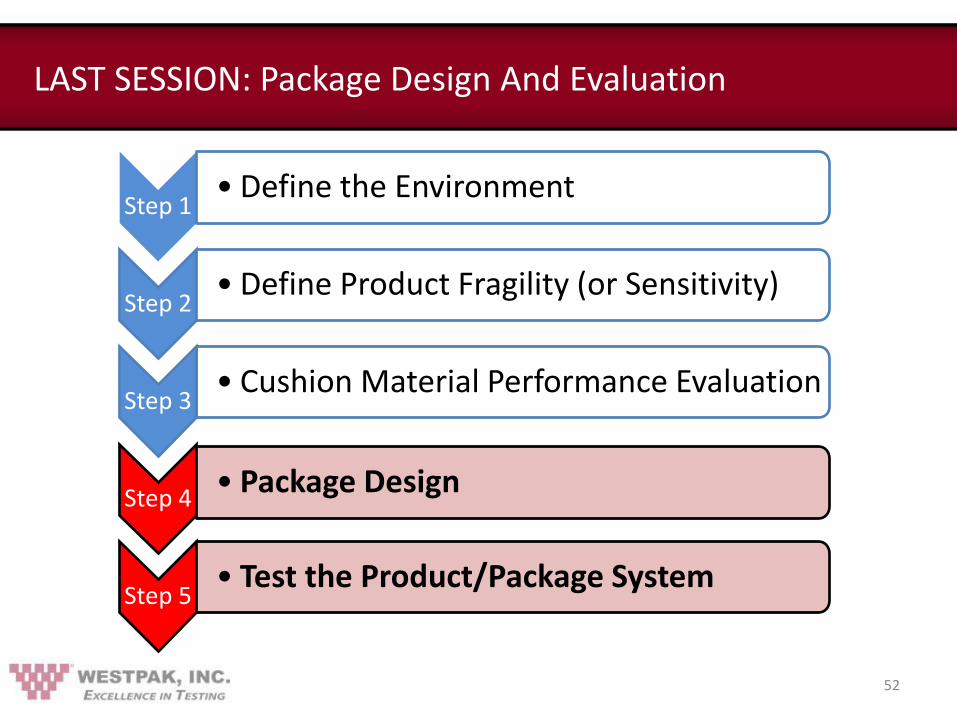
LAST SESSION: Package Design And Evaluation
Step 1 • Define the Environment
Step 2 • Define Product Fragility (or Sensitivity)
Step 3 • Cushion Material Performance Evaluation
Step 4 • Package Design
Step 5 • Test the Product/Package System
52

53
QUESTIONS??

Next Webinar: Packaging Dynamics Series
54
#1: Overview and Definition of Terms – Jan 2015
#2: Defining & Quantifying the Distribution Environment Through Which All Products Must Travel – March 2015
#3: Determining the Vibration Sensitivity & Shock Fragility of Products; Test Methods, End Results, and Significant Insights
#4: Dynamic Cushion Testing for Shock Absorption & Vibration Attenuation – July 2015 DONE !
#5: Design and Testing of the Protective Package System; How We Know When the Job Was Done Correctly – September 2015
DONE !
DONE !
DONE !
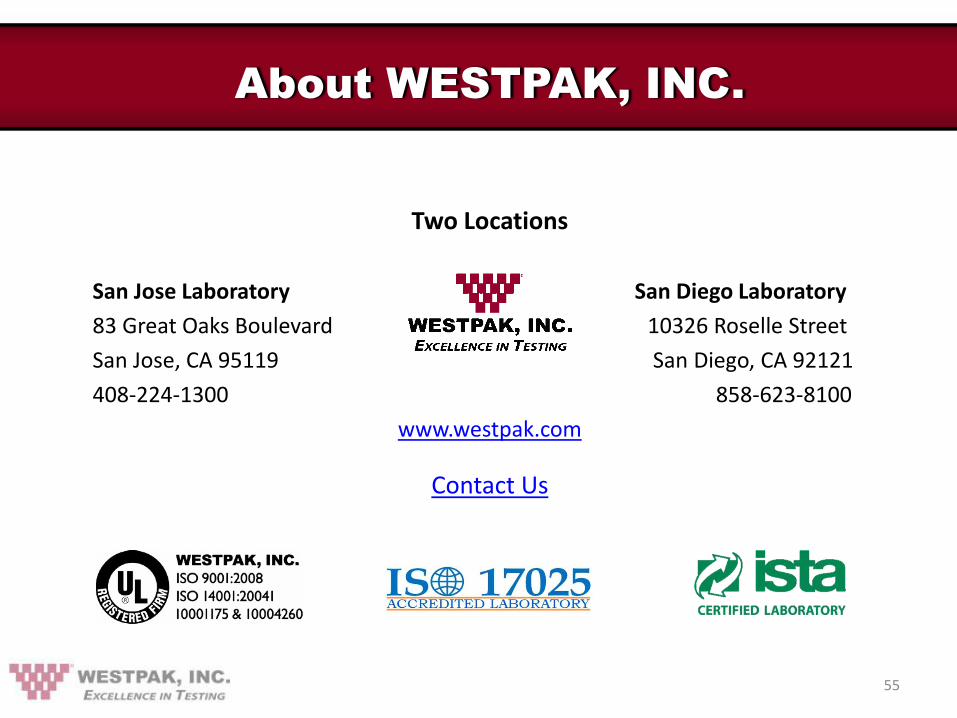
About WESTPAK, INC.
55
Two Locations
San Jose Laboratory San Diego Laboratory
83 Great Oaks Boulevard 10326 Roselle Street
San Jose, CA 95119 San Diego, CA 92121
408-224-1300 858-623-8100
www.westpak.com
Contact Us

THANK YOU !
56
Edmund Tang Laboratory Manager
Herb Schueneman President & CEO
Please feel free to Contact Us with any questions or assistance with your testing needs.