Chichaqua Bottoms Greenbelt Management Plan 2016 … · Chichaqua Bottoms Greenbelt Management Plan...
33
1 Chichaqua Bottoms Greenbelt Management Plan 2016-2036 August 2, 2016 Vision: The adaptive management of Chichaqua Bottoms Greenbelt will seek to sustain and enhance the native communities and ecological functions characteristic of a climate-resilient mosaic of wetlands, grasslands, and floodplain forests. To achieve this vision, Chichaqua Bottoms Greenbelt will be managed to achieve five key objectives, identified below. Each objective is a scaffold to which short-term (1-10 years), medium-term (11-25 years), and long- term (25+ years) goals are mapped. Each goal is further development with hypothesized performance measures and targets that identify success. This document will serve as guide for coordinating the work of Polk County Conservation Board, The Iowa Department of Natural Resources, and the Natural Resource Conservation Service within the context of the Iowa Wildlife Action Plan (IWAP; see http://www.iowadnr.gov/Conservation/Wildlife- Stewardship/Iowa-Wildlife-Action-Plan). Objective A: Management at Chichaqua Bottoms Greenbelt will focus on maintaining permanent wetlands that can withstand periods of exceptional drought (e.g., 100 year events; drought that lasts for 2+ years). In addition, management at Chichaqua Bottoms Greenbelt will create capacity to slow and hold water during periods of flooding. We know that fall, winter and spring are projected to be wetter as climate changes over the next 100 years. Rain events are projected to be higher intensity events, with 5-7’’ localized events possible each year (Berendzen et al. 2010). Summers are projected to be substantially hotter – between 10-33 days each summer will have high temperatures in excess of 100 o F (see Union of Concerned Scientists 2009). Management must explicitly anticipate the twin disturbances of flooding and occasional prolonged summer drought, particularly given that a majority of the species of greatest conservation need dwell in wetlands and flowing aquatic systems (see IWAP). The hydrological function of Chichaqua bottoms should emphasize resilience – the ability to experience a disturbance and return to baseline conditions as quickly as possible. Within the context of climate change challenges, management of CBG must emphasize the following short-, medium-, and long-term goals: o Short-term: All agencies charged with managing Chichaqua Bottoms Greenbelt need to have a better understanding of the surface and ground water budgets for Chichaqua Bottoms. This involves collecting data on both ground and surface water inflows, outflows, residence times, and flow accumulations from the sub-
Transcript of Chichaqua Bottoms Greenbelt Management Plan 2016 … · Chichaqua Bottoms Greenbelt Management Plan...

1
Chichaqua Bottoms Greenbelt Management Plan 2016-2036
August 2, 2016
Vision: The adaptive management of Chichaqua Bottoms Greenbelt will seek to sustain and
enhance the native communities and ecological functions characteristic of a climate-resilient
mosaic of wetlands, grasslands, and floodplain forests. To achieve this vision, Chichaqua
Bottoms Greenbelt will be managed to achieve five key objectives, identified below. Each
objective is a scaffold to which short-term (1-10 years), medium-term (11-25 years), and long-
term (25+ years) goals are mapped. Each goal is further development with hypothesized
performance measures and targets that identify success. This document will serve as guide for
coordinating the work of Polk County Conservation Board, The Iowa Department of Natural
Resources, and the Natural Resource Conservation Service within the context of the Iowa
Wildlife Action Plan (IWAP; see http://www.iowadnr.gov/Conservation/Wildlife-
Stewardship/Iowa-Wildlife-Action-Plan).
Objective A: Management at Chichaqua Bottoms Greenbelt will focus on maintaining
permanent wetlands that can withstand periods of exceptional drought (e.g., 100 year events;
drought that lasts for 2+ years). In addition, management at Chichaqua Bottoms Greenbelt will
create capacity to slow and hold water during periods of flooding.
We know that fall, winter and spring are projected to be wetter as climate changes over
the next 100 years. Rain events are projected to be higher intensity events, with 5-7’’
localized events possible each year (Berendzen et al. 2010). Summers are projected to
be substantially hotter – between 10-33 days each summer will have high temperatures
in excess of 100oF (see Union of Concerned Scientists 2009). Management must
explicitly anticipate the twin disturbances of flooding and occasional prolonged summer
drought, particularly given that a majority of the species of greatest conservation need
dwell in wetlands and flowing aquatic systems (see IWAP). The hydrological function of
Chichaqua bottoms should emphasize resilience – the ability to experience a
disturbance and return to baseline conditions as quickly as possible.
Within the context of climate change challenges, management of CBG must emphasize
the following short-, medium-, and long-term goals:
o Short-term: All agencies charged with managing Chichaqua Bottoms Greenbelt
need to have a better understanding of the surface and ground water budgets
for Chichaqua Bottoms. This involves collecting data on both ground and surface
water inflows, outflows, residence times, and flow accumulations from the sub-
2
watersheds that feed the preserve (see Michigan DNR 2010). Any management
directed at slowing water or developing more stable hydroperiods will require
these data to ensure that water is not slowed to the point of over-watering
private property.
Performance Measure: Number of sub-watersheds with water budgets.
Target: By 2020, have water budgets for four subwatersheds: Button Bush
(2), Bluff Creek, and Mountain Farm.
o Short-term: Continue to develop collaborative partnerships with neighboring
landowners to reduce siltation and nutrient supplementation via the drainage
districts that provide the majority of surface flow into the preserve (Appendix A
& B; see also Helmers et al. 2011). Develop collaborations with the NRCS to
promote the adoptions of appropriate practice standards on working lands and
to ensure that riparian lands within CBGB are managed appropriately.
Performance Measure: Water quality – nitrate levels and turbidity
Target: Establish baseline water quality assessments for four
subwatersheds with surface water inflows: Buttonbush (2), Bluff Creek,
and Mountain Farm. Seek to reduce nitrate loading by 2020.
o Medium-term: Enhance the quality of the fisheries at Chichaqua Bottoms. Use
controlled drawdowns to manage nuisance species out of the system (e.g., Carp;
see Kolar and Lodge 2002).
Performance measure: Fish populations.
Target: Asian Carp prevented from establishing; crappie, bluegill fisheries
enhanced through stocking.
o Medium-term: Increase capacity of all oxbows to hold water by diverting surface
flows within the preserve to hydrate the old Skunk River system of wetlands and
oxbows (see Figure 1). Where appropriate, reintroduce meanders to slow flow
rates.
Performance Measure: Surface water residence time.
Target: Areas capable of retarding water through August under normal
rainfall increase from baseline by 25%.
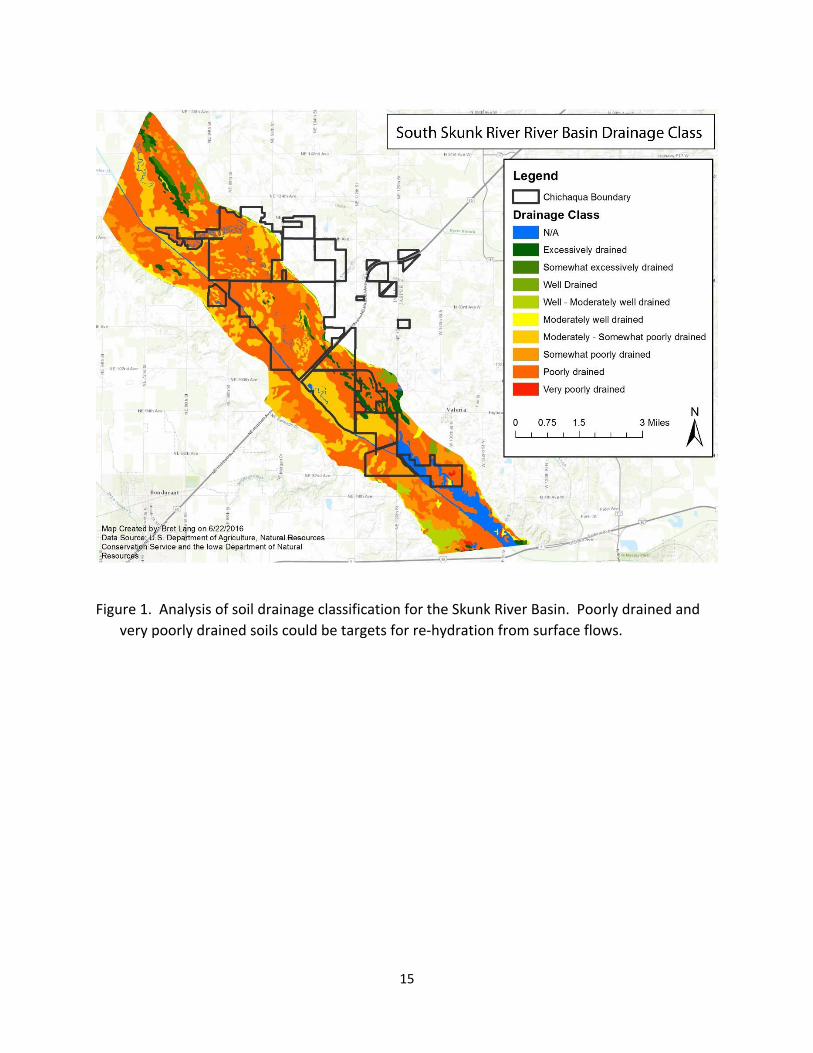
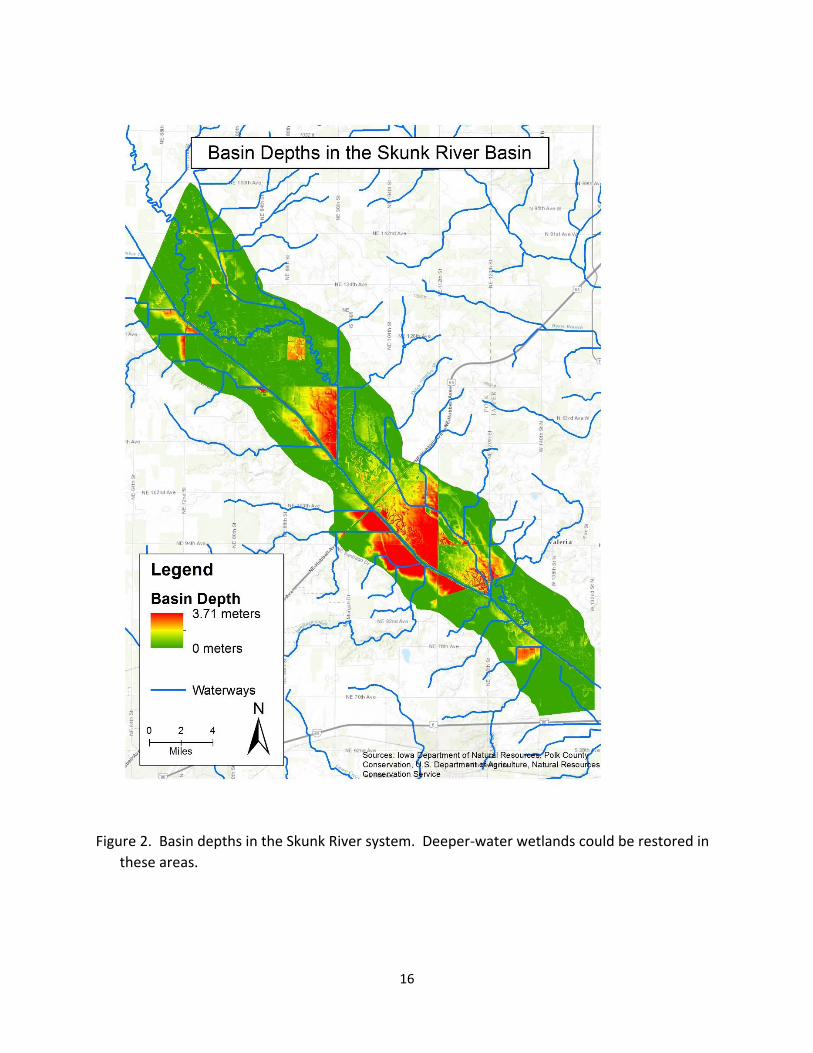
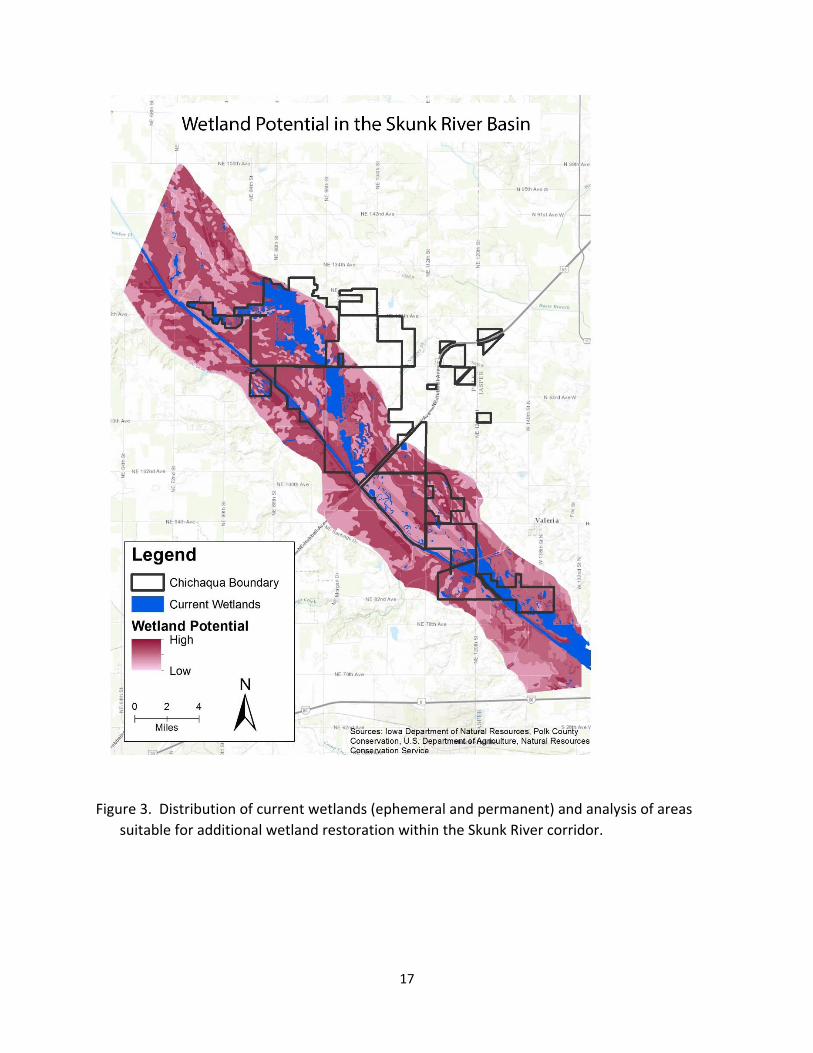
o Medium-term: Identify sites in the toe slope of the Skunk River Valley where
groundwater-fed wetlands can be constructed to improve the availability of
deep-water wetlands (Figures 2 & 3; see also Semlitsch and Bodie 2002).
Performance Measure: Number of deep-water wetlands.
Target: Increase by 25% by 2025.
3
o Long-term: Actively manage drainage ditches to develop greater control of
surface water flows throughout Chichaqua Bottoms (see Crumpton et al. 2012).
Divert water from drainage ditches which are internal to CBGB to restore
wetlands and oxbows throughout the preserve.
Performance Measure: Percentage of drainage ditches in ownership.
Target: Acquire remaining 5% of ditch 52, increase ownership in ditch
38.
Target: Installation of water control structure on DD 52 south of 118th
Ave with gate valves capable of diverting water both to the east and
west. Fill all historic oxbows and channels where practical.
Objective B: Management at Chichaqua Bottoms will focus on developing and maintaining
connectivity among habitat types and minimizing the risks of mortality associated with dispersal
events. Connectivity is essential both within Chichaqua Bottoms and among the larger network
of natural areas in central Iowa (Erös and Grant 2015).
Connectivity is a scalar property of an ecosystem – what is functionally connected for
something like a bobcat may not be for something like a Blanding’s turtle (Emydoidea
blandingii) or a Plains Pocket Mouse (Perognathus flaviscens). The Skunk River
floodplain provides essential connectivity for more vagile species (those capable of
moving long distances). For species that are dispersal limited, management must focus
on maintaining connectivity at the scale of modal dispersal distances (Brooks 2003).
Need to seek strategies to minimize wildlife mortality on roadways (see Andrews et al.
2015). An ongoing multi-year research project with Drake University will deliver
recommendations on minimizing vehicle-wildlife conflicts. Utilization of drainage
networks as wildlife corridors can reduce vehicle-wildlife conflict. The current Skunk
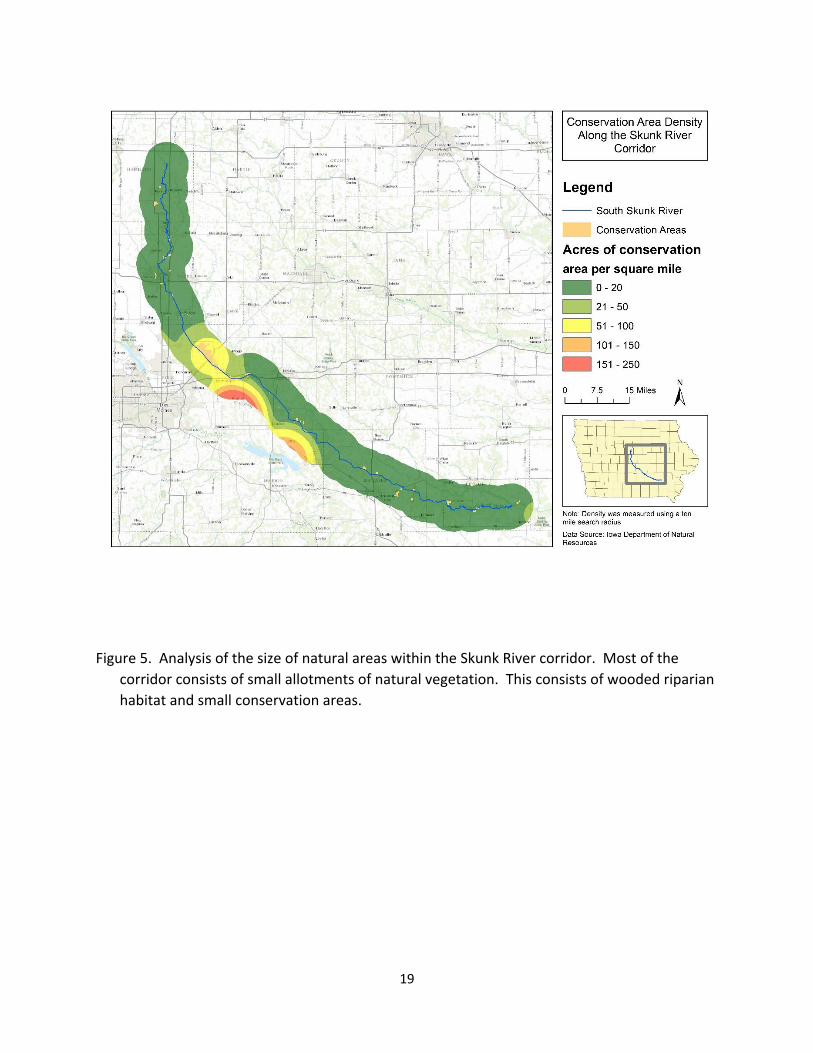
River corridor has relatively high connectivity but most of the natural areas are relatively
small in patch size (Figures 4 & 5).
Forb cover will be an essential strategy for maintaining connectivity of pollinators; use
of Asteraceae , Asclepediaceae, Leguminosea, Lamiaceae capture the hostplant needs of
a wide range of Lepidoptera and also serve as important nectar sources for beetles,
solitary bees, and honey bees (Apis mellifera) – see (http://www.xerces.org/pollinators-
great-lakes-region/).
The biggest limitation in the current wetland mosaic is the number and distribution of
deep water wetlands that can support Blanding’s Turtle (E. blandingii), River Otter
(Lontra canadensis), and Graham’s Crayfish snake (Regina grahamii) during periods of
drought. This maps back to Objective A.
To achieve higher levels of connectivity within CBG and among protected lands in this
landscape, management should focus on the following goals:
4
o Short-term: Grasslands, particularly those with grass-heavy plant populations
should be managed to increase cover of native forbs (Pollet et al. 2005).
Management units need to be visually assessed to provide a baseline forb/grass
ratio. Each management unit should be ranked according to prairie quality, and
those sites with the lowest quality should be prioritized for management. Sites
should be managed to achieve levels of forb cover consistent with the NRCS
Pollinator Iowa Habitat: Iowa Job Sheet (see:
www.nrcs.usda.gov/Internet/FSE_DOCUMENTS/nrcs142p2_007916.pdf). It will be
especially important to maintain forb species that bloom across the entire growing
season. A mix of disturbances can be used to improve forb cover, including
burning, haying, light disking, and grazing (Collins et al. 1998). Such human-
imposed disturbances should be deployed in such a way that affords recolonization
opportunities from adjacent unmanaged habitat (McGrannahan et al. 2012). Post-
disturbance monitoring will be critical to assess whether additional seeding or
transplanting of forb species (e.g.,Milkweeds [Asclepias spp.]) will be necessary to
achieve management goals.
Performance Measure: Prairies with of "grass heavy" units identified and
grass-forb ratio managed to reduce grass-dominance.
Target: Hay (cut and remove biomass) on 400-500 acres per year, in
rotation with another prescribed disturbance in adjacent year. Enrich
forb component by interplanting pollinator supporting species (see
Delaney et al. 2015). Select one grass heavy unit per year to mow short
and stress the reserves of the dominant grasses.
o Medium-term: Develop wildlife underpasses at known points of high mortality
along roads within CBG. Prioritize underpasses on paved roads relative to gravel
roads, as mortality is correlated with vehicle speeds and traffic volumes (both of
which are higher on paved roads). As plans for the Chichaqua Station are
implemented, give priority to minimizing wildlife mortality on NE126th.
Performance Measure: Vehicle mortality on interior roads within
Chichaqua Bottoms.
Target: Reduce mortality for herps and small mammals by 50% relative to
baseline. Assess use of wildlife underpass on NE126th and develop plans
to replicate in other high mortality zones.
o Medium-term: Create a system of vegetated “stepping stones” in the landscape
surrounding Chichaqua Bottoms Greenbelt. This will facilitate inter-preserve
connectivity for species with aerial dispersal capabilities (e.g., most grassland birds,
Regal Fritillaries, as emphasized in the IWAP; see also Forman 1995). Utilize
drainage networks to encourage dispersal along non-trafficked corridors. This will
help build connectivity for the regional constellation of natural areas in Polk and
5
Jasper County, including Errington Marsh, Chichaqua Bottoms, Neal Smith National
Wildlife Refuge, and Red Rock.
Performance Measure: Work with Polk and Jasper Secondary Roads to
develop a network of native vegetated roadsides and drainage corridors
leading outward from Chichaqua (Also Living Roadway Trust Fund).
Target: Increase native plantings on roads and ditches.
Performance Measure: Native roadside and ditch / grassed waterway
habitat between Errington, Neal Smith, and Indian Creek.
Target: Increase cover of native species.
o Long-term: Develop strategies to restore the oxbow habitat that extends from
Chichaqua Bottoms north, with an emphasis on connecting the currently held
system of oxbows with those on private lands (which are currently ditched to the
Skunk River).
Performance Measure: Property with remnant meander scars and
landowners who control that property.
Target: Approach a minimum of one landowner per year to discuss the
potential of protection, easement, or acquisition with the NRCS as a
partner.
Objective C: Management at Chichaqua Bottoms Greenbelt will focus on minimizing the
establishment and spread of new invasive species (e.g., Sericea lespedeza [Lespedeza cuneata];
Purple Loosestrife [Lythrum salicaria]). Particular attention should be given to understanding
new invasive species likely to spread through climate change (Water thyme [Hydrilla
verticillata]; Kudzu [Pueraria montana var. lobata]) (Hellman et al. 2008; Rahel and Olden
2008). These species are not currently documented from Iowa, but are likely to spread north
from Kansas and Missouri as climate changes (see
https://www.fws.gov/northeast/climatechange/stories/kudzu.html). Of special concern are
those species that are rhizomatous, have a long lived seed bank, or are resistant to standard
herbicide applications (DiTomaso 2000).
Some of the invasives that we manage for now will not be the ones we manage for in
50-100 years. Some current ‘invasives’ will enter into the collective psychology as
‘naturalized’ and the shifting baseline that biases managers to look at systems today as
‘natural’ will mean buckthorn, reed canary, and honeysuckle may not be the
management targets they are today. To the greatest extent possible, we must resist this
notion in the short-term and encourage management units to develop diverse
vegetation that resists invasion in the future (Funk et al. 2008).
Management should focus on the following goals:
6
o Short-term: For known areas of infestation, use stacked disturbance regimes
(herbicide, grazing, haying, burning, and mowing) to reduce cover (i.e, use
multiple disturbance regimes over multiple years). Aggressively combat new
infestations to limit the establishment of species such as Sericea lespedeza and
Purple loosestrife. Manage Reed canary grass [Phalaris arundinacea] so that it
represents less than 25% cover in management units, initially targeting the most
infested management units within Chichaqua Bottoms. Target areas of large
infestation with herbicides appropriate for the plant communities being
managed.
Performance Measure: Yearly survey of most units to identify potential
problems.
Target: A survey minimum of 1,500 ha per year by a competent botanist.
o Short-term: Establish monitoring protocols (gridding, drone surveys, meander
transects) to develop baseline assessment of current infestation levels. This will
also help provide a mechanisms for early detection of newly introduced
populations. Mapping known infestations in GIS will allow a more coordinated
approach to invasive species management by agency partners.
Performance Measure: Identify restoration sites that have been
compromised by invasives.
Target: Variable depending upon occurrence but all new sites should be
surveyed for the initial two years following establishment to catch early
problems.
o Medium-term: Persistent application of control techniques and move plant
communities through seral transition between weedy annuals and more native,
competitively superior perennial communities. Inter-seed annual weedy fields
with ‘nurse species’ that facilitate conversion to native perennials (Packard and
Mutel 1997). Design cost-effective perennial seed mixes with species that have
demonstrated tolerance to flooding (Middleton 1999). Also identify species
combinations that, along with disturbance, interact to resist invasion by P.
arundinacea.
Performance Measure: "Re-restoration" of compromised sites with 2-3
years of herbicide and cropping to remove offending pest before
reseeding.
Target: Intensively manage 2-3 areas of Reed canary grass infestation per
2-3 year interval. Begin with the most heavily infested sites identified as
part of baseline sampling.
7
o Long-term: Collaborate with land managers from MO, etc. to share data and
develop strategies to manage new invasive species that will become problematic
as climate changes (Hellmann et al. 2008). Develop a regional invasive species
management council perhaps modeled on the Hawkeye Cooperative Weed
Management Area) to facilitate technology transfer and track shifting
distribution of invasive species over time. Share advances in methodology,
technology, and herbicide chemistry to improve control of invasive species (e.g.,
mipncontroldatabase.wisc.edu).
Performance Measure: Participation in regional invasive species
management council.
Target: Meet twice per year to set goals for Chichaqua Bottoms, develop
specific methods for control of problem species, and share best practices
among stakeholder agencies.
Objective D: Management at Chichaqua Bottoms Greenbelt will anticipate and respond to
climate change.
Audubon’s Climate Report makes very clear that species such as Bobolink (Dolichonyx
oryzivorus), Blue-winged Teal (Anas discors), Wood Duck (Aix sponsa), Wood Thrush
(Hylocichla mustelina), and Henslow’s sparrow (Ammodramus henslowii ) will have
breeding distributions shift out of Iowa by 2050-2075. Instead, Iowa could provide
critical wintering ground for these species. We’re not really managing Chichaqua
Bottoms as wintering habitat, so this would necessitate a shift in thinking. The IWAP
offers clear assessments for our native bird species, the county and department of
natural resources should consider the value of selecting focal species to for annual
monitoring of populations (see http://climate.audubon.org/
Birds such as Bell’s Vireo (Vireo bellii) and Blue Grosbeak (Passerina caerulea) are
projected to nest more frequently in Iowa. These species prefer a more shrubby / edgy
habitat component than is currently valued at Chichaqua (Butler et al. 2015).
Species such as Grasshopper Sparrow (Ammodramus savannarum), Dickcissel (Spiza
americana), and Eastern Bluebird (Sialia sialis) are believed to have relatively stable
distributions under a range of climate change scenarios (see
http://climate.audubon.org/). These may be suitable longitudinal targets for
monitoring, in addition to species that are added to a monitoring list based on range
shifts (e.g., we should be monitoring Henslow’s Sparrow (A. henslowii) right now, but
perhaps shift to Bell’s in 50 years). See
http://climate.audubon.org/birds/henspa/henslows-sparrow for additional detail.
Projected impacts on game species are negligible, with a notable exception for
waterfowl (see https://www.nwf.org/Wildlife/Threats-to-Wildlife/Global-
Warming/Effects-on-Wildlife-and-Habitat/Birds-and-Waterfowl.aspx).
8
Importantly, many species phenologies are accelerated - birds arrive on territories
earlier, butterflies break diapause earlier, herps abandon hibernacula earlier. This
means current burn phenologies may need lagged back in spring by 1-2 weeks (or
moved to the dormant season) to prevent mortality of such animals (Navarro-Cano et al.
2015).
Forest cover in Iowa is projected to see a significant shift towards oak-hickory forest
types more characteristic of the central portion of Missouri. Species expected to decline
in Iowa as a result of Climate Change are White Oak (Quercus alba), Black Walnut
(Juglans nigra), and Black Cherry (Prunus serotina). Species projected to increase are
Mockernut / Pignut Hickories (Carya tomentosa / glabra), Chinquapin / Post Oaks
(Quercus muehlenbergi / stellata), and Honey Locust (Gleditsia triacanthos). The degree
of increase / decrease depends on the speed and magnitude of climate change. Green
Ash (Fraxinus pennsylvanica) is expected to increase regardless of climate model,
though I expect Emerald Ash Borer (Agrilus planipennis) to impact that. The shift from
our current forest composition to one more reminiscent of Missouri is also a function of
oak regeneration (post-colonization) and changes to hydrology within Chicahaqua. As a
result, the best management strategy for timber systems may be to set targets at
standing biomass (basal area / ha), canopy cover, age structure, diversity, and perhaps
the importance of certain genera (e.g., Quercus). Species that produce heavy seeds will
likely to unable to disperse at a rate consistent with the pace of climate change. These
species will require facilitated colonization; wind and water-dispersed species will
respond to climate change more quickly. Management should emphasize Swamp White
Oak (Quercus bicolor) savanna, which is nationally imperiled ecosystem. For more
information regarding forest species distribution and climate change, see
http://www.fs.usda.gov/ccrc/tools/forecasts).
It is clear that Aedes mosquitos, which are implicated in the spread of Dengue fever,
Yellow Fever, Chikungunya and the Zika virus, will colonize Iowa under most climate
change scenarios – perhaps as early as 2050 [note: Aedes albopictus has known
occurrences in Chichaqua Bottoms already. Aedes aegypti does not]. Management of
mosquito (and tick) populations really will be vital over the next 50 years (Dukes et al.
2009). Tick populations can be effectively managed with fire; mosquito populations can
be partly managed using biological control (bats, odonates, insectivorous birds). Polk
County Conservation Board should also follow developments in mosquito control from
wetland landscapes such as the Everglades in Florida (see, for an example, Kline 2007).
Beyond controlling these pest species, Polk County should place some urgency on
developing communication materials to address public concern regarding mosquito-
borne disease.
o Short-term: Develop a set of plant community cover targets for woodland,
savanna, grassland, wetland, and mid-seral habitat across the Chicahaqua
9
Landscape. Manage some habitats for mid-seral habitats that are valued by
shrub-carr butterfly, reptile and bird species. De-emphasize dogwood and
willows in favor of native Crabapple (Cratagus spp.; in woodland understories),
Lilacs (Ceonothis spp.), Prairie crabapple (Malus ioensis), American plum (Prunus
americana), Nannyberry (Viburnum lentago), and Spireas (Spirea spp.). Actively
manage out rhizomatous species Rubus (Blackberrty) and Rough and gray
dogwood (Cornus drummondii / racemosa). Developing fire intervals that allow
for development of 15-20% shrub cover cross the Chichaqua Landscape would
provide suitable habitat for species such as Bell’s Vireo (V. belii), Field Sparrow
(Spizella pusilla), and Dickcissel (S. americana).
Performance Measure: Range of diverse habitats across the landscape.
Target: Savanna, woodland and shrub land should be 25-35% of the area
with mesic soil and grasslands would comprise 65-75% of areas with xeric
soils.
o Short-term: Develop a comprehensive baseline inventory of the biodiversity at
Chichaqua Bottoms Greenbelt. This could be modeled on the highly successful
BioBlitz used at Whiterock Conservancy (and elsewhere). Expertise is urgently
needed for odonates, sedges, and other remnant-dependent insect taxa (the
Odonata, in particular, are given weight in the IWAP). As species lists develop,
the management plan (and management units) can be re-defined to
accommodate the needs of species of greatest conservation need.
Performance Measure: Flora and fauna lists for management units at
Chichaqua Bottoms Greenbelt.
Target: Conduct annual bioblitzes beginning in 2017.
o Medium-term: Develop timber stand management to remove non-native
species and encourage Oak (Quercus spp.), Maple (Acer spp.), Walnut (Juglans
nigra), and Sycamore (Platanus occidentalis) recruitment throughout the
woodland communities at Chichaqua. This will provide higher quality habitat for
a range of migratory passerines, including wood thrush (H. mustelina)
prothonotary warbler (Protonotaria citrea; in wooded oxbows), and black-
crowned night herons (Nycticorax nycticorax).
Performance Measure: Canopy cover within stands.
Target: Under 40% canopy cover for the majority of wooded (including
shrubland) portions of CBG.
Target: Treat 50 - 100 acres per year to remove invasives and some
native species to achieve under 50% canopy.
o Medium-term: Manage for Swamp White Oak (Quercus bicolor) savanna in
habitats where soils and hydrology (coarse, alluvial soils in floodplains and
10
upland swales) are conducive to its formation. This will provide additional
suitable habitat for species identified in the IWAP species as “in decline”, such as
red-headed woodpecker.
Performance Measure: Percent cover of Q. bicolor savanna
Target: Increase by 25% by 2025. Stand and kill target species of larger
tree species when opening the canopy and provide habitat for cavity
nesters.
o Long-term: Manage stands to encourage colonization of species whose range is
pushed north by climate change. Use timber stand improvement techniques to
remove non-native species that are predicted to increase in abundance with
climate change (e.g., black locust).
Performance Measure: Restore former bottomland oak savanna where
indicated by historical photographs
Target: 40 to 60 acres per year
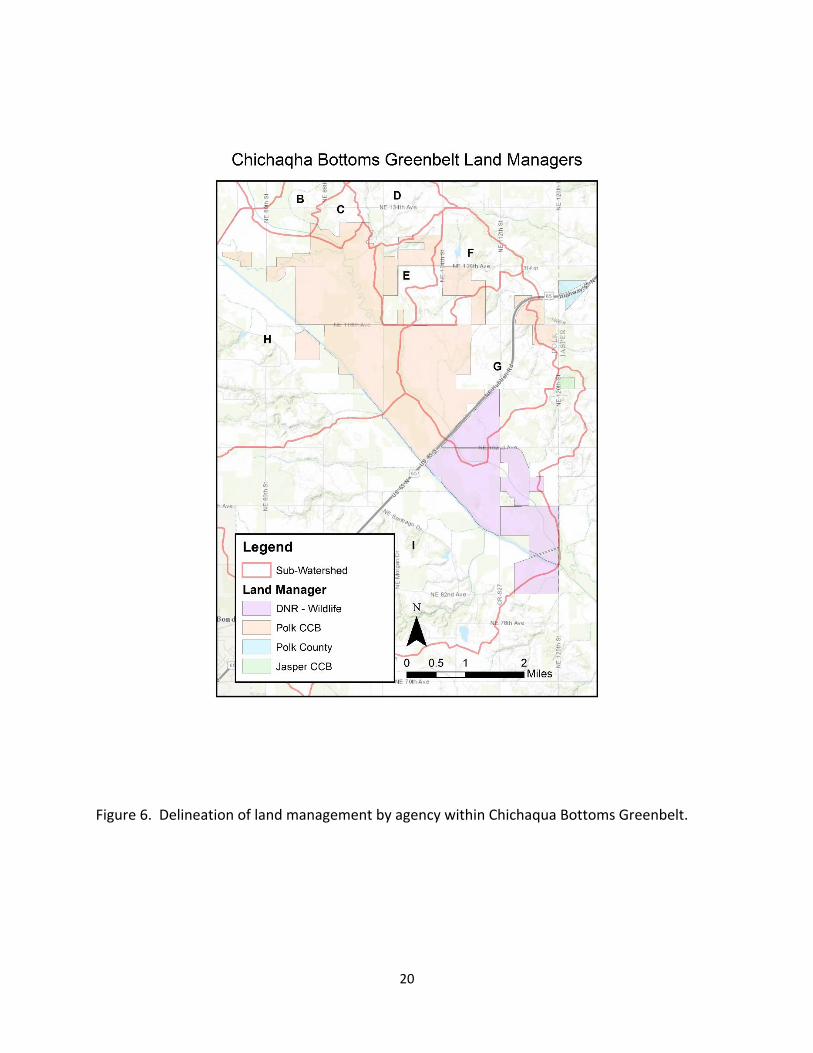
Objective E: Management at Chichaqua Bottoms Greenbelt will continue to be collaborative
(see Figure 6), but will more explicitly engage the working lands that surround the preserve and
the agencies that manage natural resources in the larger landscape (e.g., the Army Corps of
Engineers and US Fish and Wildlife Service).
A ‘fortress’ Chichaqua approach to management, whereby the 3 critical agencies
(PCCB,NRCS,IADNR) collaborate but are subject to shifting patterns of land use and
development in the surrounding landscape will jeopardize the ability of the preserve to
reach the targets for the performance measures that will be delineated for objectives A-
D (see especially Harr et al. 2014). The three agencies must emphasize success stories
within the natural area for demonstration to regional stakeholders.
Many species – Bobcat (Lynx rufus), Blanding’s Turtle (E. blandingii), Regal Fritillary
(Speyeria idalia), Bull Snake (Pituophis catenifer sayi), Ornate Box Turtle (Terrapene
ornata ornata), Henslow’s Sparrow (A. henslowii), Plains Pocket Mouse (P. flaviscens),
Western Fringed Prairie Orchid (Platanthera praeclara), and Bell’s Vireo (V. belii) cannot
be reasonably presumed to be viable when restricted to single sites (even if those sites
are large). Rather, we should come to expect that such species will experience local
extinction from both planned and unplanned disturbance and that such species will
persist in time by finding refugia on private land or within a more connected central
Iowa landscape. Managing such metapopulations will require a more landscape-scale
approach to ecological restoration (see Fahrig and Merriam 2002).
Coordinating the application of disturbance across multiple agencies will manage the
ecosystems of central Iowa at a more realistic, ecological (and, perhaps, evolutionary)
11
scale. Coordinated provision of refugia will afford suites of species to persist as meta-
communities rather than single assemblages within a single natural area.
o Short-term: Leverage existing collaborative relationships to develop a
community of partners that engage in the restoration of CBG. Promote field
days and tours of the preserve to connect people to the ongoing management of
the preserve as well as management on private lands. Conduct threat
assessment on both CBG ground and private lands to target management and
cultivate partnerships in areas that pose the highest threat to Chichaqua
Bottoms.
Performance Measure: Identification of critical threats to the biological
integrity of CBG and approach agency partners and private landowners to
engage them in a solution.
Target: One project per year minimum, including internal projects that
coordinate work among agencies.
o Medium-term: Facilitate externalized technology transfer based on lessons
learned from management of the natural resources at Chichaqua Bottoms to
private lands surrounding Chichaqua Bottoms Greenbelt. Sub-watersheds that
feed into Chichaqua have been mapped as assessed for potential threats
associated with erosion and soil loss and those data have been given to Polk
County Conservation Board.
Performance Measure: One additional partner per year.
Target: Years 1-4 one partner per sub-watershed as identified above,
leveraging funds such as EQUIP and REAP.
o Long-term: Increase the adoption of conservation measures on private lands in
the sub-watersheds that directly impact Chichaqua Bottoms (see
http://www.nrcs.usda.gov/wps/portal/nrcs/detail/ia/programs/?cid=nrcs142p2_
007947).
Performance Measure: Amount of siltation delivered per watershed.
Target: One project per sub-watershed per year.
o Long-term: Increase opportunities for formal and informal education at on-site
education and training facilities supporting the study of restoration, biodiversity,
nutrient recycling, geology, hydrology, and biological sciences.
Performance measure: Number of education and training sessions
offered for the public / professional community.
Target: Designate a temporary field station in one year, construct a
permanent station in 3-5 years.
12
Literature Cited
Andrews, K.M., P. Nanjappa, and S.P.D. Riley. 2015. Roads and ecological infrastructure:
concepts and applications for small animals. Johns Hopkins Press, New York.
Berendzen et al. 2011. Climate change impacts in Iowa. Available at:
http://climate.engineering.iastate.edu/Document/Olson_Amend_Report.pdf
Brooks, C.P. 2003. A scalar analysis of landscape connectivity. Oikos 102: 433-439.
Butler, C.J., N. Hillis, and K. Hucks. 2015. Status of 10 bird species of conservation concern in US
Fish and Wildlife Service Region 6: Volume III. US Fish and Wildlife Service, Denver,
Colorado.
Collins, S.L., A.K. Knapp, J.M. Briggs, J.M. Blair, and E.M. Steinauer. 1998. Modulation of
diversity by grazing and mowing in native tall grass prairie. Science 165: 500-503.
Crumpton, W., A. van der Valk, W. Hoyer, and D. Osterberg. 2012. Wetland restoration in
Iowa: Challenges and Opportunities. The Iowa Policy Project, Iowa City, Iowa.
Delaney, J.T., K.J. Jokela, and D.M. Debinski. 2015. Seasonal succession of pollinator floral
resources in four types of grasslands. Ecosphere 6: 1-14.
DiTomaso, J.M. 2000. Invasive weeds in rangelands: species, impacts, and management. Weed
Science 48: 255-265.
Dukes, J.S. et al. 2009. Responses of insect pests, pathogens, and invasive plants to climate
change in forests of northeastern North America. Canadian Journal of Forest Research 39:
231-248.
Erös, T. and E. Grant. 2015. Unifying research on fragmentation of terrestrial and aquatic
habitats: patches, connectivity, and the matrix in rivers60capes. Freshwater Biology 60:
1487-1501.
Fahrig, L., and G. Merriam. 2002. Conservation of fragmented populations. Conservation
Biology 8: 50-59.
Forman, R.T.T. 1995. Some general principles of landscape and regional ecology. Landscape
Ecology 10: 133-142.
13
Funk, J.L., E.E. Cleland, K.N. Suding, and E.D. Zavaleta. 2008. Restoration through reassembly:
plant traits and invasion resistance. Trends in Ecology and Evolution 23: 695-703.
Harr, R.N., L. Wright-Morton, S.R. Rusk, D.M. Engle, J.R. Miller, and D. Debnski. 2014.
Landowners’ perception of risk in grassland management: woody plant encroachment and
prescribed fire. Ecology and Society 19: 41.
Hellmann, J.J., J.E. Byers, B.G. Bierwagen, and J.S. Dukes. 2008. Five potential consequences of
climate change for invasive species. Conservation Biology 22: 534-543.
Helmers, M. et al. 2011. Sediment removal by prairie filter strips in row-cropped ephemeral
wetlands. Journal of Environmental Quality 41: 1531-1539.
Kline, D.J. 2007. Semiochemicals, traps/targets and mass trapping technology for mosquito
management. Journal of the American Mosquito Control Association 23: 241-251.
Kolar, C.S. and D. M. Lodge. 2002. Ecological predictions and risk assessment for alien fishes in
North America. Science 298: 1233-1236.
McGranahan, D.A., D. M. Engle, S. D. Fuhlendorf, J. R. Miller, and D.M. Debinski. 2012. Spatial
heterogeneity across five rangelands managed with pyric-herbivory. Journal of Applied
Ecology. [doi: 10.1111/j.1365-2664.2012.02168.x
Michigan Department of Natural Resources. 2010. General guidelines for calculating a water
budget. Available at: http://www.michigan.gov/documents/deq/lwm-
waterbudget_202791_7.pdf
Middleton, B. 1999. Wetland restoration, flood pulsing, and disturbance dynamics. Wiley
Press, New York.
Navarro-Cano, J.A., B. Karlsson, D. Posledovich, T. Toftgaard, C. Wiklund, J. Ehrlén, and K.
Gotthard. 2015. Climate change, phenology, and butterfly host plant utilization. Ambio 44:
78-88.
Packard, S., and C. Mutel. 1997. The tallgrass restoration handbook: for prairies, savannas, and
woodlands. Island Press, Washington, DC.
Polley, H.W., J.D. Derner, and B.J. Wilsey. 2005. Patterns of plant species diversity in remnant
and restored tall grass prairie. Restoration Ecology 13: 480-487.

14
Rahel, F.J., and J.D. Olden. 2008. Assessing the effects of climate change on aquatic invasive
species. Conservation Biology 22: 521-533.
Semlitsch R.D., and J.R. Bodie. 2002. Biological criteria for buffer zones around wetlands and
riparian habitats for reptiles and amphibians. Conservation Biology 17: 1219-1228.
Union of Concerns Scientists. 2009. Confronting climate change in the in the U.S. Midwest:
Iowa. Available at:
www.ucsusa.org/sites/default/files/legacy/assets/documents/global_warming/climate-
change-iowa.pdf
15
Figure 1. Analysis of soil drainage classification for the Skunk River Basin. Poorly drained and
very poorly drained soils could be targets for re-hydration from surface flows.
16
Figure 2. Basin depths in the Skunk River system. Deeper-water wetlands could be restored in
these areas.
17
Figure 3. Distribution of current wetlands (ephemeral and permanent) and analysis of areas
suitable for additional wetland restoration within the Skunk River corridor.

18
Figure 4. Distance among natural areas within the Skunk River corridor. Surprisingly, there are
only a few areas where inter-patch distances > 5 km.
19
Figure 5. Analysis of the size of natural areas within the Skunk River corridor. Most of the
corridor consists of small allotments of natural vegetation. This consists of wooded riparian
habitat and small conservation areas.
20
Figure 6. Delineation of land management by agency within Chichaqua Bottoms Greenbelt.
21
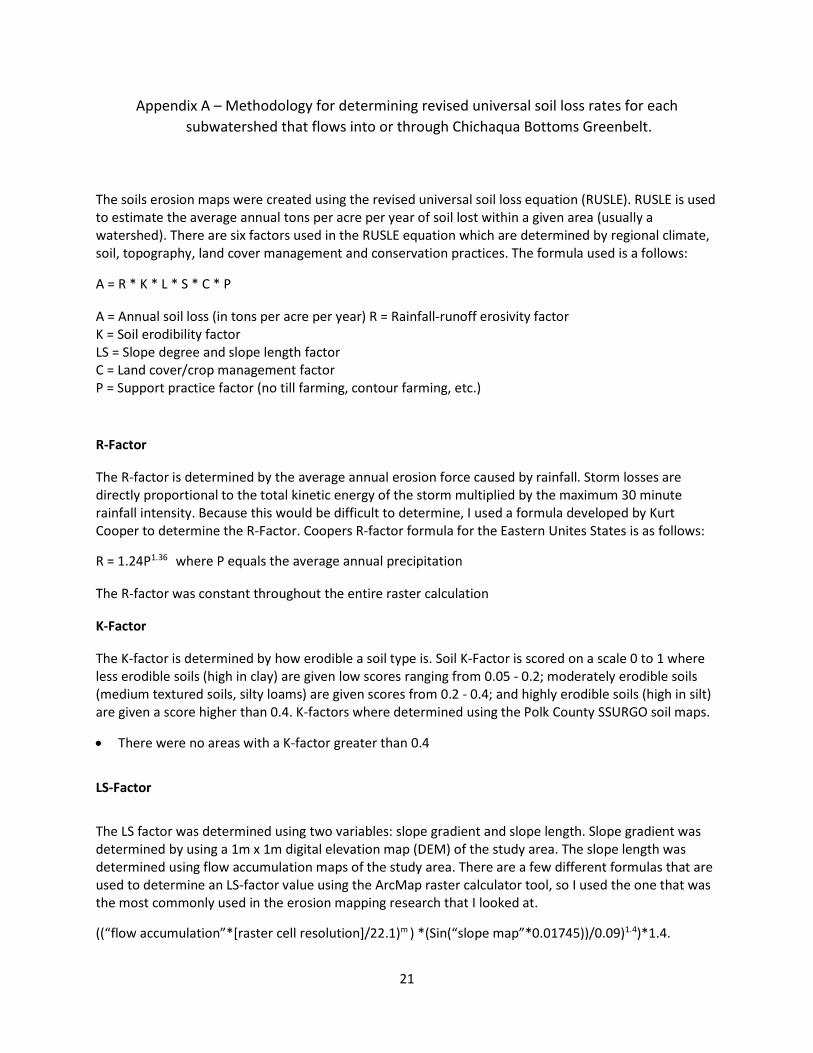
Appendix A – Methodology for determining revised universal soil loss rates for each
subwatershed that flows into or through Chichaqua Bottoms Greenbelt.
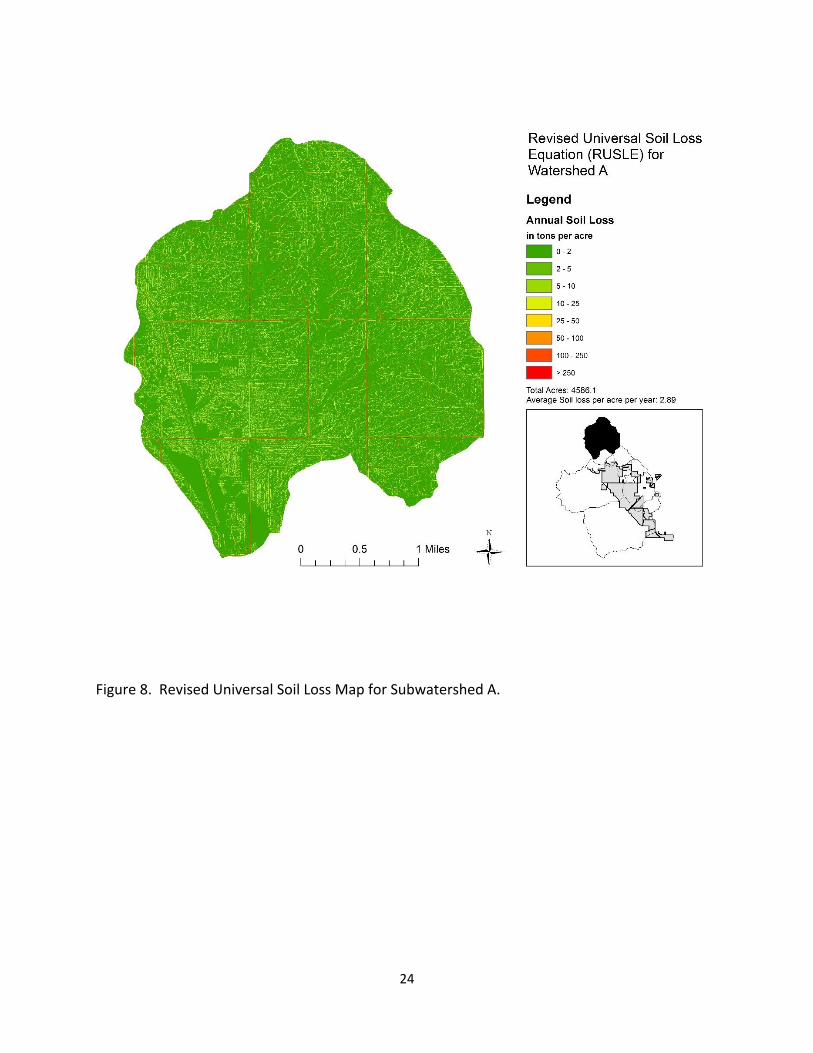
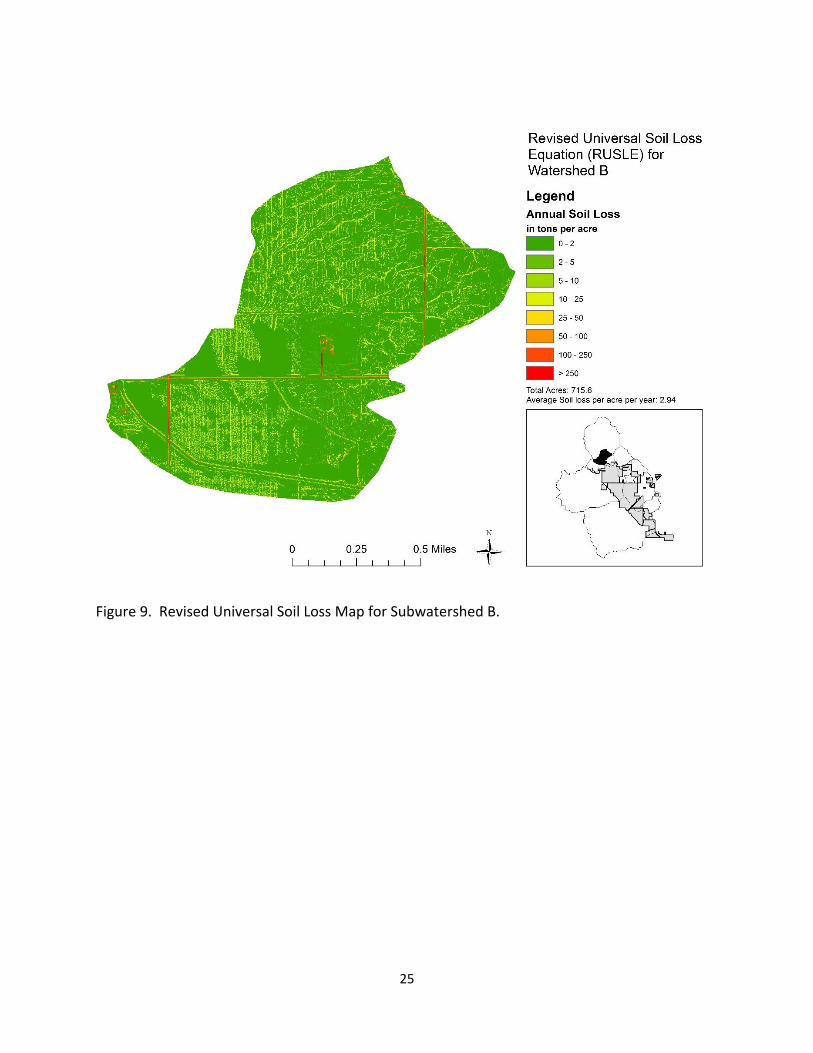
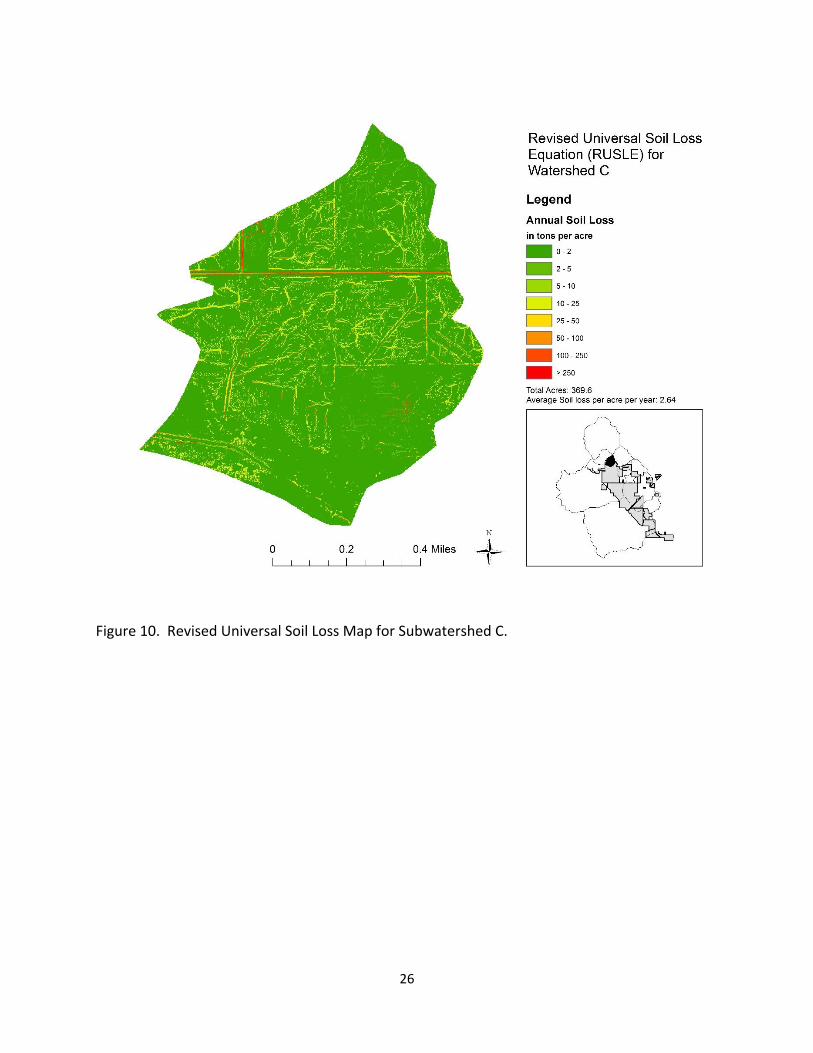
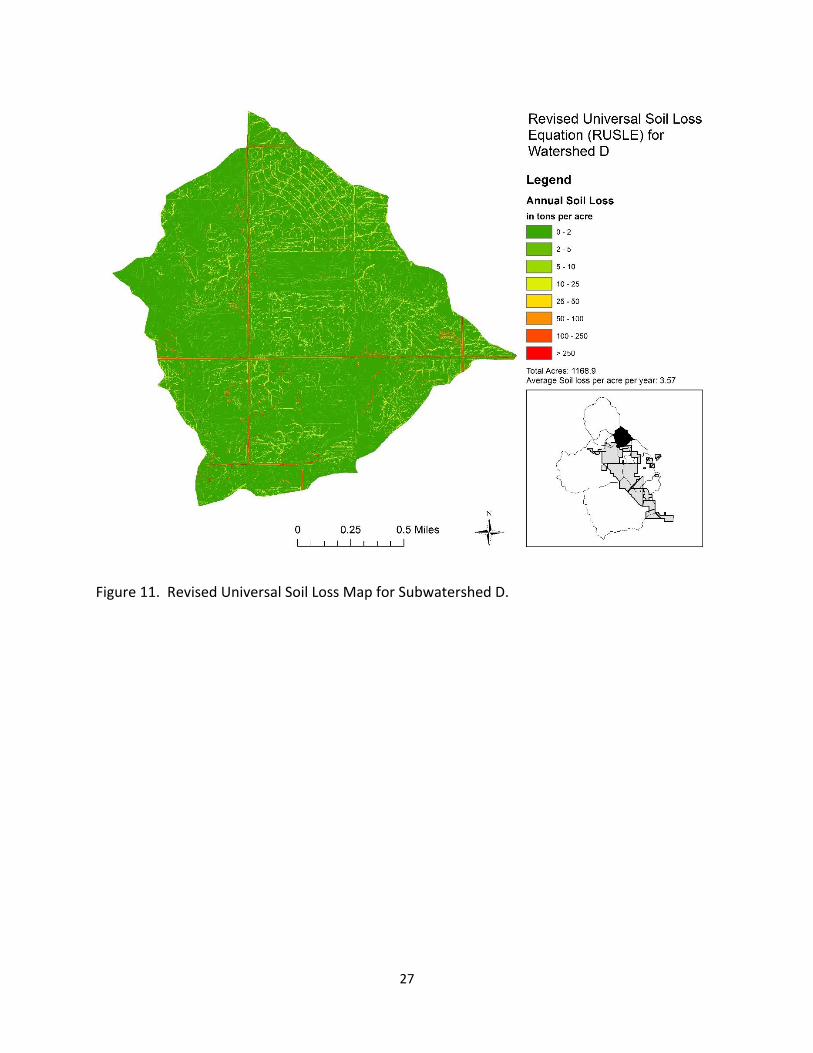
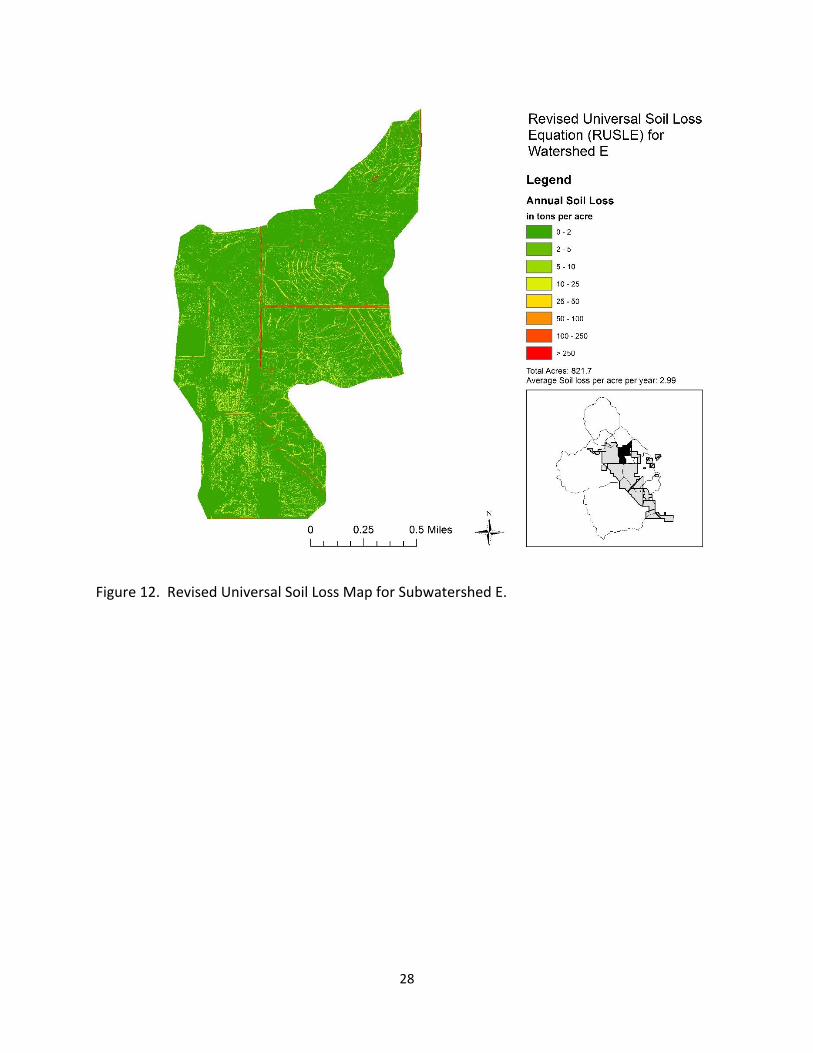
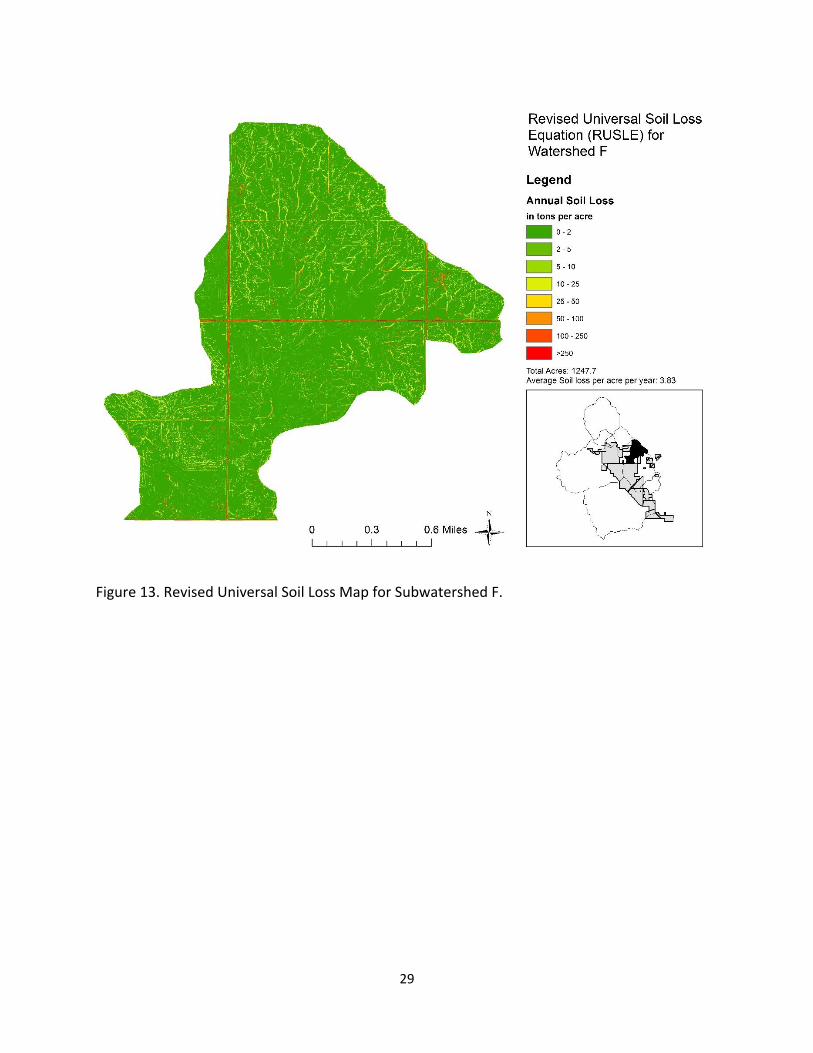
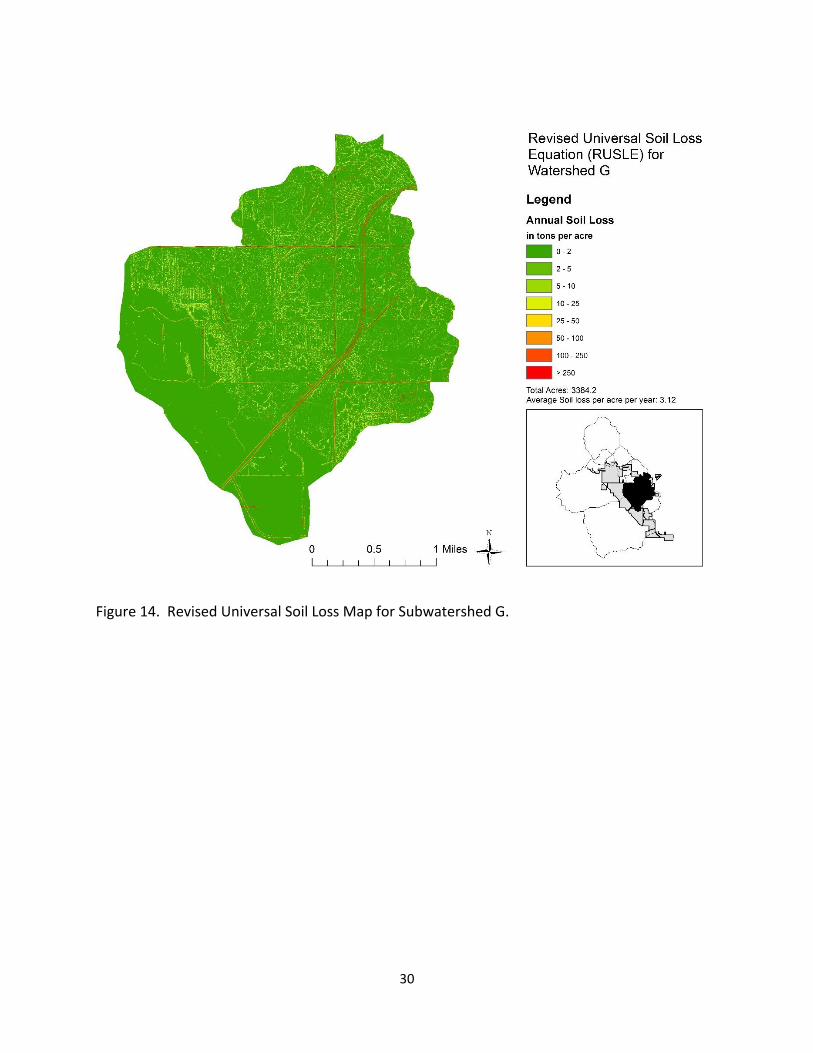
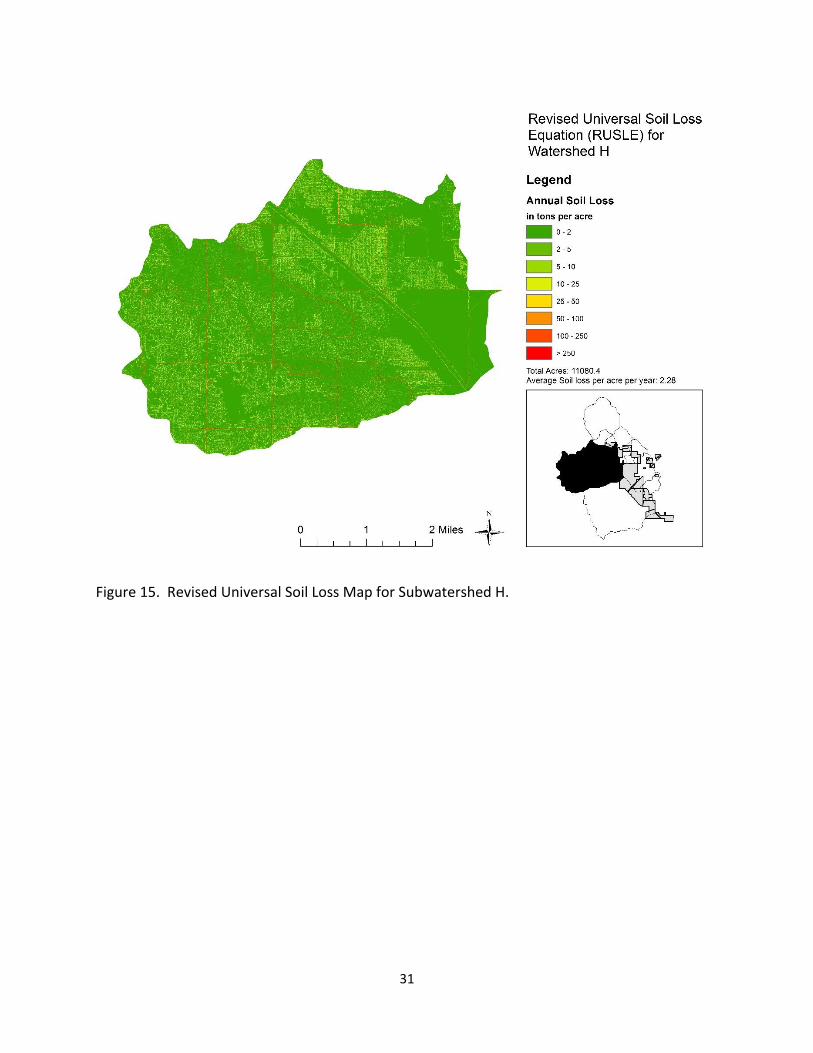
The soils erosion maps were created using the revised universal soil loss equation (RUSLE). RUSLE is used to estimate the average annual tons per acre per year of soil lost within a given area (usually a watershed). There are six factors used in the RUSLE equation which are determined by regional climate, soil, topography, land cover management and conservation practices. The formula used is a follows:
A = R * K * L * S * C * P
A = Annual soil loss (in tons per acre per year) R = Rainfall-runoff erosivity factor K = Soil erodibility factor LS = Slope degree and slope length factor C = Land cover/crop management factor P = Support practice factor (no till farming, contour farming, etc.)
R-Factor
The R-factor is determined by the average annual erosion force caused by rainfall. Storm losses are directly proportional to the total kinetic energy of the storm multiplied by the maximum 30 minute rainfall intensity. Because this would be difficult to determine, I used a formula developed by Kurt Cooper to determine the R-Factor. Coopers R-factor formula for the Eastern Unites States is as follows:
R = 1.24P1.36 where P equals the average annual precipitation
The R-factor was constant throughout the entire raster calculation
K-Factor
The K-factor is determined by how erodible a soil type is. Soil K-Factor is scored on a scale 0 to 1 where less erodible soils (high in clay) are given low scores ranging from 0.05 - 0.2; moderately erodible soils (medium textured soils, silty loams) are given scores from 0.2 - 0.4; and highly erodible soils (high in silt) are given a score higher than 0.4. K-factors where determined using the Polk County SSURGO soil maps.
There were no areas with a K-factor greater than 0.4
LS-Factor
The LS factor was determined using two variables: slope gradient and slope length. Slope gradient was determined by using a 1m x 1m digital elevation map (DEM) of the study area. The slope length was determined using flow accumulation maps of the study area. There are a few different formulas that are used to determine an LS-factor value using the ArcMap raster calculator tool, so I used the one that was the most commonly used in the erosion mapping research that I looked at.
((“flow accumulation”*[raster cell resolution]/22.1)m ) *(Sin(“slope map”*0.01745))/0.09)1.4)*1.4.
22
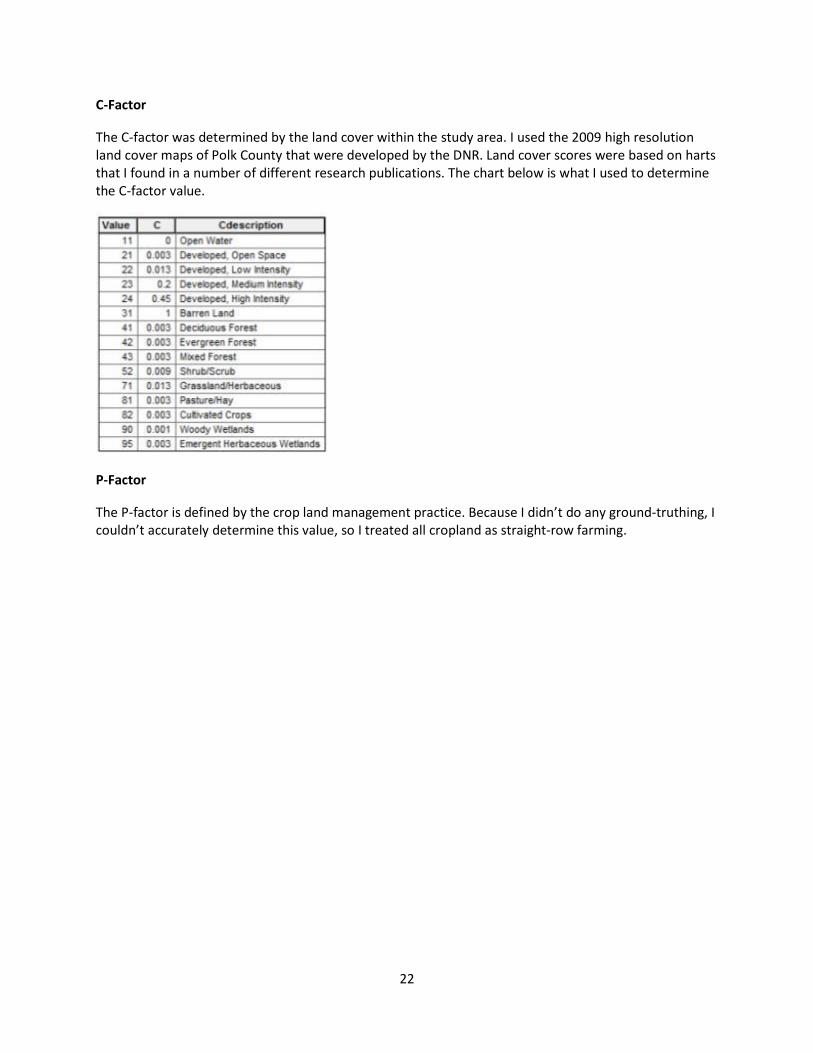
C-Factor
The C-factor was determined by the land cover within the study area. I used the 2009 high resolution land cover maps of Polk County that were developed by the DNR. Land cover scores were based on harts that I found in a number of different research publications. The chart below is what I used to determine the C-factor value.
P-Factor
The P-factor is defined by the crop land management practice. Because I didn’t do any ground-truthing, I couldn’t accurately determine this value, so I treated all cropland as straight-row farming.
23
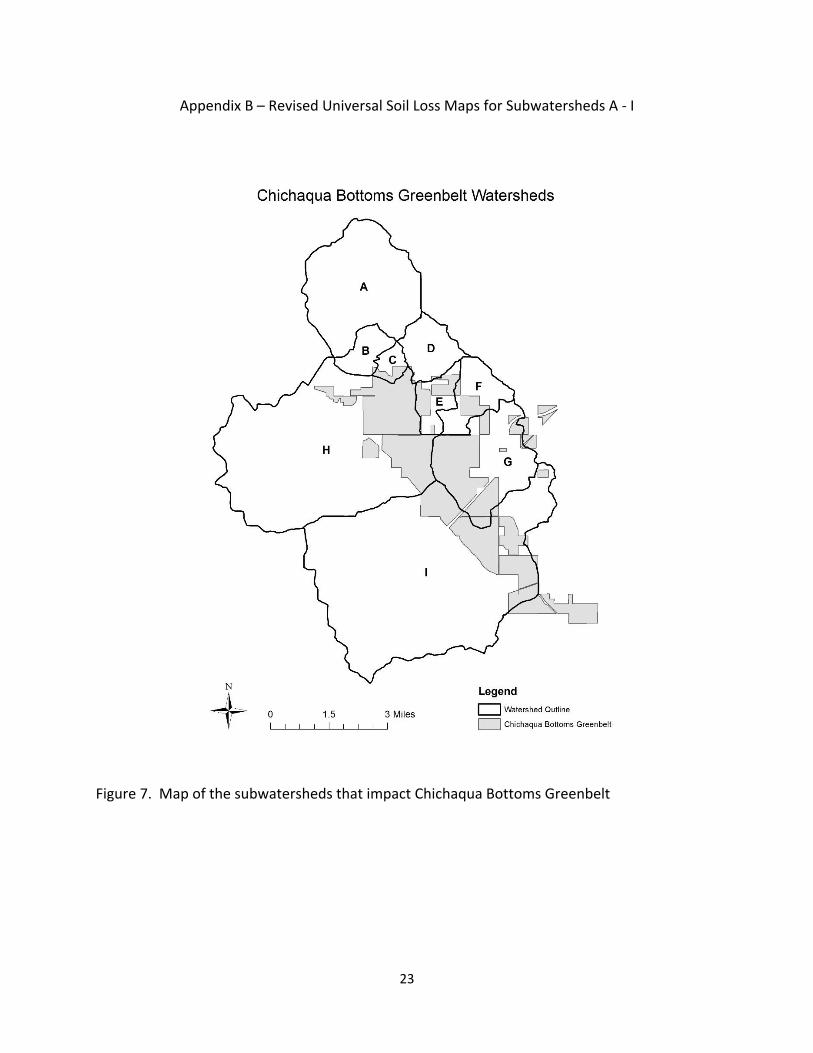
Appendix B – Revised Universal Soil Loss Maps for Subwatersheds A - I
Figure 7. Map of the subwatersheds that impact Chichaqua Bottoms Greenbelt
24
Figure 8. Revised Universal Soil Loss Map for Subwatershed A.
25
Figure 9. Revised Universal Soil Loss Map for Subwatershed B.
26
Figure 10. Revised Universal Soil Loss Map for Subwatershed C.
27
Figure 11. Revised Universal Soil Loss Map for Subwatershed D.
28
Figure 12. Revised Universal Soil Loss Map for Subwatershed E.
29
Figure 13. Revised Universal Soil Loss Map for Subwatershed F.
30
Figure 14. Revised Universal Soil Loss Map for Subwatershed G.
31
Figure 15. Revised Universal Soil Loss Map for Subwatershed H.
32
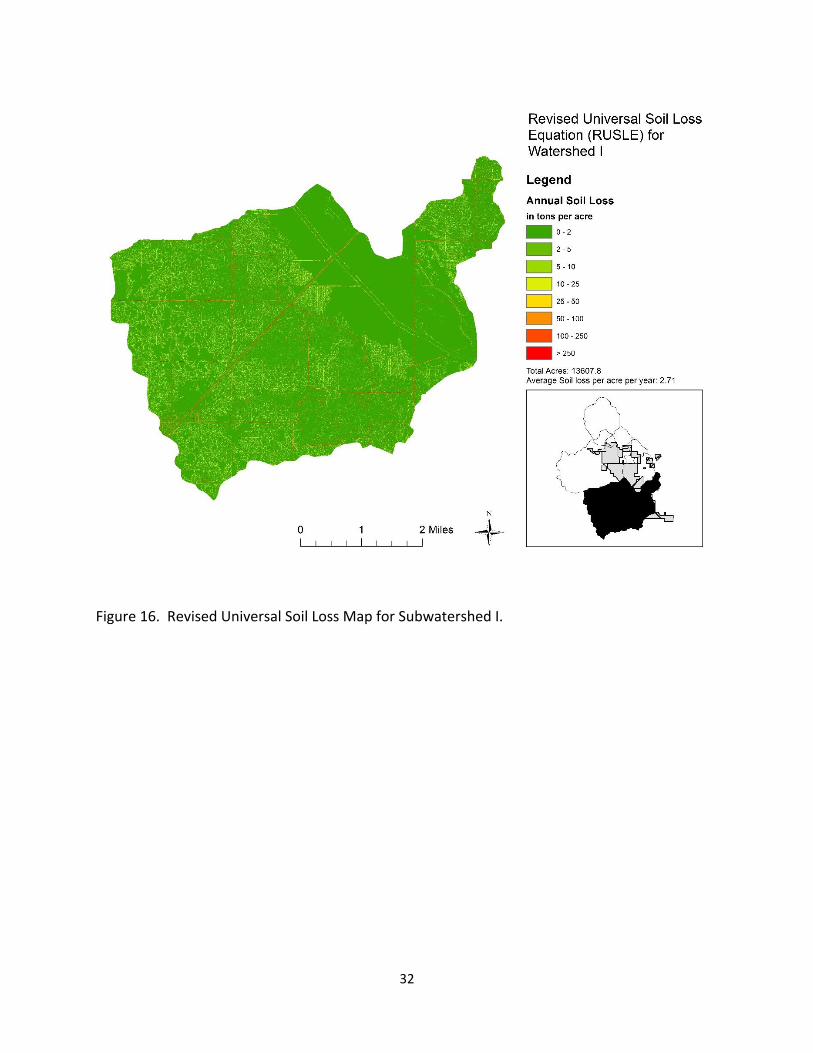
Figure 16. Revised Universal Soil Loss Map for Subwatershed I.
33
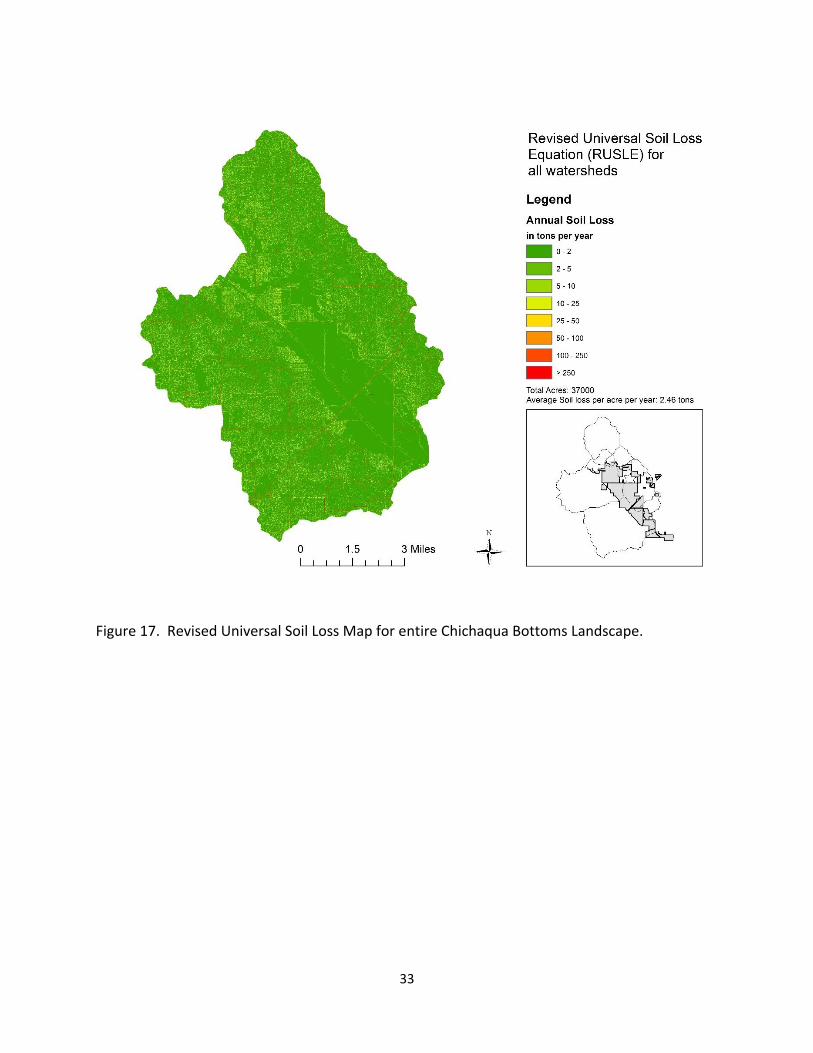
Figure 17. Revised Universal Soil Loss Map for entire Chichaqua Bottoms Landscape.