Packaged Bottled Water Market in India 2013-2018_Slide Share
15
Packaged bottled water market in India 2013 2018 Picture Courtesy: www.info.wowlogistics.com
-
Upload
valuenotes -
Category
Documents
-
view
220 -
download
0
Transcript of Packaged Bottled Water Market in India 2013-2018_Slide Share

8/12/2019 Packaged Bottled Water Market in India 2013-2018_Slide Share
http://slidepdf.com/reader/full/packaged-bottled-water-market-in-india-2013-2018slide-share 1/15
Packaged bottled water market in India 2013 2018
Picture Courtesy: www.info.wowlogistics.com

8/12/2019 Packaged Bottled Water Market in India 2013-2018_Slide Share
http://slidepdf.com/reader/full/packaged-bottled-water-market-in-india-2013-2018slide-share 2/15
2 Copyright @ 2014 ValueNotes Database Pvt Ltd. All rights reserved
AndhraPradesh
Arunachal
Pradesh
AssamBihar
Chhattisgarh
Goa
Gujarat
Haryana
Himachal
Pradesh
Jammu
and
Kashmir
Jharkhand
Karnataka
Kerala
Madhya
Pradesh
Maharashtra
Manipur
Meghalaya
Mizoram
Nagaland
Orissa
Punjab
Rajasthan
Sikkim
Tamil
Nadu
Tripura
Uttar Pradesh
Uttaranchal
West
Bengal
• 43 cities in India have a p opulation of 1mn+
• Cities in India are classified on the basis of cost of
living.
•
4 Metros including Mumbai, Delhi,Chennai, Kolkata
• 9 Tier 1 ( +5 million ) cities including Pune,
Ahmedabad and Bangalore
• 22 Tier 2 cities ( 1 million to 5 million )
including Patna, Kochi, Rajkot, Madurai
• 41 Tier 3 cities ( less then 1 million )
including Ranchi, Mangalore, Gwalior,
Roorkee
India - Snapshot
Population growth 1.4% p.a
Land Area 3.29 mn sq km
Population density 324 persons per sq km
Form of government Democracy
Number of States 29 states & 6 union territories
Capital New Delhi
Per capita income Nominal: USD1,124.4 p.a
Religion 6 main religions
Languages
Hindi (national language), English
(business language), 22 (official
languages)
Currency Rupees
Exchange rate (USD
to INR)
1 USD = INR 60.01
(as on 1st April 2014)
Rural-urban mix 68% people reside in rural areas
Households 246 mn
Literacy rate 74.04%
Mumbai Pune
Hyderabad
Bangalore
Jaipur
New Delhi
Kolkata
Chennai
Ahmadabad
West
North
South
East
Source: Government websites
Lucknow
Nagpur
Patna
Surat
Metro cities
Tier-I cities
TOCMarket
Overview
Annexure &
Appendix
Industry
Trends
Competitive
Environment
Industry
Structure
Executive
Summary
Drivers &
Inhibitors
Government
Initiatives
Industry
Attractiveness
India Fact File

8/12/2019 Packaged Bottled Water Market in India 2013-2018_Slide Share
http://slidepdf.com/reader/full/packaged-bottled-water-market-in-india-2013-2018slide-share 3/15
Preface to the Report
3 Copyright @ 2014 ValueNotes Database Pvt Ltd. All rights reserved
Who is the Reader?
Any participant or stakeholder in the bottled water industry would benefit from this report
Analysts, industry experts or any person with an interest in tracking the progress of the bottled water industry
Purpose of the Report
The report gives insights on how the bottled water industry is expected to grow in the next five years till 2018. It provides
intelligent insights on the drivers and challenges for the industry; the proposed government and policy initiatives, and their
impact on the industry; and key segmentation i.e. by end-users and geography.
Another important aspect of the report is the profiles of the top industry players in the bottled water industry in India
Scope of the report
This report looks at the current scenario for the bottled water industry in India
Non-branded packaged drinking water or entities supplying the packaged drinking water on a standalone basis do not
come under the purview of this report
TOCMarket
Overview
Annexure &
Appendix
Industry
Trends
Competitive
Environment
Industry
Structure
Executive
Summary
Drivers &
Inhibitors
Government
Initiatives
Industry
Attractiveness
8/12/2019 Packaged Bottled Water Market in India 2013-2018_Slide Share
http://slidepdf.com/reader/full/packaged-bottled-water-market-in-india-2013-2018slide-share 4/15
Copyright @ 2014 ValueNotes Database Pvt Ltd. All rights reserved
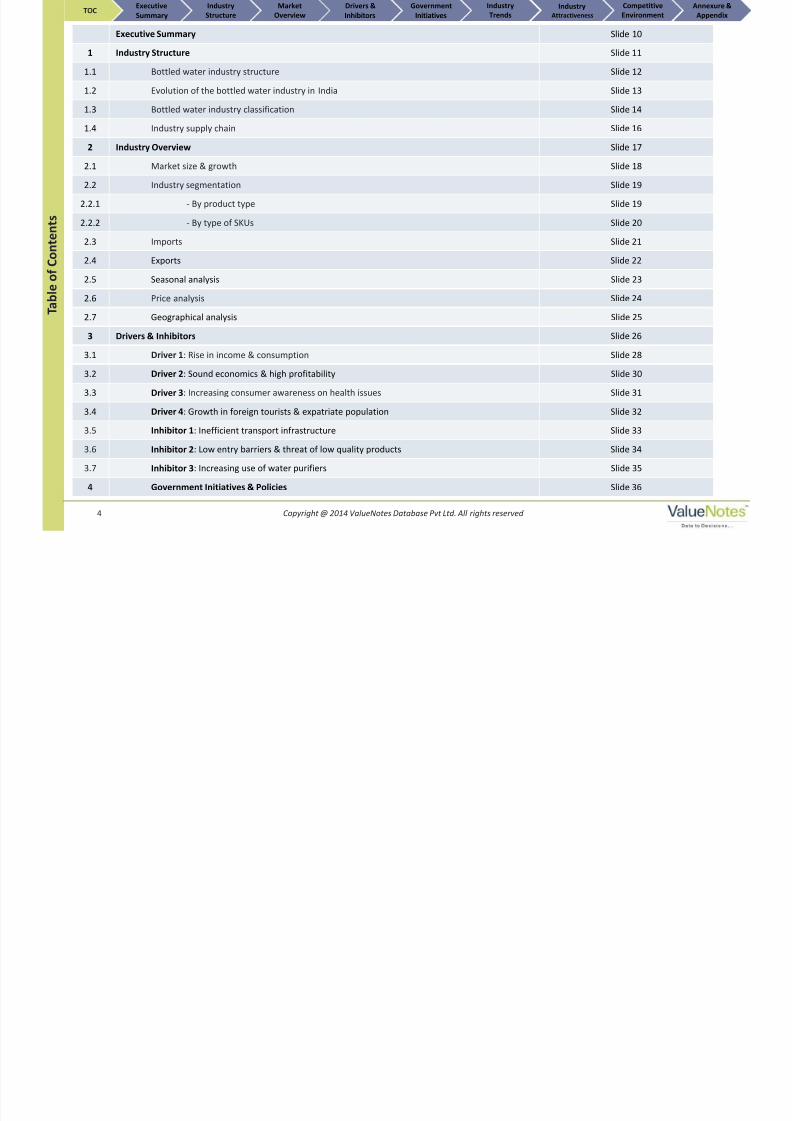
Executive Summary Slide 10
1 Industry Structure Slide 11
1.1 Bottled water industry structure Slide 12
1.2 Evolution of the bottled water industry in India Slide 13
1.3 Bottled water industry classification Slide 14
1.4 Industry supply chain Slide 16
2 Industry Overview Slide 17
2.1 Market size & growth Slide 18
2.2 Industry segmentation Slide 19
2.2.1 - By product type Slide 19
2.2.2 - By type of SKUs Slide 20
2.3 Imports Slide 21
2.4 Exports Slide 22
2.5 Seasonal analysis Slide 23
2.6 Price analysis Slide 24
2.7 Geographical analysis Slide 25
3 Drivers & Inhibitors Slide 26
3.1 Driver 1: Rise in income & consumption Slide 28
3.2 Driver 2: Sound economics & high profitability Slide 30
3.3 Driver 3: Increasing consumer awareness on health issues Slide 31
3.4 Driver 4: Growth in foreign tourists & expatriate population Slide 32
3.5 Inhibitor 1: Inefficient transport infrastructure Slide 33
3.6 Inhibitor 2: Low entry barriers & threat of low quality products Slide 34
3.7 Inhibitor 3: Increasing use of water purifiers Slide 35
4 Government Initiatives & Policies Slide 36
4
TOCMarket
Overview
Annexure &
Appendix
Industry
Trends
Competitive
Environment
Industry
Structure
Executive
Summary
Drivers &
Inhibitors
Government
Initiatives
Industry
Attractiveness
T a b l e o f C o n
t e n t s

8/12/2019 Packaged Bottled Water Market in India 2013-2018_Slide Share
http://slidepdf.com/reader/full/packaged-bottled-water-market-in-india-2013-2018slide-share 5/15
Copyright @ 2014 ValueNotes Database Pvt Ltd. All rights reserved
5 Industry Trends Slide 38
5.1 Recent trends witnessed Slide 39
5.2 M&A and recent developments Slide 40
6 Industry Analysis Slide 41
6.1 Porter’s analysis Slide 42
6.2 Industry attractiveness index Slide 43
7 Competitive Environment Slide 44
7.1 Industry segmentation – by players Slide 45
7.2 Market share of players Slide 46
7.3 Brand positioning - Price& quality analysis Slide 47
7.4 Competitive benchmarking Slide 48
7.5 Competitor profiles Slide 49
7.5.1 Bisleri International Pvt. Ltd. Slide 50
7.5.2 Pepsico India Holdings Pvt Ltd Slide 52
7.5.3 Coca Cola India Pvt. Ltd. Slide 54
7.5.4 Dhariwal Industries Ltd. Slide 56
7.5.5 Parle Agro Pvt. Ltd. Slide 58
8a Annexure Slide 60
8a.1 Water situation in India Slide 61
8b Appendix Slide 70
8b.1 Research Methodology Slide 71
8b.2 Abbreviations & Bibliography Slide 72
8b.3 Glossary Slide 73
5
TOCMarket
Overview
Annexure &
Appendix
Industry
Trends
Competitive
Environment
Industry
Structure
Executive
Summary
Drivers &
Inhibitors
Government
Initiatives
IndustryAttractiveness
T a b l e o f C o n
t e n t s
8/12/2019 Packaged Bottled Water Market in India 2013-2018_Slide Share
http://slidepdf.com/reader/full/packaged-bottled-water-market-in-india-2013-2018slide-share 6/15

8/12/2019 Packaged Bottled Water Market in India 2013-2018_Slide Share
http://slidepdf.com/reader/full/packaged-bottled-water-market-in-india-2013-2018slide-share 7/15Copyright @ 2014 ValueNotes Database Pvt Ltd. All rights reserved7
TOCMarket
Overview
Annexure &
Appendix
Industry
Trends
Competitive
Environment
Industry
Structure
Executive
Summary
Drivers &
Inhibitors
Government
Initiatives
Industry
Attractiveness
T a b l e o f C o n t e n t s | L i s t o
f C h a r t s & T a b l e s
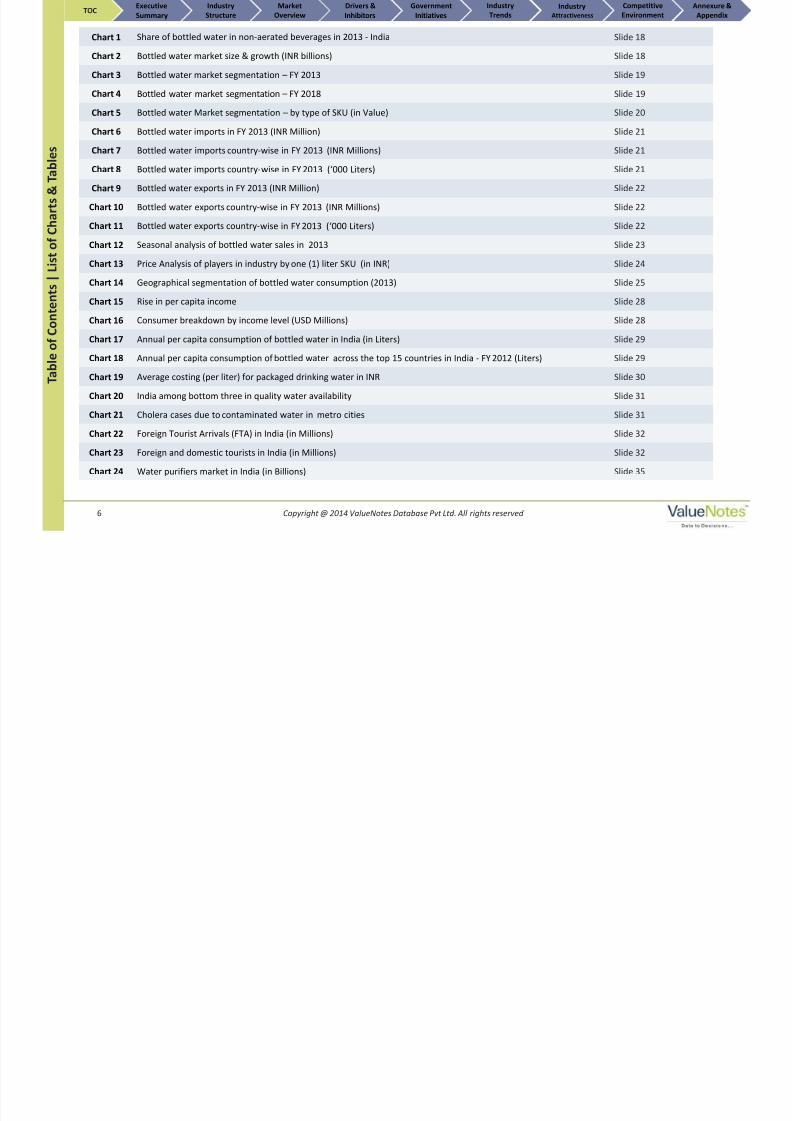
Chart 25 Porter’s analysis of the bottled water industry in India Slide 42
Chart 26 Bottled water market segmentation - by type of players (in Value) Slide 45
Chart 27 Market share of key players (in Value) Slide 46
Chart 28 Price and quality perception of bottled water Slide 47
Chart 29 Annual Turnover of Bisleri International Pvt. Ltd. (INR Millions) Slide 51
Chart 30 Key Manufacturing Locations – Bisleri Slide 51
Chart 31 Annual Turnover of Pepsico India Holdings Pvt. Ltd. (INR Millions) Slide 53
Chart 32 Key Manufacturing Locations – Pepsico Slide 53
Chart 33 Annual Turnover of Coca Cola India Pvt. Ltd. (INR Millions) Slide 55
Chart 34 Key Manufacturing Locations – Coca Cola Slide 55
Chart 35 Annual Turnover of Dhariwal Industries Ltd. (INR Millions) Slide 57
Chart 36 Key Manufacturing Locations – Dhariwal Slide 57
Chart 37 Annual Turnover of Parle Agro Pvt. Ltd. (INR Millions) Slide 59
Chart 38 Key Manufacturing Locations – Parle Slide 59
Chart 39 Annual precipitation & total water reserves Slide 62
Chart 40 Percentage breakup of “Net Groundwater Availability” Slide 63
Chart 41 Level of groundwater development Slide 64
Chart 42 River basins of India Slide 65
Chart 43 Water resource potential of major river basins (BCM) Slide 66
Chart 44 Water demand (in BCM) Slide 67
Chart 45 Break up of demand by sector in 2010 Slide 67
Chart 46 Percentage break up by domestic activities (urban)* Slide 67
Chart 47 Per capita consumption of bottled water in India and across globe Slide 68
k &I d C i idi i &

8/12/2019 Packaged Bottled Water Market in India 2013-2018_Slide Share
http://slidepdf.com/reader/full/packaged-bottled-water-market-in-india-2013-2018slide-share 8/15Copyright @ 2014 ValueNotes Database Pvt Ltd. All rights reserved8
Table 1 Government initiatives for boosting packaged drinking water market in India Slide 37
Table 2 Mergers & Acquisitions in 2013 in the bottled water industry Slide 40
Table 3 Recent developments in the bottled water industry Slide 40
Table 4 Competitive benchmarking of top players in India Slide 48
Table 5 Financial indicators of Bisleri International Pvt. Ltd. Slide 51
Table 6 Financial indicators of Pepsico India Holdings Pvt. Ltd. Slide 53
Table 7 Financial indicators of Coca Cola India Pvt. Ltd. Slide 55
Table 8 Financial indicators of Dhariwal Industries Ltd. Slide 57
Table 9 Financial indicators of Parle Agro Pvt. Ltd. Slide 59
Table 10 “Net Groundwater Availability” and “Annual Groundwater Draft” Slide 63
Table 11 Per capita availability of surface water Slide 66
Table 12 Sector wise future demand estimates (BCM) Slide 68
TOCMarket
Overview
Annexure &
Appendix
Industry
Trends
Competitive
Environment
Industry
Structure
Executive
Summary
Drivers &
Inhibitors
Government
Initiatives
Industry
Attractiveness
T a b l e o f C o n t e n t s | L i s t o
f C h a r t s & T a b l e s

8/12/2019 Packaged Bottled Water Market in India 2013-2018_Slide Share
http://slidepdf.com/reader/full/packaged-bottled-water-market-in-india-2013-2018slide-share 9/159 Copyright @ 2014 ValueNotes Database Pvt Ltd. All rights reserved
Market Anne re &Industry CompetitiveInd strE ec ti e Dri ers & Go ernment I d t

8/12/2019 Packaged Bottled Water Market in India 2013-2018_Slide Share
http://slidepdf.com/reader/full/packaged-bottled-water-market-in-india-2013-2018slide-share 10/15
Market Size and
Growth
Drivers and
Challenges
Industry Scenario
The bottled water industry in India has been growing at a CAGR of 15% for the last three years, and is
currently valued at INR 60bn (~USD 1bn) in FY 2013
The industry is expected to grow at a CAGR of 22% in the next five years till FY 2018, due to the influx of
overseas tourists, a rise in per capita income, changes in lifestyle, etc
ValueNotes estimates that the industry will be worth approximately INR 160bn (~USD 2.67bn) by FY 2018
Driver:
Rising health concerns as well as improving standard of living amongst consumers is likely to boost the
consumption of packaged water in India
Inhibitor:
Traditional water purifying methods and an increase in the use of water purifiers, which need a one time
investment, are a big threat to the growth of the bottled water market in India
The bottled water industry in India is dominated by the top five large players, but they struggle to
penetrate the smaller non-tier I cities because of poor infrastructure. This is giving an opportunity for small
regional players to build their market share in regional markets.
The market share of unorganized players is anticipated to grow if the demand for bottled water keeps pace.
This could severely affect the revenues of organized players, as these small local players eat into their
market by imitating their brands and charging similar prices in the market.
Policy Changes
The implementation of FSS regulation has resulted in BIS inspecting and testing water samples from the
market to maintain the quality of licensed products as per Indian Standards (IS).
The implementation of IS14543: 2004 for packaged drinking water (PDW) & IS13428: 2005 packaged
natural mineral water (PNMW) has resulted in:
• 18 BIS licensees engaged in PNMW
• ~2,300 licensees engaged in PDW through reverse osmosis
• ~600 licensees engaged in bottling PDW from natural resources
10 Copyright @ 2014 ValueNotes Database Pvt Ltd. All rights reserved
E x e c u t i v e S u m
m a r y
The bottled water industry in India has been given an Industry Attractiveness Rating of 7.5 as per the
‘ ValueNotes Industry Attractiveness Rating Evaluation System’
TOCMarket
Overview
Annexure &
Appendix
Industry
Trends
Competitive
Environment
Industry
Structure
Executive
Summary
Drivers &
Inhibitors
Government
Initiatives
Industry
Attractiveness
8/12/2019 Packaged Bottled Water Market in India 2013-2018_Slide Share
http://slidepdf.com/reader/full/packaged-bottled-water-market-in-india-2013-2018slide-share 11/15Appendix

8/12/2019 Packaged Bottled Water Market in India 2013-2018_Slide Share
http://slidepdf.com/reader/full/packaged-bottled-water-market-in-india-2013-2018slide-share 12/15
Market Annexure &Industry CompetitiveIndustryExecutive Drivers & Government Industry

8/12/2019 Packaged Bottled Water Market in India 2013-2018_Slide Share
http://slidepdf.com/reader/full/packaged-bottled-water-market-in-india-2013-2018slide-share 13/15
13 Copyright @ 2014 ValueNotes Database Pvt Ltd. All rights reserved
A p
p e n d i x | A b b r e v i a t i o n s & B i b l i o g r a p h y
Abbreviations
BIS Bureau of Indian Standards
bn Billion
FSSR Food Safety and Standards Regulations
FDI Foreign Direct Investment
FTA Foreign Tourist Arrivals
INR Indian Rupee
Ltr Liter
mn Million
NSTFDCNational Scheduled Tribe Finance and
Development Corporation
PDW Packaged Drinking Water
PNMW Packaged Natural Mineral Water
PoU Point of Use
SKU Stock Keeping Unit
USD Unites States Dollar
Beverage Marketing Corporation
Bureau of Indian Standards
Central Ground Water Authority
Centre for Science & Environment, India
Department of Commerce
DNA India
FnB News: BIS formulates Indian packaged drinking water and PNMW stds under FSSR
Foodnavigator-asia.com
IBEF - India Now Magazine June-July 2012
India Environment Portal
Indian Council for Medical Research
Kerala Bottled Water Manufacturers Association
McKinsey Global Institute
Ministry of Tourism
National Scheduled Tribe Finanance and Development Corporation
Tamil Nadu Packaged Drinking Water Manufacturers Association
The National Green Tribunal
World Bank
Bibliography
ValueNotes conducted secondary research to obtain information on bottled water
industry in India and referred to following sources:
TOCMarket
Overview
Annexure &
Appendix
Industry
Trends
Competitive
Environment
Industry
Structure
Executive
Summary
Drivers &
Inhibitors
Government
InitiativesIndustry
Attractiveness
Abbreviations used in the bottled water report include:
Market Annexure &Industry CompetitiveIndustryExecutive Drivers & Government Industry

8/12/2019 Packaged Bottled Water Market in India 2013-2018_Slide Share
http://slidepdf.com/reader/full/packaged-bottled-water-market-in-india-2013-2018slide-share 14/15
14 Copyright @ 2014 ValueNotes Database Pvt Ltd. All rights reserved
A p p e n d i x | G l o s s a r y
FSSR ActFood Safety and Standards (Prohibition and Restriction on Sales) (Amendment) Regulations, 2011 with
respect to PDW & PNMW
Foreign Tourist Arrivals
International inbound tourists (overnight visitors) are the number of tourists who travel to a country other
than that in which they have their usual residence, but outside their usual environment, for a period not
exceeding 12 months and whose main purpose in visiting is other than an activity remunerated from within
the country visited
Incredible Indiainternational marketing campaign by the Government of India to promote tourism in India in 2002 to a
global audience
IS13428: 2005 The BIS standard for packaged natural mineral water
IS14543: 2004 The BIS standard for packaged drinking water
Natural mineral water Water containing less than 250ppm of total dissolved solids are defined as natural mineral water
Off-trade This includes the retail industry consisting of modern trade and traditional kirana stores
On-trade This channel represents sales to hotels, restaurants/cafes, airlines, hospitals, colleges, etc.
Packaged drinking water
Packaged drinking water means water derived from any source of potable water and subjected to various
treatments to meet the prescribed standard before being packed in a plastic or glass container
TOCMarket
Overview
Annexure &
Appendix
Industry
Trends
Competitive
Environment
Industry
Structure
Executive
Summary
Drivers &
Inhibitors
Government
Initiatives
Industry
Attractiveness

8/12/2019 Packaged Bottled Water Market in India 2013-2018_Slide Share
http://slidepdf.com/reader/full/packaged-bottled-water-market-in-india-2013-2018slide-share 15/15