
Package Professor Yuichiro YOSHIDA International … Info_Package.pdf107 G t c 108 X t a 109 SAW y...
12
1 2014 Airport Benchmarking Team Project Coordinator: Professor Tae H. OUM Air Transport Research Society Research Director: Dr. Yapyin Choo Air Transport Research Society Professor Chunyan Yu Embry-Riddle Aeronautical University North America: Professor Bijan VASIGH Embry-Riddle Aeronautical University (United States of America) Professor Jia YAN Washington State University (United States of America) Asia Pacific: Professor Peter FORSYTH Monash University (Australia) Professor Paul Hooper University of New South Wales (Australia) Professor Japhet Law Chinese University of Hong Kong (Hong Kong) Professor Yuichiro YOSHIDA International University of Japan (Japan) Professor Yeong-Heok LEE Hankuk Aviation University (Korea) Professor Shinya HANAOKA Tokyo Institute of Technology (japan) Professor Xiaowen Fu The University of Sydney (Australia) Europe: Professor Jaap de WIT University of Amsterdam (The Netherlands) Professor Eric PELS Free University of Amsterdam (The Netherlands) Professor Hans-Martin University of Applied Science NIEMEIER (Germany) Professor Nicole ADLER Hebrew University of Jerusalem (Israel) Headquarters Staff: Amy Chung Research Assistant, Air Transport Research Society JJ Qian Research Assistant, Air Transport Research Society Jonathan Chen Research Assistant, Air Transport Research Society Information Package 2014 Air Transport Research Society, all rights reserved www.atrsworld.org 2014
Transcript of Package Professor Yuichiro YOSHIDA International … Info_Package.pdf107 G t c 108 X t a 109 SAW y...
1
2014 Airport Benchmarking Team Project Coordinator:
Professor Tae H. OUM Air Transport Research Society Research Director:
Dr. Yapyin Choo Air Transport Research Society Professor Chunyan Yu Embry-Riddle Aeronautical University
North America:
Professor Bijan VASIGH Embry-Riddle Aeronautical University (United States of America) Professor Jia YAN Washington State University (United States of America)
Asia Pacific:
Professor Peter FORSYTH Monash University (Australia) Professor Paul Hooper University of New South Wales (Australia) Professor Japhet Law Chinese University of Hong Kong (Hong Kong) Professor Yuichiro YOSHIDA International University of Japan (Japan) Professor Yeong-Heok LEE Hankuk Aviation University (Korea) Professor Shinya HANAOKA Tokyo Institute of Technology (japan) Professor Xiaowen Fu The University of Sydney (Australia)
Europe: Professor Jaap de WIT University of Amsterdam (The Netherlands) Professor Eric PELS Free University of Amsterdam (The Netherlands) Professor Hans-Martin University of Applied Science NIEMEIER (Germany) Professor Nicole ADLER Hebrew University of Jerusalem (Israel)
Headquarters Staff: Amy Chung Research Assistant, Air Transport Research Society JJ Qian Research Assistant, Air Transport Research Society Jonathan Chen Research Assistant, Air Transport Research Society
Information Package
2014 Air Transport Research Society, all rights reserved
www.atrsworld.org
2014
2
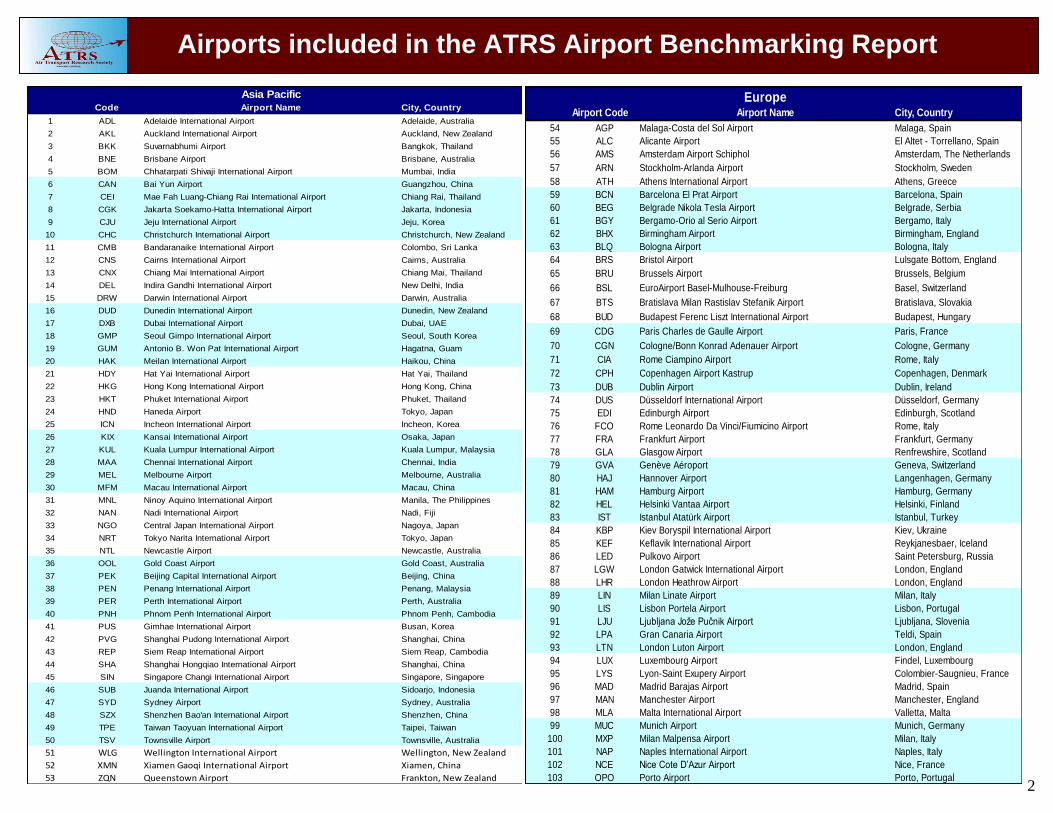
Asia Pacific
Code Airport Name City, Country
1 ADL Adelaide International Airport Adelaide, Australia
2 AKL Auckland International Airport Auckland, New Zealand
3 BKK Suvarnabhumi Airport Bangkok, Thailand
4 BNE Brisbane Airport Brisbane, Australia
5 BOM Chhatarpati Shivaji International Airport Mumbai, India
6 CAN Bai Yun Airport Guangzhou, China
7 CEI Mae Fah Luang-Chiang Rai International Airport Chiang Rai, Thailand
8 CGK Jakarta Soekarno-Hatta International Airport Jakarta, Indonesia
9 CJU Jeju International Airport Jeju, Korea
10 CHC Christchurch International Airport Christchurch, New Zealand
11 CMB Bandaranaike International Airport Colombo, Sri Lanka
12 CNS Cairns International Airport Cairns, Australia
13 CNX Chiang Mai International Airport Chiang Mai, Thailand
14 DEL Indira Gandhi International Airport New Delhi, India
15 DRW Darwin International Airport Darwin, Australia
16 DUD Dunedin International Airport Dunedin, New Zealand
17 DXB Dubai International Airport Dubai, UAE
18 GMP Seoul Gimpo International Airport Seoul, South Korea
19 GUM Antonio B. Won Pat International Airport Hagatna, Guam
20 HAK Meilan International Airport Haikou, China
21 HDY Hat Yai International Airport Hat Yai, Thailand
22 HKG Hong Kong International Airport Hong Kong, China
23 HKT Phuket International Airport Phuket, Thailand
24 HND Haneda Airport Tokyo, Japan
25 ICN Incheon International Airport Incheon, Korea
26 KIX Kansai International Airport Osaka, Japan
27 KUL Kuala Lumpur International Airport Kuala Lumpur, Malaysia
28 MAA Chennai International Airport Chennai, India
29 MEL Melbourne Airport Melbourne, Australia
30 MFM Macau International Airport Macau, China
31 MNL Ninoy Aquino International Airport Manila, The Philippines
32 NAN Nadi International Airport Nadi, Fiji
33 NGO Central Japan International Airport Nagoya, Japan
34 NRT Tokyo Narita International Airport Tokyo, Japan
35 NTL Newcastle Airport Newcastle, Australia
36 OOL Gold Coast Airport Gold Coast, Australia
37 PEK Beijing Capital International Airport Beijing, China
38 PEN Penang International Airport Penang, Malaysia
39 PER Perth International Airport Perth, Australia
40 PNH Phnom Penh International Airport Phnom Penh, Cambodia
41 PUS Gimhae International Airport Busan, Korea
42 PVG Shanghai Pudong International Airport Shanghai, China
43 REP Siem Reap International Airport Siem Reap, Cambodia
44 SHA Shanghai Hongqiao International Airport Shanghai, China
45 SIN Singapore Changi International Airport Singapore, Singapore
46 SUB Juanda International Airport Sidoarjo, Indonesia
47 SYD Sydney Airport Sydney, Australia
48 SZX Shenzhen Bao'an International Airport Shenzhen, China
49 TPE Taiwan Taoyuan International Airport Taipei, Taiwan
50 TSV Townsville Airport Townsville, Australia
51 WLG Wellington International Airport Wellington, New Zealand
52 XMN Xiamen Gaoqi International Airport Xiamen, China
53 ZQN Queenstown Airport Frankton, New Zealand
EuropeAirport Code Airport Name City, Country
54 AGP Malaga-Costa del Sol Airport Malaga, Spain
55 ALC Alicante Airport El Altet - Torrellano, Spain
56 AMS Amsterdam Airport Schiphol Amsterdam, The Netherlands
57 ARN Stockholm-Arlanda Airport Stockholm, Sweden
58 ATH Athens International Airport Athens, Greece
59 BCN Barcelona El Prat Airport Barcelona, Spain
60 BEG Belgrade Nikola Tesla Airport Belgrade, Serbia
61 BGY Bergamo-Orio al Serio Airport Bergamo, Italy
62 BHX Birmingham Airport Birmingham, England
63 BLQ Bologna Airport Bologna, Italy
64 BRS Bristol Airport Lulsgate Bottom, England
65 BRU Brussels Airport Brussels, Belgium
66 BSL EuroAirport Basel-Mulhouse-Freiburg Basel, Switzerland
67 BTS Bratislava Milan Rastislav Stefanik Airport Bratislava, Slovakia
68 BUD Budapest Ferenc Liszt International Airport Budapest, Hungary
69 CDG Paris Charles de Gaulle Airport Paris, France
70 CGN Cologne/Bonn Konrad Adenauer Airport Cologne, Germany
71 CIA Rome Ciampino Airport Rome, Italy
72 CPH Copenhagen Airport Kastrup Copenhagen, Denmark
73 DUB Dublin Airport Dublin, Ireland
74 DUS Düsseldorf International Airport Düsseldorf, Germany
75 EDI Edinburgh Airport Edinburgh, Scotland
76 FCO Rome Leonardo Da Vinci/Fiumicino Airport Rome, Italy
77 FRA Frankfurt Airport Frankfurt, Germany
78 GLA Glasgow Airport Renfrewshire, Scotland
79 GVA Genève Aéroport Geneva, Switzerland
80 HAJ Hannover Airport Langenhagen, Germany
81 HAM Hamburg Airport Hamburg, Germany
82 HEL Helsinki Vantaa Airport Helsinki, Finland
83 IST Istanbul Atatürk Airport Istanbul, Turkey
84 KBP Kiev Boryspil International Airport Kiev, Ukraine
85 KEF Keflavik International Airport Reykjanesbaer, Iceland
86 LED Pulkovo Airport Saint Petersburg, Russia
87 LGW London Gatwick International Airport London, England
88 LHR London Heathrow Airport London, England
89 LIN Milan Linate Airport Milan, Italy
90 LIS Lisbon Portela Airport Lisbon, Portugal
91 LJU Ljubljana Jože Pučnik Airport Ljubljana, Slovenia
92 LPA Gran Canaria Airport Teldi, Spain
93 LTN London Luton Airport London, England
94 LUX Luxembourg Airport Findel, Luxembourg
95 LYS Lyon-Saint Exupery Airport Colombier-Saugnieu, France
96 MAD Madrid Barajas Airport Madrid, Spain
97 MAN Manchester Airport Manchester, England
98 MLA Malta International Airport Valletta, Malta
99 MUC Munich Airport Munich, Germany
100 MXP Milan Malpensa Airport Milan, Italy
101 NAP Naples International Airport Naples, Italy
102 NCE Nice Cote D’Azur Airport Nice, France
103 OPO Porto Airport Porto, Portugal
Airports included in the ATRS Airport Benchmarking Report
3
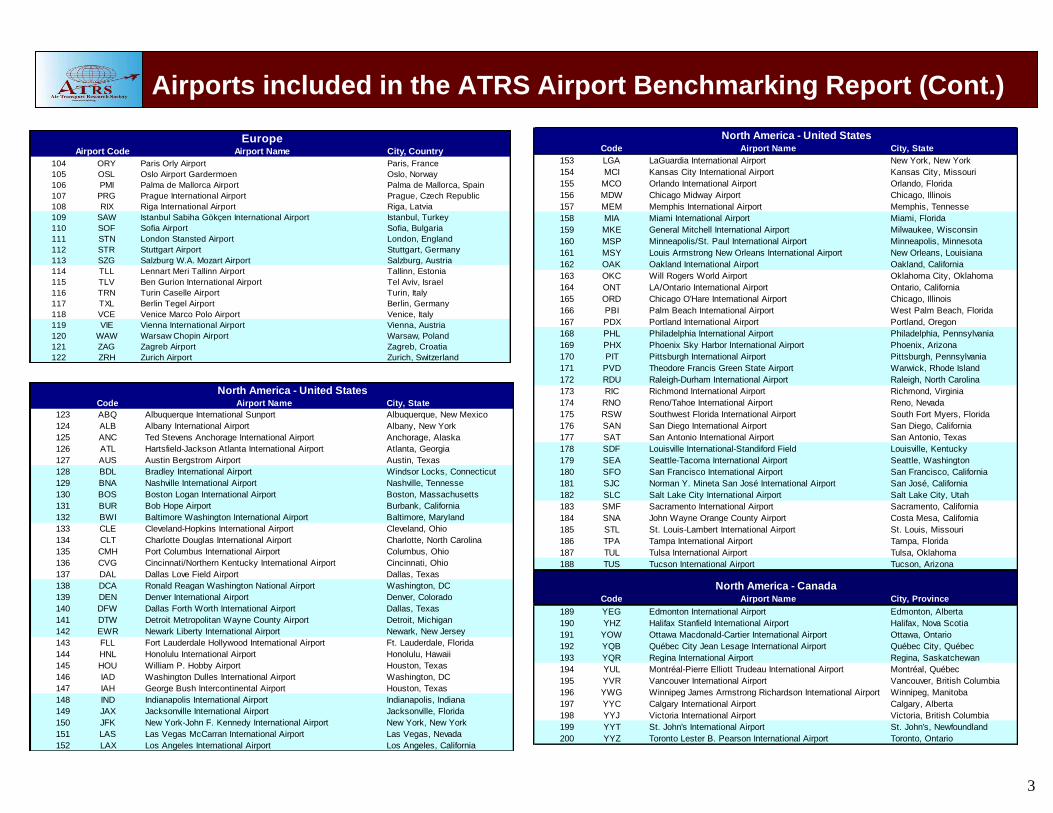
Code Airport Name City, State
123 ABQ Albuquerque International Sunport Albuquerque, New Mexico
124 ALB Albany International Airport Albany, New York
125 ANC Ted Stevens Anchorage International Airport Anchorage, Alaska
126 ATL Hartsfield-Jackson Atlanta International Airport Atlanta, Georgia
127 AUS Austin Bergstrom Airport Austin, Texas
128 BDL Bradley International Airport Windsor Locks, Connecticut
129 BNA Nashville International Airport Nashville, Tennesse
130 BOS Boston Logan International Airport Boston, Massachusetts
131 BUR Bob Hope Airport Burbank, California
132 BWI Baltimore Washington International Airport Baltimore, Maryland
133 CLE Cleveland-Hopkins International Airport Cleveland, Ohio
134 CLT Charlotte Douglas International Airport Charlotte, North Carolina
135 CMH Port Columbus International Airport Columbus, Ohio
136 CVG Cincinnati/Northern Kentucky International Airport Cincinnati, Ohio
137 DAL Dallas Love Field Airport Dallas, Texas
138 DCA Ronald Reagan Washington National Airport Washington, DC
139 DEN Denver International Airport Denver, Colorado
140 DFW Dallas Forth Worth International Airport Dallas, Texas
141 DTW Detroit Metropolitan Wayne County Airport Detroit, Michigan
142 EWR Newark Liberty International Airport Newark, New Jersey
143 FLL Fort Lauderdale Hollywood International Airport Ft. Lauderdale, Florida
144 HNL Honolulu International Airport Honolulu, Hawaii
145 HOU William P. Hobby Airport Houston, Texas
146 IAD Washington Dulles International Airport Washington, DC
147 IAH George Bush Intercontinental Airport Houston, Texas
148 IND Indianapolis International Airport Indianapolis, Indiana
149 JAX Jacksonville International Airport Jacksonville, Florida
150 JFK New York-John F. Kennedy International Airport New York, New York
151 LAS Las Vegas McCarran International Airport Las Vegas, Nevada
152 LAX Los Angeles International Airport Los Angeles, California
North America - United States
Code Airport Name City, State
153 LGA LaGuardia International Airport New York, New York
154 MCI Kansas City International Airport Kansas City, Missouri
155 MCO Orlando International Airport Orlando, Florida
156 MDW Chicago Midway Airport Chicago, Illinois
157 MEM Memphis International Airport Memphis, Tennesse
158 MIA Miami International Airport Miami, Florida
159 MKE General Mitchell International Airport Milwaukee, Wisconsin
160 MSP Minneapolis/St. Paul International Airport Minneapolis, Minnesota
161 MSY Louis Armstrong New Orleans International Airport New Orleans, Louisiana
162 OAK Oakland International Airport Oakland, California
163 OKC Will Rogers World Airport Oklahoma City, Oklahoma
164 ONT LA/Ontario International Airport Ontario, California
165 ORD Chicago O'Hare International Airport Chicago, Illinois
166 PBI Palm Beach International Airport West Palm Beach, Florida
167 PDX Portland International Airport Portland, Oregon
168 PHL Philadelphia International Airport Philadelphia, Pennsylvania
169 PHX Phoenix Sky Harbor International Airport Phoenix, Arizona
170 PIT Pittsburgh International Airport Pittsburgh, Pennsylvania
171 PVD Theodore Francis Green State Airport Warwick, Rhode Island
172 RDU Raleigh-Durham International Airport Raleigh, North Carolina
173 RIC Richmond International Airport Richmond, Virginia
174 RNO Reno/Tahoe International Airport Reno, Nevada
175 RSW Southwest Florida International Airport South Fort Myers, Florida
176 SAN San Diego International Airport San Diego, California
177 SAT San Antonio International Airport San Antonio, Texas
178 SDF Louisville International-Standiford Field Louisville, Kentucky
179 SEA Seattle-Tacoma International Airport Seattle, Washington
180 SFO San Francisco International Airport San Francisco, California
181 SJC Norman Y. Mineta San José International Airport San José, California
182 SLC Salt Lake City International Airport Salt Lake City, Utah
183 SMF Sacramento International Airport Sacramento, California
184 SNA John Wayne Orange County Airport Costa Mesa, California
185 STL St. Louis-Lambert International Airport St. Louis, Missouri
186 TPA Tampa International Airport Tampa, Florida
187 TUL Tulsa International Airport Tulsa, Oklahoma
188 TUS Tucson International Airport Tucson, Arizona
Code Airport Name City, Province
189 YEG Edmonton International Airport Edmonton, Alberta
190 YHZ Halifax Stanfield International Airport Halifax, Nova Scotia
191 YOW Ottawa Macdonald-Cartier International Airport Ottawa, Ontario
192 YQB Québec City Jean Lesage International Airport Québec City, Québec
193 YQR Regina International Airport Regina, Saskatchewan
194 YUL Montréal-Pierre Elliott Trudeau International Airport Montréal, Québec
195 YVR Vancouver International Airport Vancouver, British Columbia
196 YWG Winnipeg James Armstrong Richardson International Airport Winnipeg, Manitoba
197 YYC Calgary International Airport Calgary, Alberta
198 YYJ Victoria International Airport Victoria, British Columbia
199 YYT St. John's International Airport St. John's, Newfoundland
200 YYZ Toronto Lester B. Pearson International Airport Toronto, Ontario
North America - United States
North America - Canada
EuropeAirport Code Airport Name City, Country
104 ORY Paris Orly Airport Paris, France
105 OSL Oslo Airport Gardermoen Oslo, Norway
106 PMI Palma de Mallorca Airport Palma de Mallorca, Spain
107 PRG Prague International Airport Prague, Czech Republic
108 RIX Riga International Airport Riga, Latvia
109 SAW Istanbul Sabiha Gökçen International Airport Istanbul, Turkey
110 SOF Sofia Airport Sofia, Bulgaria
111 STN London Stansted Airport London, England
112 STR Stuttgart Airport Stuttgart, Germany
113 SZG Salzburg W.A. Mozart Airport Salzburg, Austria
114 TLL Lennart Meri Tallinn Airport Tallinn, Estonia
115 TLV Ben Gurion International Airport Tel Aviv, Israel
116 TRN Turin Caselle Airport Turin, Italy
117 TXL Berlin Tegel Airport Berlin, Germany
118 VCE Venice Marco Polo Airport Venice, Italy
119 VIE Vienna International Airport Vienna, Austria
120 WAW Warsaw Chopin Airport Warsaw, Poland
121 ZAG Zagreb Airport Zagreb, Croatia
122 ZRH Zurich Airport Zurich, Switzerland
Airports included in the ATRS Airport Benchmarking Report (Cont.)
4
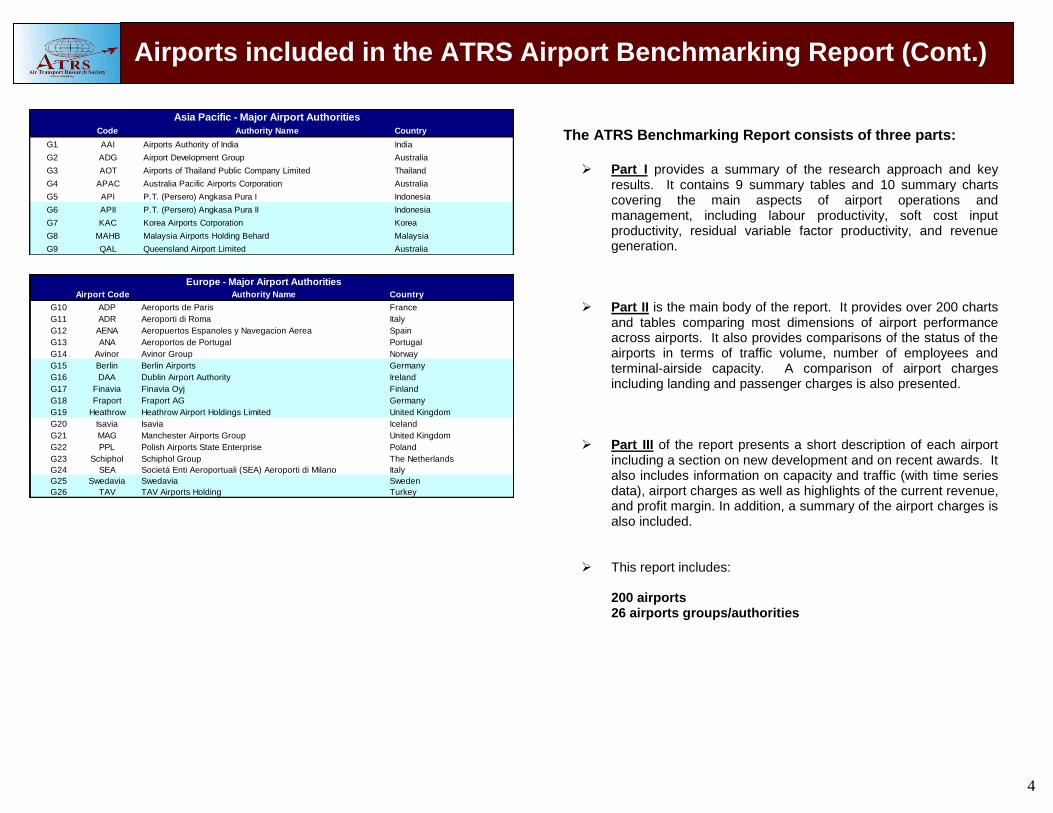
Asia Pacific - Major Airport Authorities
Code Authority Name Country
G1 AAI Airports Authority of India India
G2 ADG Airport Development Group Australia
G3 AOT Airports of Thailand Public Company Limited Thailand
G4 APAC Australia Pacific Airports Corporation Australia
G5 API P.T. (Persero) Angkasa Pura I Indonesia
G6 APII P.T. (Persero) Angkasa Pura II Indonesia
G7 KAC Korea Airports Corporation Korea
G8 MAHB Malaysia Airports Holding Behard Malaysia
G9 QAL Queensland Airport Limited Australia
Europe - Major Airport Authorities
Airport Code Authority Name Country
G10 ADP Aeroports de Paris France
G11 ADR Aeroporti di Roma Italy
G12 AENA Aeropuertos Espanoles y Navegacion Aerea Spain
G13 ANA Aeroportos de Portugal Portugal
G14 Avinor Avinor Group Norway
G15 Berlin Berlin Airports Germany
G16 DAA Dublin Airport Authority Ireland
G17 Finavia Finavia Oyj Finland
G18 Fraport Fraport AG Germany
G19 Heathrow Heathrow Airport Holdings Limited United Kingdom
G20 Isavia Isavia Iceland
G21 MAG Manchester Airports Group United Kingdom
G22 PPL Polish Airports State Enterprise Poland
G23 Schiphol Schiphol Group The Netherlands
G24 SEA Societá Enti Aeroportuali (SEA) Aeroporti di Milano Italy
G25 Swedavia Swedavia Sweden
G26 TAV TAV Airports Holding Turkey
The ATRS Benchmarking Report consists of three parts:
Part I provides a summary of the research approach and key results. It contains 9 summary tables and 10 summary charts covering the main aspects of airport operations and management, including labour productivity, soft cost input productivity, residual variable factor productivity, and revenue generation.
Part II is the main body of the report. It provides over 200 charts
and tables comparing most dimensions of airport performance across airports. It also provides comparisons of the status of the airports in terms of traffic volume, number of employees and terminal-airside capacity. A comparison of airport charges including landing and passenger charges is also presented.
Part III of the report presents a short description of each airport
including a section on new development and on recent awards. It also includes information on capacity and traffic (with time series data), airport charges as well as highlights of the current revenue, and profit margin. In addition, a summary of the airport charges is also included.
This report includes: 200 airports 26 airports groups/authorities
Airports included in the ATRS Airport Benchmarking Report (Cont.)
5
UNIT COST AND UNIT COMPETITIVENESS
The report presents a number of unit cost measures.
These include measures such as labour cost per passenger,
labour cost per aircraft movement, etc. A unit cost index
provides a means by which to examine the relationship to
various airport characteristics and airport service levels.
FINANCIAL RESULTS
The report presents a number of revenue generation
indicators and common financial ratios, including aeronautical
revenue per aircraft movement, total revenue per passenger,
return on equity, current ratio, return on asset, etc. A yield for
total revenue per unit of output is also provided as an overall
revenue generation indicator.
AIRPORT CHARGES
One means for airports to derive revenues is through
charges associated with aeronautical activities. Aeronautical
charges are levied for the use of an airport’s runway, apron and
terminal facilities. Landing charges, typically based on the
weight of the aircraft, terminal (Passenger) charges, generally
levied on the number of passengers at time of departure, and
aeronautical fee as a whole are compared in the report. Three
types of aircraft reflecting different aircraft weight classes are
considered: Boeing 747-400, Boeing 767-400, Boeing 737-
800, Airbus 321, and CRJ 200. A breakdown of landing
charges by weight categories and passenger charges by
boarding passenger is also included.
.
About the ATRS Airport Benchmarking Report (Cont.)
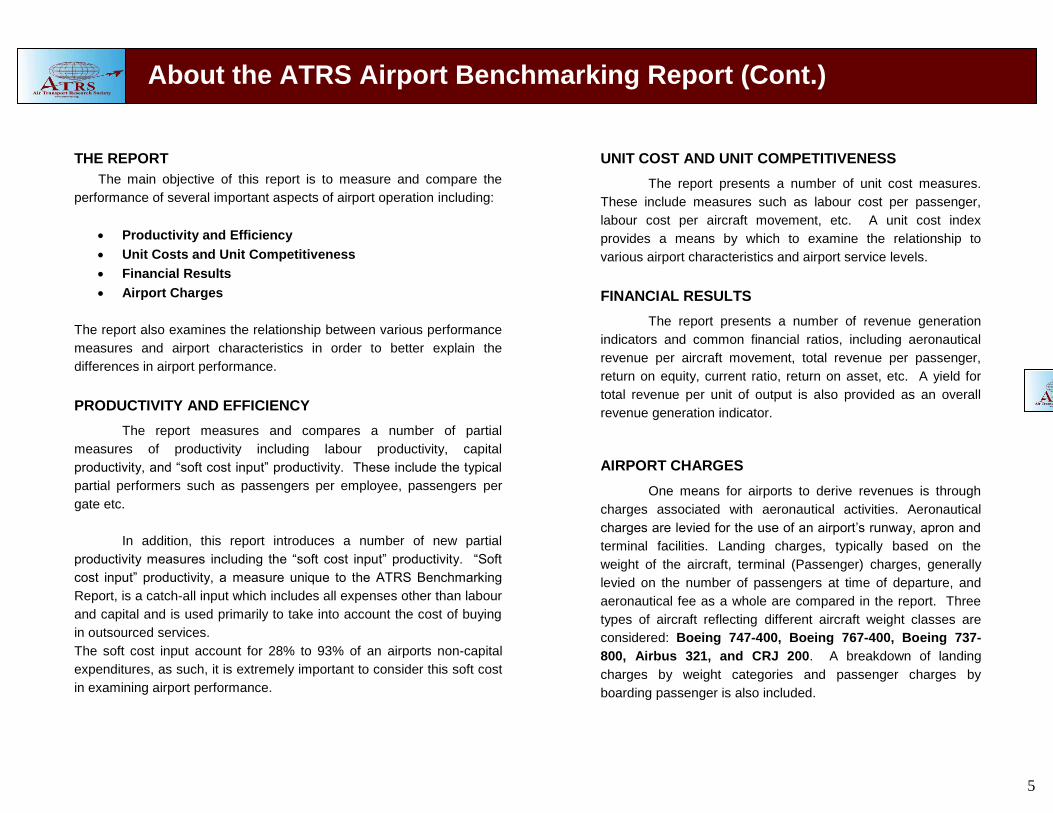
THE REPORT
The main objective of this report is to measure and compare the
performance of several important aspects of airport operation including:
Productivity and Efficiency
Unit Costs and Unit Competitiveness
Financial Results
Airport Charges
The report also examines the relationship between various performance
measures and airport characteristics in order to better explain the
differences in airport performance.
PRODUCTIVITY AND EFFICIENCY
The report measures and compares a number of partial
measures of productivity including labour productivity, capital
productivity, and “soft cost input” productivity. These include the typical
partial performers such as passengers per employee, passengers per
gate etc.
In addition, this report introduces a number of new partial
productivity measures including the “soft cost input” productivity. “Soft
cost input” productivity, a measure unique to the ATRS Benchmarking
Report, is a catch-all input which includes all expenses other than labour
and capital and is used primarily to take into account the cost of buying
in outsourced services.
The soft cost input account for 28% to 93% of an airports non-capital
expenditures, as such, it is extremely important to consider this soft cost
in examining airport performance.
Financial Performance – Aeronautical Revenue Share
6
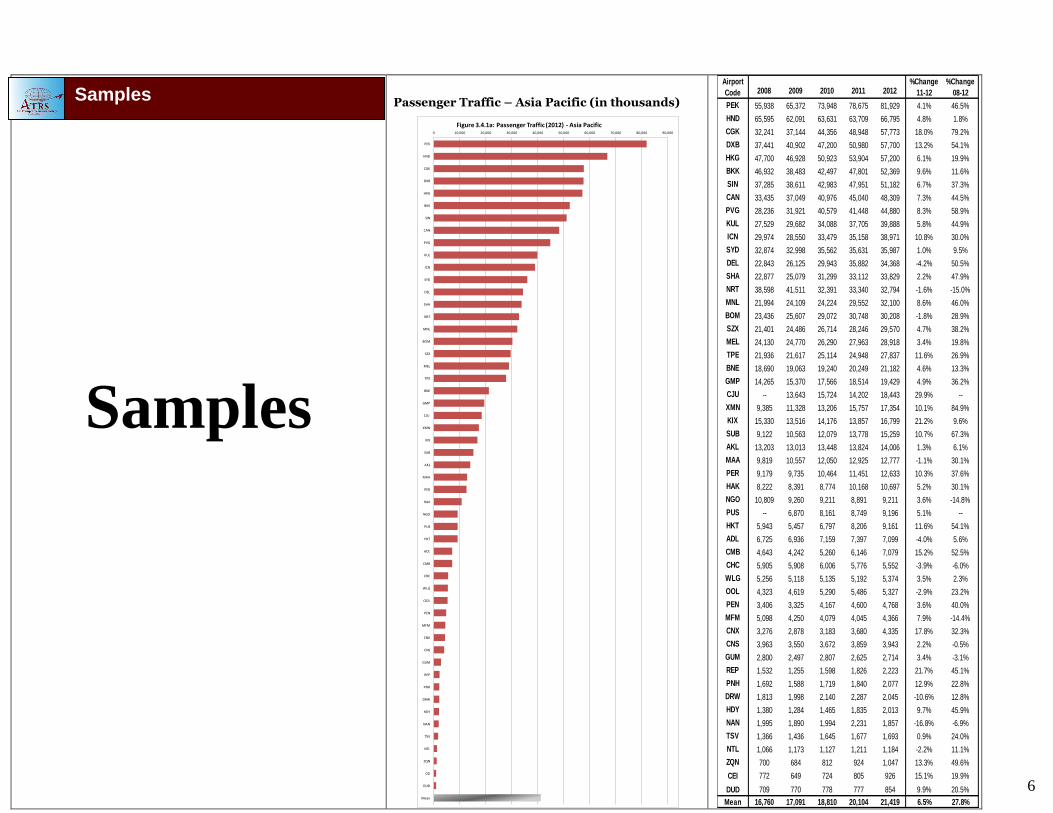
Samples
Passenger Traffic – Asia Pacific (in thousands)
0 10,000 20,000 30,000 40,000 50,000 60,000 70,000 80,000 90,000
PEK
HND
CGK
DXB
HKG
BKK
SIN
CAN
PVG
KUL
ICN
SYD
DEL
SHA
NRT
MNL
BOM
SZX
MEL
TPE
BNE
GMP
CJU
XMN
KIX
SUB
AKL
MAA
PER
HAK
NGO
PUS
HKT
ADL
CMB
CHC
WLG
OOL
PEN
MFM
CNX
CNS
GUM
REP
PNH
DRW
HDY
NAN
TSV
NTL
ZQN
CEI
DUD
Mean
Figure 3.4.1a: Passenger Traffic (2012) - Asia Pacific
Airport
Code 2008 2009 2010 2011 2012%Change
11-12
%Change
08-12
PEK 55,938 65,372 73,948 78,675 81,929 4.1% 46.5%
HND 65,595 62,091 63,631 63,709 66,795 4.8% 1.8%
CGK 32,241 37,144 44,356 48,948 57,773 18.0% 79.2%
DXB 37,441 40,902 47,200 50,980 57,700 13.2% 54.1%
HKG 47,700 46,928 50,923 53,904 57,200 6.1% 19.9%
BKK 46,932 38,483 42,497 47,801 52,369 9.6% 11.6%
SIN 37,285 38,611 42,983 47,951 51,182 6.7% 37.3%
CAN 33,435 37,049 40,976 45,040 48,309 7.3% 44.5%
PVG 28,236 31,921 40,579 41,448 44,880 8.3% 58.9%
KUL 27,529 29,682 34,088 37,705 39,888 5.8% 44.9%
ICN 29,974 28,550 33,479 35,158 38,971 10.8% 30.0%
SYD 32,874 32,998 35,562 35,631 35,987 1.0% 9.5%
DEL 22,843 26,125 29,943 35,882 34,368 -4.2% 50.5%
SHA 22,877 25,079 31,299 33,112 33,829 2.2% 47.9%
NRT 38,598 41,511 32,391 33,340 32,794 -1.6% -15.0%
MNL 21,994 24,109 24,224 29,552 32,100 8.6% 46.0%
BOM 23,436 25,607 29,072 30,748 30,208 -1.8% 28.9%
SZX 21,401 24,486 26,714 28,246 29,570 4.7% 38.2%
MEL 24,130 24,770 26,290 27,963 28,918 3.4% 19.8%
TPE 21,936 21,617 25,114 24,948 27,837 11.6% 26.9%
BNE 18,690 19,063 19,240 20,249 21,182 4.6% 13.3%
GMP 14,265 15,370 17,566 18,514 19,429 4.9% 36.2%
CJU -- 13,643 15,724 14,202 18,443 29.9% --
XMN 9,385 11,328 13,206 15,757 17,354 10.1% 84.9%
KIX 15,330 13,516 14,176 13,857 16,799 21.2% 9.6%
SUB 9,122 10,563 12,079 13,778 15,259 10.7% 67.3%
AKL 13,203 13,013 13,448 13,824 14,006 1.3% 6.1%
MAA 9,819 10,557 12,050 12,925 12,777 -1.1% 30.1%
PER 9,179 9,735 10,464 11,451 12,633 10.3% 37.6%
HAK 8,222 8,391 8,774 10,168 10,697 5.2% 30.1%
NGO 10,809 9,260 9,211 8,891 9,211 3.6% -14.8%
PUS -- 6,870 8,161 8,749 9,196 5.1% --
HKT 5,943 5,457 6,797 8,206 9,161 11.6% 54.1%
ADL 6,725 6,936 7,159 7,397 7,099 -4.0% 5.6%
CMB 4,643 4,242 5,260 6,146 7,079 15.2% 52.5%
CHC 5,905 5,908 6,006 5,776 5,552 -3.9% -6.0%
WLG 5,256 5,118 5,135 5,192 5,374 3.5% 2.3%
OOL 4,323 4,619 5,290 5,486 5,327 -2.9% 23.2%
PEN 3,406 3,325 4,167 4,600 4,768 3.6% 40.0%
MFM 5,098 4,250 4,079 4,045 4,366 7.9% -14.4%
CNX 3,276 2,878 3,183 3,680 4,335 17.8% 32.3%
CNS 3,963 3,550 3,672 3,859 3,943 2.2% -0.5%
GUM 2,800 2,497 2,807 2,625 2,714 3.4% -3.1%
REP 1,532 1,255 1,598 1,826 2,223 21.7% 45.1%
PNH 1,692 1,588 1,719 1,840 2,077 12.9% 22.8%
DRW 1,813 1,998 2,140 2,287 2,045 -10.6% 12.8%
HDY 1,380 1,284 1,465 1,835 2,013 9.7% 45.9%
NAN 1,995 1,890 1,994 2,231 1,857 -16.8% -6.9%
TSV 1,366 1,436 1,645 1,677 1,693 0.9% 24.0%
NTL 1,066 1,173 1,127 1,211 1,184 -2.2% 11.1%
ZQN 700 684 812 924 1,047 13.3% 49.6%
CEI 772 649 724 805 926 15.1% 19.9%
DUD 709 770 778 777 854 9.9% 20.5%
Mean 16,760 17,091 18,810 20,104 21,419 6.5% 27.8%
Samples
7
0%
10%
20%
30%
40%
50%
60%
70%
80%
90%
KEF
FRA
BSL
OSL
CD
G
OR
Y
ATH HA
J
AM
S
CP
H
TRN
TLL
DU
B
TLV
IST
CIA
FCO
ZRH
BH
X
VIE
STR
LTN
ZAG
BU
D
LJU
LIN
MX
P
AR
N
MA
N
GV
A
MU
C
BG
Y
RIX
HA
M
SOF
LGW ED
I
NA
P
SAW
STN LIS
OP
O
SZG
LHR
VC
E
DU
S
CG
N
ALC
AG
P
BLQ TX
L
LPA
WA
W
MLA
BC
N
HEL
PM
I
MA
D
LED
BEG
TAV
Isav
ia
Frap
ort
AD
P
Sch
iph
ol
DA
A
AD
R
Avi
no
r
MA
G
SEA
Swe
dav
ia
AN
A
He
ath
row
Be
rlin
PP
L
AEN
A
Fin
avia
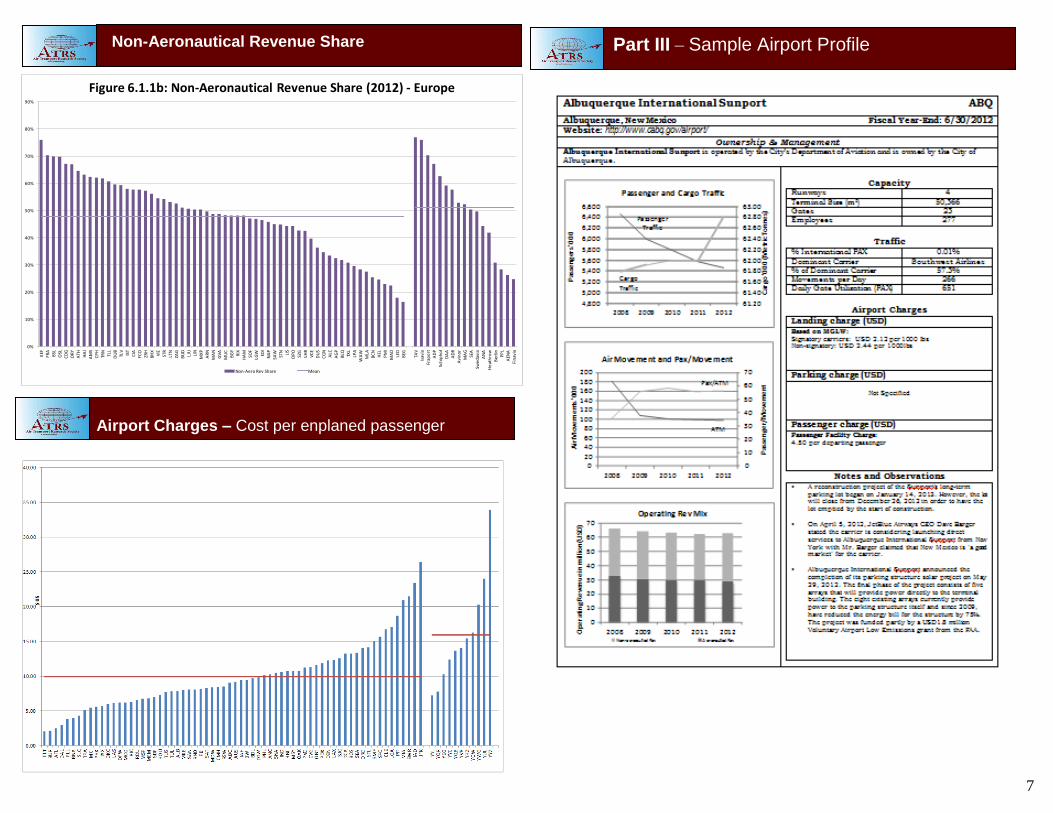
Figure 6.1.1b: Non-Aeronautical Revenue Share (2012) - Europe
Non-Aero Rev Share Mean
Airport Charges – Cost per enplaned passenger
Part III – Sample Airport Profile Non-Aeronautical Revenue Share
8
Part I. Summary Report
Background and Objectives
Summary of Results
Results on the Productivity Measurement and Analysis Partial Productivity Measures
Labour Productivity
Soft Cost Input Productivity Capital Productivity
Variable Factor Productivity
Gross Variable Factor Productivity Residual Variable Factor Productivity
Unit Variable Cost and Cost Competitiveness
Airport Cost Structure Unit Variable Cost
Cost Competitiveness
Airport Financial Performance Revenue Share
Revenue generation
Financial Profitability Airport Rate and Charges
Summary Tables
Summary Tables of Productivity and Efficiency Summary Tables of Airport Cost Performance
Summary Tables of Airport Revenue
Summary Figures
Part II. Analysis and Full Results 1. Introduction
1.1 Objectives
1.2 Approach and Scope
2. Sample Airports
3. Airport Capacities and Traffic Volume
3.1 Airside Capacity
3.2 Terminal-Side Capacity 3.2.1 Number of Gates
3.2.2 Terminal Size
3.3 Number of Employees 3.4 Traffic Volume
3.4.1 Passenger Traffic
3.4.2 Cargo Traffic 3.4.3 Work Load Unit (WLU)
3.4.4 Aircraft Movements
3.4.5 Passengers per Aircraft Movement 3.5 Market Share of Dominant Hub Carrier
4. Airport Productivity and Efficiency Performance 4.1 Outputs and Inputs
4.2 Partial Productivity Measures 4.2.1 Labor Productivity
4.2.1.1 Number of Passengers per Employee
4.2.1.2 Aircraft Movements per Employee
4.2.1.3 Work Load Units (WLU) per Employee 4.2.1.4 Overall Labor Productivity
4.2.2 Capital Productivity
4.2.2.1 Passengers per Gate 4.2.2.2 Passengers per Square Meter of Terminal Space
4.2.2.3 Aircraft Movement per Runway
4.2.3 Productivity of Soft Cost Input 4.2.3.1 Soft Cost Input Productivity with Passengers as Output
4.2.3.2 Soft Cost Input Productivity-Overall Output Index
4.3 Variable Factor Productivity
4.4 Factors Affecting Productivity
4.4.1 Labour Productivity and Airport Size
4.4.2 Labour Productivity vs. International Traffic 4.4.3 Labour Productivity vs. Cargo Traffic
4.4.4 Capital Productivity vs. Airport Size
4.4.5 Capital Productivity vs. International Traffic 4.4.6 Soft Cost Input Productivity vs. Airport Size
4.4.7 Soft Cost Input Productivity vs. Share of International Traffic
4.4.8 Variable Factor Productivity vs. Airport Characteristics 4.5 Variable Factor Productivity Decomposition and Productive Efficiency
4.5.1 VFP Regression
4.5.2 Residual Variable Factor Productivity
Appendix 4A Comparison of VFP and Stochastic Cost Frontier
Stochastic Cost Frontier Function Estimation
Comparison of Residual VFP and Cost Frontier Results
5. Airport Cost Performance 5.1 Airport Cost Structure
5.1.1 Labour Cost Share
5.1.2 Soft Cost Shares 5.2 Unit Cost
5.2.1 Labour Cost per Passenger
5.2.2 Labour Cost per Aircraft Movement 5.2.3 Labour Cost per Work Load Unit
5.2.4 Variable Cost per Passenger
5.2.5 Variable Cost per Aircraft Movement 5.2.6 Variable Cost per Work Load Unit
5.2.7 Unit Variable Cost Index
5.3 Factors Affecting Unit Costs 5.3.1 Input Prices
5.3.1.1 Average Annual Employee Compensation
5.3.1.2 Variable Input Price Index 5.3.2 Unit Variable Cost vs. Labour Price
5.3.3 Unit Variable Cost vs. Airport Size
5.3.4 Unit Variable Cost vs. Airport Characteristics 5.4 Cost Competitiveness
6. Airport Financial Performance 6.1 Revenue Shares
6.1.1 Non-Aeronautical Revenue Share
6.1.2 Aeronautical Revenue Share 6.1.3 Concession Revenue Share
6.1.4 Parking Revenue Share
6.2 Revenue Generation 6.2.1 Aeronautical Revenue per Aircraft Movement
6.2.2 Concession Revenue per Passenger
Table of Contents
9
6.2.3 Operating Revenue per Passenger 6.2.4 Operating Revenue per Aircraft Movement
6.2.5 Operating Revenue per Work Load Unit
6.2.6 Operating Revenue per Employee 6.3 Financial Profitability
6.3.1 Net Operating Income
6.3.2 EBITDA 6.3.3 Operating Margin
6.3.4 Current Ratio
6.3.5 Return on Asset
6.3.6 Return on Equity
6.3.7 Debt-Asset Ratio
6.3.8 Debt-Equity Ratio
7. Airport Rates and Charges
7.1 Landing Charges 7.2 Terminal (Passenger) Charges
7.3 Combined Landing and Passenger Charges
7.3.1 Combined Landing and Passenger Charges without Baggage and Check-in Charges
7.3.2 Combined Landing and Passenger Charges with Baggage and Check-in
Charges
7.4 Cost per Enplaned Passenger
7.5 Air Travel Security Charges
7.6 Other Airport Charges
Part III. Airport Profiles, Methodologies and Data Description Appendix I Airport Profiles
Asia Pacific Airports
European Airports
North American Airports
Appendix II Methodology: Computation of Total Factor Productivity
Appendix III Data and Data Sources
List of Tables S-1 Sample Airports S-2 Airport Characteristics S-3 Partial Factor Productivity Measures S-4 Other Partial Productivity Measures S-5 Gross Variable Factor Productivity S-6 Residual Variable Factor Productivity S-7 Unit Variable Cost and Airport Cost Competitiveness S-8 Revenue Shares S-9 Revenue Generation Indicators
2-1a Sample Airports-Asia Pacific 2-1b Sample Airports-Europe
2-1c Sample Airports-North America
2-2a Airport Characteristics-Asia Pacific 2-2b Airport Characteristics-Europe
2-2c Airport Characteristics-North America
3.1a Length of Runways –Asia Pacific
3.1b Length of Runways –Europe 3.1c Length of Runways –North America
4.1.1a Input Measures – Asia Pacific
4.1.1b Input Measures – Europe
4.1.1c Input Measures – North America 4.1.2a Output Measures – Asia Pacific
4.1.2b Output Measures – Europe
4.1.2c Output Measures – North America 4.5.1a VFP Regression Results – Asia Pacific
4.5.1b VFP Regression Results – Europe
4.5.1c VFP Regression Results – North America
4A-1 Cost Frontier Function Estimation Results
7.1a Landing Charges – Asia Pacific 7.1b Landing Charges – Europe
7.1c Landing Charges – North America
7.2.1a Terminal (Passenger) Charges for International Flights– Asia Pacific 7.2.1b Terminal (Passenger) Charges for International Flights – Europe
7.2.1c Average Terminal (Passenger) Charges – North America
7.2.2a Terminal (Passenger) Charges with Baggage and Check-in Charges-Asia Pacific 7.2.2b Terminal (Passenger) Charges with Baggage and Check-in Charges-Europe
7.3.1a Combined Landing and Terminal Charges without Baggage and Check-in
Charges– Asia Pacific
7.3.1b Combined Landing and Terminal Charges without Baggage and Check-in
Charges–Europe 7.3.2a Combined Landing and Terminal Charges with Baggage and Check-in
Charges-Asia Pacific 7.3.2b Combined Landing and Terminal Charges with Baggage and Check-in
Charges-Europe
7.4 Cost per Enplaned Passenger-North America 7-5a Air Travel Security Charges – Asia Pacific
7-5b Airport Security Charges – Europe
7-5c Airport Security Charges – North America 7-6a Other Airport Charges – Asia Pacific
7-6b Other Airport Charges – Europe
7-6c Other Airport Charges – North America
List of Figures S-1 Labor Productivity
S-2 Soft Cost Input Productivity
S-3 Passengers per Square Meter of Terminal Area S-4 Residual Variable Factor Productivity
S-5 Non-Aeronautical Revenue Share
S-6 Revenue per Passenger I-86
S-7 Revenue per Employee I-87
S-8 Landing Charges for Boeing 737 I-88
S-9 Landing Charges for Airbus 320 I-92 S-10 Combined Landing and Passenger Charges
3.2.1a Number of Gates – Asia Pacific 3.2.1b Number of Gates – Europe
3.2.1c Number of Gates – North America
3.2.2a Passenger Terminal Size – Asia Pacific 3.2.2b Passenger Terminal Size – Europe
Table of Contents (cont.)
10
3.2.2c Passenger Terminal Size – North America 3.3a Number of Employees – Asia Pacific
3.3b Number of Employees – Europe
3.3c Number of Employees – North America 3.4.1a Passenger Traffic – Asia Pacific
3.4.1b Passenger Traffic – Europe
3.4.1c Passenger Traffic – North America 3.4.1d International Share Passenger Traffic – Asia Pacific
3.4.1e International Share Passenger Traffic – Europe
3.4.1f International Share Passenger Traffic – North America
3.4.1g Seat Share of Inter-Continental Flights – Asia Pacific
3.4.1h Seat Share of Inter-Continental Flights – Europe
3.4.1i Seat Share of Inter-Continental Flights – North America 3.4.2a Cargo Traffic – Asia Pacific
3.4.2b Cargo Traffic – Europe
3.4.2c Cargo Traffic – North America 3.4.3a Work Load Units (WLU) – Asia Pacific
3.4.3b Work Load Units (WLU) – Europe
3.4.3c Work Load Units (WLU) – North America 3.4.4a Aircraft Movement – Asia Pacific
3.4.4b Aircraft Movement – Europe
3.4.4c Aircraft Movement – North America
3.4.5a Passengers per Aircraft Movement – Asia Pacific
3.4.5b Passengers per Aircraft Movement – Europe
3.4.5c Passengers per Aircraft Movement – North America 3.5a Share of Flights by Dominant Carrier – Asia Pacific
3.5b Share of Flights by Dominant Carrier – Europe 3.5c Share of Flights by Dominant Carrier – North America
4.2.1.1a Passengers per Employee – Asia Pacific 4.2.1.1b Passengers per Employee – Europe
4.2.1.1c Passengers per Employee – North America
4.2.1.2a Aircraft Movements per Employee – Asia Pacific 4.2.1.2b Aircraft Movements per Employee – Europe
4.2.1.2c Aircraft Movements per Employee – North America
4.2.1.3a Work Load Units (WLU) per Employee – Asia Pacific 4.2.1.3b Work Load Units (WLU) per Employee – Europe
4.2.1.3c Work Load Units (WLU) per Employee – North America
4.2.1.4a Overall Labor Productivity – Asia Pacific 4.2.1.4b Overall Labor Productivity – Europe
4.2.1.4c Overall Labor Productivity – North America
4.2.2.1a Passengers per Gate – Asia Pacific 4.2.2.1b Passengers per Gate – Europe
4.2.2.1c Passengers per Gate – North America
4.2.2.2a Passengers per Square Meter of Terminal Area – Asia Pacific 4.2.2.2b Passengers per Square Meter of Terminal Area – Europe
4.2.2.2c Passengers per Square Meter of Terminal Area – North America
4.2.2.3a Aircraft Movements per Runway – Asia Pacific 4.2.2.3b Aircraft Movements per Runway – Europe
4.2.2.3c Aircraft Movements per Runway – North America
4.2.3.1a Productivity of Soft Cost Inputs with Passengers as Output – Asia Pacific 4.2.3.1b Productivity of Soft Cost Inputs with Passengers as Output – Europe
4.2.3.1c Productivity of Soft Cost Inputs with Passengers as Output – North America
4.2.3.2a Soft Cost Input Productivity – Overall Output Index – Asia Pacific 4.2.3.2b Soft Cost Input Productivity – Overall Output Index – Europe
4.2.3.2c Soft Cost Input Productivity –Overall Output Index – North America
4.3a Gross Variable Factor Productivity – Asia Pacific 4.3b Gross Variable Factor Productivity – Europe
4.3c Gross Variable Factor Productivity – North America
4.4.1a Passengers per Employee vs. Airport Size 4.4.1b Labour Productivity vs. Airport Size
4.4.2a Passengers per Employee vs. Share of International Traffic
4.4.2b Labour Productivity vs. Share of International Traffic 4.4.3a Passengers per Employee vs. Share of Cargo Traffic
4.4.3b Labour Productivity vs. Share of Cargo Traffic
4.4.4a Passengers per Gate vs. Airport Size
4.4.4b Passengers per Terminal Square Meter Area vs. Airport Size
4.4.4c Aircraft Movements per Runway vs. Airport Size
4.4.5a Passengers per Gate vs. Share of International Traffic 4.4.5b Passengers per Square Meter of Terminal Space vs. Share of International Traffic
4.4.5c Aircraft Movement per Runway vs. Share of International Traffic
4.4.6a Passengers per Unit of Soft Cost Input vs. Airport Size 4.4.6b Soft Cost Input Productivity vs. Airport Size
4.4.7a Passengers per Unit of Soft Cost Input vs. Share of International Traffic
4.4.7b Soft Cost Input Productivity vs. Share of International Traffic 4.4.8a Variable Factor Productivity vs. Airport Size
4.4.8b Variable Factor Productivity vs. Share of International Traffic
4.4.8c Variable Factor Productivity vs. Share of Cargo Traffic
4.4.8d Variable Factor Productivity vs. Share of Non-Aeronautical Revenue
4.5.2a1 Residual Variable Factor Productivity – Asia
4.5.2a2 Residual Variable Factor Productivity – Oceania 4.5.2b1 Residual Variable Factor Productivity – Europe (Large Airports)
4.5.2b2 Residual Variable Factor Productivity – Europe (Small & Medium Airports) 4.5.2c1 Residual Variable Factor Productivity – North America (Large Airports)
4.5.2c2 Residual Variable Factor Productivity – North America
(Small & Medium Airports) 4A-1a Residual VFP vs. Cost Frontier Efficiency Index 1
4A-1b Residual VFP vs. Cost Frontier Efficiency Index 2
5.1.1a Labour Cost Share – Asia Pacific
5.1.1b Labour Cost Share – Europe
5.1.1c Labour Cost Share – North America 5.2.1a Labour Cost per Passenger – Asia Pacific
5.2.1b Labour Cost per Passenger – Europe
5.2.1c Labour Cost per Passenger – North America 5.2.2a Labour Cost per Aircraft Movement – Asia Pacific
5.2.2b Labour Cost per Aircraft Movement – Europe
5.2.2c Labour Cost per Aircraft Movement – North America 5.2.3a Labour Cost per Work Load Unit – Asia Pacific
5.2.3b Labour Cost per Work Load Unit – Europe
5.2.3c Labour Cost per Work Load Unit – North America 5.2.4a Variable Cost per Passenger – Asia Pacific
5.2.4b Variable Cost per Passenger – Europe
5.2.4c Variable Cost per Passenger – North America 5.2.5a Variable Cost per Aircraft Movement – Asia Pacific
5.2.5b Variable Cost per Aircraft Movement – Europe
5.2.5c Variable Cost per Aircraft Movement – North America 5.2.6a Variable Cost per Work Load Unit – Asia Pacific
5.2.6b Variable Cost per Work Load Unit – Europe
5.2.6c Variable Cost per Work Load Unit – North America 5.2.7a Unit Variable Cost Index – Asia Pacific
5.2.7b Unit Variable Cost Index – Europe
Table of Contents (Cont.)
11
5.2.7c Unit Variable Cost Index – North America 5.3.1.1a Average Annual Employee Compensation – Asia Pacific
5.3.1.1b Average Annual Employee Compensation – Europe
5.3.1.1c Average Annual Employee Compensation – North America 5.3.1.2a Variable Input Price Index – Asia Pacific
5.3.1.2b Variable Input Price Index – Europe
5.3.1.2c Variable Input Price Index – North America 5.3.2 Unit Variable Cost vs. Labour Price
5.3.3 Unit Variable Cost vs. Airport Size
5.3.4a Unit Variable Cost vs. Aircraft Size
5.3.4b Unit Variable Cost vs. Share of International Traffic
5.3.4c Unit Variable Cost vs. Share of Non-Aeronautical Revenue
5.4a1 Cost Competitiveness – Asia 5.4a2 Cost Competitiveness – Oceania
5.4b1 Cost Competitiveness – Europe (Large Airports)
5.4b2 Cost Competitiveness – Europe (Small & Medium Airports) 5.4c1 Cost Competitiveness – North America (Large Airports)
5.4c2 Cost Competitiveness – North America (Small & Medium Airports)
6.1.1a Non-Aeronautical Revenue Share – Asia Pacific
6.1.1b Non-Aeronautical Revenue Share – Europe
6.1.1c Non-Aeronautical Revenue Share – North America
6.1.3a Concession Revenue Share – Asia Pacific
6.1.3b Concession Revenue Share – Europe
6.1.3c Concession Revenue Share – North America 6.1.4a Parking Revenue Share – Asia Pacific
6.1.4b Parking Revenue Share – Europe 6.1.4c Parking Revenue Share – North America
6.2.1a Aeronautical Revenue per Aircraft Movement – Asia Pacific
6.2.1b Aeronautical Revenue per Aircraft Movement – Europe 6.2.1c Aeronautical Revenue per Aircraft Movement – North America
6.2.2a Concession Revenue per Passenger – Asia Pacific
6.2.2b Concession Revenue per Passenger – Europe 6.2.2c Concession Revenue per Passenger – North America
6.2.3a Operating Revenue per Passenger – Asia Pacific
6.2.3b Operating Revenue per Passenger – Europe 6.2.3c Operating Revenue per Passenger – North America
6.2.4a Operating Revenue per Aircraft Movement – Asia Pacific
6.2.4b Operating Revenue per Aircraft Movement – Europe 6.2.4c Operating Revenue per Aircraft Movement – North America
6.2.5a Operating Revenue per Work Load Unit – Asia Pacific
6.2.5b Operating Revenue per Work Load Unit – Europe 6.2.5c Operating Revenue per Work Load Unit – North America
6.2.6a Operating Revenue per Employee – Asia Pacific
6.2.6b Operating Revenue per Employee – Europe 6.2.6c Operating Revenue per Employee – North America
6.3.1a Net Operating Income – Asia Pacific
6.3.1b Net Operating Income – Europe 6.3.1c Net Operating Income – North America
6.3.2a EBITDA – Asia Pacific
6.3.2b EBITDA – Europe 6.3.2c EBITDA – North America
6.3.3a Operating Margin – Asia Pacific
6.3.3b Operating Margin – Europe 6.3.3c Operating Margin – North America
6.3.4a Current Ratio – Asia Pacific
6.3.4b Current Ratio – Europe 6.3.4c Current Ratio – North America
6.3.5a Return on Assets – Asia Pacific
6.3.5b Return on Assets – Europe 6.3.5c Return on Assets – North America
6.3.6a Return on Equity – Asia Pacific
6.3.6b Return on Equity – Europe 6.3.6c Return on Equity – United States
6.3.6d Return on Retained Earnings – Canada
6.3.7a Debt-Assets Ratio – Asia Pacific
6.3.7b Debt-Assets Ratio – Europe
6.3.7c Debt-Assets Ratio – North America
6.3.8a Debt-Equity Ratio – Asia Pacific 6.3.8b Debt-Equity Ratio – Europe
6.3.8c Debt-Equity Ratio – United States
7.2.1a Terminal Charge per Passenger (International Flights) without Baggage
and Check-in Charge – Asia Pacific
7.2.1b Terminal Charge per Passenger (International Flights) without Baggage and Check-in Charge – Europe
7.2.1c Average (Terminal) Revenue per Passenger – North America
7.2.2a Terminal Charge per Passenger (International Flights) with Baggage
and Check-in Charge – Asia Pacific
7.2.2b Terminal Charge per Passenger (International Flights) with Baggage
and Check-in Charge – Europe 7.4 Cost per Enplaned Passenger – North America
Table of Contents (Cont.)

12
ISSN 1712-1205 The report consists of 3 volumes: Volume I Summary Report (98 pages) Volume II Full Results and Analysis (355 pages) Volume III Airport Profiles, Methodology and Data Description (229 pages)
I. Please select the report(s) you would like to order:
2014 report (PDF version): US$950
2013 report (PDF version): US$750
2012 report (PDF version): US$500
2011 report (PDF version): US$300
2010 report (PDF version): US$300
2009 report (PDF version): US$300
2008 report (PDF version): US$300
2007 report (PDF version): US$300
2006 report (PDF version): US$300
2005 report (PDF version): US$300
2004 report (PDF version): US$300
Email:
Commercial code (if applicable):
b) OPTIONAL: An additional US$100 for each PRINTED copy
* Leave this section blank if only PDF versions are required
Year(s): _________________________________
Mailing Information (Non-PO Box):
Name:
Company:
Address:
Postal Code: Country:
Phone: Fax:
II. Payment Method:
Credit Card:
Pay by pressing the “Buy Now” Button at the ATRS Website: http://www.atrsworld.org/airportawards.html
Wire Transfer: Bank of Montreal, University of British Columbia Branch, Tel: 1-604-665-7076 University Market Place, 2142 Western Parkway, Vancouver, B.C., Canada V6T 1V6 Account: Air Transport Research Group; Branch Transit: 0811; Account 4600-667 Swiftcode: BOFMCAM2; IBAN Code: 026227760; BIC Code: 0811 4600-667
Cheque (make payable to Air Transport Research Group)
Please tick if you are an individual or corporate member of ATRS
Airport Benchmarking Report Order Form
Please return to:
Air Transport Research Group Attn to: Prof. Tae Oum
Chairman, ATRS
Tel: 604-822-8254 604-266-3767
Email: [email protected]
Website: www.atrsworld.org


![Ergoespirometría: Interpretación clíniccardiología ... · > < d c c < f e c a l p m l k j h ] t l y d [ v d j h y h y t v v d v ] d i l w l t o j t D L Y H W X \ I H](https://static.fdocuments.in/doc/165x107/5f69f3e3db1624519530e0ae/ergoespirometra-interpretacin-clniccardiologa-d-c-c-.jpg)


