PACIFIC EARTHQUAKE ENGINEERING RESEARCH CENTER · PACIFIC EARTHQUAKE ENGINEERING RESEARCH CENTER...
144
PACIFIC EARTHQUAKE ENGINEERING RESEARCH CENTER Unbonded Pre-Tensioned Columns for Bridges in Seismic Regions Phillip M. Davis Todd M. Janes Marc O. Eberhard John F. Stanton Department of Civil and Environmental Engineering University of Washington PEER 2012/04 DECEMBER 2012
Transcript of PACIFIC EARTHQUAKE ENGINEERING RESEARCH CENTER · PACIFIC EARTHQUAKE ENGINEERING RESEARCH CENTER...

PACIFIC EARTHQUAKE ENGINEERING RESEARCH CENTER
Unbonded Pre-Tensioned Columns for Bridges in Seismic Regions
Phillip M. Davis Todd M. Janes
Marc O. Eberhard John F. Stanton
Department of Civil and Environmental EngineeringUniversity of Washington
PEER 2012/04DECEMBER 2012

Disclaimer
The opinions, findings, and conclusions or recommendations expressed in this publication are those of the author(s) and do not necessarily reflect the views of the study sponsor(s) or the Pacific Earthquake Engineering Research Center.
Unbonded Pre-Tensioned Columns for Bridges in Seismic Regions
Phillip M. Davis Todd M. Janes
Marc O. Eberhard John F. Stanton
Department of Civil and Environmental Engineering
University of Washington
PEER Report 2012/04 Pacific Earthquake Engineering Research Center
Headquartered at the University of California, Berkeley December 2012

ii
iii
ABSTRACT
The severe traffic delays caused by traditional cast-in-place bridge construction can be reduced by precasting components off site and assembling them rapidly on site. In seismic regions, connecting precast concrete columns and beams creates difficulties because the connections often occur at the locations of large, inelastic moment reversals. Previous researchers have addressed this challenge through the development of a “Large-Bar, Large Duct” [Pang et al. 2008] and a “Socket” connection [Haraldsson et al. 2011]. Both connections are easy to construct and robust under simulated seismic loading.
A new system is proposed that combines the existing connections with unbonded pre-tensioning in the columns, with the goal of improving seismic performance by re-centering the column following an earthquake. Both a socket column-to-footing subassembly (PreT-SF) and a grouted-bar column-to-cap beam subassembly (PreT-CB) were subjected to combined axial and lateral loads. The test results for these subassemblies were compared with the results of tests of subassemblies without prestressing.
The pre-tensioned specimens achieved the expected moment capacity and returned to within approximately 1% of vertical even after excursions to 10% drift. However, the columns experienced spalling, bar buckling, and bar fracture at lower drift ratios, and dissipated less energy, than their reinforced concrete counterparts.

iv
v
ACKNOWLEDGMENTS
This work was supported by the State of California through the Transportation Systems Research Program of the Pacific Earthquake Engineering Research Center (PEER). Any opinions, findings, and conclusion or recommendations expressed in this material are those of the author(s) and do not necessarily reflect those of the funding agency. This project would not have been possible without help from Olafur Haraldsson, and Hung Viet Tran, graduate students at the University of Washington. Additional support was provided by Vince Chaijaroen, lab manager at the University of Washington.

vi
vii
CONTENTS
ABSTRACT ................................................................................................................................ iii
ACKNOWLEDGMENTS ........................................................................................................... v
TABLE OF CONTENTS .......................................................................................................... vii
LIST OF FIGURES .................................................................................................................... xi
LIST OF TABLES ..................................................................................................................... xv
1 INTRODUCTION ............................................................................................................ 1
1.1 PRECASTING TO ACCELERATE BRIDGE CONSTRUCTION ...................... 1
1.2 COLUMN−TO−FOOTING CONNECTION: SOCKET CONNECTION CONCEPT ............................................................................................................. 2
1.3 COLUMN−TO−CAP BEAM CONNECTION: GROUTED BAR CONNECTION CONCEPT .................................................................................. 3
1.4 PRESTRESSING TO REDUCE RESIDUAL DISPLACEMENTS ..................... 5
1.5 NEW HYBRID GROUTED BAR SOCKET CONNECTION ............................. 6
1.6 RESEARCH OBJECTIVES AND SCOPE ........................................................... 7
2 DESIGN OF TEST SPECIMENS .................................................................................. 9 2.1 GEOMETRY OF TEST SPECIMENS ................................................................ 10
2.2 PROPERTIES OF TEST COLUMNS COMMON TO BOTH SPECIMENS .... 12
2.3 DETAILED DESIGN OF PRET−SF COLUMN ................................................ 13
2.4 DETAILED DESIGN OF PRET−SF FOOTING ................................................ 15
2.5 DETAILED DESIGN OF PRET−CB COLUMN ............................................... 15
2.6 DESIGN OF PRET−CB CAP BEAM ................................................................. 16
3 EXPERIMENTAL PROGRAM ................................................................................... 19 3.1 TEST SET UP ...................................................................................................... 19
3.2 INSTRUMENTATION ....................................................................................... 20
3.2.1 Applied Loads .......................................................................................... 20
3.2.2 Force Demands at Ends of Prestressing Strands ...................................... 20
3.2.3 Displacement Transducers ....................................................................... 22
3.2.4 Inclinometers ............................................................................................ 25
3.2.5 Strain Gauges ........................................................................................... 25
viii
3.2.6 Motion Capture System ........................................................................... 26
3.3 TESTING PROTOCOL ....................................................................................... 27
4 DAMAGE PROGRESSION ......................................................................................... 29 4.1 DEFINITIONS OF DAMAGE STATES ............................................................ 29
4.2 DAMAGE PROGRESSION ................................................................................ 30
4.3 COMPARISON OF DAMAGE PROGRESSION .............................................. 33
5 MEASURED RESPONSE ............................................................................................ 35 5.1 MATERIAL PROPERTIES ................................................................................ 35
5.1.1 Concrete Strength ..................................................................................... 35
5.1.2 Grout Strength .......................................................................................... 35
5.1.3 Mild Reinforcement ................................................................................. 36
5.2 MOMENT−DRIFT RESPONSE ......................................................................... 36
5.3 EFFECTIVE FORCE ........................................................................................... 40
5.4 COLUMN ROTATIONS ..................................................................................... 41
5.5 DISTRIBUTION OF COLUMN CURVATURES ............................................. 45
5.6 STRAINSIN COLUMN BARS ........................................................................... 47
5.6.1 Strain Profiles ........................................................................................... 47
5.6.2 Strain versus Drift Plots ........................................................................... 50
5.6.3 Strains in Reinforced Base Column for Specimen PreT-SF .................... 51
5.7 STRAINS IN SPIRAL ......................................................................................... 53
5.8 STRAND LOAD CELLS .................................................................................... 54
6 ANALYSIS OF MEASURED RESPONSE ................................................................. 57 6.1 STRENGTH DEGRADATION ........................................................................... 57
6.2 ENERGY DISSIPATION .................................................................................... 59
6.2.1 Energy Dissipation of Pre-Tensioned Specimens .................................... 59
6.2.2 Comparison of Energy Dissipation with Non-Prestressed Columns ....... 62
6.3 EQUIVALENT VISCOUS DAMPING .............................................................. 63
6.4 COLUMN RE−CENTERING ............................................................................. 66
6.4.1 Re−Centering Ratio ................................................................................. 66
6.4.2 Crossover Displacements ......................................................................... 68
6.5 INITIAL COLUMN STIFFNESS ....................................................................... 70
6.6 SHEAR STRENGTH ........................................................................................... 71
ix
6.7 FLEXURAL STRENGTH ................................................................................... 72
6.8 STRAND SLIP AND YIELD .............................................................................. 73
6.8.1 Strand Slip ................................................................................................ 73
6.8.2 Strand Yield ............................................................................................. 74
6.9 DAMAGE PROGRESSION MODELS .............................................................. 75
7 SUMMARY AND CONCLUSIONS ............................................................................ 77
7.1 SUMMARY ......................................................................................................... 77
7.2 CONCLUSIONS .................................................................................................. 78
7.3 RECOMMENDATIONS ..................................................................................... 78
7.3.1 Recommendations for Practice ................................................................ 78
7.3.2 Recommendations for Future Research ................................................... 79
REFERENCES ........................................................................................................................... 81
APPENDIX A: MATERIALS .................................................................................................. 83
APPENDIX B: SPECIMEN DRAWINGS .............................................................................. 87
APPENDIX C: TEST PHOTOS ............................................................................................... 97
APPENDIX D: PULL OUT TESTS ....................................................................................... 105

x
xi
LIST OF FIGURES
Figure 1.1 Overview of prestressed precast column concept. .............................................1
Figure 1.2 Cap beam socket connection ..............................................................................2
Figure 1.3 Socket connection construction metho ..............................................................3
Figure 1.4 Large bar grouted duct connection ....................................................................4
Figure 1.5 Pullout test setup for large bars ..........................................................................4
Figure 1.6 Theoretic hysteresis for non-prestressed and prestressed systems ....................5
Figure 1.7 Moment drift response of post-tensioned column .............................................6
Figure 1.8 Hybrid grouted bar socket connection. ..............................................................7
Figure 2.1 PreT-SF and PreT-CB assembly. .......................................................................9
Figure 2.2 Column-to-cap beam connection. ....................................................................10
Figure 2.3 Bonded portions for prototype and test specimens. .........................................12
Figure 2.4 Cross section for test columns. ........................................................................13
Figure 2.5 Cross section and profile of reinforced base for PreT-SF. ...............................14
Figure 2.6 Reduced section for actuator. ...........................................................................14
Figure 2.7 Footing reinforcing layout. ..............................................................................15
Figure 2.8 Reduced diameter section for PreT-CB. ..........................................................16
Figure 2.9 Cap beam reinforcing layout. ...........................................................................17
Figure 3.1 Self-reacting frame and Baldwin Universal Testing Machine .........................19
Figure 3.2 Adjustable anchor system. ...............................................................................20
Figure 3.3 Adaptor piece for stressing strand chucks. ......................................................21
Figure 3.4 Loading ring. ....................................................................................................21
Figure 3.5 Linear potentiometers for PreT-SF. .................................................................22
Figure 3.6 Curvature rod track system. .............................................................................23
Figure 3.7 Rocking rod for measuring vertical displacement of PreT-SF. .......................24
Figure 3.8 Linear potentiometers for PreT-CB. ................................................................24
Figure 3.9 Strain gauge locations for PreT-SF. .................................................................25
Figure 3.10 Strain gauge locations for PreT-CB. ................................................................26
Figure 3.11 Optotrak camera and LED. ..............................................................................26
xii
Figure 4.1 North and south direction definition. ...............................................................31
Figure 4.2 Spiral from PreT-SF. ........................................................................................32
Figure 4.3 Bar fracture for PreT-SF. .................................................................................32
Figure 4.4 Spiral termination for PreT-CB. ......................................................................33
Figure 4.5 Major damage state comparison. .....................................................................33
Figure 5.1 Variable definition for moment calculation. ....................................................37
Figure 5.2 Friction correction model. ................................................................................37
Figure 5.3 Uncorrected moment-drift plot. .......................................................................38
Figure 5.4 Moment-drift plot with k=60 kips/in. ..............................................................38
Figure 5.5 Moment-drift response for specimen PreT-SF. ...............................................39
Figure 5.6 Moment drift response for specimen PreT-CB. ...............................................39
Figure 5.7 Effective force versus displacement for specimen PreT-SF. ...........................41
Figure 5.8 Effective force versus displacement for specimen PreT-CB. ..........................41
Figure 5.9 Rotation profile from inclinometers for specimen PreT-SF. ...........................42
Figure 5.10 Rotation profile from inclinometers for specimen PreT-CB. ..........................42
Figure 5.11 Rotation profile from Optotrak for specimen PreT-SF. ...................................43
Figure 5.12 Rotation profile from Optotrak for specimen PreT-CB. ..................................43
Figure 5.13 Rotation profile from curvature rods for specimen PreT-SF. ..........................44
Figure 5.14 Comparison of three rotation methods for specimen PreT-SF. .......................44
Figure 5.15 Comparison of inclinometers and Optotrack for specimen PreT-CB. ............45
Figure 5.16 Distribution of curvature for specimen PreT-SF. ............................................47
Figure 5.17 Distribution of curvature for specimen PreT-CB. ............................................47
Figure 5.18 As-labeled north bar strain profile for specimen PreT-SF. ..............................48
Figure 5.19 Strain versus time for specimen PreT-SF. .......................................................48
Figure 5.20 Corrected north bar strain profile for specimen PreT-SF. ...............................49
Figure 5.21 North bar strain profile for specimen PreT-CB. ..............................................49
Figure 5.22 North bar strain versus drift for specimen PreT-SF. ........................................50
Figure 5.23 North bar strain versus drift for specimen PreT-CB. .......................................51
Figure 5.24 Southwest bar strain versus drift at interface. ..................................................52
Figure 5.25 Northeast bar strain versus drift at interface. ...................................................52
Figure 5.26 Damage of specimen PreT-SF at 6% drift. ......................................................53
Figure 5.27 Spiral strain versus drift for specimen PreT-SF. ..............................................54
xiii
Figure 5.28 Spiral strain versus drift for specimen PreT-CB. .............................................54
Figure 5.29 Load cell on non-slipped strand. ......................................................................55
Figure 5.30 Load cell on slipped strand. .............................................................................55
Figure 6.1 Effective force versus drift envelopes. .............................................................58
Figure 6.2 Normalized strength degradation comparison. ................................................58
Figure 6.3 Energy dissipation per cycle with cycle 23 missing. .......................................60
Figure 6.4 Modified energy dissipation per cycle for specimen PreT-SF. ........................60
Figure 6.5 Energy dissipation per cycle for specimen PreT-CB. ......................................61
Figure 6.6 Cumulative energy dissipation for specimen PreT-SF. ...................................61
Figure 6.7 Cumulative energy dissipation for specimen PreT-CB. ..................................62
Figure 6.8 Normalization method for energy dissipation ..................................................63
Figure 6.9 Normalized energy dissipation. .......................................................................63
Figure 6.10 Equivalent viscous damping per cycle. ............................................................64
Figure 6.11 Equivalent viscous damping versus drift. ........................................................64
Figure 6.12 Equivalent viscous damping per cycle comparison. ........................................65
Figure 6.13 Equivalent viscous damping versus drift comparison. ....................................65
Figure 6.14 Equivalent viscous damping versus drift comparison with Priestley et al. .....66
Figure 6.15 Forces used to calculate re-centering ratio .......................................................67
Figure 6.16 Crossover displacement definition. ..................................................................67
Figure 6.17 Normalized crossover displacement versus maximum drift ratio of cycle. .....69
Figure 6.18 Normalized cross-over displacement for prestressed columns. .......................69
Figure 6.19 Results of the analysis OpenSees model. .........................................................73
Figure 6.20 Elongation versus drift for specimen PreT-SF.................................................74

xiv
xv
LIST OF TABLES
Table 3.1 Displacement history. ......................................................................................28
Table 4.1 Damage state definitions. .................................................................................29
Table 4.2 Summary of damage states for PreT-SF and PreT-CB. ...................................30
Table 5.1 Concrete strength on test day. ..........................................................................35
Table 5.2 Summary of reinforcing bar strengths. ............................................................36
Table 5.3 Summary of moment drift response. ................................................................40
Table 5.4 Summary of effective force displacement response. .......................................40
Table 6.1 Characteristics of PreT-SF, PreT-CB, LB6-PT, LB7-PT, and DB5-RE. ........70
Table 6.2 Summary of column secant stiffness at first yield. ..........................................70
Table 6.3 Comparison of measured and calculated EI. ....................................................71
Table 6.4 Results of OpenSees model. ............................................................................73
Table 6.5 Comparison of damage prediction with test observations using initial strand force. ................................................................................................................75
Table 6.6 Comparison of damage prediction with test observations using yield strand force. ................................................................................................................76
Table 6.7 Comparison of observed values/predicted values for damage states. ..............76

xvi
1
1 Introduction
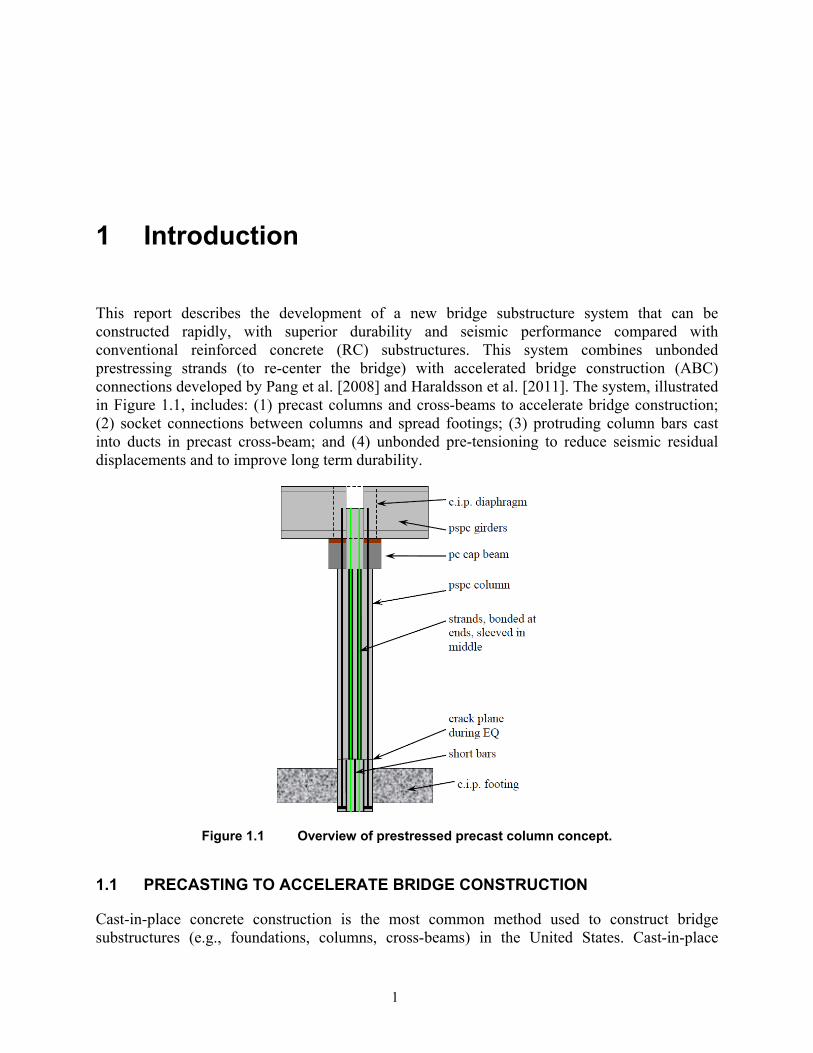
This report describes the development of a new bridge substructure system that can be constructed rapidly, with superior durability and seismic performance compared with conventional reinforced concrete (RC) substructures. This system combines unbonded prestressing strands (to re-center the bridge) with accelerated bridge construction (ABC) connections developed by Pang et al. [2008] and Haraldsson et al. [2011]. The system, illustrated in Figure 1.1, includes: (1) precast columns and cross-beams to accelerate bridge construction; (2) socket connections between columns and spread footings; (3) protruding column bars cast into ducts in precast cross-beam; and (4) unbonded pre-tensioning to reduce seismic residual displacements and to improve long term durability.
Figure 1.1 Overview of prestressed precast column concept.
1.1 PRECASTING TO ACCELERATE BRIDGE CONSTRUCTION
Cast-in-place concrete construction is the most common method used to construct bridge substructures (e.g., foundations, columns, cross-beams) in the United States. Cast-in-place
2
methods may be economical in some situations, but the severe traffic congestion caused by construction activities imposes large costs on the travelling public. These costs can be reduced with the development of rapid construction methods.
Precasting structural elements is one way to accelerate the construction of bridges. Downtime can be reduced significantly by constructing some elements off site and then bringing the individual pieces on site to be assembled. In regions of low seismicity, this strategy has been used often to construct bridge girders and occasionally for bridge structures. In contrast, substructures have rarely been precast in regions of moderate or high seismicity. Significant challenges must be overcome when using precast substructures in seismically active regions.
The most convenient location (considering transportation and construction logistics) to connect precast substructure elements is the beam-to-column and the column-to-footing interfaces. These locations are also the regions that will have the highest moment and inelastic demands during earthquakes. New systems are needed that are both seismically resistant and convenient to construct.
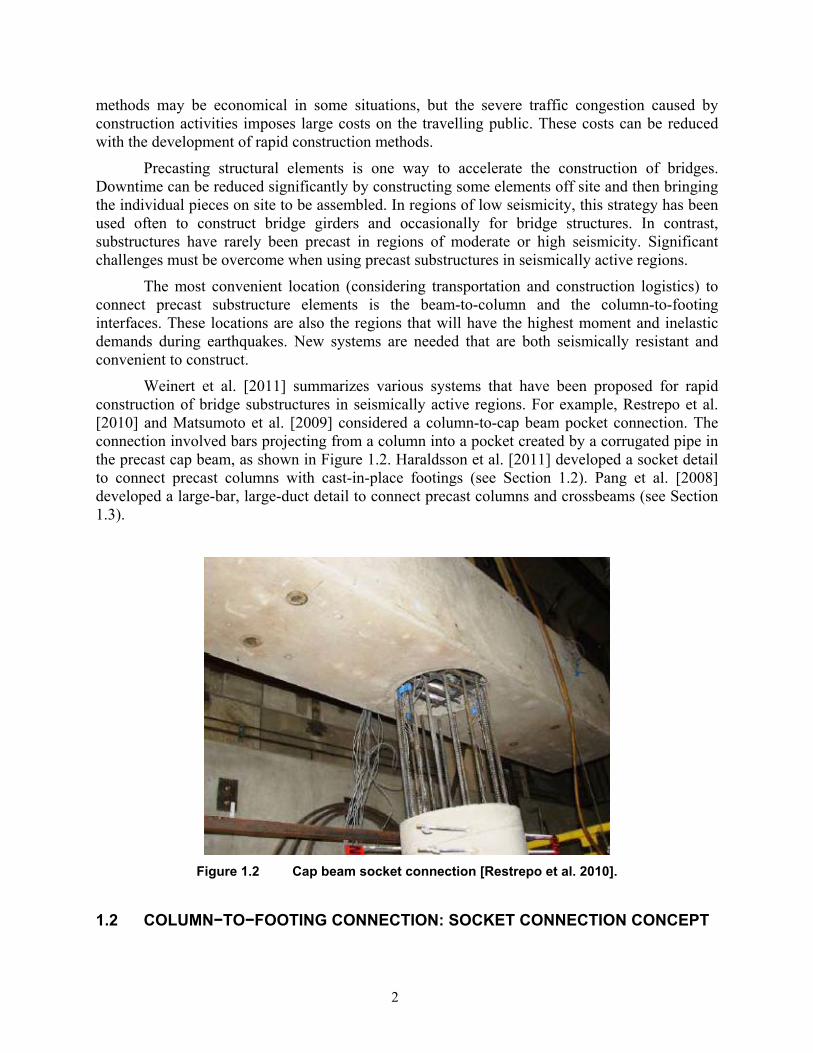
Weinert et al. [2011] summarizes various systems that have been proposed for rapid construction of bridge substructures in seismically active regions. For example, Restrepo et al. [2010] and Matsumoto et al. [2009] considered a column-to-cap beam pocket connection. The connection involved bars projecting from a column into a pocket created by a corrugated pipe in the precast cap beam, as shown in Figure 1.2. Haraldsson et al. [2011] developed a socket detail to connect precast columns with cast-in-place footings (see Section 1.2). Pang et al. [2008] developed a large-bar, large-duct detail to connect precast columns and crossbeams (see Section 1.3).
Figure 1.2 Cap beam socket connection [Restrepo et al. 2010].
1.2 COLUMN−TO−FOOTING CONNECTION: SOCKET CONNECTION CONCEPT
3
A socket connection has been developed to connect precast columns and the supporting spread footings. The socket connection was developed at the University of Washington in collaboration with Berger/ABAM Engineers, Concrete Technology Corporation, Tri-State Construction, and the Washington State Department of Transportation. The connection involves a precast concrete column embedded into a cast-in-place spread footing. The embedded portion has a roughened surface to increase the load transfer between the column and footing.
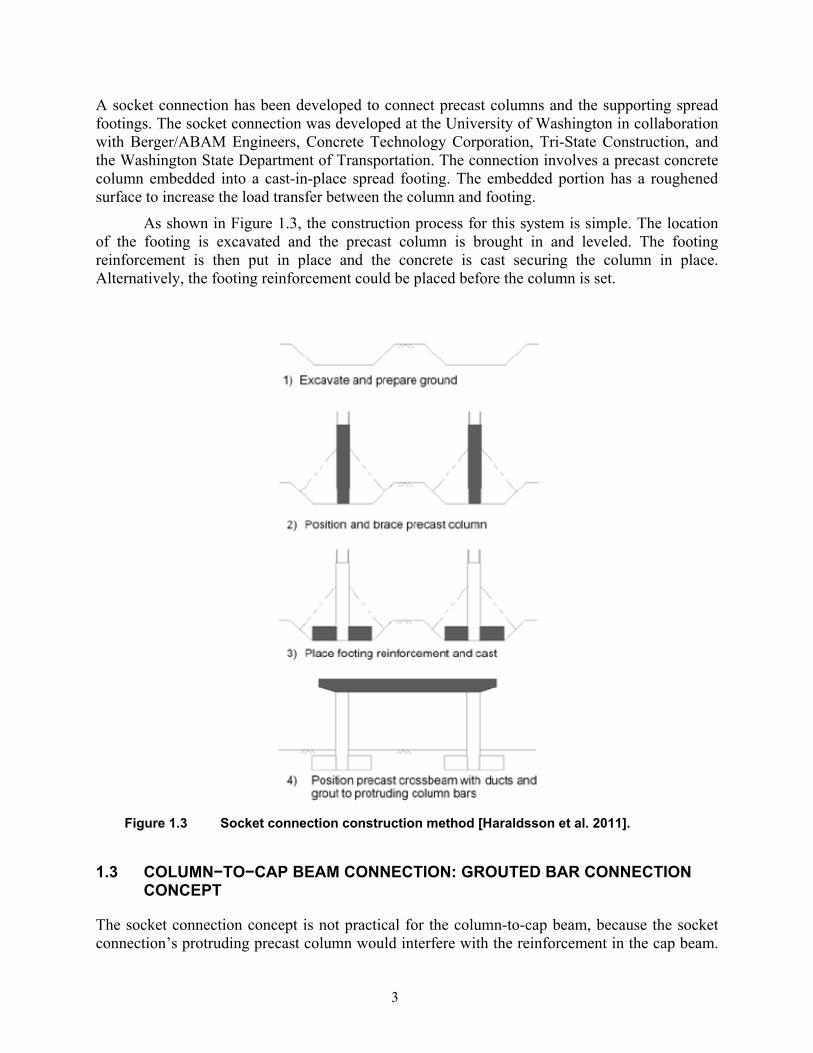
As shown in Figure 1.3, the construction process for this system is simple. The location of the footing is excavated and the precast column is brought in and leveled. The footing reinforcement is then put in place and the concrete is cast securing the column in place. Alternatively, the footing reinforcement could be placed before the column is set.
Figure 1.3 Socket connection construction method [Haraldsson et al. 2011].
1.3 COLUMN−TO−CAP BEAM CONNECTION: GROUTED BAR CONNECTION CONCEPT
The socket connection concept is not practical for the column-to-cap beam, because the socket connection’s protruding precast column would interfere with the reinforcement in the cap beam.

4
Another connection concept is needed at the beam to column interface. To facilitate precast rapid construction, a new connection was developed at the University of Washington. The connection involved column bars being grouted into corrugated metal ducts precast in the cap beam [Pang et al. 2008]. Aligning a large number of small bars into pre-cast ducts in a cap beam would be quite difficult, so instead, a small number of large bars and ducts were used in the column to make the connection easier to assemble (see Figure 1.4). Larger bars require longer development lengths. Steuck et al. [2007] evaluated the development length characteristics of the larger bars in grouted ducts and found that there was sufficient depth in the cap beam to develop large bars. Figure 1.5 shows the pullout test set up.
Figure 1.4 Large bar grouted duct connection [Pang et al. 2008].
Figure 1.5 Pullout test setup for large bars [Steuck et al. 2007].
5
1.4 PRESTRESSING TO REDUCE RESIDUAL DISPLACEMENTS
Many researchers have used prestressed, unbonded, high-strength tendons, bars or strands to reduce the residual displacement of systems after a seismic event (e.g., Cohagen et al. [2008]). The tendons are designed to remain elastic when the system undergoes large displacements. According to this concept, the elastic element will provide a restoring force that will return the element to its original location [Stanton et al. 1997]. The unbonded length of the tendons is large in comparison to the elongation expected in the tendons. Consequently, the deformations will be distributed throughout the unbonded length, the strain increment will remain low and the tendons will remain elastic.
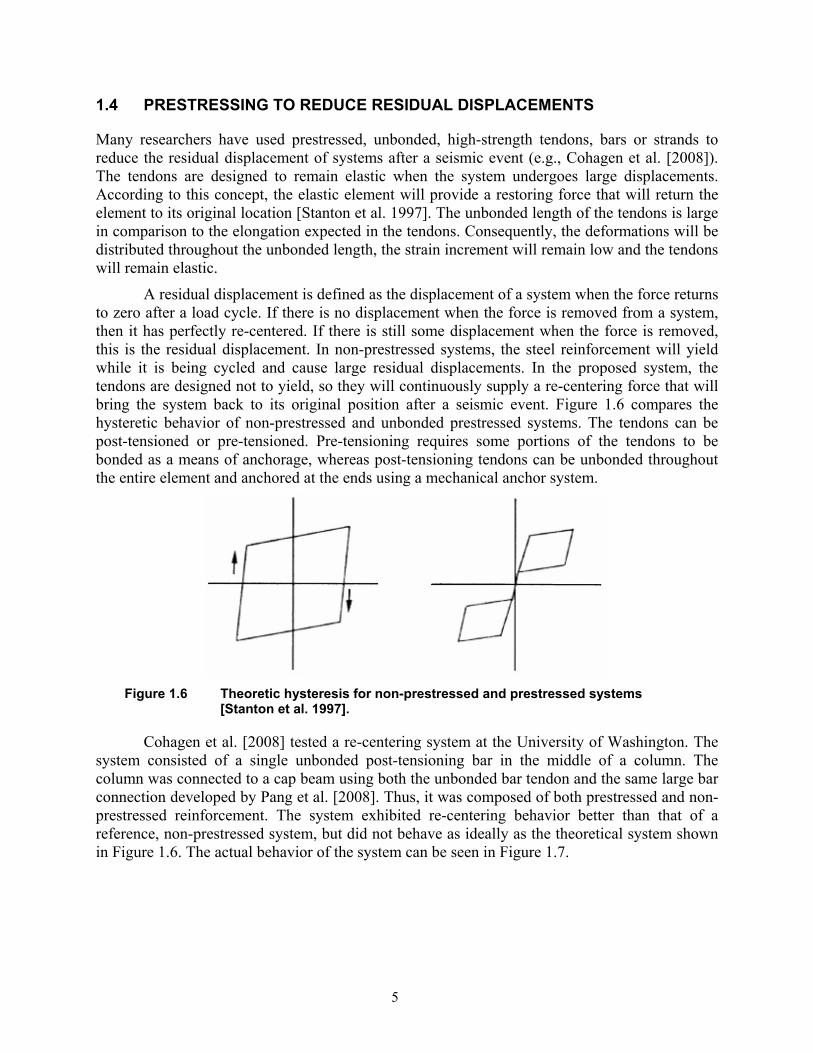
A residual displacement is defined as the displacement of a system when the force returns to zero after a load cycle. If there is no displacement when the force is removed from a system, then it has perfectly re-centered. If there is still some displacement when the force is removed, this is the residual displacement. In non-prestressed systems, the steel reinforcement will yield while it is being cycled and cause large residual displacements. In the proposed system, the tendons are designed not to yield, so they will continuously supply a re-centering force that will bring the system back to its original position after a seismic event. Figure 1.6 compares the hysteretic behavior of non-prestressed and unbonded prestressed systems. The tendons can be post-tensioned or pre-tensioned. Pre-tensioning requires some portions of the tendons to be bonded as a means of anchorage, whereas post-tensioning tendons can be unbonded throughout the entire element and anchored at the ends using a mechanical anchor system.
Figure 1.6 Theoretic hysteresis for non-prestressed and prestressed systems
[Stanton et al. 1997].
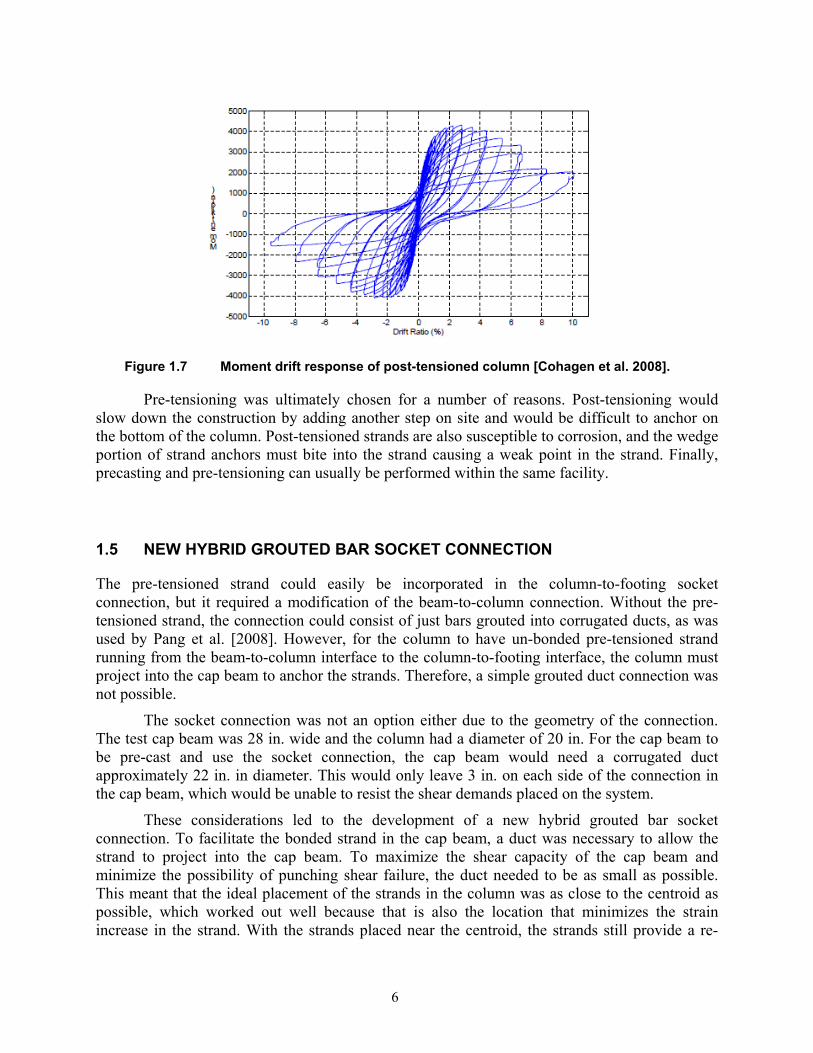
Cohagen et al. [2008] tested a re-centering system at the University of Washington. The system consisted of a single unbonded post-tensioning bar in the middle of a column. The column was connected to a cap beam using both the unbonded bar tendon and the same large bar connection developed by Pang et al. [2008]. Thus, it was composed of both prestressed and non-prestressed reinforcement. The system exhibited re-centering behavior better than that of a reference, non-prestressed system, but did not behave as ideally as the theoretical system shown in Figure 1.6. The actual behavior of the system can be seen in Figure 1.7.
6
Figure 1.7 Moment drift response of post-tensioned column [Cohagen et al. 2008].
Pre-tensioning was ultimately chosen for a number of reasons. Post-tensioning would slow down the construction by adding another step on site and would be difficult to anchor on the bottom of the column. Post-tensioned strands are also susceptible to corrosion, and the wedge portion of strand anchors must bite into the strand causing a weak point in the strand. Finally, precasting and pre-tensioning can usually be performed within the same facility.
1.5 NEW HYBRID GROUTED BAR SOCKET CONNECTION
The pre-tensioned strand could easily be incorporated in the column-to-footing socket connection, but it required a modification of the beam-to-column connection. Without the pre-tensioned strand, the connection could consist of just bars grouted into corrugated ducts, as was used by Pang et al. [2008]. However, for the column to have un-bonded pre-tensioned strand running from the beam-to-column interface to the column-to-footing interface, the column must project into the cap beam to anchor the strands. Therefore, a simple grouted duct connection was not possible.
The socket connection was not an option either due to the geometry of the connection. The test cap beam was 28 in. wide and the column had a diameter of 20 in. For the cap beam to be pre-cast and use the socket connection, the cap beam would need a corrugated duct approximately 22 in. in diameter. This would only leave 3 in. on each side of the connection in the cap beam, which would be unable to resist the shear demands placed on the system.
These considerations led to the development of a new hybrid grouted bar socket connection. To facilitate the bonded strand in the cap beam, a duct was necessary to allow the strand to project into the cap beam. To maximize the shear capacity of the cap beam and minimize the possibility of punching shear failure, the duct needed to be as small as possible. This meant that the ideal placement of the strands in the column was as close to the centroid as possible, which worked out well because that is also the location that minimizes the strain increase in the strand. With the strands placed near the centroid, the strands still provide a re-
7
centering force, but yielding will occur at a large drift value because the strands experience less strain closer to the centroid.
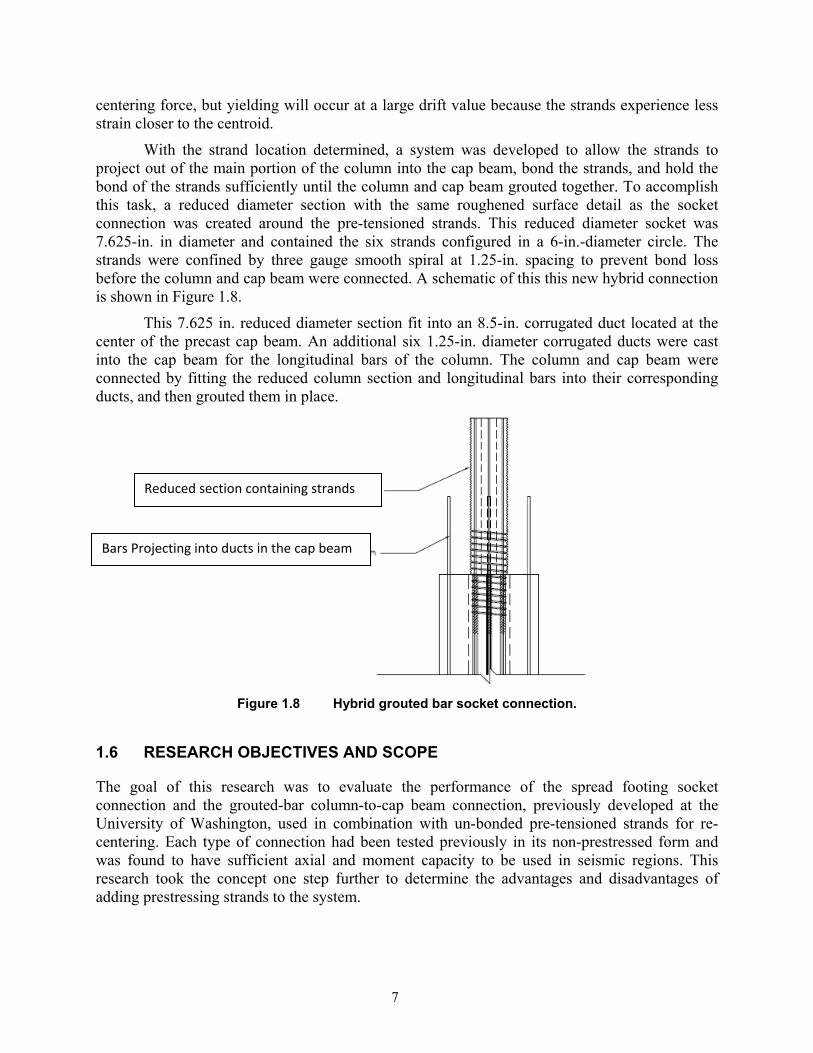
With the strand location determined, a system was developed to allow the strands to project out of the main portion of the column into the cap beam, bond the strands, and hold the bond of the strands sufficiently until the column and cap beam grouted together. To accomplish this task, a reduced diameter section with the same roughened surface detail as the socket connection was created around the pre-tensioned strands. This reduced diameter socket was 7.625-in. in diameter and contained the six strands configured in a 6-in.-diameter circle. The strands were confined by three gauge smooth spiral at 1.25-in. spacing to prevent bond loss before the column and cap beam were connected. A schematic of this this new hybrid connection is shown in Figure 1.8.
This 7.625 in. reduced diameter section fit into an 8.5-in. corrugated duct located at the center of the precast cap beam. An additional six 1.25-in. diameter corrugated ducts were cast into the cap beam for the longitudinal bars of the column. The column and cap beam were connected by fitting the reduced column section and longitudinal bars into their corresponding ducts, and then grouted them in place.
Figure 1.8 Hybrid grouted bar socket connection.
1.6 RESEARCH OBJECTIVES AND SCOPE
The goal of this research was to evaluate the performance of the spread footing socket connection and the grouted-bar column-to-cap beam connection, previously developed at the University of Washington, used in combination with un-bonded pre-tensioned strands for re-centering. Each type of connection had been tested previously in its non-prestressed form and was found to have sufficient axial and moment capacity to be used in seismic regions. This research took the concept one step further to determine the advantages and disadvantages of adding prestressing strands to the system.
Reduced section containing strands
Bars Projecting into ducts in the cap beam

8
The primary questions to be addressed were:
Does the system re-center? If so, to what degree? What are the limitations on its re-centering?
What drift percentage can be achieved before the residual drift of the system is larger than what is considered acceptable?
What effect does the prestressing strand have on the damage progression of the system?
Does the system have any unexpected behavioral characteristics?
In order to answer these questions, two 42% scale test subassemblies were constructed:
One spread footing socket connection with the addition of pre-tensioned strand (Specimen PreT-SF).
One grouted bar column to cap beam connection with the addition of pre-tensioned strand (Specimen PreT-CB).
Chapter 2 discusses the design of the specimens, including a detailed description of the connections. Chapter 3 describes the experimental set up. Chapters 4 and 5 present the data collected during testing, and Chapter 6 contains the data analysis. Finally, Chapter 7 summarizes the research findings and provides recommendations.
9
2 Design of Test Specimens
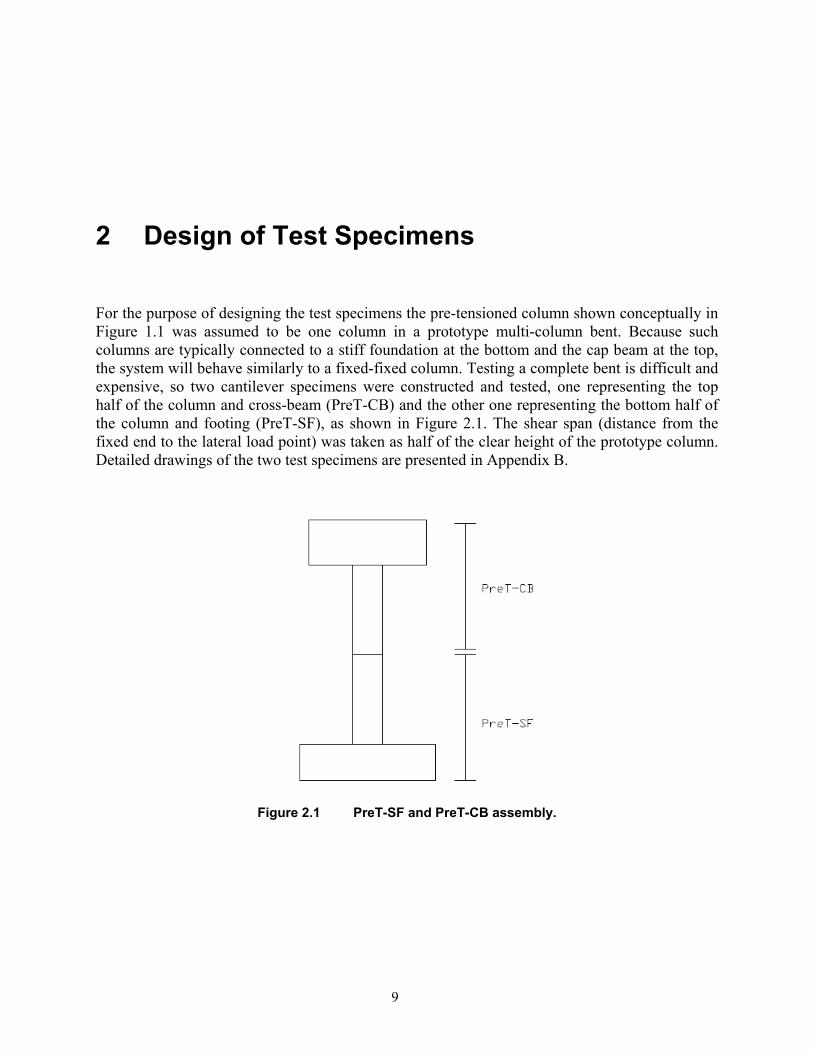
For the purpose of designing the test specimens the pre-tensioned column shown conceptually in Figure 1.1 was assumed to be one column in a prototype multi-column bent. Because such columns are typically connected to a stiff foundation at the bottom and the cap beam at the top, the system will behave similarly to a fixed-fixed column. Testing a complete bent is difficult and expensive, so two cantilever specimens were constructed and tested, one representing the top half of the column and cross-beam (PreT-CB) and the other one representing the bottom half of the column and footing (PreT-SF), as shown in Figure 2.1. The shear span (distance from the fixed end to the lateral load point) was taken as half of the clear height of the prototype column. Detailed drawings of the two test specimens are presented in Appendix B.
Figure 2.1 PreT-SF and PreT-CB assembly.
10
2.1 GEOMETRY OF TEST SPECIMENS
The geometry of the test specimens was governed by that of the prototype bridge bent, which in turn, was strongly influenced by the proposed construction procedure and the desired seismic response. The column was reinforced with a combination of unbonded prestressing strand and bonded reinforcing steel. This combination was intended to provide both re-centering from the elastic response of the unbonded strands and energy dissipation by cyclic yielding of the reinforcing bars. To maximize the cyclic strains and energy dissipation, the bonded bar reinforcement was placed near the exterior of the column. The opposite consideration guided the selection of the location of the unbonded prestressing strand. The strands were placed close to the centroid of the column to minimize the cyclic strains and increases in stress. This strategy made it possible to apply a higher initial stress to the strands without the strands yielding until a large drift value was reached. A high initial stress increased the restoring force.
The column was connected to its foundation by casting the spread footing around the precast column. The portion of the column surface cast into the footing was intentionally roughened with a saw-tooth detail to facilitate shear transfer across the PC-CIP interface. No reinforcing steel crossed the column-footing interface.
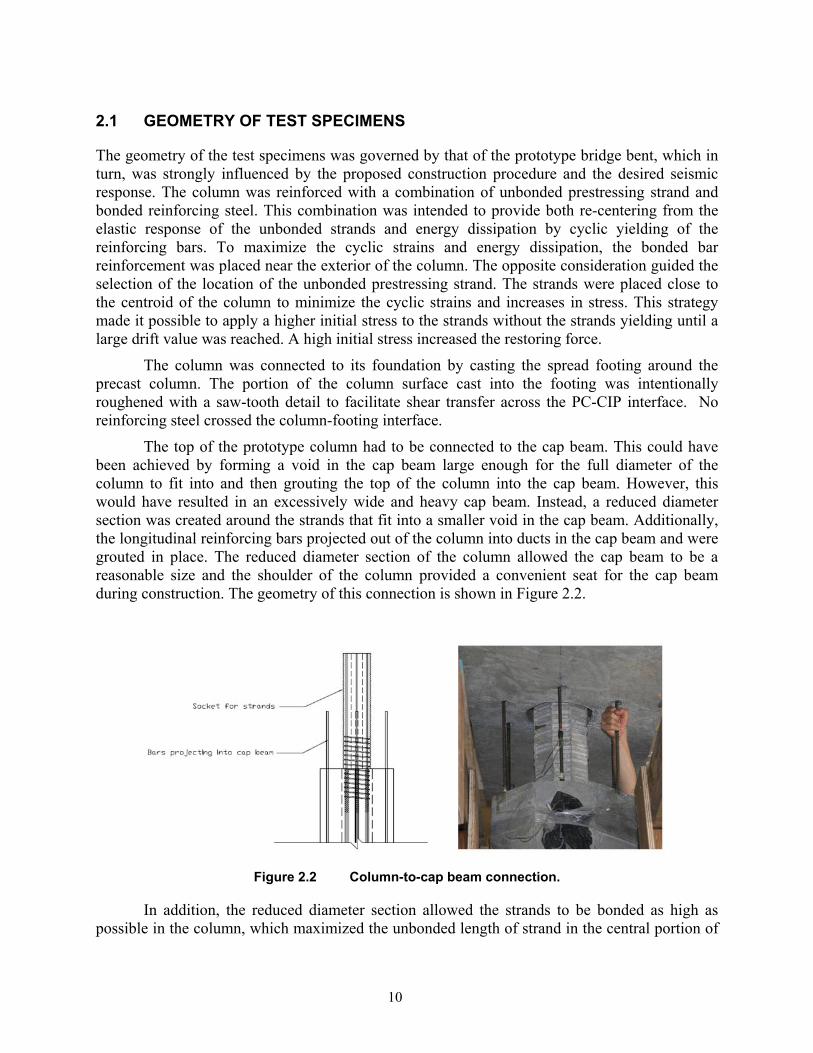
The top of the prototype column had to be connected to the cap beam. This could have been achieved by forming a void in the cap beam large enough for the full diameter of the column to fit into and then grouting the top of the column into the cap beam. However, this would have resulted in an excessively wide and heavy cap beam. Instead, a reduced diameter section was created around the strands that fit into a smaller void in the cap beam. Additionally, the longitudinal reinforcing bars projected out of the column into ducts in the cap beam and were grouted in place. The reduced diameter section of the column allowed the cap beam to be a reasonable size and the shoulder of the column provided a convenient seat for the cap beam during construction. The geometry of this connection is shown in Figure 2.2.
Figure 2.2 Column-to-cap beam connection.
In addition, the reduced diameter section allowed the strands to be bonded as high as possible in the column, which maximized the unbonded length of strand in the central portion of
11
the column. This configuration allows the column to reach a larger drift before the strands begin to yield. The number of strands was determined by the need to re-center the column.
The diameter of the reduced section had to be large enough to sustain the required compressive stress due to prestressing. With the total compressive force from the strand applied to the smaller cross-section of the reduced section, the local stresses were higher. Heavy spiral was added to the reduced section to provide confinement, help resist the locally high compressive stress, and resist cracking and splitting to improve the bond.
The bonded bars projected out of the shoulder of the column into ducts in the cap beam. The location of the bonded reinforcing bars allowed the cap beam to be approximately the same diameter as the column. This width is the minimum used in typical cast-in-place construction, so the proposed system imposed no additional constraints in that regard.
During lateral loading, unbonded prestressed members behave differently than members with typical bonded reinforcement. Unlike the distributed cracking seen in members with only bonded reinforcement, unbonded prestressed members have a tendency to form a single, large crack. The proposed system was intended to crack at a location a short distance above the footing. This location was chosen to prevent moisture from seeping into any cracks caused by lateral loading. When the column is loaded laterally, the moment will be higher at the base of the column than at the intended crack plane. To accommodate the higher base moment and concentrate the damage at the crack plane, the bottom of the column was reinforced with additional short bars. The crack at the top connection will naturally occur at the interface between the column and cap beam. Moisture was not a concern here because this location is already off the ground where ponding is not a concern, so no measures were taken to alter the location of cracking.
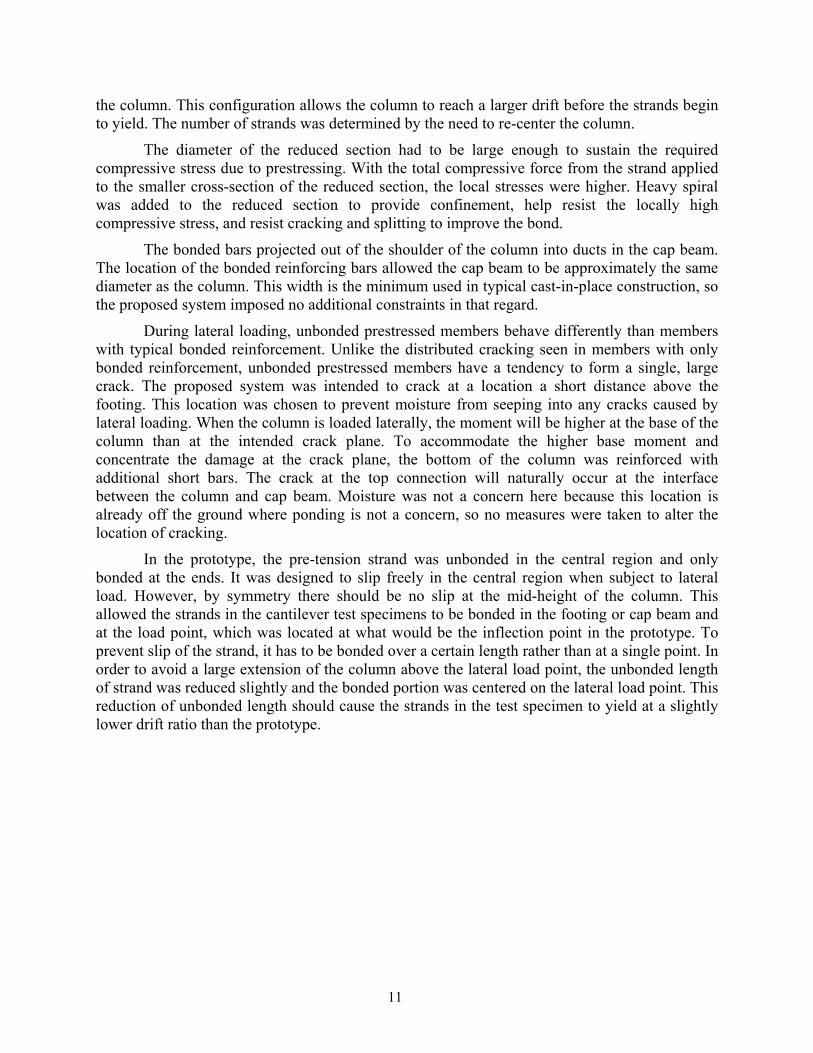
In the prototype, the pre-tension strand was unbonded in the central region and only bonded at the ends. It was designed to slip freely in the central region when subject to lateral load. However, by symmetry there should be no slip at the mid-height of the column. This allowed the strands in the cantilever test specimens to be bonded in the footing or cap beam and at the load point, which was located at what would be the inflection point in the prototype. To prevent slip of the strand, it has to be bonded over a certain length rather than at a single point. In order to avoid a large extension of the column above the lateral load point, the unbonded length of strand was reduced slightly and the bonded portion was centered on the lateral load point. This reduction of unbonded length should cause the strands in the test specimen to yield at a slightly lower drift ratio than the prototype.
12
Figure 2.3 Bonded portions for prototype and test specimens.
2.2 PROPERTIES OF TEST COLUMNS COMMON TO BOTH SPECIMENS
Both test columns had the same octagonal cross section, 20 in. in diameter from flat face to flat face. The number and configuration of bonded reinforcing bars and unbonded strand was identical for both columns. The columns were designed to have approximately the same strength as a conventional, cast-in-place RC column with a reinforcing ratio of 1%, but also to re-center when lateral loads were removed. To achieve this goal, both test columns were designed on the principle that approximately 40% of the flexural strength of the column would come from the bonded bar reinforcement and 60% would come from the prestressing strand. The bonded bars were chosen to provide a longitudinal reinforcement ratio, ρ, of approximately 0.4%. The strands were designed to provide ρ of approximately 0.6%(fsy/fpy) = 0.15% with syf being the yield
stress of the deformed bars and pyf being the yield stress of the strand. The gross area of the octagon was 331.4 in2, so the design steel areas for the mild and prestressed reinforcement were
1.33sA = in.2 and 0.50pA = in.2, respectively.
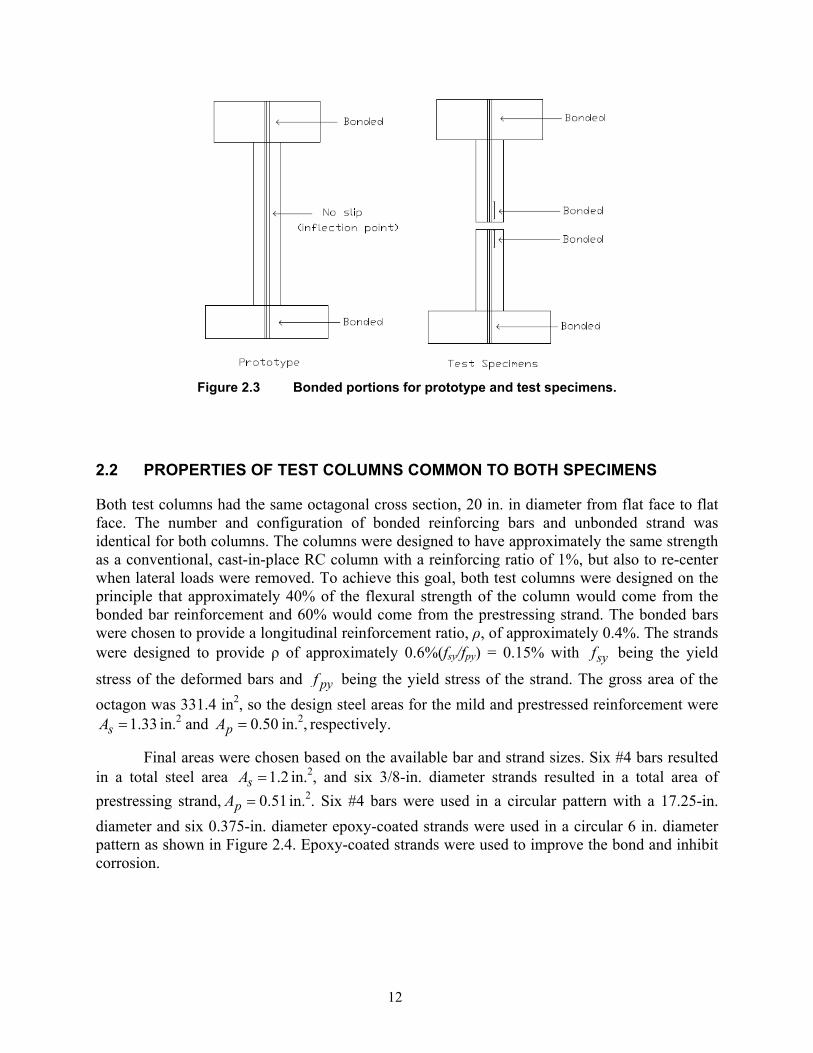
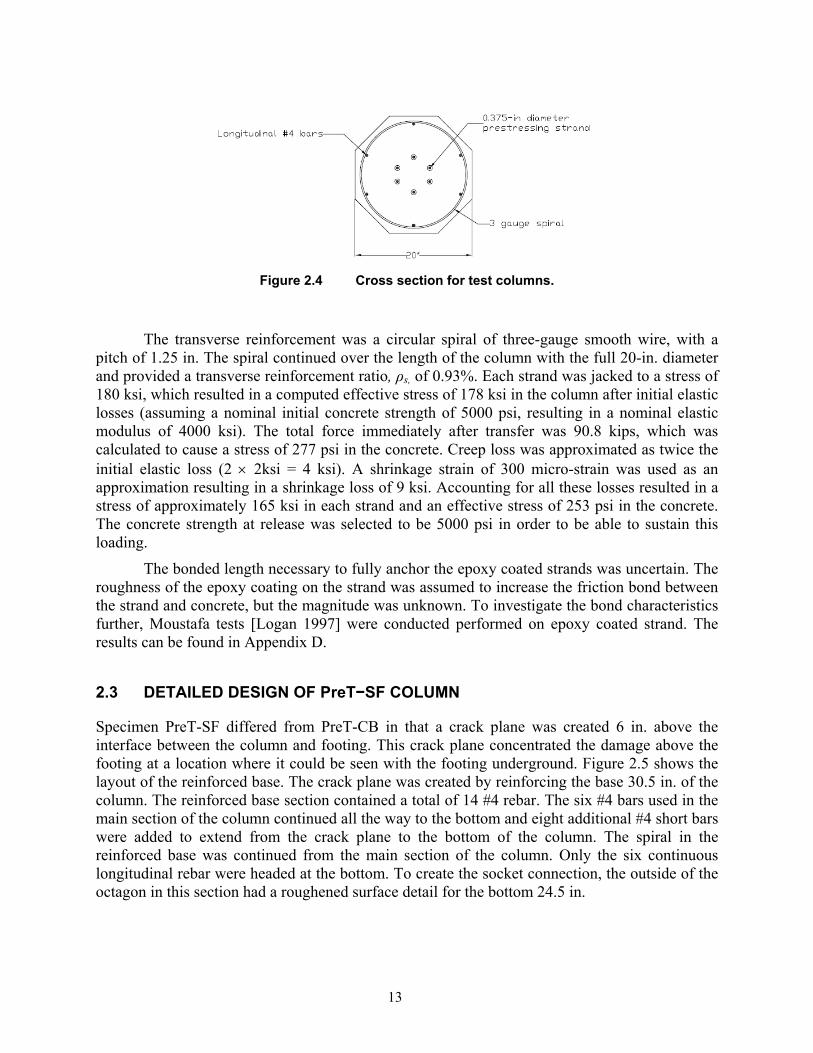
Final areas were chosen based on the available bar and strand sizes. Six #4 bars resulted in a total steel area 1.2sA = in.2, and six 3/8-in. diameter strands resulted in a total area of prestressing strand, 0.51pA = in.2. Six #4 bars were used in a circular pattern with a 17.25-in. diameter and six 0.375-in. diameter epoxy-coated strands were used in a circular 6 in. diameter pattern as shown in Figure 2.4. Epoxy-coated strands were used to improve the bond and inhibit corrosion.
13
Figure 2.4 Cross section for test columns.
The transverse reinforcement was a circular spiral of three-gauge smooth wire, with a pitch of 1.25 in. The spiral continued over the length of the column with the full 20-in. diameter and provided a transverse reinforcement ratio, ρs, of 0.93%. Each strand was jacked to a stress of 180 ksi, which resulted in a computed effective stress of 178 ksi in the column after initial elastic losses (assuming a nominal initial concrete strength of 5000 psi, resulting in a nominal elastic modulus of 4000 ksi). The total force immediately after transfer was 90.8 kips, which was calculated to cause a stress of 277 psi in the concrete. Creep loss was approximated as twice the initial elastic loss (2 × 2ksi = 4 ksi). A shrinkage strain of 300 micro-strain was used as an approximation resulting in a shrinkage loss of 9 ksi. Accounting for all these losses resulted in a stress of approximately 165 ksi in each strand and an effective stress of 253 psi in the concrete. The concrete strength at release was selected to be 5000 psi in order to be able to sustain this loading.
The bonded length necessary to fully anchor the epoxy coated strands was uncertain. The roughness of the epoxy coating on the strand was assumed to increase the friction bond between the strand and concrete, but the magnitude was unknown. To investigate the bond characteristics further, Moustafa tests [Logan 1997] were conducted performed on epoxy coated strand. The results can be found in Appendix D.
2.3 DETAILED DESIGN OF PreT−SF COLUMN
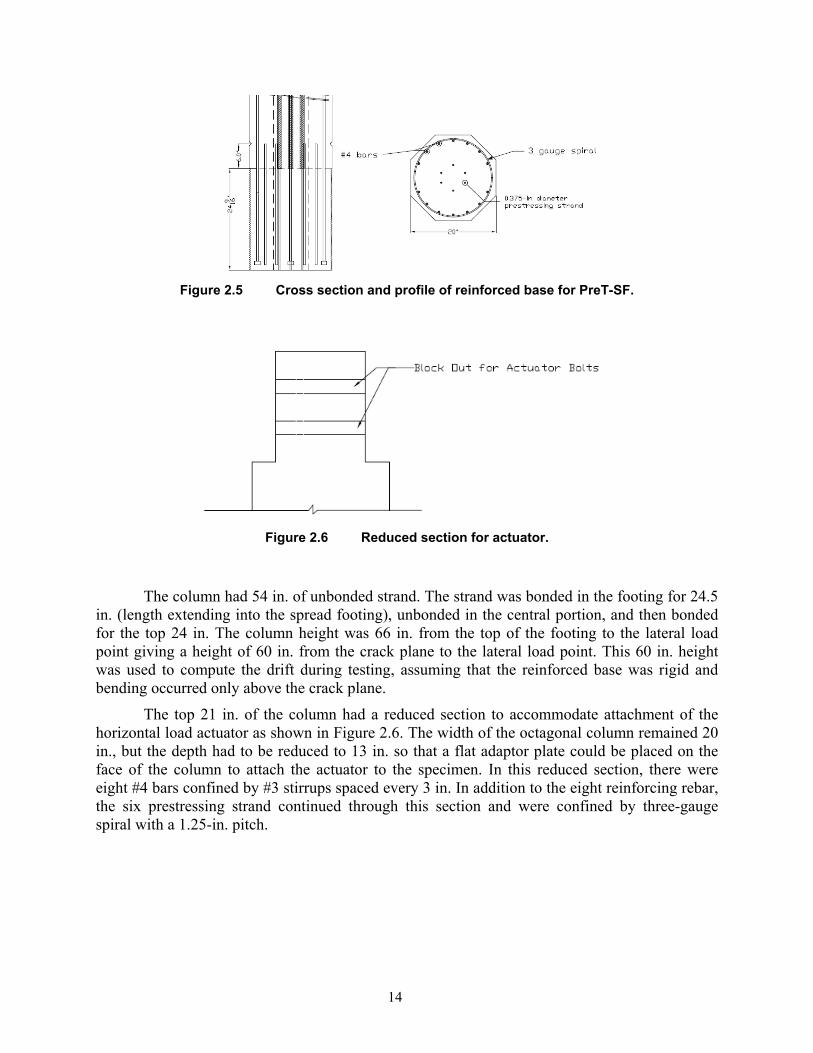
Specimen PreT-SF differed from PreT-CB in that a crack plane was created 6 in. above the interface between the column and footing. This crack plane concentrated the damage above the footing at a location where it could be seen with the footing underground. Figure 2.5 shows the layout of the reinforced base. The crack plane was created by reinforcing the base 30.5 in. of the column. The reinforced base section contained a total of 14 #4 rebar. The six #4 bars used in the main section of the column continued all the way to the bottom and eight additional #4 short bars were added to extend from the crack plane to the bottom of the column. The spiral in the reinforced base was continued from the main section of the column. Only the six continuous longitudinal rebar were headed at the bottom. To create the socket connection, the outside of the octagon in this section had a roughened surface detail for the bottom 24.5 in.
14
Figure 2.5 Cross section and profile of reinforced base for PreT-SF.
Figure 2.6 Reduced section for actuator.
The column had 54 in. of unbonded strand. The strand was bonded in the footing for 24.5 in. (length extending into the spread footing), unbonded in the central portion, and then bonded for the top 24 in. The column height was 66 in. from the top of the footing to the lateral load point giving a height of 60 in. from the crack plane to the lateral load point. This 60 in. height was used to compute the drift during testing, assuming that the reinforced base was rigid and bending occurred only above the crack plane.
The top 21 in. of the column had a reduced section to accommodate attachment of the horizontal load actuator as shown in Figure 2.6. The width of the octagonal column remained 20 in., but the depth had to be reduced to 13 in. so that a flat adaptor plate could be placed on the face of the column to attach the actuator to the specimen. In this reduced section, there were eight #4 bars confined by #3 stirrups spaced every 3 in. In addition to the eight reinforcing rebar, the six prestressing strand continued through this section and were confined by three-gauge spiral with a 1.25-in. pitch.

15
2.4 DETAILED DESIGN OF PreT−SF FOOTING
The design of the spread footing was designed according to the AASHTO Guide Specifications for LRFD Seismic Design [2009], WSDOT Bridge Design Manual [2008], and Caltrans Seismic Design Criteria [2006]. The general reinforcing layout can be seen in Figure 2.7 and detailed drawings can be found in Appendix B.
Figure 2.7 Footing reinforcing layout.
The only difference was the void space underneath the column, which had to be increased from 1.6875 in. to 7 in. to accommodate strand chucks at the bottom of the column. Although similar to those seen in Figure 3.2, no load cells were placed here because the bonded length of strand was longer on the bottom than on the top. Therefore, slip of strand only needed to be measured at the top because it would be expected to slip first.
2.5 DETAILED DESIGN OF PreT−CB COLUMN
For the PreT-CB column, the six #4 rebar projected 15.5 in. out of the shoulder of the column and were grouted into 1.25-in.-diameter corrugated metal ducts in the cap beam. The duct size was chosen based on what was already available in structural laboratory. When the column and cap beam were fitted together, the small ducts did not align correctly with the bars. Small misplacements of the ducts caused the fit to be much tighter than desired and larger ducts should have been used to allow for an easier connection. Additionally, the column had a 7.625-in.-diameter octagonal section containing the prestressing strand with the same roughened surface
16
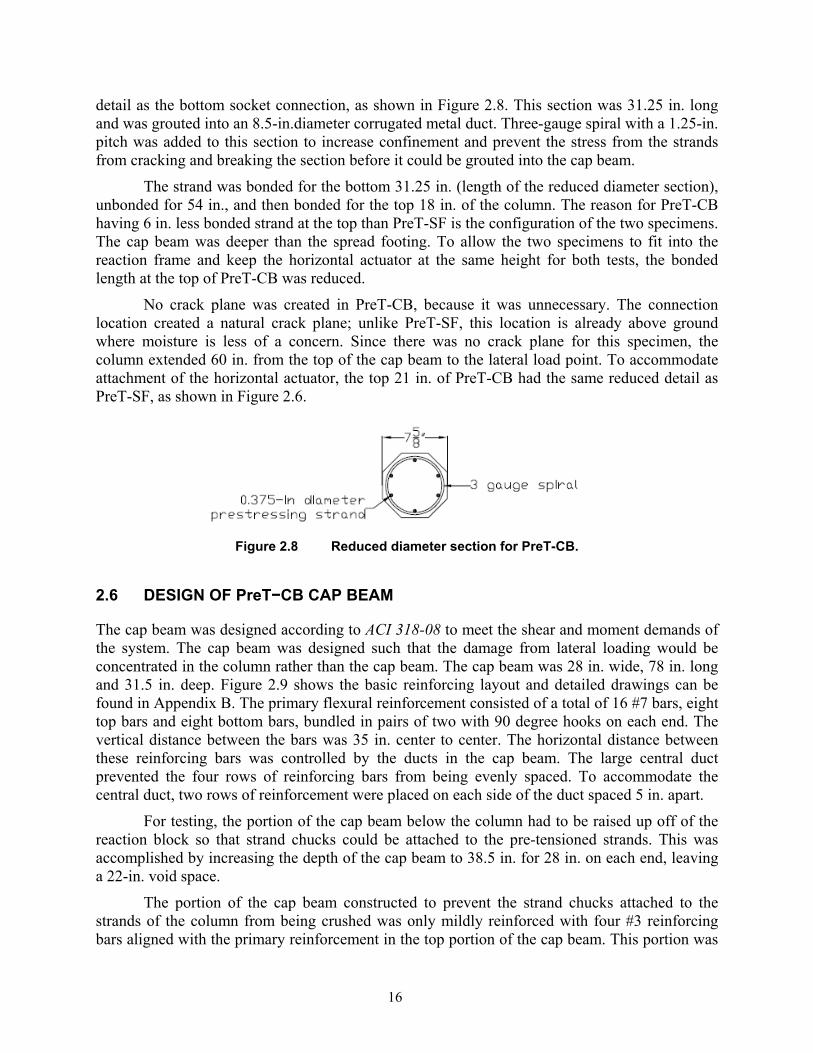
detail as the bottom socket connection, as shown in Figure 2.8. This section was 31.25 in. long and was grouted into an 8.5-in.diameter corrugated metal duct. Three-gauge spiral with a 1.25-in. pitch was added to this section to increase confinement and prevent the stress from the strands from cracking and breaking the section before it could be grouted into the cap beam.
The strand was bonded for the bottom 31.25 in. (length of the reduced diameter section), unbonded for 54 in., and then bonded for the top 18 in. of the column. The reason for PreT-CB having 6 in. less bonded strand at the top than PreT-SF is the configuration of the two specimens. The cap beam was deeper than the spread footing. To allow the two specimens to fit into the reaction frame and keep the horizontal actuator at the same height for both tests, the bonded length at the top of PreT-CB was reduced.
No crack plane was created in PreT-CB, because it was unnecessary. The connection location created a natural crack plane; unlike PreT-SF, this location is already above ground where moisture is less of a concern. Since there was no crack plane for this specimen, the column extended 60 in. from the top of the cap beam to the lateral load point. To accommodate attachment of the horizontal actuator, the top 21 in. of PreT-CB had the same reduced detail as PreT-SF, as shown in Figure 2.6.
Figure 2.8 Reduced diameter section for PreT-CB.
2.6 DESIGN OF PreT−CB CAP BEAM
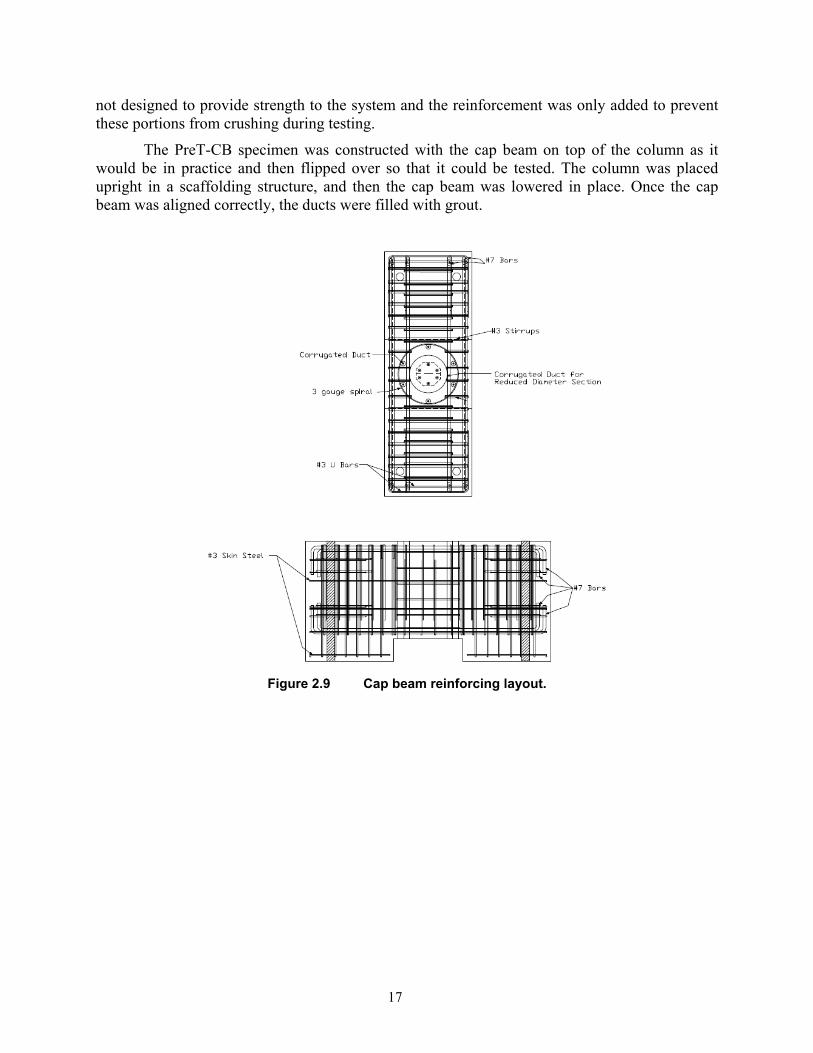
The cap beam was designed according to ACI 318-08 to meet the shear and moment demands of the system. The cap beam was designed such that the damage from lateral loading would be concentrated in the column rather than the cap beam. The cap beam was 28 in. wide, 78 in. long and 31.5 in. deep. Figure 2.9 shows the basic reinforcing layout and detailed drawings can be found in Appendix B. The primary flexural reinforcement consisted of a total of 16 #7 bars, eight top bars and eight bottom bars, bundled in pairs of two with 90 degree hooks on each end. The vertical distance between the bars was 35 in. center to center. The horizontal distance between these reinforcing bars was controlled by the ducts in the cap beam. The large central duct prevented the four rows of reinforcing bars from being evenly spaced. To accommodate the central duct, two rows of reinforcement were placed on each side of the duct spaced 5 in. apart.
For testing, the portion of the cap beam below the column had to be raised up off of the reaction block so that strand chucks could be attached to the pre-tensioned strands. This was accomplished by increasing the depth of the cap beam to 38.5 in. for 28 in. on each end, leaving a 22-in. void space.
The portion of the cap beam constructed to prevent the strand chucks attached to the strands of the column from being crushed was only mildly reinforced with four #3 reinforcing bars aligned with the primary reinforcement in the top portion of the cap beam. This portion was
17
not designed to provide strength to the system and the reinforcement was only added to prevent these portions from crushing during testing.
The PreT-CB specimen was constructed with the cap beam on top of the column as it would be in practice and then flipped over so that it could be tested. The column was placed upright in a scaffolding structure, and then the cap beam was lowered in place. Once the cap beam was aligned correctly, the ducts were filled with grout.
Figure 2.9 Cap beam reinforcing layout.

18
19
3 Experimental Program
3.1 TEST SET UP
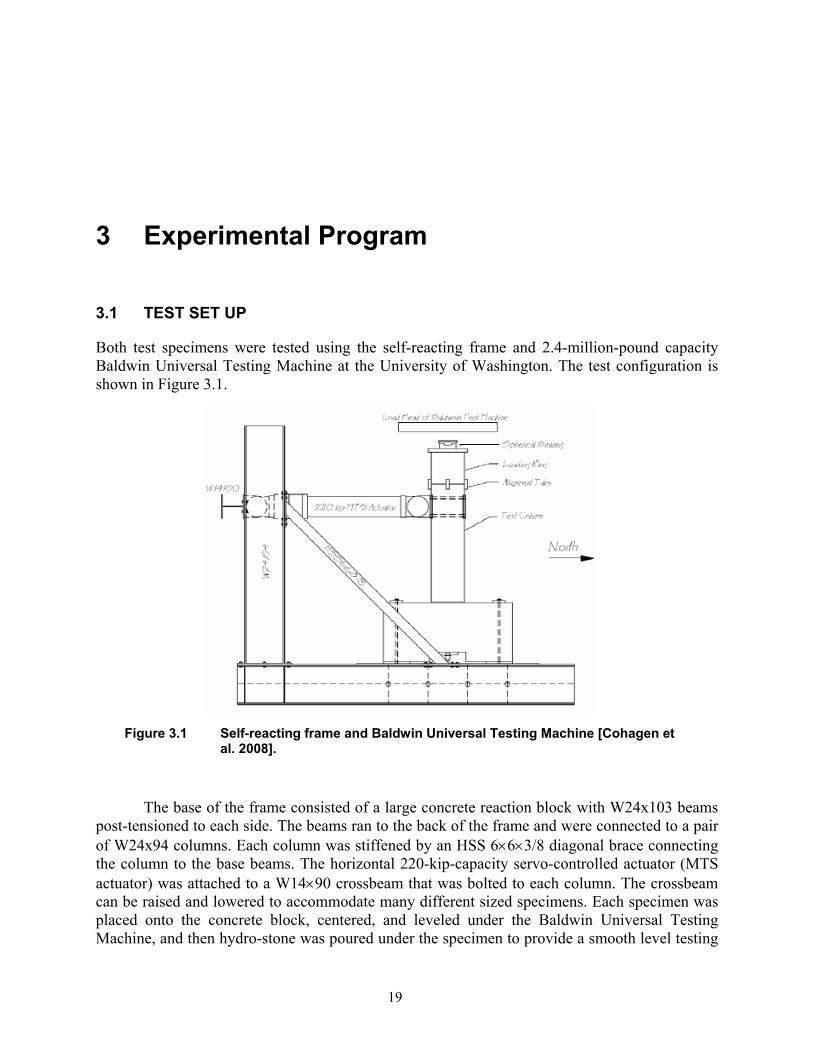
Both test specimens were tested using the self-reacting frame and 2.4-million-pound capacity Baldwin Universal Testing Machine at the University of Washington. The test configuration is shown in Figure 3.1.
Figure 3.1 Self-reacting frame and Baldwin Universal Testing Machine [Cohagen et
al. 2008].
The base of the frame consisted of a large concrete reaction block with W24x103 beams post-tensioned to each side. The beams ran to the back of the frame and were connected to a pair of W24x94 columns. Each column was stiffened by an HSS 6×6×3/8 diagonal brace connecting the column to the base beams. The horizontal 220-kip-capacity servo-controlled actuator (MTS actuator) was attached to a W14×90 crossbeam that was bolted to each column. The crossbeam can be raised and lowered to accommodate many different sized specimens. Each specimen was placed onto the concrete block, centered, and leveled under the Baldwin Universal Testing Machine, and then hydro-stone was poured under the specimen to provide a smooth level testing
20
surface. The specimens were then secured down to the reaction block using four 1.25-in.-diameter Williams bars. Each Williams bar was stressed to 80 kips to prevent overturning and sliding of the specimen.
Axial load was transferred to each specimen through the use of a spherical bearing that was placed on top of the loading ring (see Section 3.2). The bottom of the bearing was secured to the top of the specimen using hydro-stone, and the top of the bearing rested in a low friction channel attached to the Baldwin head. To minimize friction, the portion of the bearing resting in the channel was lined with greased polytetrafluoroethylene (PTFE) on the top and sides, which slid against greased stainless steel plates attached to the insides of the channel.
3.2 INSTRUMENTATION
Described in greater detail below, the installed instrumentation consisted of load cells to monitor the applied loads, load cells to monitor potential force demands at the ends of the prestressing strands, displacement transducers, inclinometers, strain gauges on the longitudinal and transverse reinforcing bars, and a motion-capture system.
3.2.1 Applied Loads
The Baldwin Universal Testing Machine was used to apply the axial load to the column and an MTS horizontal actuator applied the lateral loads. Each had its own internal load cell to measure the loads applied to the system.
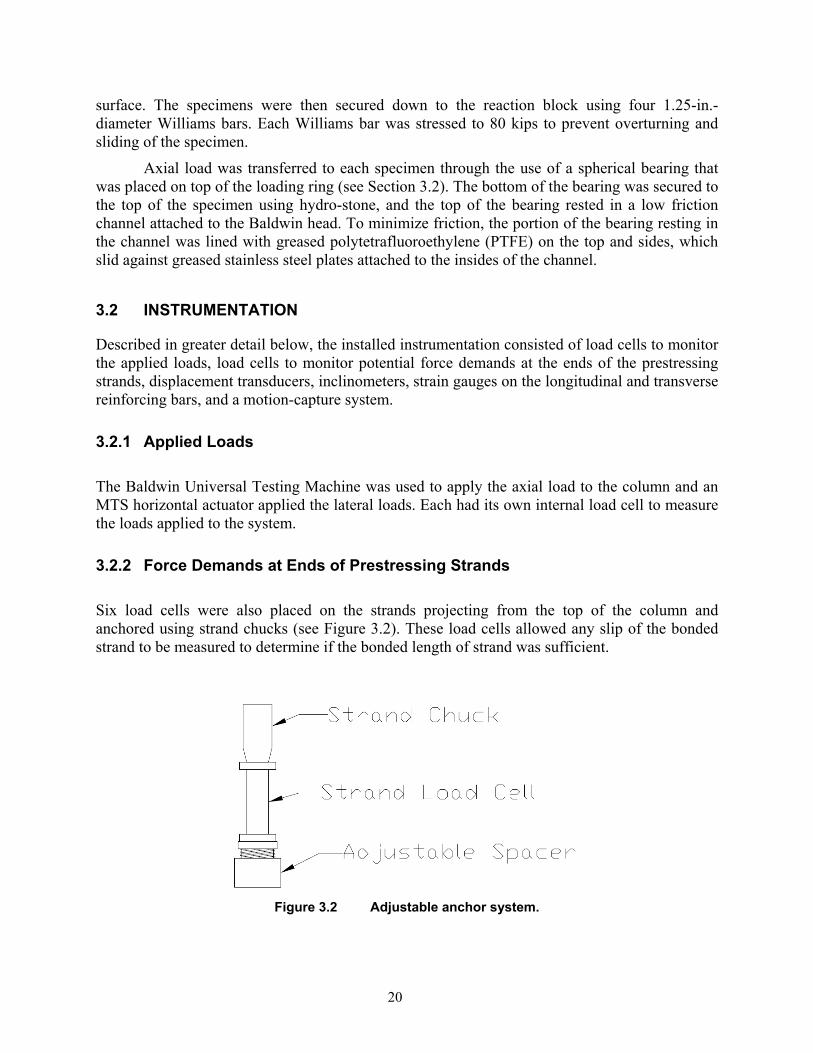
3.2.2 Force Demands at Ends of Prestressing Strands
Six load cells were also placed on the strands projecting from the top of the column and anchored using strand chucks (see Figure 3.2). These load cells allowed any slip of the bonded strand to be measured to determine if the bonded length of strand was sufficient.
Figure 3.2 Adjustable anchor system.
21
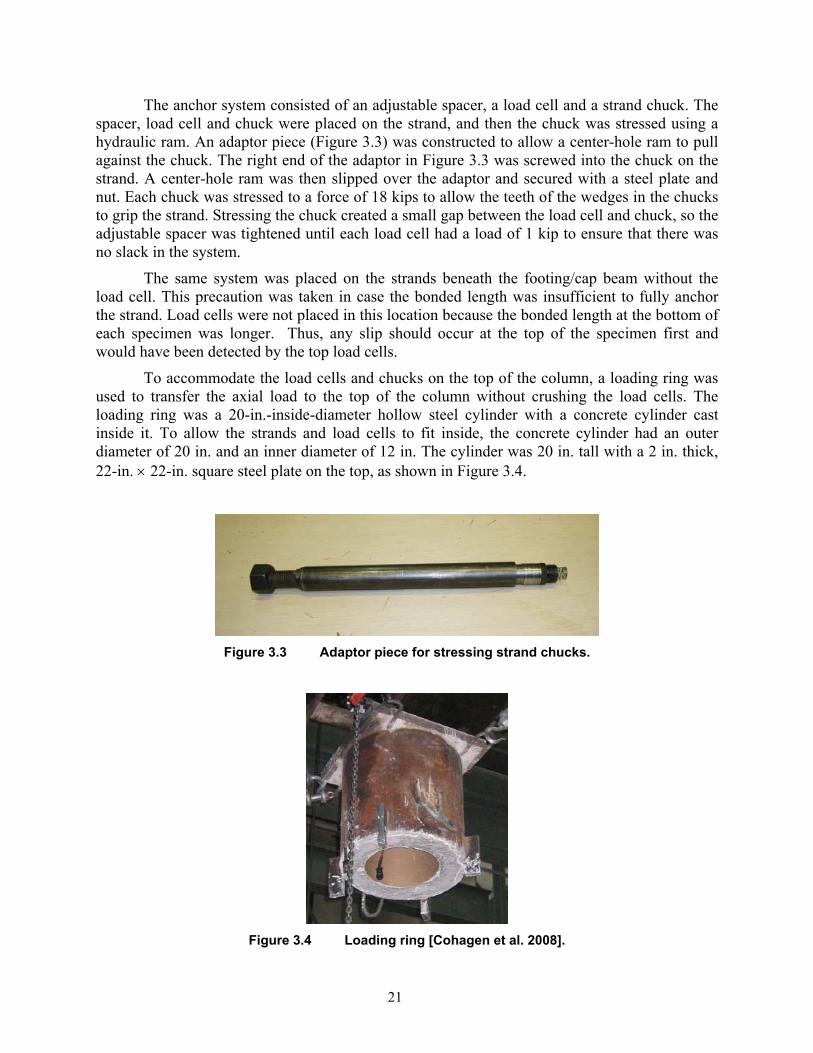
The anchor system consisted of an adjustable spacer, a load cell and a strand chuck. The spacer, load cell and chuck were placed on the strand, and then the chuck was stressed using a hydraulic ram. An adaptor piece (Figure 3.3) was constructed to allow a center-hole ram to pull against the chuck. The right end of the adaptor in Figure 3.3 was screwed into the chuck on the strand. A center-hole ram was then slipped over the adaptor and secured with a steel plate and nut. Each chuck was stressed to a force of 18 kips to allow the teeth of the wedges in the chucks to grip the strand. Stressing the chuck created a small gap between the load cell and chuck, so the adjustable spacer was tightened until each load cell had a load of 1 kip to ensure that there was no slack in the system.
The same system was placed on the strands beneath the footing/cap beam without the load cell. This precaution was taken in case the bonded length was insufficient to fully anchor the strand. Load cells were not placed in this location because the bonded length at the bottom of each specimen was longer. Thus, any slip should occur at the top of the specimen first and would have been detected by the top load cells.
To accommodate the load cells and chucks on the top of the column, a loading ring was used to transfer the axial load to the top of the column without crushing the load cells. The loading ring was a 20-in.-inside-diameter hollow steel cylinder with a concrete cylinder cast inside it. To allow the strands and load cells to fit inside, the concrete cylinder had an outer diameter of 20 in. and an inner diameter of 12 in. The cylinder was 20 in. tall with a 2 in. thick, 22-in. × 22-in. square steel plate on the top, as shown in Figure 3.4.
Figure 3.3 Adaptor piece for stressing strand chucks.
Figure 3.4 Loading ring [Cohagen et al. 2008].
22
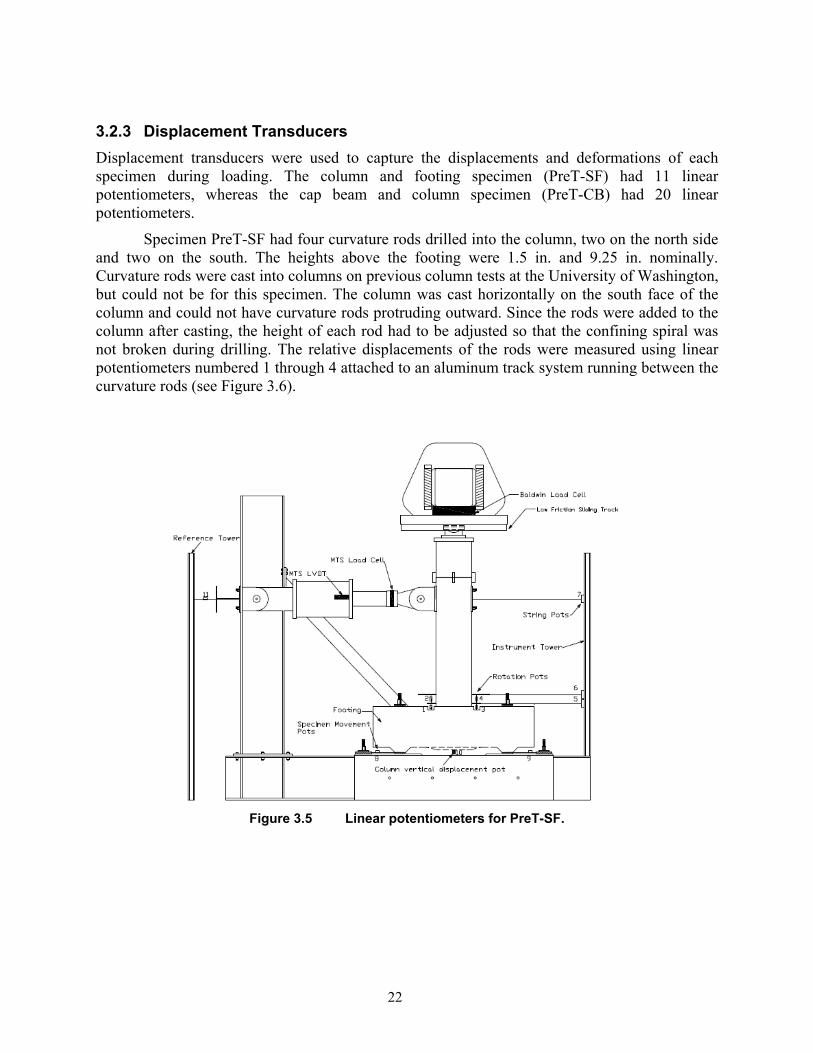
3.2.3 Displacement Transducers Displacement transducers were used to capture the displacements and deformations of each specimen during loading. The column and footing specimen (PreT-SF) had 11 linear potentiometers, whereas the cap beam and column specimen (PreT-CB) had 20 linear potentiometers.
Specimen PreT-SF had four curvature rods drilled into the column, two on the north side and two on the south. The heights above the footing were 1.5 in. and 9.25 in. nominally. Curvature rods were cast into columns on previous column tests at the University of Washington, but could not be for this specimen. The column was cast horizontally on the south face of the column and could not have curvature rods protruding outward. Since the rods were added to the column after casting, the height of each rod had to be adjusted so that the confining spiral was not broken during drilling. The relative displacements of the rods were measured using linear potentiometers numbered 1 through 4 attached to an aluminum track system running between the curvature rods (see Figure 3.6).
Figure 3.5 Linear potentiometers for PreT-SF.
23
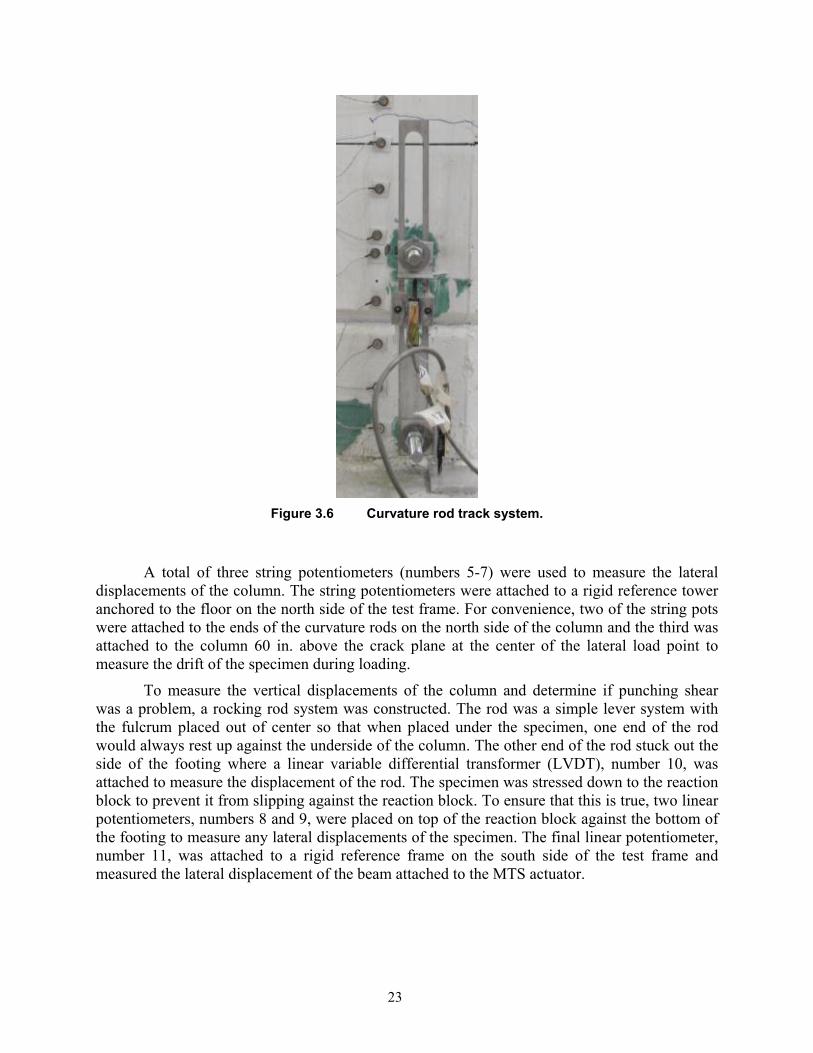
Figure 3.6 Curvature rod track system.
A total of three string potentiometers (numbers 5-7) were used to measure the lateral displacements of the column. The string potentiometers were attached to a rigid reference tower anchored to the floor on the north side of the test frame. For convenience, two of the string pots were attached to the ends of the curvature rods on the north side of the column and the third was attached to the column 60 in. above the crack plane at the center of the lateral load point to measure the drift of the specimen during loading.
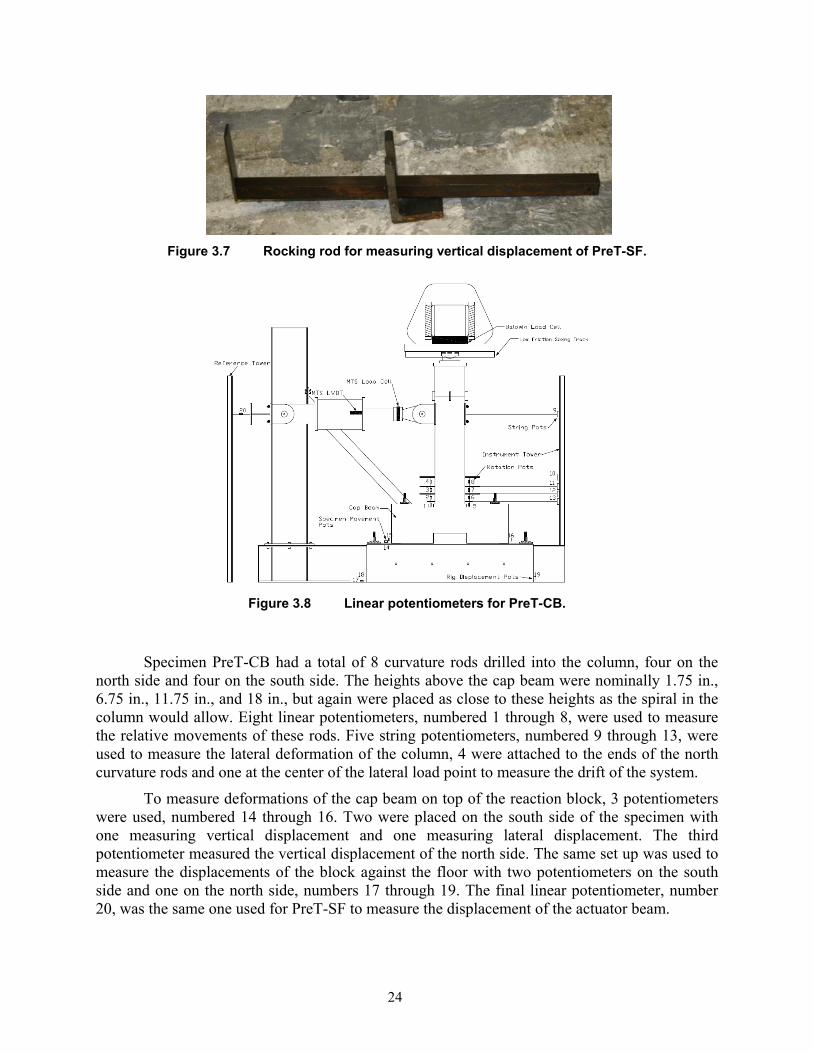
To measure the vertical displacements of the column and determine if punching shear was a problem, a rocking rod system was constructed. The rod was a simple lever system with the fulcrum placed out of center so that when placed under the specimen, one end of the rod would always rest up against the underside of the column. The other end of the rod stuck out the side of the footing where a linear variable differential transformer (LVDT), number 10, was attached to measure the displacement of the rod. The specimen was stressed down to the reaction block to prevent it from slipping against the reaction block. To ensure that this is true, two linear potentiometers, numbers 8 and 9, were placed on top of the reaction block against the bottom of the footing to measure any lateral displacements of the specimen. The final linear potentiometer, number 11, was attached to a rigid reference frame on the south side of the test frame and measured the lateral displacement of the beam attached to the MTS actuator.
24
Figure 3.7 Rocking rod for measuring vertical displacement of PreT-SF.
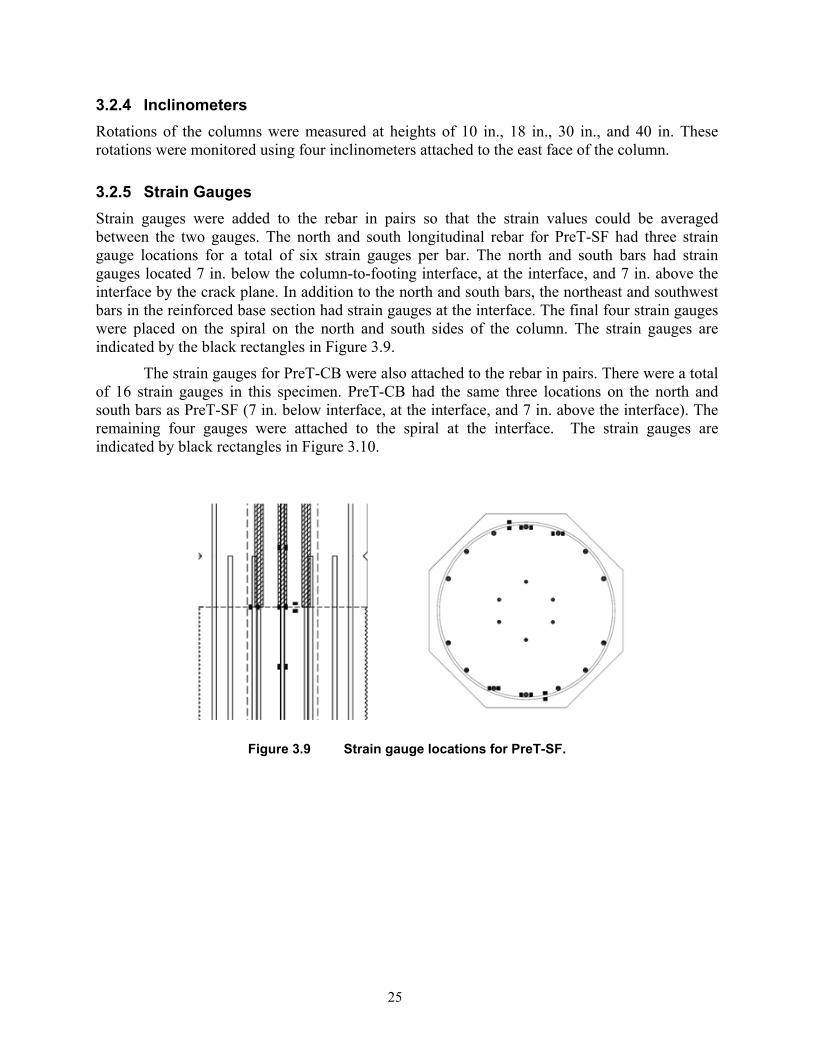
Figure 3.8 Linear potentiometers for PreT-CB.
Specimen PreT-CB had a total of 8 curvature rods drilled into the column, four on the north side and four on the south side. The heights above the cap beam were nominally 1.75 in., 6.75 in., 11.75 in., and 18 in., but again were placed as close to these heights as the spiral in the column would allow. Eight linear potentiometers, numbered 1 through 8, were used to measure the relative movements of these rods. Five string potentiometers, numbered 9 through 13, were used to measure the lateral deformation of the column, 4 were attached to the ends of the north curvature rods and one at the center of the lateral load point to measure the drift of the system.
To measure deformations of the cap beam on top of the reaction block, 3 potentiometers were used, numbered 14 through 16. Two were placed on the south side of the specimen with one measuring vertical displacement and one measuring lateral displacement. The third potentiometer measured the vertical displacement of the north side. The same set up was used to measure the displacements of the block against the floor with two potentiometers on the south side and one on the north side, numbers 17 through 19. The final linear potentiometer, number 20, was the same one used for PreT-SF to measure the displacement of the actuator beam.
25
3.2.4 Inclinometers Rotations of the columns were measured at heights of 10 in., 18 in., 30 in., and 40 in. These rotations were monitored using four inclinometers attached to the east face of the column.
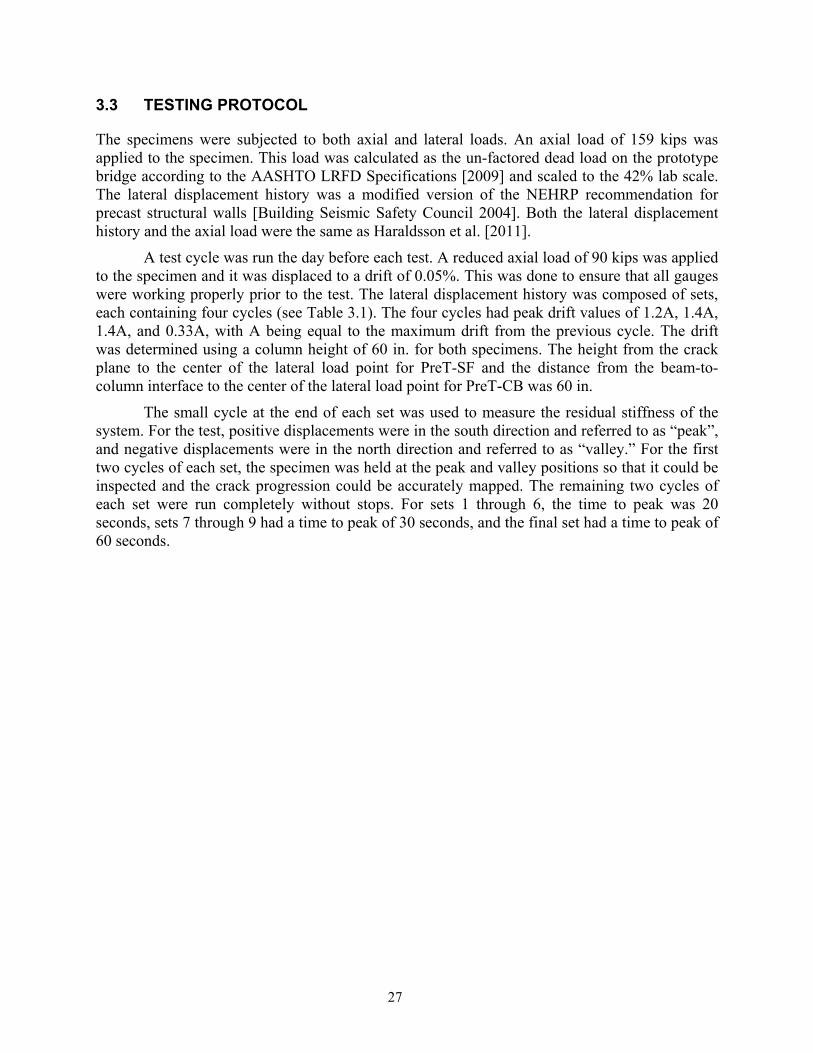
3.2.5 Strain Gauges Strain gauges were added to the rebar in pairs so that the strain values could be averaged between the two gauges. The north and south longitudinal rebar for PreT-SF had three strain gauge locations for a total of six strain gauges per bar. The north and south bars had strain gauges located 7 in. below the column-to-footing interface, at the interface, and 7 in. above the interface by the crack plane. In addition to the north and south bars, the northeast and southwest bars in the reinforced base section had strain gauges at the interface. The final four strain gauges were placed on the spiral on the north and south sides of the column. The strain gauges are indicated by the black rectangles in Figure 3.9.
The strain gauges for PreT-CB were also attached to the rebar in pairs. There were a total of 16 strain gauges in this specimen. PreT-CB had the same three locations on the north and south bars as PreT-SF (7 in. below interface, at the interface, and 7 in. above the interface). The remaining four gauges were attached to the spiral at the interface. The strain gauges are indicated by black rectangles in Figure 3.10.
Figure 3.9 Strain gauge locations for PreT-SF.

26
Figure 3.10 Strain gauge locations for PreT-CB.
3.2.6 Motion Capture System The Optotrak system consisted of LEDs attached to the face of the column and two cameras to capture the motion of the LEDs, as shown in Figure 3.11. The LEDs were placed on the north, west, and south faces of the column at a vertical spacing of 2 in. for the bottom third of the column and 4 in. for the remaining height of the column. This was done because the majority of the rotation of the column occurred at the interface and the tighter spaced LEDs would capture the behavior more accurately. The two camera setup allowed for simultaneous monitoring of the north and south side of the column. For specimen PreT-SF, there was a problem with one of the cameras so data was only collected on the north side of the column.
Figure 3.11 Optotrak camera and LED.
27
3.3 TESTING PROTOCOL
The specimens were subjected to both axial and lateral loads. An axial load of 159 kips was applied to the specimen. This load was calculated as the un-factored dead load on the prototype bridge according to the AASHTO LRFD Specifications [2009] and scaled to the 42% lab scale. The lateral displacement history was a modified version of the NEHRP recommendation for precast structural walls [Building Seismic Safety Council 2004]. Both the lateral displacement history and the axial load were the same as Haraldsson et al. [2011].
A test cycle was run the day before each test. A reduced axial load of 90 kips was applied to the specimen and it was displaced to a drift of 0.05%. This was done to ensure that all gauges were working properly prior to the test. The lateral displacement history was composed of sets, each containing four cycles (see Table 3.1). The four cycles had peak drift values of 1.2A, 1.4A, 1.4A, and 0.33A, with A being equal to the maximum drift from the previous cycle. The drift was determined using a column height of 60 in. for both specimens. The height from the crack plane to the center of the lateral load point for PreT-SF and the distance from the beam-to-column interface to the center of the lateral load point for PreT-CB was 60 in.
The small cycle at the end of each set was used to measure the residual stiffness of the system. For the test, positive displacements were in the south direction and referred to as “peak”, and negative displacements were in the north direction and referred to as “valley.” For the first two cycles of each set, the specimen was held at the peak and valley positions so that it could be inspected and the crack progression could be accurately mapped. The remaining two cycles of each set were run completely without stops. For sets 1 through 6, the time to peak was 20 seconds, sets 7 through 9 had a time to peak of 30 seconds, and the final set had a time to peak of 60 seconds.

28
Table 3.1 Displacement history.
Set Cycle Drift (%)Displacement (in.)
Set Cycle Drift (%)Displacement (in.)
1 ±0.33 ±0.20 1 ±2.06 ±1.242 ±0.40 ±0.24 2 ±2.48 ±1.493 ±0.40 ±0.24 3 ±2.48 ±1.494 ±0.13 ±0.08 4 ±0.83 ±0.501 ±0.48 ±0.29 1 ±2.97 ±1.782 ±0.58 ±0.35 2 ±3.57 ±2.143 ±0.58 ±0.35 3 ±3.573 ±2.144 ±0.19 ±0.12 4 ±1.19 ±0.711 ±0.69 ±0.41 1 ±4.28 ±2.572 ±0.83 ±0.50 2 ±5.14 ±3.083 ±0.83 ±0.50 3 ±5.14 ±3.084 ±0.28 ±0.17 4 ±1.71 ±1.031 ±1.00 ±0.60 1 ±6.16 ±3.702 ±1.19 ±0.72 2 ±7.40 ±4.443 ±1.19 ±0.72 3 ±7.40 ±4.444 ±0.40 ±0.24 4 ±2.47 ±1.481 ±1.43 ±0.86 1 ±8.87 ±5.322 ±1.72 ±1.03 2 ±10.65 ±6.393 ±1.72 ±1.03 3 ±10.65 ±6.394 ±0.57 ±0.34 4 ±3.55 ±2.13
1
2
3
4
5
6
7
8
9
10

29
4 Damage Progression
The damage to the two specimens (PreT-SF and PreT-CB) was recorded using crack-width measurements, sketches of cracks, and numerous photographs, see Appendix C. This chapter defines key damage states and documents the damage progression for both specimens.
4.1 DEFINITIONS OF DAMAGE STATES
The specimens were monitored closely to identify key damage states previously defined by the UW/PEER Structural Performance Database [Berry and Eberhard 2004]; see Table 4.1. These damage states have also been identified in previous experiments and allow for easy comparison among experiments.
Table 4.1 Damage state definitions.
Damage State Description First significant horizontal crack Crack width ≥ 0.5 mm
First significant diagonal crack Diagonal crack extends ¼ of column diameter. Crack width ≥ 0.25 mm
First open residual crack Residual crack width ≥ 0.25 mm Fire yield of longitudinal reinforcement First strain gauge that reaches yield strain (0.00212 First yield of transverse reinforcement Observed spalling on surface First spalling in footing Observed flaking minor spalling First spalling in column Spalled height ≥ ¼ of column diameter
Significant spalling in column Spalling height no longer increases with increasing deformation
Fully spalled First observation of column longitudinal reinforcement Exposure of longitudinal reinforcement First observation of column longitudinal bar buckling
Buckling of longitudinal reinforcement Crack width ≥ 2.0 mm Large cracks in concrete core Observation or sound Fracture of transverse reinforcement Observation or sound Fracture of longitudinal reinforcement Instability of member Loss of axial capacity
30
4.2 DAMAGE PROGRESSION
The day before the full test, each specimen was subjected to a preliminary cycle, and the specimens were checked for damage. Small hairline cracks were observed at this time, but all of these cracks closed completely after the cycle was completed. During the full tests, each specimen was subjected to a total of 40 cycles. Table 4.2 contains the cycle and drift ratio at which each damage state was reached in each specimen. The positive and negative drift values correspond to the peak and valley drifts achieved in the cycle. The peak and valley drifts are not exactly the same due to deflections of the test frame during testing.
Table 4.2 Summary of damage states for PreT-SF and PreT-CB.
Set Cycle Drift (%) Set Cycle Drift (%)
First significant horizontal crack 3 1 0.52/‐.64 3 2 0.44/‐0.69
First significant diagonal crack 6 2 2.1/‐2.3 5 2 1.2/‐1.52
First open residual crack 4 2 0.89/‐.98 5 1 0.96/‐1.26
First yield of longitudinal reinforcement 2 1 ‐0.28 1 3 ‐0.33
First yield of transverse reinforcement 7 1 ‐2.63 7 1 ‐2.74
First spalling in footing/cap beam n/a n/a n/a n/a n/a n/a
First spalling in column 5 1 1.1/‐1.2 5 1 0.96/‐1.26
Significant spalling in column 7 3 3.2/‐3.3 7 1 2.5/‐2.8
Fully spalled 9 3 7.4/‐7.3 9 1 6/‐6.1
Exposure of longitudinal reinforcement 7 3 3.2/‐3.3 7 2 3.1/‐3.4
Buckling of longitudinal reinforcement 7 3 3.2/‐3.3 7 3 3.1/‐3.3
Large cracks in concrete core 9 3 7.4/‐7.3 n/a n/a n/a
Fracture of transverse reinforcement n/a n/a n/a n/a n/a n/a
Fracture of longirudinal reinforcement 8 1 4.0/‐4.2 8 1 3.8/‐4.1
Loss of axial capacity n/a n/a n/a n/a n/a n/a
Damage StatePreT‐SF PreT‐CB
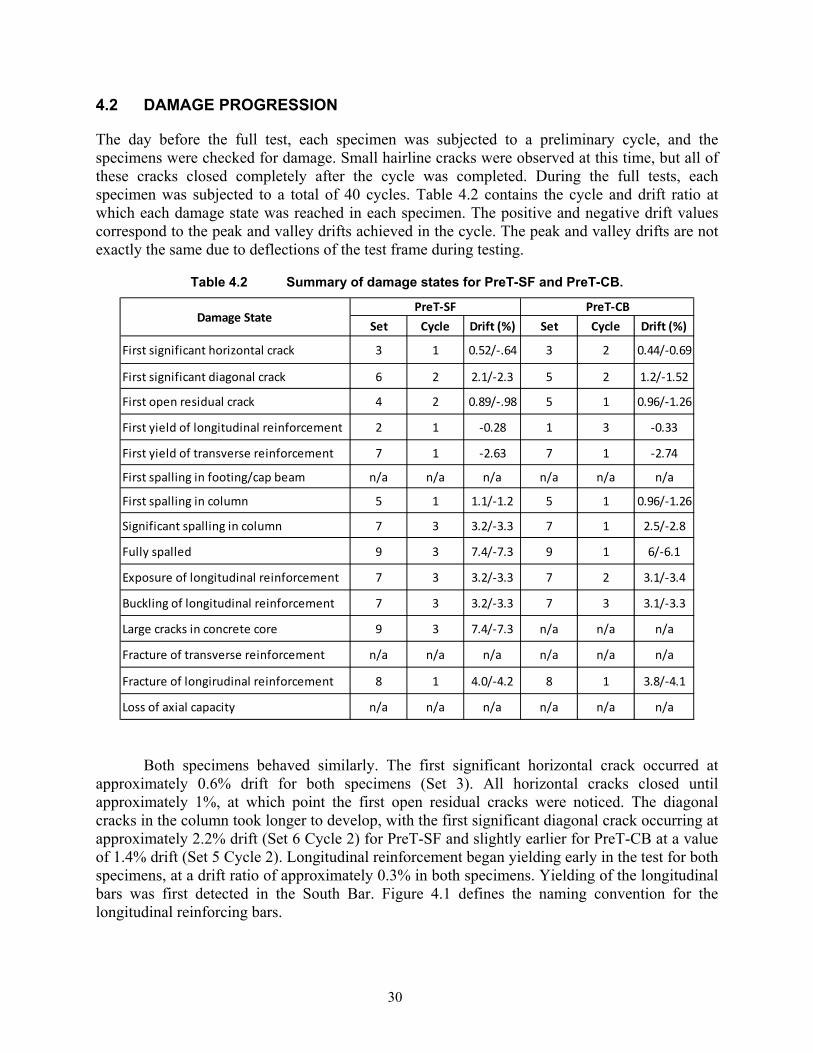
Both specimens behaved similarly. The first significant horizontal crack occurred at approximately 0.6% drift for both specimens (Set 3). All horizontal cracks closed until approximately 1%, at which point the first open residual cracks were noticed. The diagonal cracks in the column took longer to develop, with the first significant diagonal crack occurring at approximately 2.2% drift (Set 6 Cycle 2) for PreT-SF and slightly earlier for PreT-CB at a value of 1.4% drift (Set 5 Cycle 2). Longitudinal reinforcement began yielding early in the test for both specimens, at a drift ratio of approximately 0.3% in both specimens. Yielding of the longitudinal bars was first detected in the South Bar. Figure 4.1 defines the naming convention for the longitudinal reinforcing bars.
31
Figure 4.1 North and south direction definition.
The next significant damage event was spalling. For both of the specimens, spalling only occurred in the column. No spalling was observed in the footing or cap beam. Column spalling began at approximately 1.1% drift (Set 5 Cycle 1) for both PreT-SF and PreT-CB. PreT-SF spalled on both the north and south side above the crack plane during this cycle, while PreT-CB spalled only the north side just above the interface. For PreT-CB, significant spalling occurred at approximately 2.7% drift (Set 7 Cycle 1); the spalling stopped progressing upward at approximately 6% drift (Set 9 Cycle 1). These damage states occurred slightly later in PreT-SF, with the first significant spalling at approximately 3.2% drift (Set 7 Cycle 3); the specimen was fully spalled at approximately 7.3% drift (Set 9 Cycle 3).
As the spalling progressed, the longitudinal reinforcement became exposed in the region near the connection at cycles containing the same target drift for both specimens (3.25% Set 7). PreT-SF buckled during the cycle when the longitudinal rebar became exposed. The south rebar was the first to buckle in PreT-CB as well and also occurred at Set 7 Cycle 3.
Once the bars began to buckle, it was not long before they fractured as they underwent cycles of compression buckling and tension straightening. The south bar broke in each specimen at approximately 4% drift (Set 8 Cycle 1). Buckling and fracture of the remaining longitudinal bars followed shortly after. For PreT-SF, the north bar fractured at approximately 7.3% drift (Set 9 Cycle 2), and the remaining four longitudinal bars had buckled. By Set 10 Cycle 1 (8.8% drift) all of the longitudinal rebar had fractured, but the remaining three cycles of the set were run to evaluate the strength remaining from the prestressing strand. PreT-CB proceeded in a similar manner. The north bar began buckling in the same set and cycle as when the south rebar fractured, and the north bar fractured at approximately 5% drift (Set 8 Cycle 3). The remaining rebar were all exposed and buckled by Set 9 Cycle 2 (7.3% drift); all had fractured by Set 9 Cycle 3 (7.3% drift).
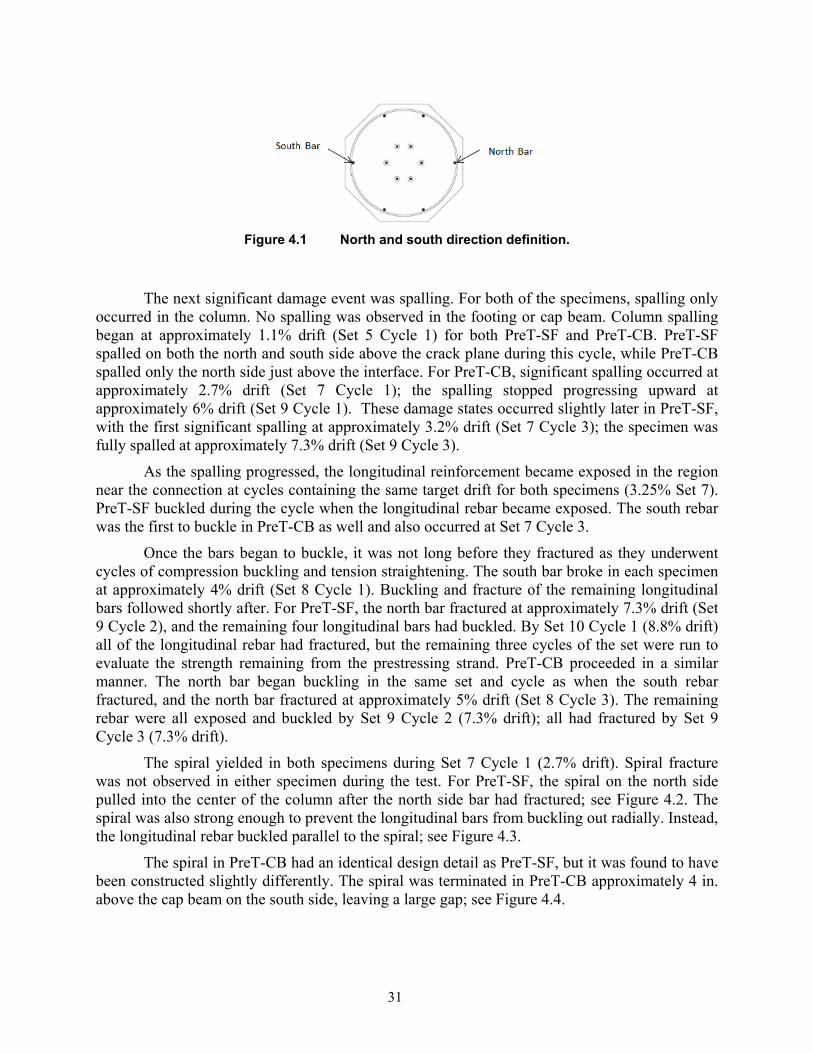
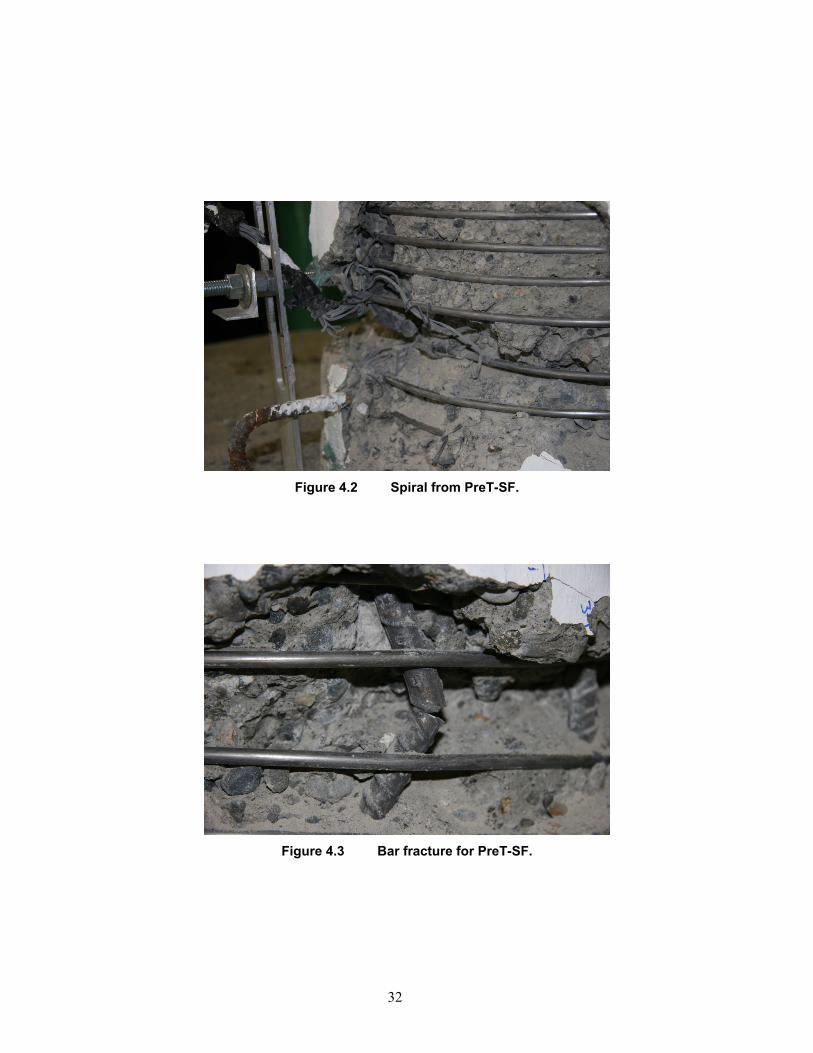
The spiral yielded in both specimens during Set 7 Cycle 1 (2.7% drift). Spiral fracture was not observed in either specimen during the test. For PreT-SF, the spiral on the north side pulled into the center of the column after the north side bar had fractured; see Figure 4.2. The spiral was also strong enough to prevent the longitudinal bars from buckling out radially. Instead, the longitudinal rebar buckled parallel to the spiral; see Figure 4.3.
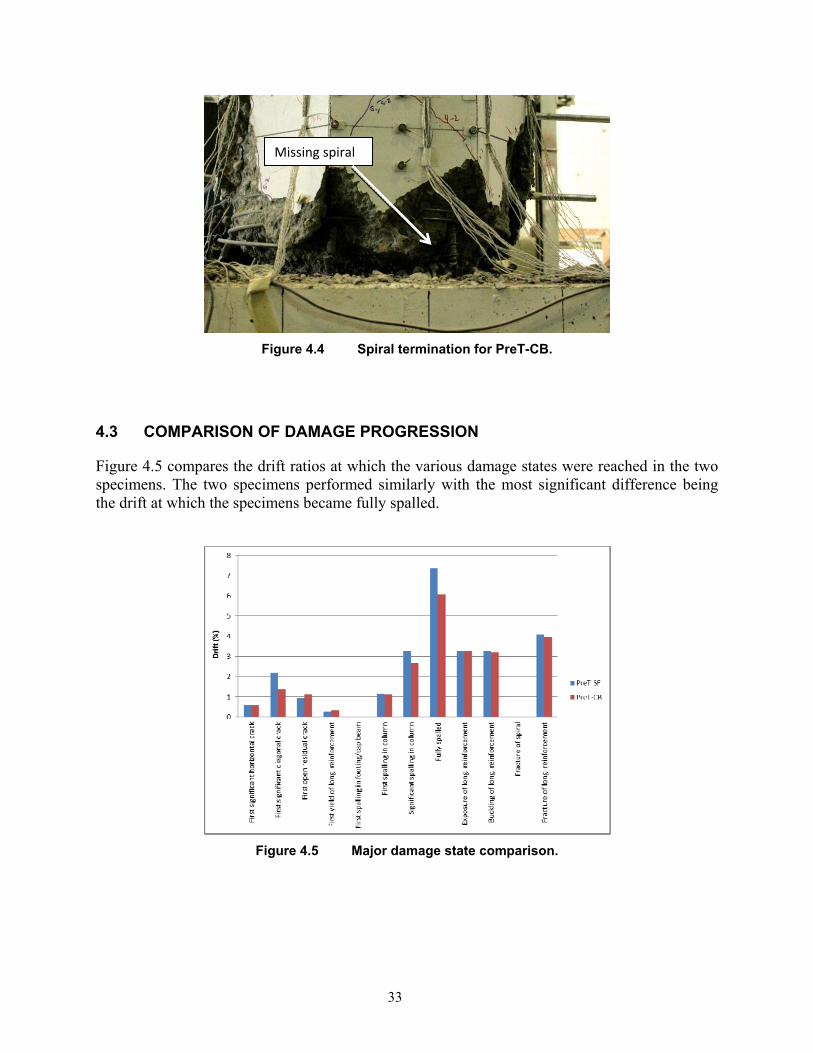
The spiral in PreT-CB had an identical design detail as PreT-SF, but it was found to have been constructed slightly differently. The spiral was terminated in PreT-CB approximately 4 in. above the cap beam on the south side, leaving a large gap; see Figure 4.4.
32
Figure 4.2 Spiral from PreT-SF.
Figure 4.3 Bar fracture for PreT-SF.
33
Figure 4.4 Spiral termination for PreT-CB.
4.3 COMPARISON OF DAMAGE PROGRESSION
Figure 4.5 compares the drift ratios at which the various damage states were reached in the two specimens. The two specimens performed similarly with the most significant difference being the drift at which the specimens became fully spalled.
Figure 4.5 Major damage state comparison.
Missing spiral

34
35
5 Measured Response
5.1 MATERIAL PROPERTIES
The prestressed columns were constructed by Concrete Technology Corporation in Tacoma, Washington, and delivered to the University of Washington. The spread footing and cap beam were constructed in the Structural Laboratory at the University of Washington. Concrete cylinders were cast (4-in. × 8-in. cylinders for the columns; 6-in. × 12-in. cylinders for the footing and cap beam) at the same time as the specimens. The cylinders were then stored in the fog room at the University of Washington until testing. Samples of rebar were obtained for the spread footing and cap beam, but not for the column. Material tests were performed on the concrete, grout, and reinforcement used in the column, footing, and cap beam.
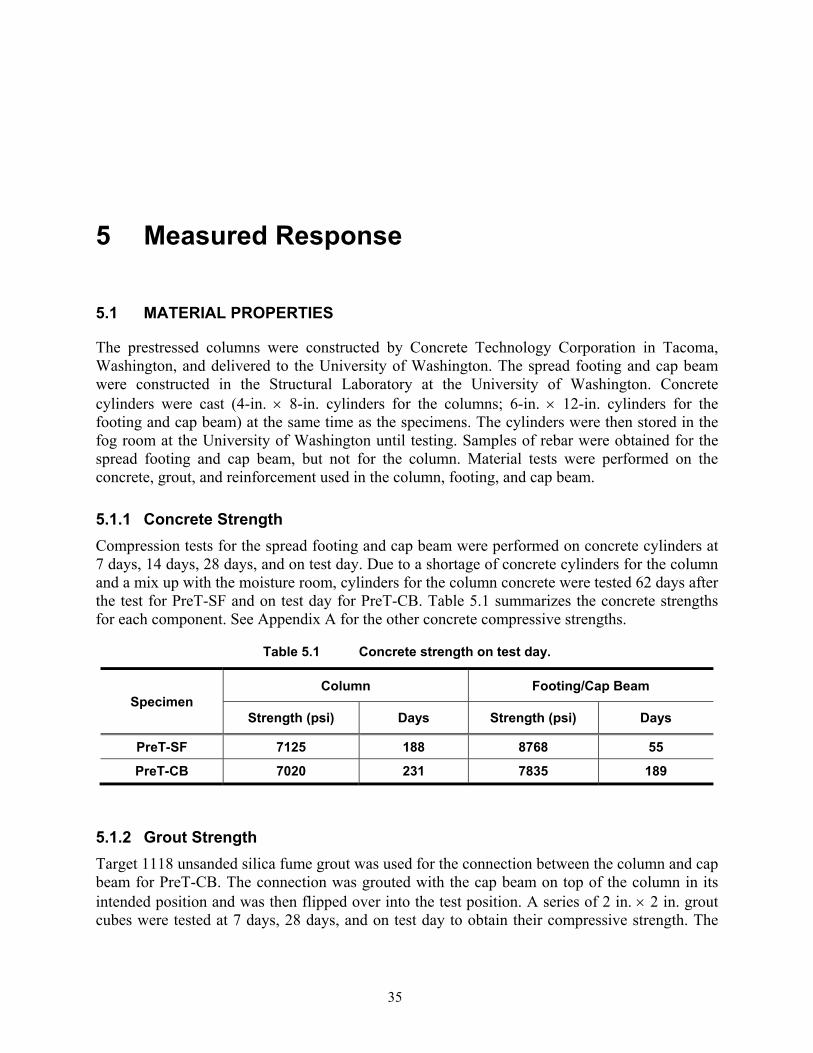
5.1.1 Concrete Strength Compression tests for the spread footing and cap beam were performed on concrete cylinders at 7 days, 14 days, 28 days, and on test day. Due to a shortage of concrete cylinders for the column and a mix up with the moisture room, cylinders for the column concrete were tested 62 days after the test for PreT-SF and on test day for PreT-CB. Table 5.1 summarizes the concrete strengths for each component. See Appendix A for the other concrete compressive strengths.
Table 5.1 Concrete strength on test day.
Specimen Column Footing/Cap Beam
Strength (psi) Days Strength (psi) Days
PreT-SF 7125 188 8768 55
PreT-CB 7020 231 7835 189
5.1.2 Grout Strength Target 1118 unsanded silica fume grout was used for the connection between the column and cap beam for PreT-CB. The connection was grouted with the cap beam on top of the column in its intended position and was then flipped over into the test position. A series of 2 in. × 2 in. grout cubes were tested at 7 days, 28 days, and on test day to obtain their compressive strength. The
36
test day strength of the grout mix was 9850 psi. Further details of the grout can be found in Appendix A.
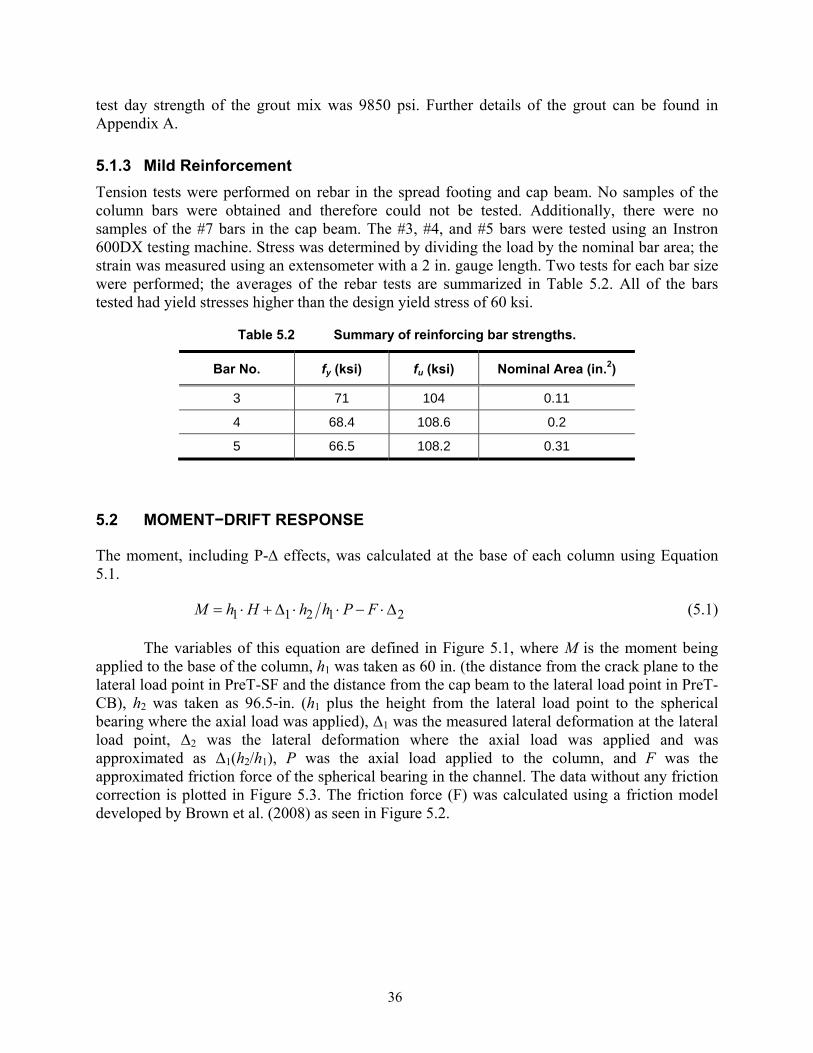
5.1.3 Mild Reinforcement Tension tests were performed on rebar in the spread footing and cap beam. No samples of the column bars were obtained and therefore could not be tested. Additionally, there were no samples of the #7 bars in the cap beam. The #3, #4, and #5 bars were tested using an Instron 600DX testing machine. Stress was determined by dividing the load by the nominal bar area; the strain was measured using an extensometer with a 2 in. gauge length. Two tests for each bar size were performed; the averages of the rebar tests are summarized in Table 5.2. All of the bars tested had yield stresses higher than the design yield stress of 60 ksi.
Table 5.2 Summary of reinforcing bar strengths.
Bar No. fy (ksi) fu (ksi) Nominal Area (in.2)
3 71 104 0.11
4 68.4 108.6 0.2
5 66.5 108.2 0.31
5.2 MOMENT−DRIFT RESPONSE
The moment, including P-Δ effects, was calculated at the base of each column using Equation 5.1.
1 1 2 1 2M h H h h P F= ⋅ + Δ ⋅ ⋅ − ⋅Δ (5.1)
The variables of this equation are defined in Figure 5.1, where M is the moment being applied to the base of the column, h1 was taken as 60 in. (the distance from the crack plane to the lateral load point in PreT-SF and the distance from the cap beam to the lateral load point in PreT-CB), h2 was taken as 96.5-in. (h1 plus the height from the lateral load point to the spherical bearing where the axial load was applied), Δ1 was the measured lateral deformation at the lateral load point, Δ2 was the lateral deformation where the axial load was applied and was approximated as Δ1(h2/h1), P was the axial load applied to the column, and F was the approximated friction force of the spherical bearing in the channel. The data without any friction correction is plotted in Figure 5.3. The friction force (F) was calculated using a friction model developed by Brown et al. (2008) as seen in Figure 5.2.

37
Figure 5.1 Variable definition for moment calculation.
Figure 5.2 Friction correction model.
Although greased stainless steel was placed in the channel and greased PTFE was placed on the spherical bearing to minimize friction, not all of the friction could be eliminated. The approximated friction had two components: sliding in the channel and rotation of the spherical bearing. The effective coefficient of friction was calculated using Equation 5.2.
eff flat curvedtotal
RL
μ μ μ= + ⋅ (5.2)
R is the radius of the spherical element, Ltotal is the height between the footing surface and the top of the bearing (hs in Figure 5.1), µflat is for sliding in the channel and µcurved is for the rotation of the spherical element. The model is bilinear (Figure 5.2) with a spring stiffness (k) of 60 kips/in. and a maximum force of µeffP, where P is the axial load on the specimen; µeff was determined by Brown [2008] to be 1.6% making the maximum friction force 2.54 kips.
The resulting plots for moment drift had an implausible shape. At the points on the hysteresis loops where the specimen changed loading directions, there was a quick drop and rise
Displacement
Friction Force
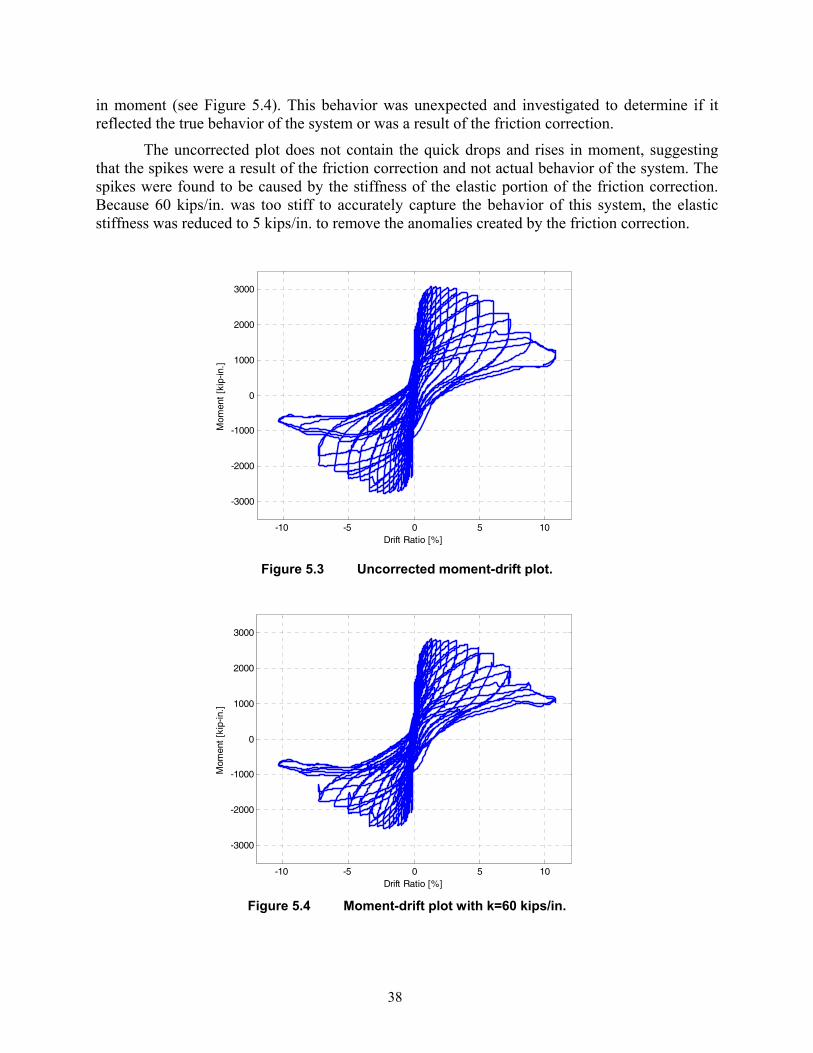
38
in moment (see Figure 5.4). This behavior was unexpected and investigated to determine if it reflected the true behavior of the system or was a result of the friction correction.
The uncorrected plot does not contain the quick drops and rises in moment, suggesting that the spikes were a result of the friction correction and not actual behavior of the system. The spikes were found to be caused by the stiffness of the elastic portion of the friction correction. Because 60 kips/in. was too stiff to accurately capture the behavior of this system, the elastic stiffness was reduced to 5 kips/in. to remove the anomalies created by the friction correction.
-10 -5 0 5 10
-3000
-2000
-1000
0
1000
2000
3000
Drift Ratio [%]
Mom
ent
[kip
-in.]
Figure 5.3 Uncorrected moment-drift plot.
-10 -5 0 5 10
-3000
-2000
-1000
0
1000
2000
3000
Drift Ratio [%]
Mom
ent
[kip
-in.]
Figure 5.4 Moment-drift plot with k=60 kips/in.
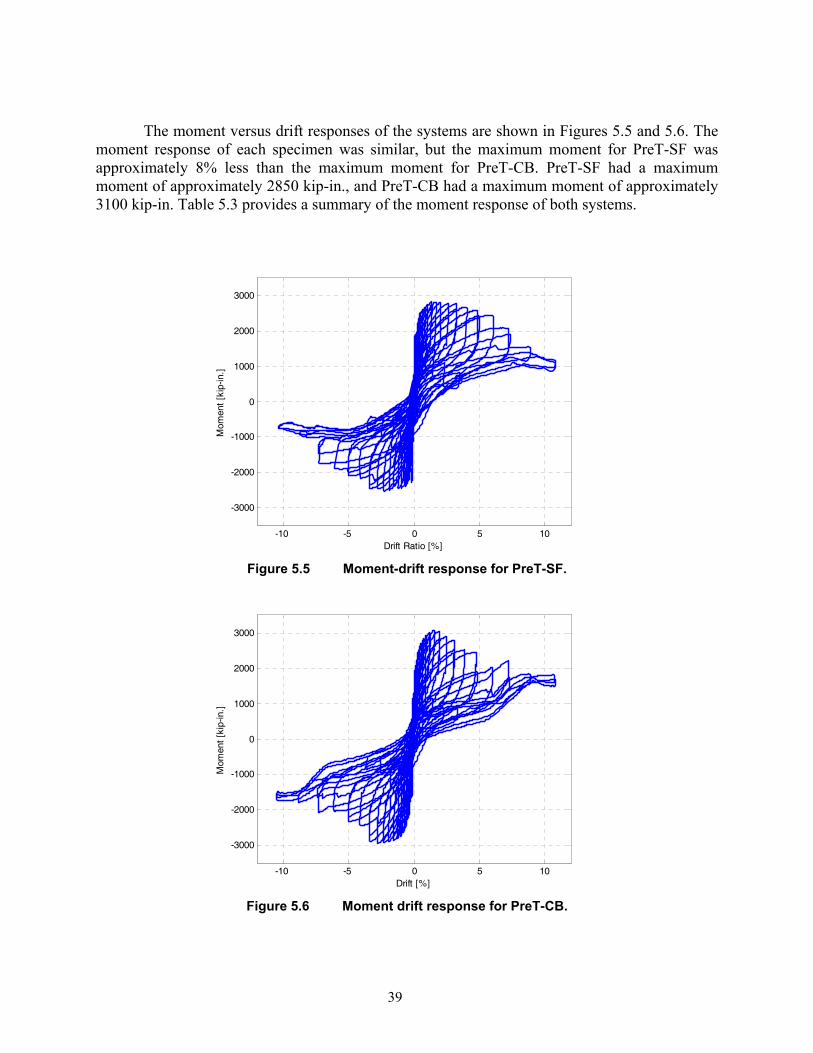
39
The moment versus drift responses of the systems are shown in Figures 5.5 and 5.6. The moment response of each specimen was similar, but the maximum moment for PreT-SF was approximately 8% less than the maximum moment for PreT-CB. PreT-SF had a maximum moment of approximately 2850 kip-in., and PreT-CB had a maximum moment of approximately 3100 kip-in. Table 5.3 provides a summary of the moment response of both systems.
-10 -5 0 5 10
-3000
-2000
-1000
0
1000
2000
3000
Drift Ratio [%]
Mom
ent
[kip
-in.]
Figure 5.5 Moment-drift response for PreT-SF.
-10 -5 0 5 10
-3000
-2000
-1000
0
1000
2000
3000
Drift [%]
Mom
ent
[kip
-in.]
Figure 5.6 Moment drift response for PreT-CB.

40
Table 5.3 Summary of moment drift response.
Point of Interest
Specimen PreT-SF Specimen Pre T-CB
North Direction
South Direction
North Direction
South Direction
Maximum Base Moment (kip-in.) -2533 2843 -2957 3085
Drift Ratio at Maximum Base Moment (%) -2.25 1.38 -2.76 1.55
80% of Maximum Base Moment (kip-in.) -2027 2274 -2366 2468
Drift Ratio at 80% of Maximum Base Moment (kip-in.) -4.94 6.1 -4.1 3.84
The maximum base moment was reached at approximately 1.8% drift for PreT-SF and approximately 2.2% drift for PreT-CB. Failure of the specimens was defined as the point at which the base moment decreased to 80% of its maximum value. This state was achieved at approximately 5.5% drift for PreT-SF and approximately 4% drift for PreT-CB. For PreT-CB, this state occurred at the same time that the first longitudinal bar fractured. However, the strength of PreT-SF decreased more slowly and did not reach 80% of its maximum until the specimen reached a drift approximately 140% larger than the bar fracture drift.
5.3 EFFECTIVE FORCE
The effective force acting on the specimen was approximated by dividing the base moment by h1, the height from the point of fixity to the point of load application (Equation 5.3).
eff 1F M h= (5.3)
Figures 5.7 and 5.8 show the cyclic response of the two specimens in terms of Feff and displacement, Δ1 as previously defined. The maximum effective force (MEF), 80% of the MEF, and the corresponding displacements when each occurred are summarized in Table 5.4.
Table 5.4 Summary of effective force displacement response.
Point of Interest Specimen PreT-SF Specimen Pre T-CB
North Direction
South Direction
North Direction
South Direction
MEF (kips) -42.2 47.4 -49.3 51.4
MEF Displacement (in.) -1.35 0.83 -1.64 0.93
80% of MEF (kips) -33.8 37.9 -39.4 41.1
80% of MEF Displacement (in.) -2.96 3.66 -2.46 2.31
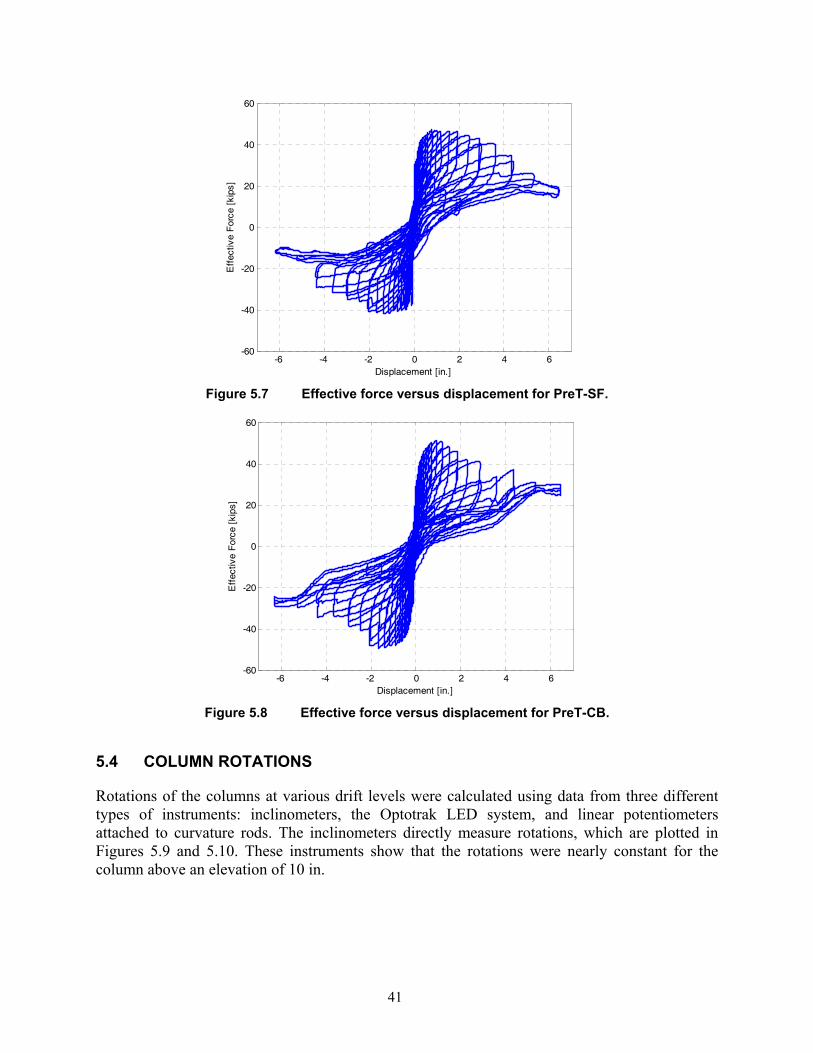
41
-6 -4 -2 0 2 4 6-60
-40
-20
0
20
40
60
Displacement [in.]
Eff
ectiv
e F
orce
[ki
ps]
Figure 5.7 Effective force versus displacement for PreT-SF.
-6 -4 -2 0 2 4 6
-60
-40
-20
0
20
40
60
Displacement [in.]
Eff
ectiv
e F
orce
[ki
ps]
Figure 5.8 Effective force versus displacement for PreT-CB.
5.4 COLUMN ROTATIONS
Rotations of the columns at various drift levels were calculated using data from three different types of instruments: inclinometers, the Optotrak LED system, and linear potentiometers attached to curvature rods. The inclinometers directly measure rotations, which are plotted in Figures 5.9 and 5.10. These instruments show that the rotations were nearly constant for the column above an elevation of 10 in.
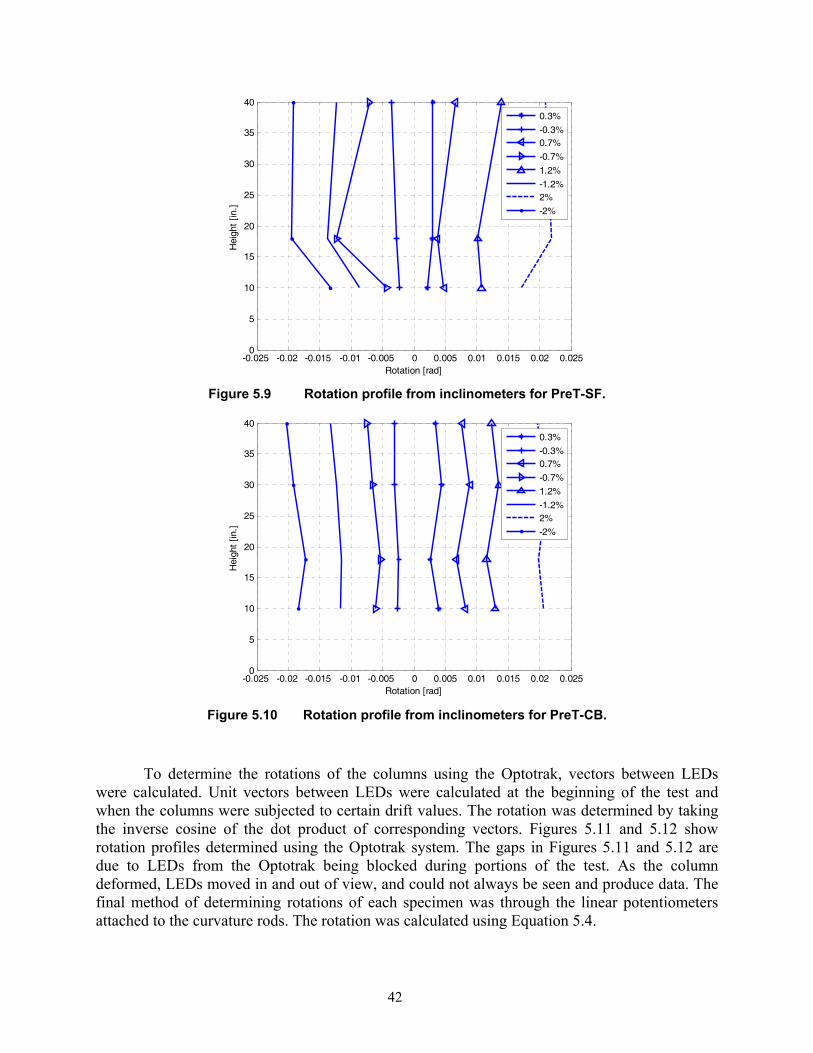
42
-0.025 -0.02 -0.015 -0.01 -0.005 0 0.005 0.01 0.015 0.02 0.0250
5
10
15
20
25
30
35
40
Rotation [rad]
Hei
ght
[in.]
0.3%
-0.3%0.7%
-0.7%
1.2%
-1.2%2%
-2%
Figure 5.9 Rotation profile from inclinometers for PreT-SF.
-0.025 -0.02 -0.015 -0.01 -0.005 0 0.005 0.01 0.015 0.02 0.0250
5
10
15
20
25
30
35
40
Rotation [rad]
Hei
ght
[in.]
0.3%
-0.3%0.7%
-0.7%
1.2%
-1.2%2%
-2%
Figure 5.10 Rotation profile from inclinometers for PreT-CB.
To determine the rotations of the columns using the Optotrak, vectors between LEDs were calculated. Unit vectors between LEDs were calculated at the beginning of the test and when the columns were subjected to certain drift values. The rotation was determined by taking the inverse cosine of the dot product of corresponding vectors. Figures 5.11 and 5.12 show rotation profiles determined using the Optotrak system. The gaps in Figures 5.11 and 5.12 are due to LEDs from the Optotrak being blocked during portions of the test. As the column deformed, LEDs moved in and out of view, and could not always be seen and produce data. The final method of determining rotations of each specimen was through the linear potentiometers attached to the curvature rods. The rotation was calculated using Equation 5.4.
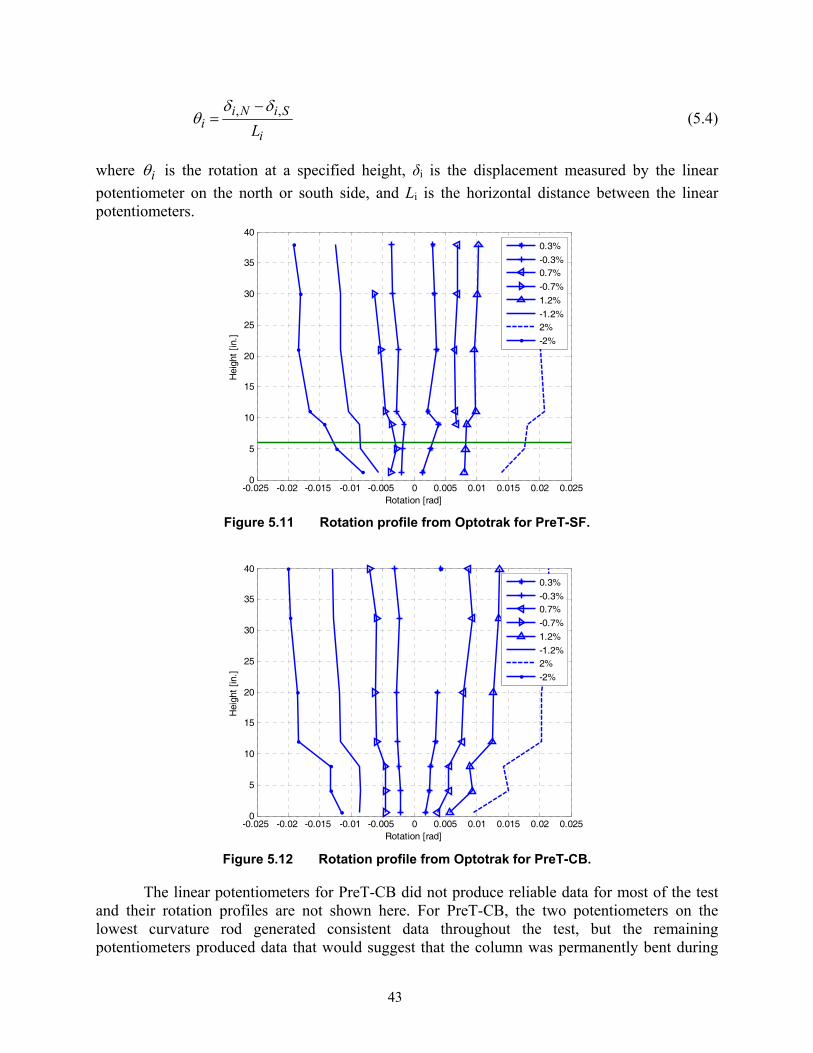
43
, ,i N i Si
iLδ δ
θ−
= (5.4)
where iθ is the rotation at a specified height, δi is the displacement measured by the linear potentiometer on the north or south side, and Li is the horizontal distance between the linear potentiometers.
-0.025 -0.02 -0.015 -0.01 -0.005 0 0.005 0.01 0.015 0.02 0.0250
5
10
15
20
25
30
35
40
Rotation [rad]
Hei
ght
[in.]
0.3%
-0.3%0.7%
-0.7%
1.2%
-1.2%2%
-2%
Figure 5.11 Rotation profile from Optotrak for PreT-SF.
-0.025 -0.02 -0.015 -0.01 -0.005 0 0.005 0.01 0.015 0.02 0.0250
5
10
15
20
25
30
35
40
Rotation [rad]
Hei
ght
[in.]
0.3%
-0.3%0.7%
-0.7%
1.2%
-1.2%2%
-2%
Figure 5.12 Rotation profile from Optotrak for PreT-CB.
The linear potentiometers for PreT-CB did not produce reliable data for most of the test and their rotation profiles are not shown here. For PreT-CB, the two potentiometers on the lowest curvature rod generated consistent data throughout the test, but the remaining potentiometers produced data that would suggest that the column was permanently bent during
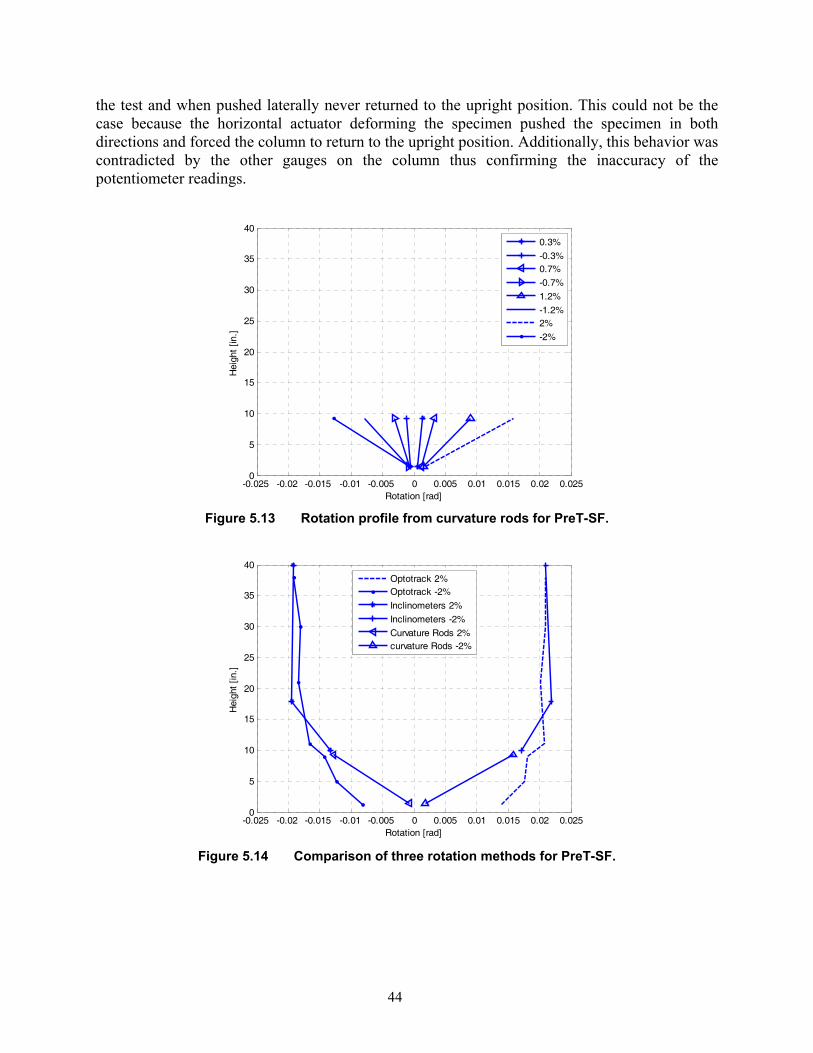
44
the test and when pushed laterally never returned to the upright position. This could not be the case because the horizontal actuator deforming the specimen pushed the specimen in both directions and forced the column to return to the upright position. Additionally, this behavior was contradicted by the other gauges on the column thus confirming the inaccuracy of the potentiometer readings.
-0.025 -0.02 -0.015 -0.01 -0.005 0 0.005 0.01 0.015 0.02 0.0250
5
10
15
20
25
30
35
40
Rotation [rad]
Hei
ght
[in.]
0.3%
-0.3%0.7%
-0.7%
1.2%
-1.2%2%
-2%
Figure 5.13 Rotation profile from curvature rods for PreT-SF.
-0.025 -0.02 -0.015 -0.01 -0.005 0 0.005 0.01 0.015 0.02 0.0250
5
10
15
20
25
30
35
40
Rotation [rad]
Hei
ght
[in.]
Optotrack 2%Optotrack -2%
Inclinometers 2%
Inclinometers -2%
Curvature Rods 2%curvature Rods -2%
Figure 5.14 Comparison of three rotation methods for PreT-SF.
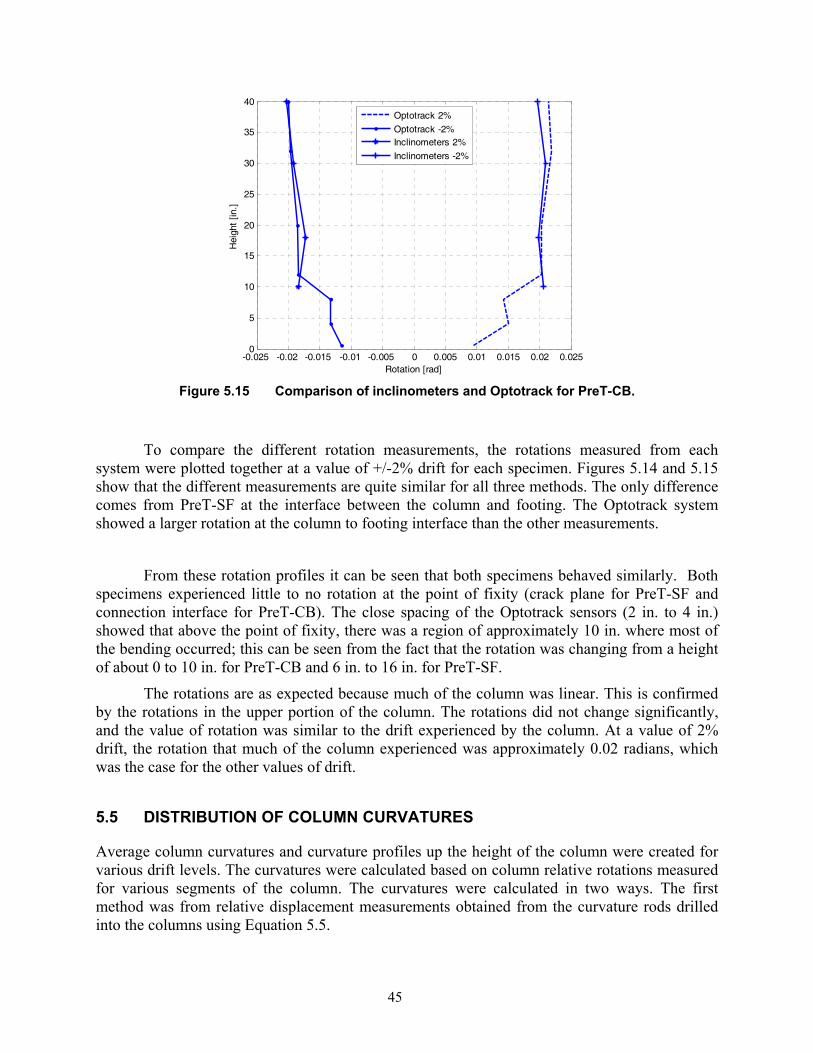
45
-0.025 -0.02 -0.015 -0.01 -0.005 0 0.005 0.01 0.015 0.02 0.0250
5
10
15
20
25
30
35
40
Rotation [rad]
Hei
ght
[in.]
Optotrack 2%
Optotrack -2%Inclinometers 2%
Inclinometers -2%
Figure 5.15 Comparison of inclinometers and Optotrack for PreT-CB.
To compare the different rotation measurements, the rotations measured from each system were plotted together at a value of +/-2% drift for each specimen. Figures 5.14 and 5.15 show that the different measurements are quite similar for all three methods. The only difference comes from PreT-SF at the interface between the column and footing. The Optotrack system showed a larger rotation at the column to footing interface than the other measurements.
From these rotation profiles it can be seen that both specimens behaved similarly. Both specimens experienced little to no rotation at the point of fixity (crack plane for PreT-SF and connection interface for PreT-CB). The close spacing of the Optotrack sensors (2 in. to 4 in.) showed that above the point of fixity, there was a region of approximately 10 in. where most of the bending occurred; this can be seen from the fact that the rotation was changing from a height of about 0 to 10 in. for PreT-CB and 6 in. to 16 in. for PreT-SF.
The rotations are as expected because much of the column was linear. This is confirmed by the rotations in the upper portion of the column. The rotations did not change significantly, and the value of rotation was similar to the drift experienced by the column. At a value of 2% drift, the rotation that much of the column experienced was approximately 0.02 radians, which was the case for the other values of drift.
5.5 DISTRIBUTION OF COLUMN CURVATURES
Average column curvatures and curvature profiles up the height of the column were created for various drift levels. The curvatures were calculated based on column relative rotations measured for various segments of the column. The curvatures were calculated in two ways. The first method was from relative displacement measurements obtained from the curvature rods drilled into the columns using Equation 5.5.
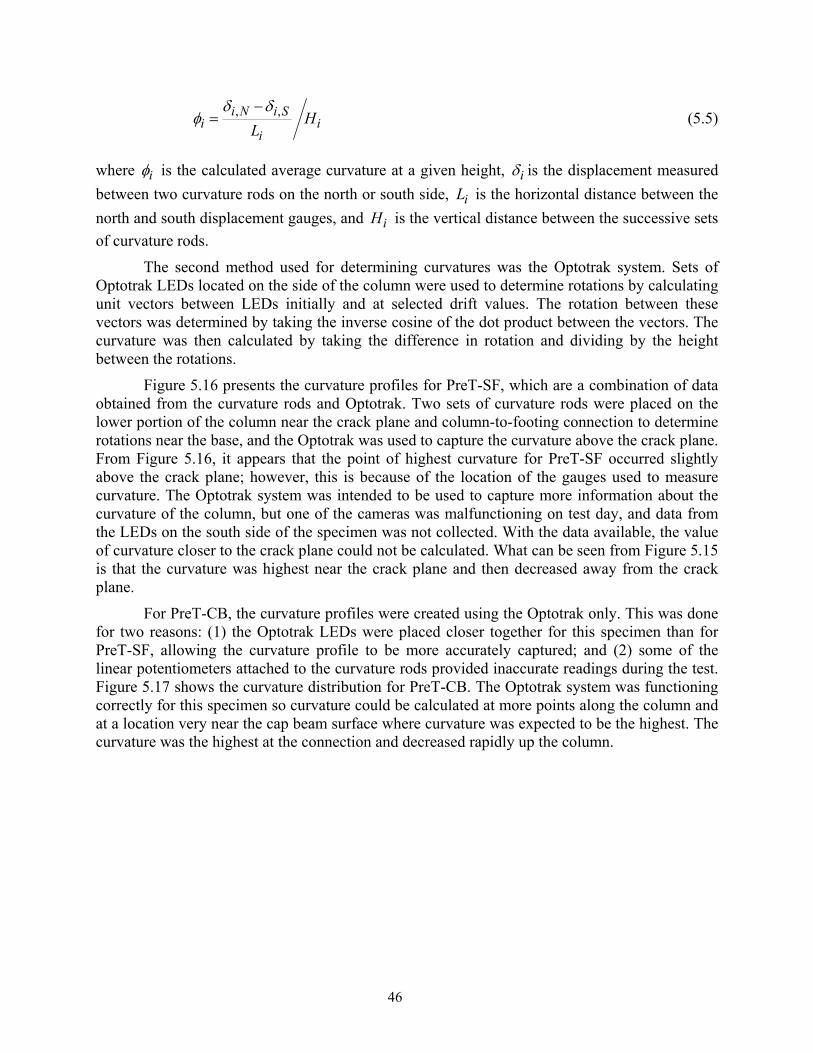
46
, ,i N i Si i
iH
Lδ δ
φ−
= (5.5)
where iφ is the calculated average curvature at a given height, iδ is the displacement measured between two curvature rods on the north or south side, iL is the horizontal distance between the north and south displacement gauges, and iH is the vertical distance between the successive sets of curvature rods.
The second method used for determining curvatures was the Optotrak system. Sets of Optotrak LEDs located on the side of the column were used to determine rotations by calculating unit vectors between LEDs initially and at selected drift values. The rotation between these vectors was determined by taking the inverse cosine of the dot product between the vectors. The curvature was then calculated by taking the difference in rotation and dividing by the height between the rotations.
Figure 5.16 presents the curvature profiles for PreT-SF, which are a combination of data obtained from the curvature rods and Optotrak. Two sets of curvature rods were placed on the lower portion of the column near the crack plane and column-to-footing connection to determine rotations near the base, and the Optotrak was used to capture the curvature above the crack plane. From Figure 5.16, it appears that the point of highest curvature for PreT-SF occurred slightly above the crack plane; however, this is because of the location of the gauges used to measure curvature. The Optotrak system was intended to be used to capture more information about the curvature of the column, but one of the cameras was malfunctioning on test day, and data from the LEDs on the south side of the specimen was not collected. With the data available, the value of curvature closer to the crack plane could not be calculated. What can be seen from Figure 5.15 is that the curvature was highest near the crack plane and then decreased away from the crack plane.
For PreT-CB, the curvature profiles were created using the Optotrak only. This was done for two reasons: (1) the Optotrak LEDs were placed closer together for this specimen than for PreT-SF, allowing the curvature profile to be more accurately captured; and (2) some of the linear potentiometers attached to the curvature rods provided inaccurate readings during the test. Figure 5.17 shows the curvature distribution for PreT-CB. The Optotrak system was functioning correctly for this specimen so curvature could be calculated at more points along the column and at a location very near the cap beam surface where curvature was expected to be the highest. The curvature was the highest at the connection and decreased rapidly up the column.
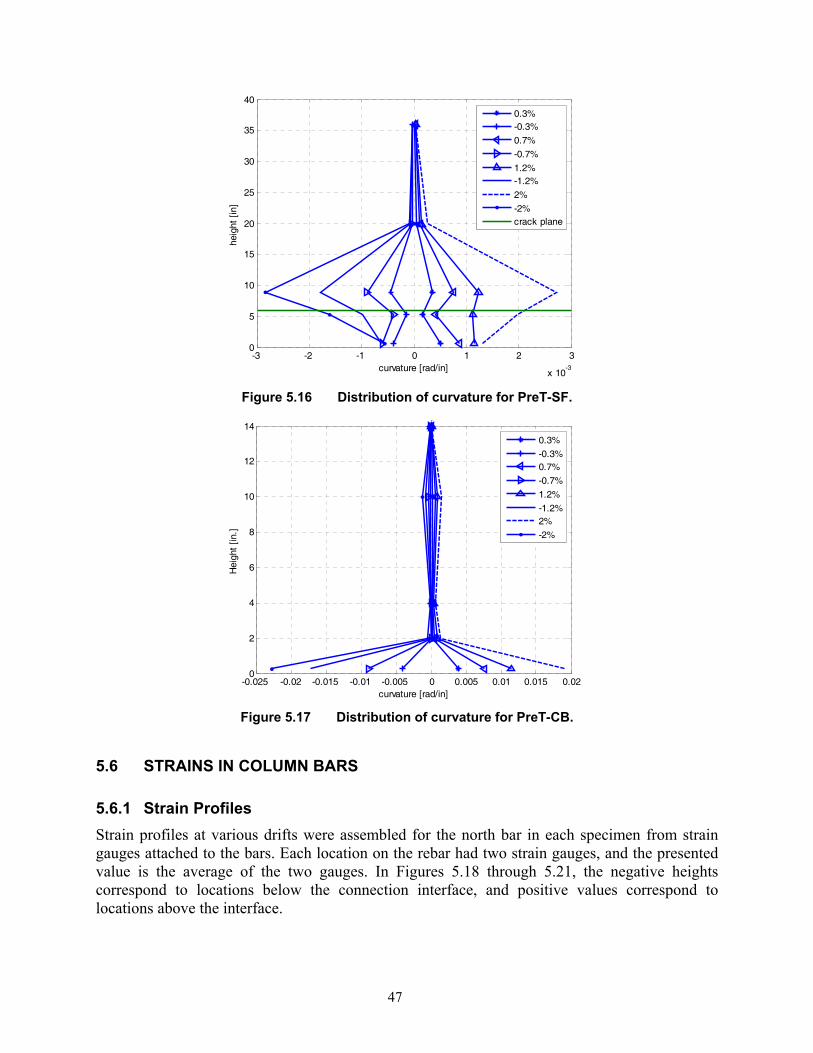
47
-3 -2 -1 0 1 2 3
x 10-3
0
5
10
15
20
25
30
35
40
curvature [rad/in]
heig
ht [
in]
0.3%-0.3%
0.7%
-0.7%
1.2%-1.2%
2%
-2%crack plane
Figure 5.16 Distribution of curvature for PreT-SF.
-0.025 -0.02 -0.015 -0.01 -0.005 0 0.005 0.01 0.015 0.020
2
4
6
8
10
12
14p
curvature [rad/in]
Hei
ght
[in.]
0.3%
-0.3%0.7%
-0.7%
1.2%
-1.2%2%
-2%
Figure 5.17 Distribution of curvature for PreT-CB.
5.6 STRAINS IN COLUMN BARS
5.6.1 Strain Profiles Strain profiles at various drifts were assembled for the north bar in each specimen from strain gauges attached to the bars. Each location on the rebar had two strain gauges, and the presented value is the average of the two gauges. In Figures 5.18 through 5.21, the negative heights correspond to locations below the connection interface, and positive values correspond to locations above the interface.
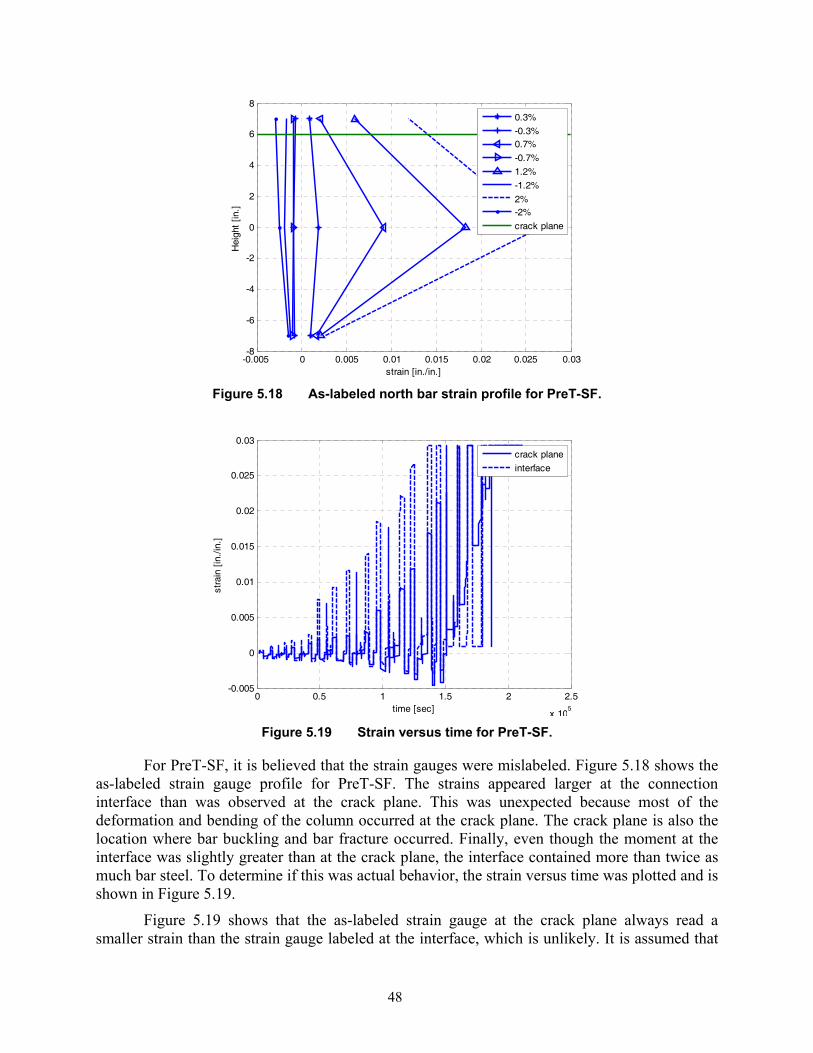
48
-0.005 0 0.005 0.01 0.015 0.02 0.025 0.03-8
-6
-4
-2
0
2
4
6
8
strain [in./in.]
Hei
ght
[in.]
0.3%
-0.3%0.7%
-0.7%
1.2%
-1.2%
2%-2%
crack plane
Figure 5.18 As-labeled north bar strain profile for PreT-SF.
0 0.5 1 1.5 2 2.5
x 105
-0.005
0
0.005
0.01
0.015
0.02
0.025
0.03
time [sec]
stra
in [
in./
in.]
crack plane
interface
Figure 5.19 Strain versus time for PreT-SF.
For PreT-SF, it is believed that the strain gauges were mislabeled. Figure 5.18 shows the as-labeled strain gauge profile for PreT-SF. The strains appeared larger at the connection interface than was observed at the crack plane. This was unexpected because most of the deformation and bending of the column occurred at the crack plane. The crack plane is also the location where bar buckling and bar fracture occurred. Finally, even though the moment at the interface was slightly greater than at the crack plane, the interface contained more than twice as much bar steel. To determine if this was actual behavior, the strain versus time was plotted and is shown in Figure 5.19.
Figure 5.19 shows that the as-labeled strain gauge at the crack plane always read a smaller strain than the strain gauge labeled at the interface, which is unlikely. It is assumed that
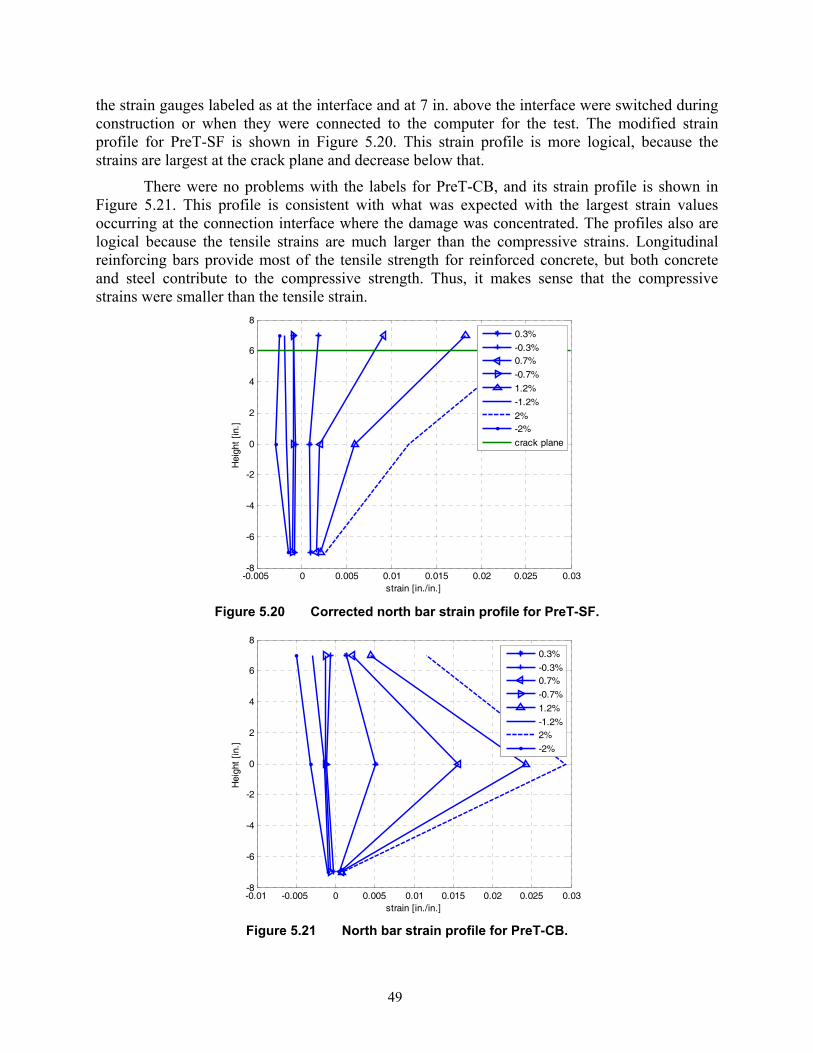
49
the strain gauges labeled as at the interface and at 7 in. above the interface were switched during construction or when they were connected to the computer for the test. The modified strain profile for PreT-SF is shown in Figure 5.20. This strain profile is more logical, because the strains are largest at the crack plane and decrease below that.
There were no problems with the labels for PreT-CB, and its strain profile is shown in Figure 5.21. This profile is consistent with what was expected with the largest strain values occurring at the connection interface where the damage was concentrated. The profiles also are logical because the tensile strains are much larger than the compressive strains. Longitudinal reinforcing bars provide most of the tensile strength for reinforced concrete, but both concrete and steel contribute to the compressive strength. Thus, it makes sense that the compressive strains were smaller than the tensile strain.
-0.005 0 0.005 0.01 0.015 0.02 0.025 0.03-8
-6
-4
-2
0
2
4
6
8
strain [in./in.]
Hei
ght
[in.]
0.3%
-0.3%0.7%
-0.7%
1.2%
-1.2%
2%-2%
crack plane
Figure 5.20 Corrected north bar strain profile for PreT-SF.
-0.01 -0.005 0 0.005 0.01 0.015 0.02 0.025 0.03-8
-6
-4
-2
0
2
4
6
8
strain [in./in.]
Hei
ght
[in.]
0.3%
-0.3%0.7%
-0.7%
1.2%
-1.2%2%
-2%
Figure 5.21 North bar strain profile for PreT-CB.
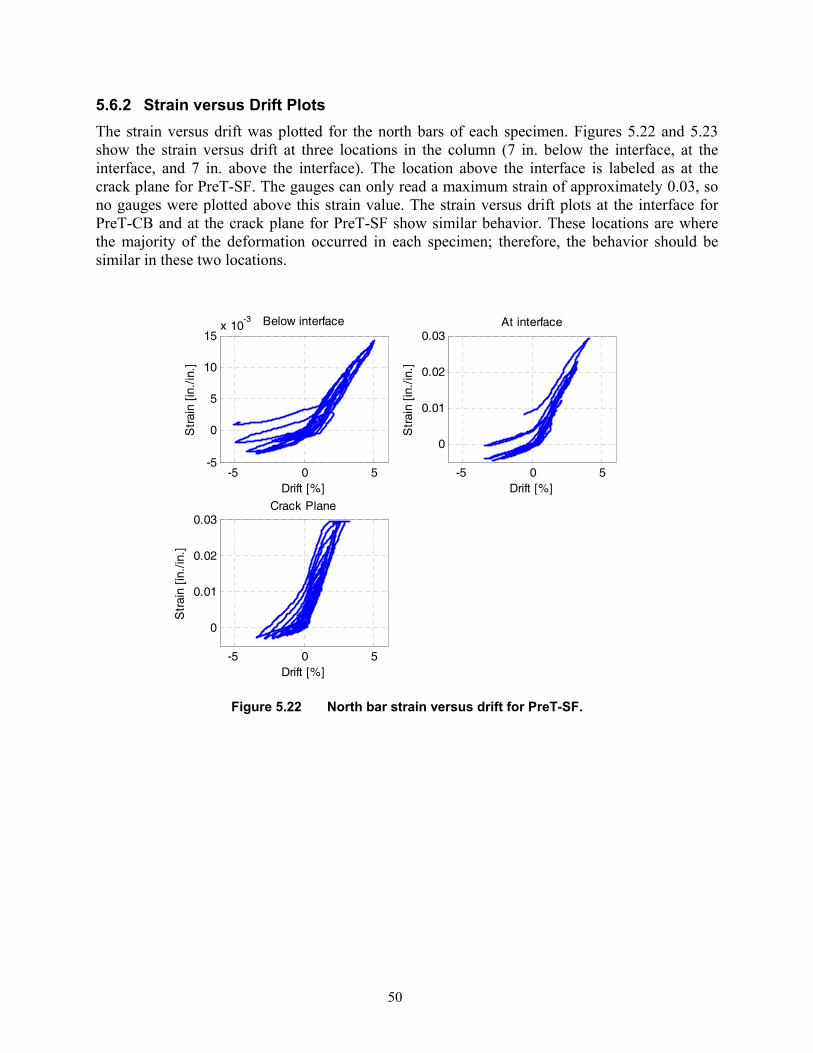
50
5.6.2 Strain versus Drift Plots The strain versus drift was plotted for the north bars of each specimen. Figures 5.22 and 5.23 show the strain versus drift at three locations in the column (7 in. below the interface, at the interface, and 7 in. above the interface). The location above the interface is labeled as at the crack plane for PreT-SF. The gauges can only read a maximum strain of approximately 0.03, so no gauges were plotted above this strain value. The strain versus drift plots at the interface for PreT-CB and at the crack plane for PreT-SF show similar behavior. These locations are where the majority of the deformation occurred in each specimen; therefore, the behavior should be similar in these two locations.
-5 0 5-5
0
5
10
15x 10
-3 Below interface
Drift [%]
Str
ain
[in./
in.]
-5 0 5
0
0.01
0.02
0.03Crack Plane
Drift [%]
Str
ain
[in./
in.]
-5 0 5
0
0.01
0.02
0.03At interface
Drift [%]
Str
ain
[in./
in.]
Figure 5.22 North bar strain versus drift for PreT-SF.
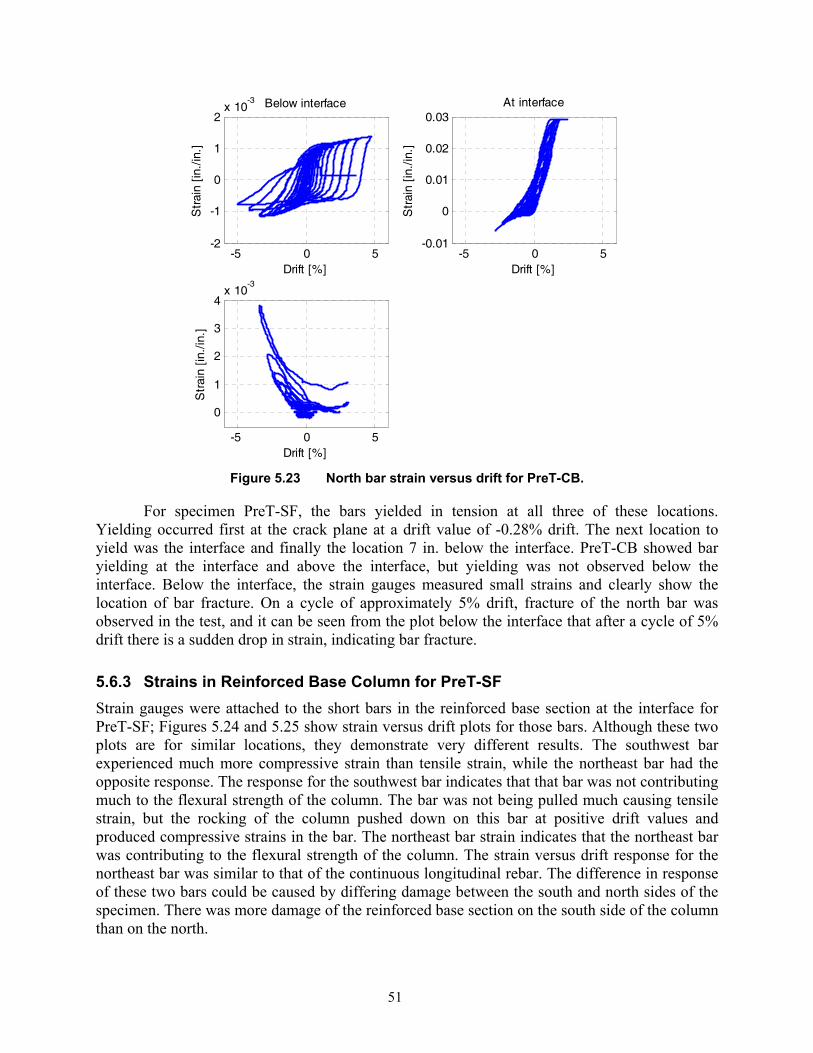
51
-5 0 5-2
-1
0
1
2x 10
-3 Below interface
Drift [%]
Str
ain
[in./
in.]
-5 0 5-0.01
0
0.01
0.02
0.03At interface
Drift [%]
Str
ain
[in./
in.]
-5 0 5
0
1
2
3
4x 10
-3
Drift [%]
Str
ain
[in./
in.]
Figure 5.23 North bar strain versus drift for PreT-CB.
For specimen PreT-SF, the bars yielded in tension at all three of these locations. Yielding occurred first at the crack plane at a drift value of -0.28% drift. The next location to yield was the interface and finally the location 7 in. below the interface. PreT-CB showed bar yielding at the interface and above the interface, but yielding was not observed below the interface. Below the interface, the strain gauges measured small strains and clearly show the location of bar fracture. On a cycle of approximately 5% drift, fracture of the north bar was observed in the test, and it can be seen from the plot below the interface that after a cycle of 5% drift there is a sudden drop in strain, indicating bar fracture.
5.6.3 Strains in Reinforced Base Column for PreT-SF Strain gauges were attached to the short bars in the reinforced base section at the interface for PreT-SF; Figures 5.24 and 5.25 show strain versus drift plots for those bars. Although these two plots are for similar locations, they demonstrate very different results. The southwest bar experienced much more compressive strain than tensile strain, while the northeast bar had the opposite response. The response for the southwest bar indicates that that bar was not contributing much to the flexural strength of the column. The bar was not being pulled much causing tensile strain, but the rocking of the column pushed down on this bar at positive drift values and produced compressive strains in the bar. The northeast bar strain indicates that the northeast bar was contributing to the flexural strength of the column. The strain versus drift response for the northeast bar was similar to that of the continuous longitudinal rebar. The difference in response of these two bars could be caused by differing damage between the south and north sides of the specimen. There was more damage of the reinforced base section on the south side of the column than on the north.
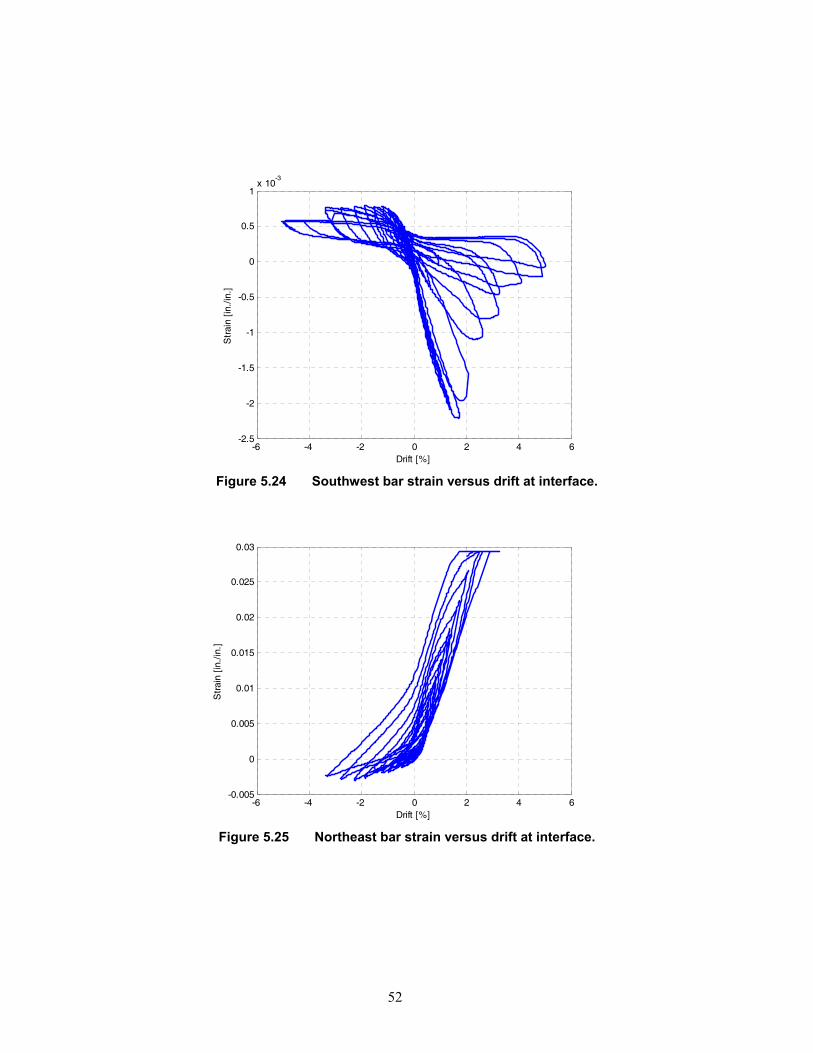
52
-6 -4 -2 0 2 4 6-2.5
-2
-1.5
-1
-0.5
0
0.5
1x 10
-3
Drift [%]
Str
ain
[in./
in.]
Figure 5.24 Southwest bar strain versus drift at interface.
-6 -4 -2 0 2 4 6-0.005
0
0.005
0.01
0.015
0.02
0.025
0.03
Drift [%]
Str
ain
[in./
in.]
Figure 5.25 Northeast bar strain versus drift at interface.

53
(a) (b)
Figure 5.26 Damage of PreT-SF at 6% drift.
Figure 5.26(a) shows the northeast portion of PreT-SF with minimum damage to the reinforced base section. Figure 5.26(b) is of the west side of the column, showing that the south side (right side of the picture) has more spalling of concrete than the north side in the reinforced base. The damage to the concrete in the reinforced base section could have caused the southwest rebar in the reinforced base to have a weak bond and prevent it from developing tensile strains. This could explain why the column had more strength when displaced in the south direction than in the north direction. If the north short bars were contributing to the flexural strength and the south short bars were not, the column would be stronger in the south direction than the north.
5.7 STRAINS IN SPIRAL
The strains in the spiral were also recorded throughout the test and are plotted in Figures 5.27 and 5.28. Both specimens had a similar and expected response in the spiral. The spiral had very small strain when the column was at zero displacement and then increased when the column went through positive and negative drifts. The spiral yielded in both specimens at cycles of approximately 3% drift.
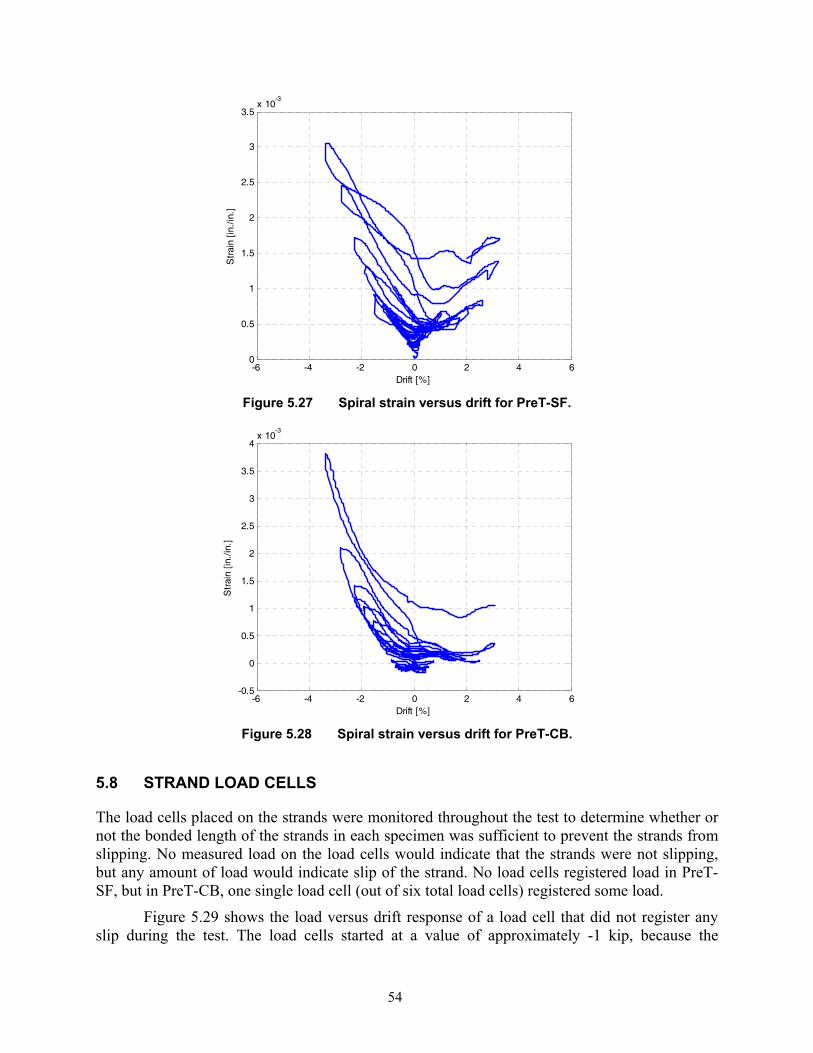
54
-6 -4 -2 0 2 4 60
0.5
1
1.5
2
2.5
3
3.5x 10
-3
Drift [%]
Str
ain
[in./
in.]
Figure 5.27 Spiral strain versus drift for PreT-SF.
-6 -4 -2 0 2 4 6-0.5
0
0.5
1
1.5
2
2.5
3
3.5
4x 10
-3
Drift [%]
Str
ain
[in./
in.]
Figure 5.28 Spiral strain versus drift for PreT-CB.
5.8 STRAND LOAD CELLS
The load cells placed on the strands were monitored throughout the test to determine whether or not the bonded length of the strands in each specimen was sufficient to prevent the strands from slipping. No measured load on the load cells would indicate that the strands were not slipping, but any amount of load would indicate slip of the strand. No load cells registered load in PreT-SF, but in PreT-CB, one single load cell (out of six total load cells) registered some load.
Figure 5.29 shows the load versus drift response of a load cell that did not register any slip during the test. The load cells started at a value of approximately -1 kip, because the
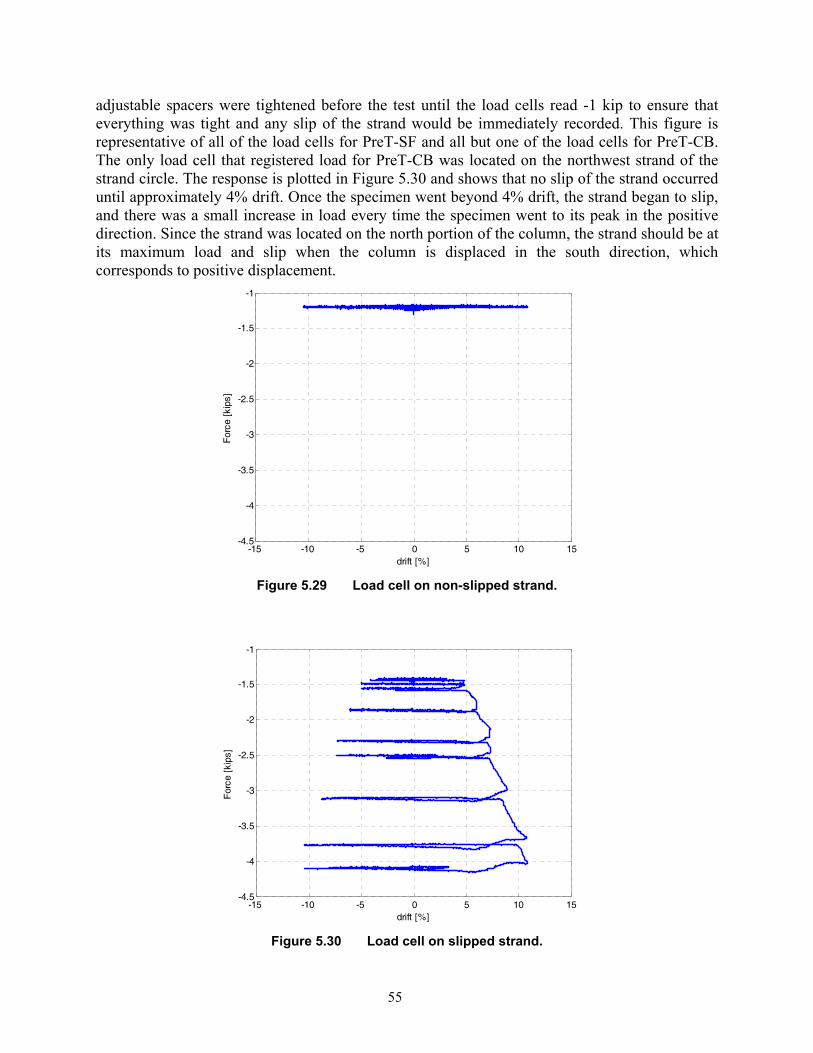
55
adjustable spacers were tightened before the test until the load cells read -1 kip to ensure that everything was tight and any slip of the strand would be immediately recorded. This figure is representative of all of the load cells for PreT-SF and all but one of the load cells for PreT-CB. The only load cell that registered load for PreT-CB was located on the northwest strand of the strand circle. The response is plotted in Figure 5.30 and shows that no slip of the strand occurred until approximately 4% drift. Once the specimen went beyond 4% drift, the strand began to slip, and there was a small increase in load every time the specimen went to its peak in the positive direction. Since the strand was located on the north portion of the column, the strand should be at its maximum load and slip when the column is displaced in the south direction, which corresponds to positive displacement.
-15 -10 -5 0 5 10 15-4.5
-4
-3.5
-3
-2.5
-2
-1.5
-1
drift [%]
For
ce [
kips
]
Figure 5.29 Load cell on non-slipped strand.
-15 -10 -5 0 5 10 15-4.5
-4
-3.5
-3
-2.5
-2
-1.5
-1
drift [%]
For
ce [
kips
]
Figure 5.30 Load cell on slipped strand.

56
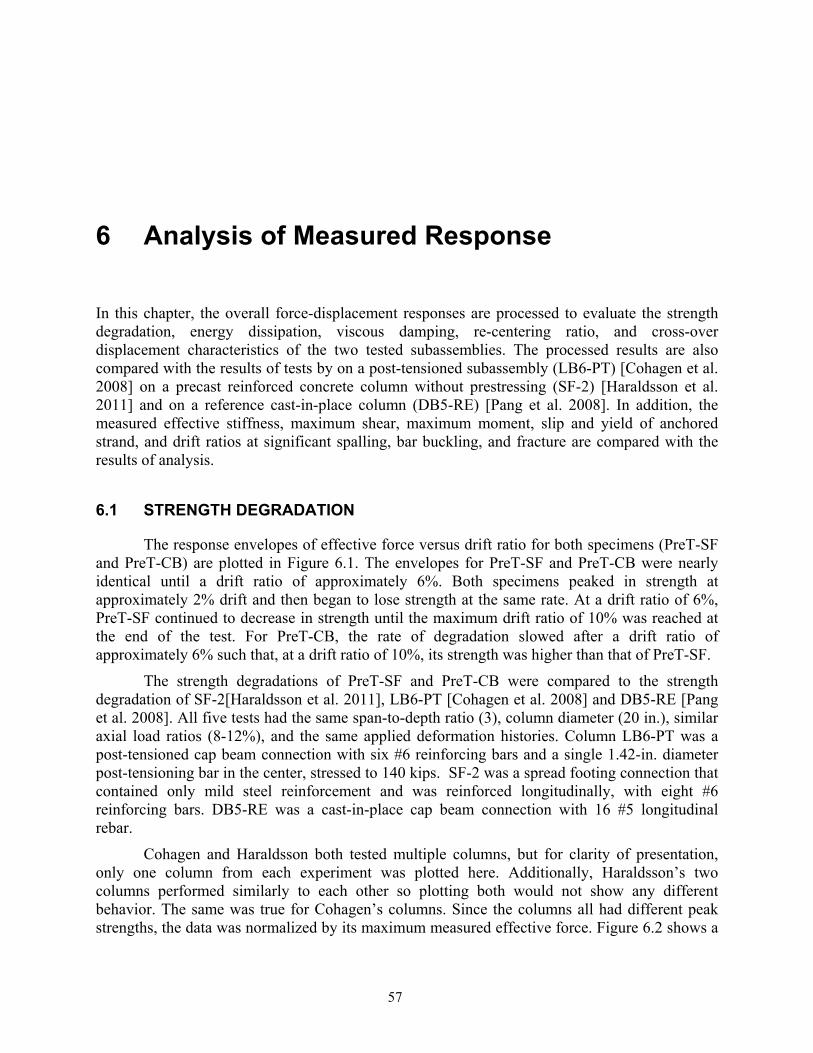
57
6 Analysis of Measured Response
In this chapter, the overall force-displacement responses are processed to evaluate the strength degradation, energy dissipation, viscous damping, re-centering ratio, and cross-over displacement characteristics of the two tested subassemblies. The processed results are also compared with the results of tests by on a post-tensioned subassembly (LB6-PT) [Cohagen et al. 2008] on a precast reinforced concrete column without prestressing (SF-2) [Haraldsson et al. 2011] and on a reference cast-in-place column (DB5-RE) [Pang et al. 2008]. In addition, the measured effective stiffness, maximum shear, maximum moment, slip and yield of anchored strand, and drift ratios at significant spalling, bar buckling, and fracture are compared with the results of analysis.
6.1 STRENGTH DEGRADATION
The response envelopes of effective force versus drift ratio for both specimens (PreT-SF and PreT-CB) are plotted in Figure 6.1. The envelopes for PreT-SF and PreT-CB were nearly identical until a drift ratio of approximately 6%. Both specimens peaked in strength at approximately 2% drift and then began to lose strength at the same rate. At a drift ratio of 6%, PreT-SF continued to decrease in strength until the maximum drift ratio of 10% was reached at the end of the test. For PreT-CB, the rate of degradation slowed after a drift ratio of approximately 6% such that, at a drift ratio of 10%, its strength was higher than that of PreT-SF.
The strength degradations of PreT-SF and PreT-CB were compared to the strength degradation of SF-2[Haraldsson et al. 2011], LB6-PT [Cohagen et al. 2008] and DB5-RE [Pang et al. 2008]. All five tests had the same span-to-depth ratio (3), column diameter (20 in.), similar axial load ratios (8-12%), and the same applied deformation histories. Column LB6-PT was a post-tensioned cap beam connection with six #6 reinforcing bars and a single 1.42-in. diameter post-tensioning bar in the center, stressed to 140 kips. SF-2 was a spread footing connection that contained only mild steel reinforcement and was reinforced longitudinally, with eight #6 reinforcing bars. DB5-RE was a cast-in-place cap beam connection with 16 #5 longitudinal rebar.
Cohagen and Haraldsson both tested multiple columns, but for clarity of presentation, only one column from each experiment was plotted here. Additionally, Haraldsson’s two columns performed similarly to each other so plotting both would not show any different behavior. The same was true for Cohagen’s columns. Since the columns all had different peak strengths, the data was normalized by its maximum measured effective force. Figure 6.2 shows a
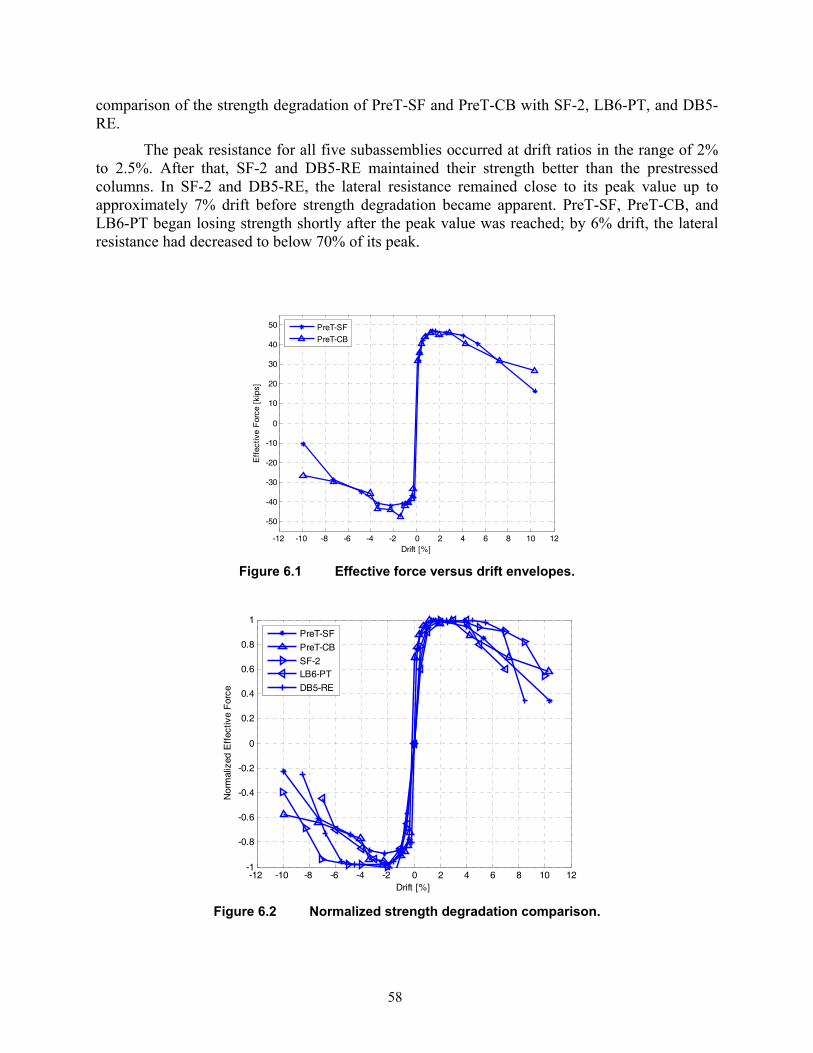
58
comparison of the strength degradation of PreT-SF and PreT-CB with SF-2, LB6-PT, and DB5-RE.
The peak resistance for all five subassemblies occurred at drift ratios in the range of 2% to 2.5%. After that, SF-2 and DB5-RE maintained their strength better than the prestressed columns. In SF-2 and DB5-RE, the lateral resistance remained close to its peak value up to approximately 7% drift before strength degradation became apparent. PreT-SF, PreT-CB, and LB6-PT began losing strength shortly after the peak value was reached; by 6% drift, the lateral resistance had decreased to below 70% of its peak.
-12 -10 -8 -6 -4 -2 0 2 4 6 8 10 12
-50
-40
-30
-20
-10
0
10
20
30
40
50
Drift [%]
Eff
ectiv
e F
orce
[ki
ps]
PreT-SF
PreT-CB
Figure 6.1 Effective force versus drift envelopes.
-12 -10 -8 -6 -4 -2 0 2 4 6 8 10 12-1
-0.8
-0.6
-0.4
-0.2
0
0.2
0.4
0.6
0.8
1
Drift [%]
Nor
mal
ized
Eff
ectiv
e F
orce
PreT-SF
PreT-CB
SF-2LB6-PT
DB5-RE
Figure 6.2 Normalized strength degradation comparison.

59
For many bridges, the drift ratio expected to be reached in the design basis earthquake (DBE) is approximately 1.5% to 2%. In the maximum considered earthquake (MCE), it might be 3%. At that drift ratio, the lateral resistance of each of these columns was still above 90% of its peak values; therefore, their ability to maintain strength under cyclic loading can be considered satisfactory. The fact that both connections maintained strength so well suggests that a column built using PreT-SF at the footing and PreT-CB at the top would maintain its flexural strength at both ends, without failing prematurely.
6.2 ENERGY DISSIPATION
Energy dissipation was determined by calculating the area inside the effective force versus displacement loops. The integration was done using the trapezoidal method.
6.2.1 Energy Dissipation of Pre-Tensioned Specimens
Figures 6.3 through 6.5 show the energy dissipation per cycle for the pre-tensioned subassemblies. As shown in Figure 6.3 cycle 23 was not recorded during the testing of PreT-SF. To compare the cumulative energy dissipation of PreT-SF and PreT-CB with that of SF-2 [Haraldsson et al. 2011], the energy dissipation of cycle 23 was approximated. The test loading was run in sets of four cycles, with the second and third having the same drift ratio, which was 20% higher than the first. This caused the energy dissipation to be approximately the same in the first and third cycles. Accordingly, the energy dissipation of cycle 23 was approximated by the energy dissipation of cycle 21. Figure 6.4 shows the modified energy dissipation per cycle (the drift plotted is the maximum achieved in each 4 cycle set).
Specimens PreT-SF and PreT-CB had very similar energy dissipation per cycle except for cycles 33 through 35, during which PreT-SF displayed approximately 20% higher energy dissipation capacity. Figures 6.6 through 6.7 show the corresponding cumulative energy dissipation for PreT-SF and PreT-CB. Both specimens had nearly identical cumulative energy dissipations: 1492 kip-in. for PreT-SF and 1496 kip-in. for PreT-CB at the end of the tests.

60
0 5 10 15 20 25 30 35 400
50
100
150
cycle no.
Ene
rgy
Dis
sipa
tion
[kip
*in]
Figure 6.3 Energy dissipation per cycle with cycle 23 missing.
0 5 10 15 20 25 30 35 400
50
100
150
200
Ene
rgy
Dis
sipa
tion
[Kip
-in.]
cycle no.
0 5 10 15 20 25 30 35 400
5
10
Drif
t [%
]
Energy Dissipation
Drift
Figure 6.4 Modified energy dissipation per cycle for PreT-SF.
Missed cycle
Approximated cycle

61
0 5 10 15 20 25 30 35 400
50
100
150
200
Ene
rgy
Dis
sipa
tion
[Kip
-in.]
cycle no.
0 5 10 15 20 25 30 35 400
5
10
Drif
t [%
]
Energy Dissipation
Drift
Figure 6.5 Energy dissipation per cycle for PreT-CB.
0 5 10 15 20 25 30 35 400
500
1000
1500
2000
Ene
rgy
Dis
sipa
tion
[Kip
-in.]
cycle no.
0 5 10 15 20 25 30 35 400
5
10
Drif
t [%
]
Energy Dissipation
Drift
Figure 6.6 Cumulative energy dissipation for PreT-SF.

62
0 5 10 15 20 25 30 35 400
500
1000
1500
2000
Ene
rgy
Dis
sipa
tion
[Kip
-in.]
cycle no.
0 5 10 15 20 25 30 35 400
5
10
Drif
t [%
]
Energy Dissipation
Drift
Figure 6.7 Cumulative energy dissipation for PreT-CB.
6.2.2 Comparison of Energy Dissipation with Non-Prestressed Columns The energy dissipation capacities of PreT-SF and PreT-CB were compared to SF-2 to evaluate the difference in performance of similar columns. The cumulative energy dissipation of SF-2 was approximately 3000 kip-in., which is about twice the value achieved in the PreT specimens. This was expected because the re-centering from the prestressing decreases the size of the force displacement hysteresis loops.
To compare the energy dissipation of PreT-SF, PreT-CB, and SF-2 with LB6-PT and DB5-RE, the energy dissipation was normalized because LB6-PT and DB5-RE were designed to have different overall strength. As shown in Figure 6.8, the energy dissipation was normalized by dividing the energy dissipation per cycle by the area of a rectangular box defined by Fmax, Fmin, Δmax, and Δmin. Figure 6.9 demonstrates that the responses of each specimen were similar until cycle 25 (approximately 2.5% drift ratio) and then had different responses. LB6-PT and DB5-RE began increasing in energy dissipation faster than the other columns, but ultimately SF-2 had the largest normalized energy dissipation.
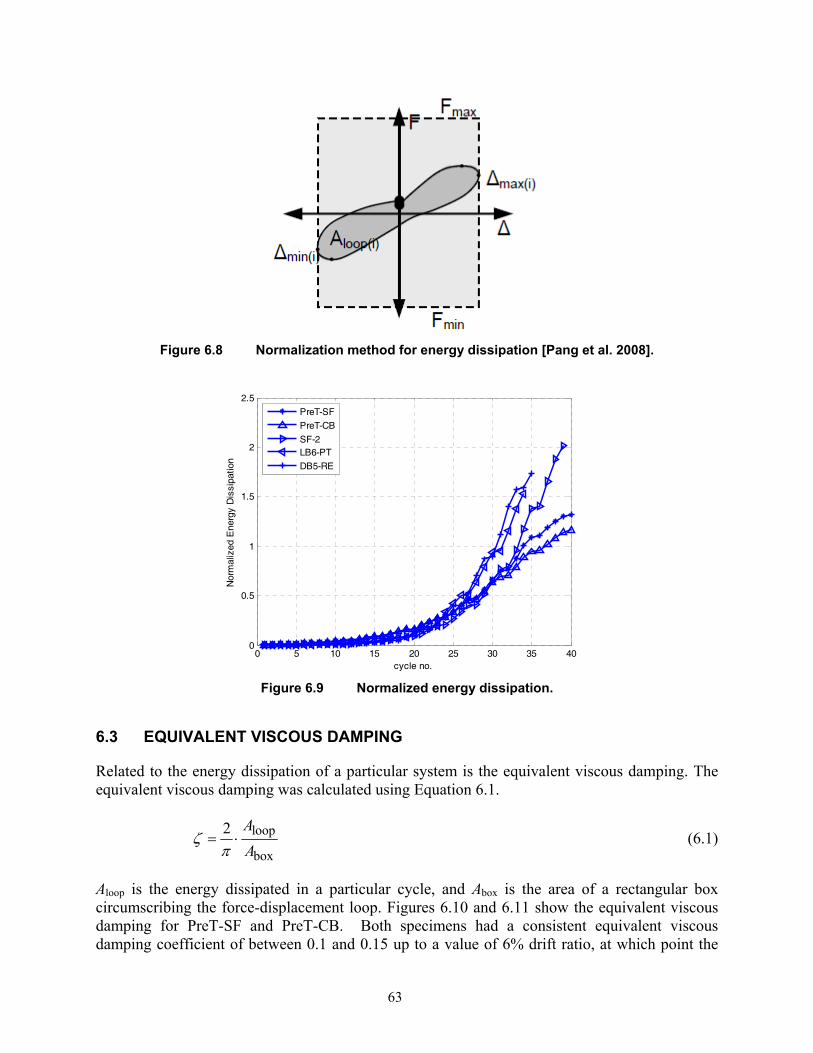
63
Figure 6.8 Normalization method for energy dissipation [Pang et al. 2008].
0 5 10 15 20 25 30 35 400
0.5
1
1.5
2
2.5
cycle no.
Nor
mal
ized
Ene
rgy
Dis
sipa
tion
PreT-SF
PreT-CB
SF-2LB6-PT
DB5-RE
Figure 6.9 Normalized energy dissipation.
6.3 EQUIVALENT VISCOUS DAMPING
Related to the energy dissipation of a particular system is the equivalent viscous damping. The equivalent viscous damping was calculated using Equation 6.1.
loop
box
2 AA
ζπ
= ⋅ (6.1)
Aloop is the energy dissipated in a particular cycle, and Abox is the area of a rectangular box circumscribing the force-displacement loop. Figures 6.10 and 6.11 show the equivalent viscous damping for PreT-SF and PreT-CB. Both specimens had a consistent equivalent viscous damping coefficient of between 0.1 and 0.15 up to a value of 6% drift ratio, at which point the
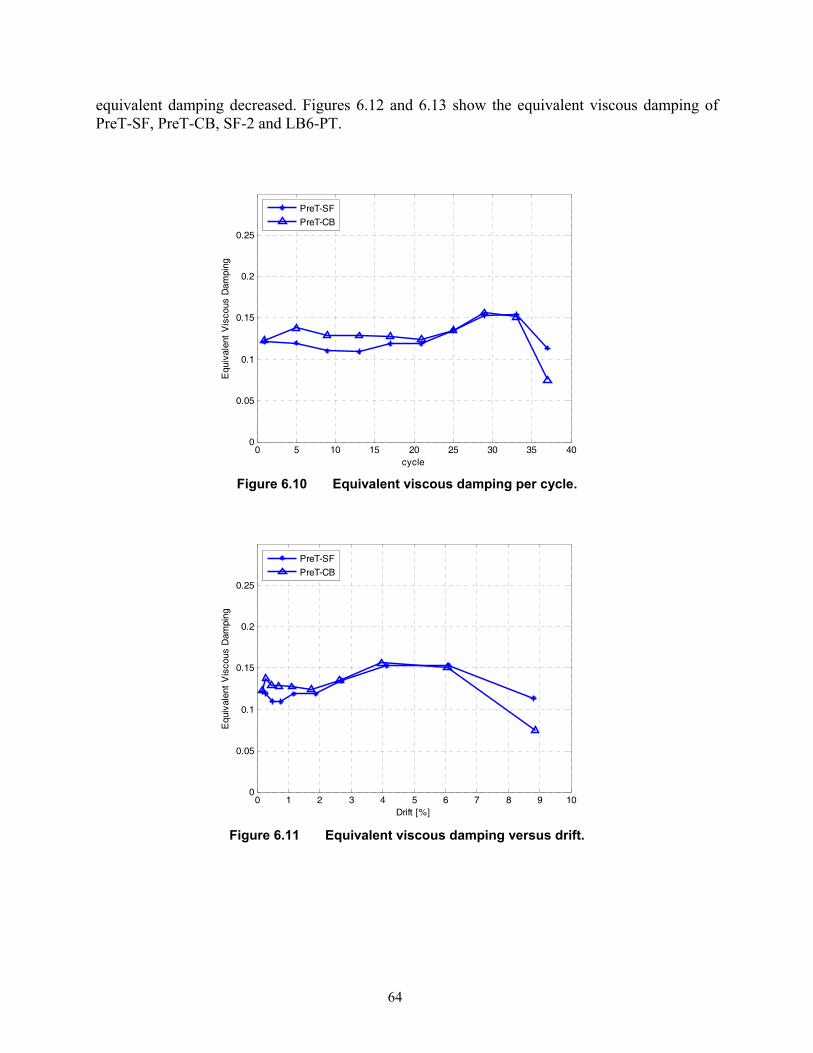
64
equivalent damping decreased. Figures 6.12 and 6.13 show the equivalent viscous damping of PreT-SF, PreT-CB, SF-2 and LB6-PT.
0 5 10 15 20 25 30 35 400
0.05
0.1
0.15
0.2
0.25
cycle
Equ
ival
ent
Vis
cous
Dam
ping
PreT-SF
PreT-CB
Figure 6.10 Equivalent viscous damping per cycle.
0 1 2 3 4 5 6 7 8 9 100
0.05
0.1
0.15
0.2
0.25
Drift [%]
Equ
ival
ent
Vis
cous
Dam
ping
PreT-SF
PreT-CB
Figure 6.11 Equivalent viscous damping versus drift.
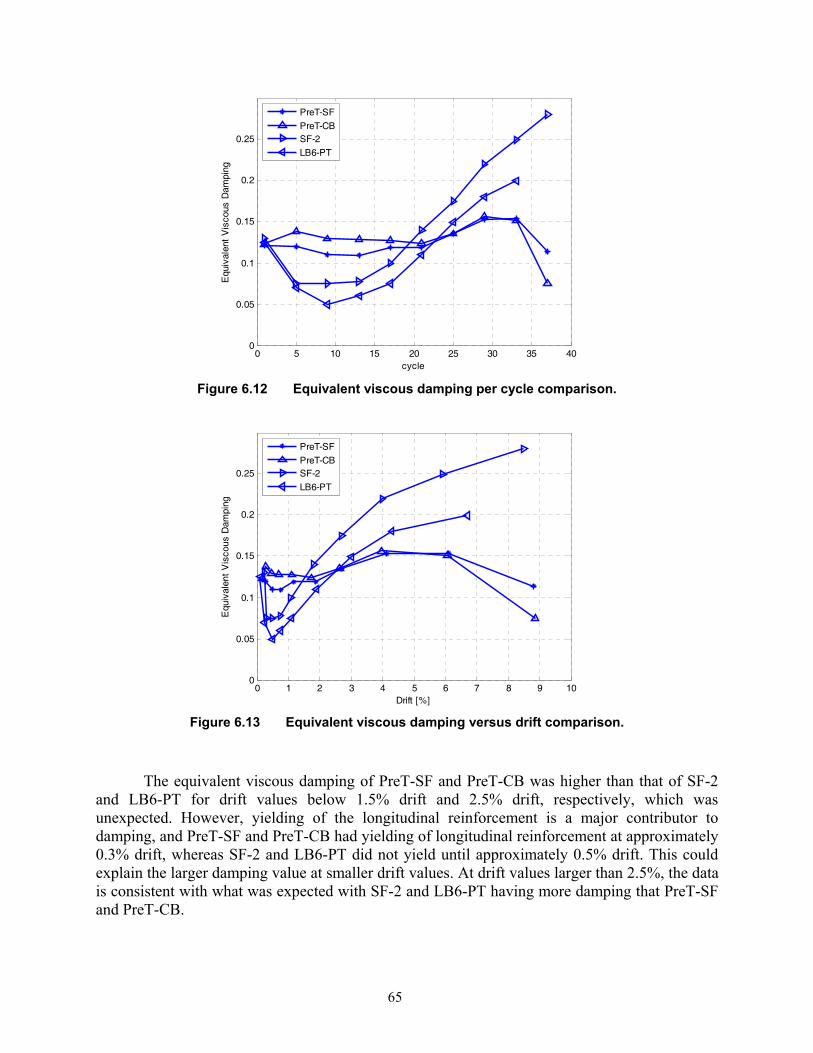
65
0 5 10 15 20 25 30 35 400
0.05
0.1
0.15
0.2
0.25
cycle
Equ
ival
ent
Vis
cous
Dam
ping
PreT-SF
PreT-CBSF-2
LB6-PT
Figure 6.12 Equivalent viscous damping per cycle comparison.
0 1 2 3 4 5 6 7 8 9 100
0.05
0.1
0.15
0.2
0.25
Drift [%]
Equ
ival
ent
Vis
cous
Dam
ping
PreT-SF
PreT-CBSF-2
LB6-PT
Figure 6.13 Equivalent viscous damping versus drift comparison.
The equivalent viscous damping of PreT-SF and PreT-CB was higher than that of SF-2 and LB6-PT for drift values below 1.5% drift and 2.5% drift, respectively, which was unexpected. However, yielding of the longitudinal reinforcement is a major contributor to damping, and PreT-SF and PreT-CB had yielding of longitudinal reinforcement at approximately 0.3% drift, whereas SF-2 and LB6-PT did not yield until approximately 0.5% drift. This could explain the larger damping value at smaller drift values. At drift values larger than 2.5%, the data is consistent with what was expected with SF-2 and LB6-PT having more damping that PreT-SF and PreT-CB.
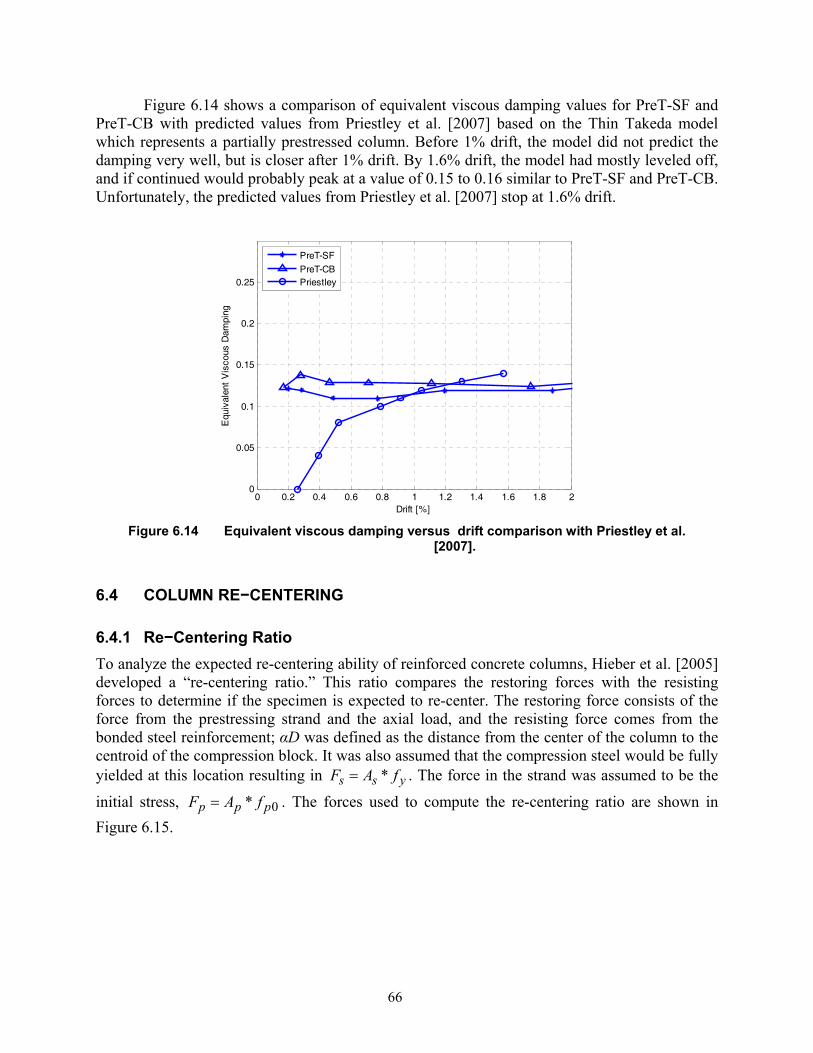
66
Figure 6.14 shows a comparison of equivalent viscous damping values for PreT-SF and PreT-CB with predicted values from Priestley et al. [2007] based on the Thin Takeda model which represents a partially prestressed column. Before 1% drift, the model did not predict the damping very well, but is closer after 1% drift. By 1.6% drift, the model had mostly leveled off, and if continued would probably peak at a value of 0.15 to 0.16 similar to PreT-SF and PreT-CB. Unfortunately, the predicted values from Priestley et al. [2007] stop at 1.6% drift.
0 0.2 0.4 0.6 0.8 1 1.2 1.4 1.6 1.8 20
0.05
0.1
0.15
0.2
0.25
Drift [%]
Equ
ival
ent
Vis
cous
Dam
ping
PreT-SF
PreT-CBPriestley
Figure 6.14 Equivalent viscous damping versus drift comparison with Priestley et al.
[2007].
6.4 COLUMN RE−CENTERING
6.4.1 Re−Centering Ratio To analyze the expected re-centering ability of reinforced concrete columns, Hieber et al. [2005] developed a “re-centering ratio.” This ratio compares the restoring forces with the resisting forces to determine if the specimen is expected to re-center. The restoring force consists of the force from the prestressing strand and the axial load, and the resisting force comes from the bonded steel reinforcement; αD was defined as the distance from the center of the column to the centroid of the compression block. It was also assumed that the compression steel would be fully yielded at this location resulting in *s s yF A f= . The force in the strand was assumed to be the
initial stress, 0*p p pF A f= . The forces used to compute the re-centering ratio are shown in Figure 6.15.
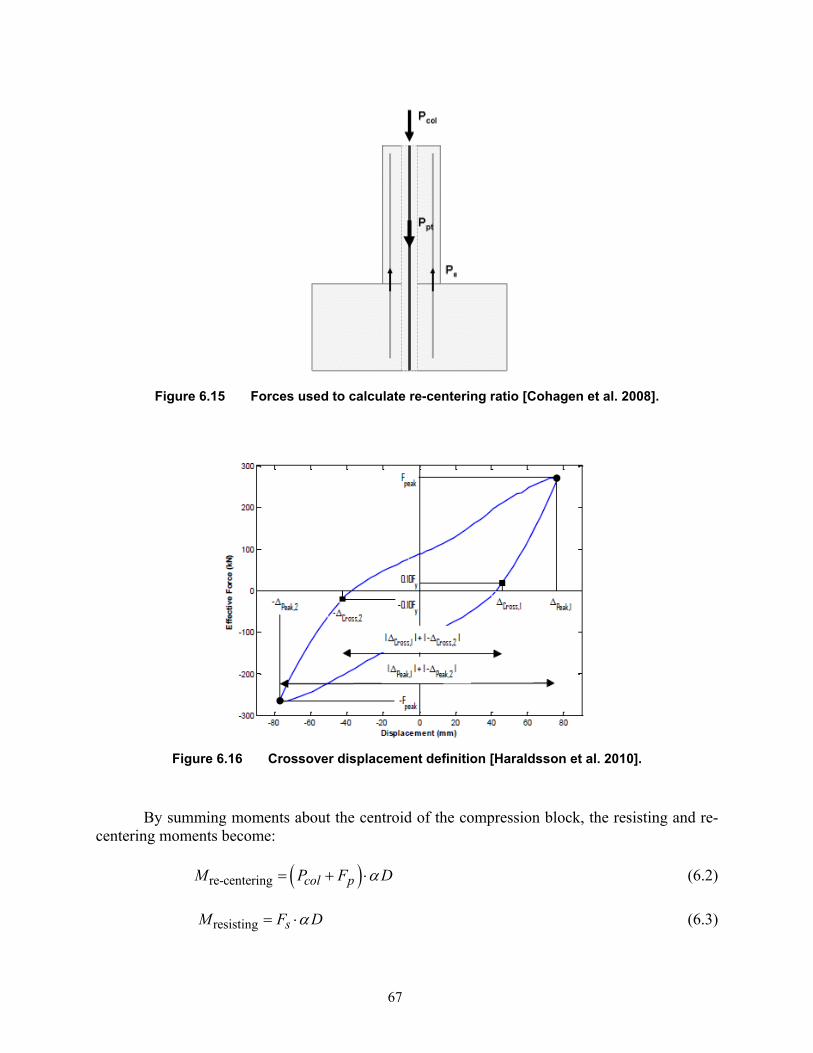
67
Figure 6.15 Forces used to calculate re-centering ratio [Cohagen et al. 2008].
Figure 6.16 Crossover displacement definition [Haraldsson et al. 2010].
By summing moments about the centroid of the compression block, the resisting and re-centering moments become:
( )re-centering col pM P F Dα= + ⋅ (6.2)
resisting sM F Dα= ⋅ (6.3)
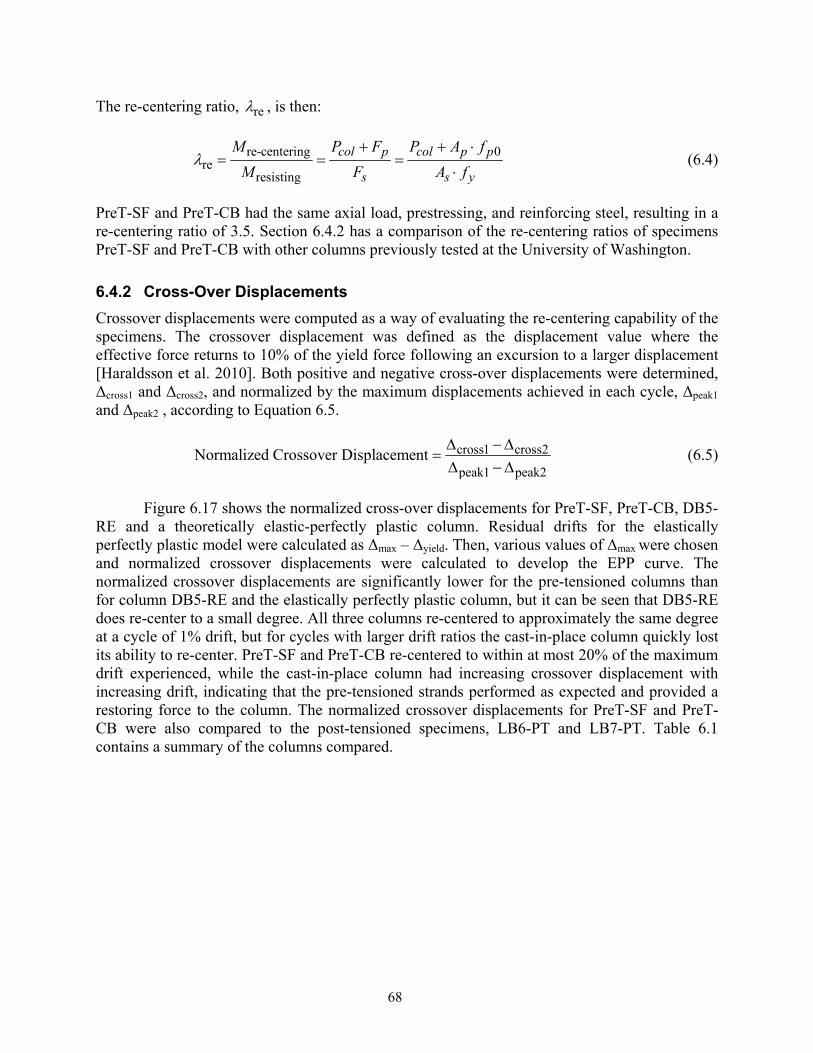
68
The re-centering ratio, reλ , is then:
re-centering 0re
resisting
col p col p p
s s y
M P F P A fM F A f
λ+ + ⋅
= = =⋅
(6.4)
PreT-SF and PreT-CB had the same axial load, prestressing, and reinforcing steel, resulting in a re-centering ratio of 3.5. Section 6.4.2 has a comparison of the re-centering ratios of specimens PreT-SF and PreT-CB with other columns previously tested at the University of Washington.
6.4.2 Cross-Over Displacements Crossover displacements were computed as a way of evaluating the re-centering capability of the specimens. The crossover displacement was defined as the displacement value where the effective force returns to 10% of the yield force following an excursion to a larger displacement [Haraldsson et al. 2010]. Both positive and negative cross-over displacements were determined, Δcross1 and Δcross2, and normalized by the maximum displacements achieved in each cycle, Δpeak1 and Δpeak2 , according to Equation 6.5.
cross1 cross2
peak1 peak2Normalized Crossover Displacement Δ −Δ
=Δ −Δ
(6.5)
Figure 6.17 shows the normalized cross-over displacements for PreT-SF, PreT-CB, DB5-RE and a theoretically elastic-perfectly plastic column. Residual drifts for the elastically perfectly plastic model were calculated as Δmax – Δyield. Then, various values of Δmax were chosen and normalized crossover displacements were calculated to develop the EPP curve. The normalized crossover displacements are significantly lower for the pre-tensioned columns than for column DB5-RE and the elastically perfectly plastic column, but it can be seen that DB5-RE does re-center to a small degree. All three columns re-centered to approximately the same degree at a cycle of 1% drift, but for cycles with larger drift ratios the cast-in-place column quickly lost its ability to re-center. PreT-SF and PreT-CB re-centered to within at most 20% of the maximum drift experienced, while the cast-in-place column had increasing crossover displacement with increasing drift, indicating that the pre-tensioned strands performed as expected and provided a restoring force to the column. The normalized crossover displacements for PreT-SF and PreT-CB were also compared to the post-tensioned specimens, LB6-PT and LB7-PT. Table 6.1 contains a summary of the columns compared.
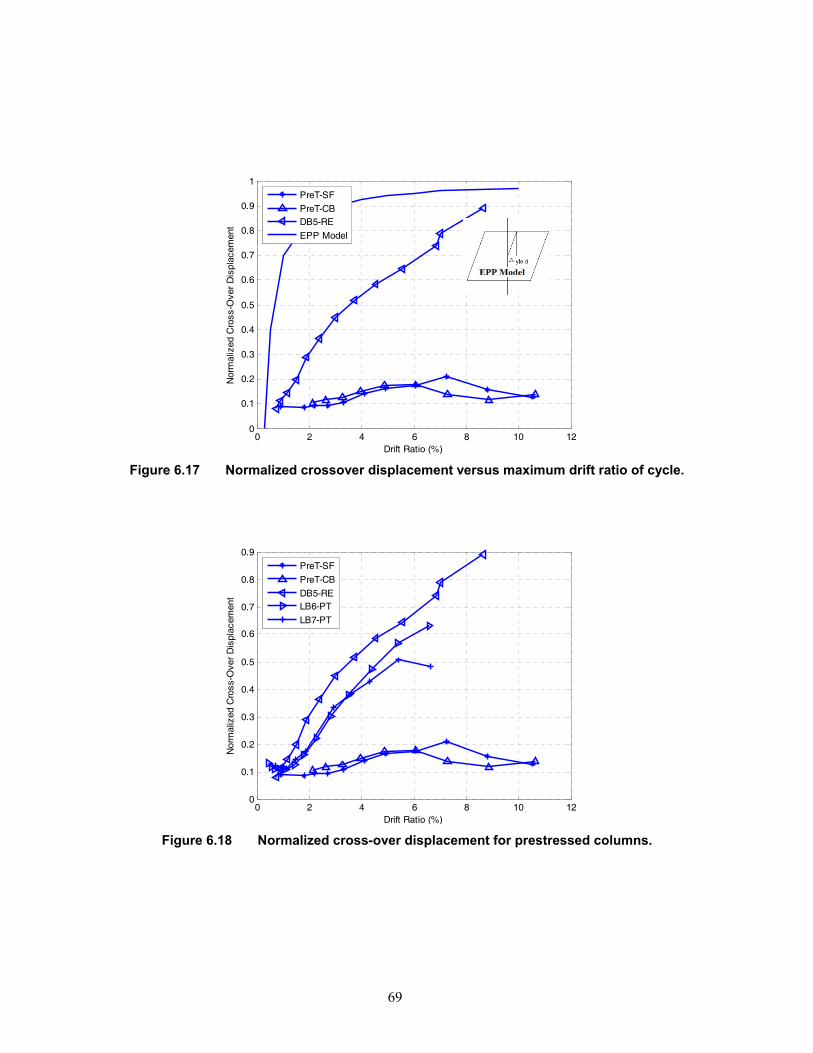
69
0 2 4 6 8 10 120
0.1
0.2
0.3
0.4
0.5
0.6
0.7
0.8
0.9
1
Drift Ratio (%)
Nor
mal
ized
Cro
ss-O
ver
Dis
plac
emen
t
PreT-SF
PreT-CBDB5-RE
EPP Model
Figure 6.17 Normalized crossover displacement versus maximum drift ratio of cycle.
0 2 4 6 8 10 120
0.1
0.2
0.3
0.4
0.5
0.6
0.7
0.8
0.9
Drift Ratio (%)
Nor
mal
ized
Cro
ss-O
ver
Dis
plac
emen
t
PreT-SF
PreT-CB
DB5-RELB6-PT
LB7-PT
Figure 6.18 Normalized cross-over displacement for prestressed columns.
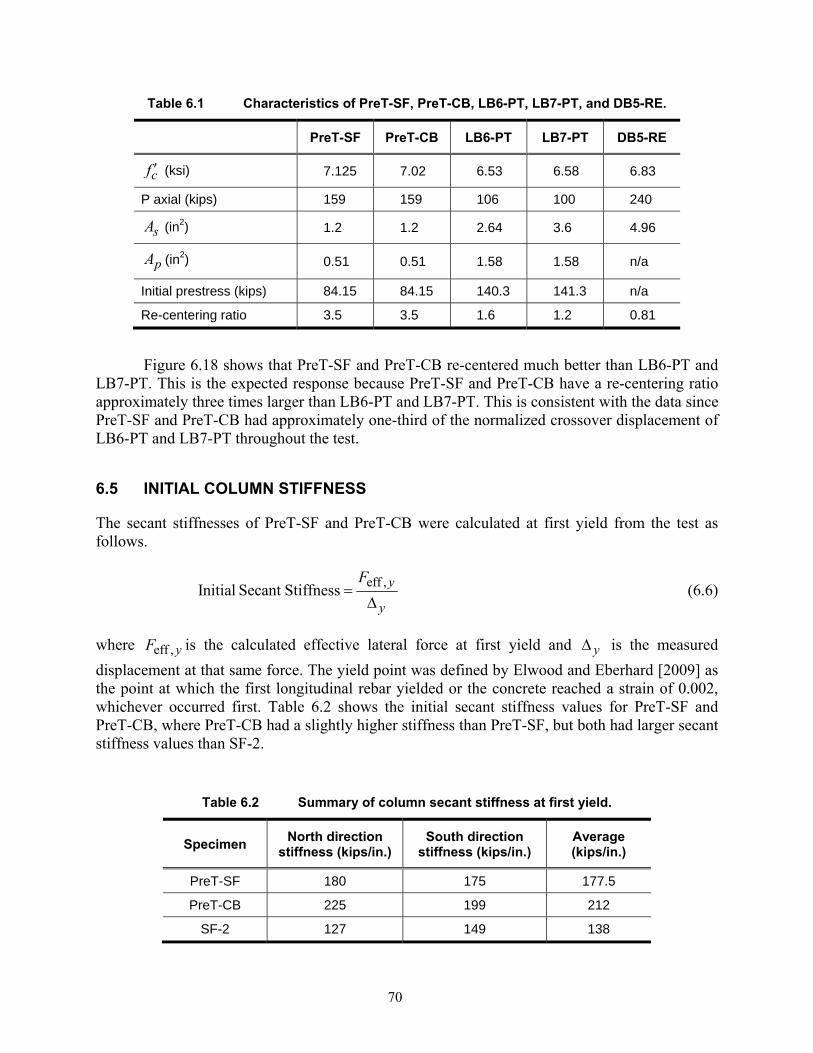
70
Table 6.1 Characteristics of PreT-SF, PreT-CB, LB6-PT, LB7-PT, and DB5-RE.
PreT-SF PreT-CB LB6-PT LB7-PT DB5-RE
cf ′ (ksi) 7.125 7.02 6.53 6.58 6.83
P axial (kips) 159 159 106 100 240
sA (in2) 1.2 1.2 2.64 3.6 4.96
pA (in2) 0.51 0.51 1.58 1.58 n/a
Initial prestress (kips) 84.15 84.15 140.3 141.3 n/a
Re-centering ratio 3.5 3.5 1.6 1.2 0.81
Figure 6.18 shows that PreT-SF and PreT-CB re-centered much better than LB6-PT and LB7-PT. This is the expected response because PreT-SF and PreT-CB have a re-centering ratio approximately three times larger than LB6-PT and LB7-PT. This is consistent with the data since PreT-SF and PreT-CB had approximately one-third of the normalized crossover displacement of LB6-PT and LB7-PT throughout the test.
6.5 INITIAL COLUMN STIFFNESS
The secant stiffnesses of PreT-SF and PreT-CB were calculated at first yield from the test as follows.
eff ,Initial Secant Stiffness y
y
F=
Δ (6.6)
where eff , yF is the calculated effective lateral force at first yield and yΔ is the measured displacement at that same force. The yield point was defined by Elwood and Eberhard [2009] as the point at which the first longitudinal rebar yielded or the concrete reached a strain of 0.002, whichever occurred first. Table 6.2 shows the initial secant stiffness values for PreT-SF and PreT-CB, where PreT-CB had a slightly higher stiffness than PreT-SF, but both had larger secant stiffness values than SF-2.
Table 6.2 Summary of column secant stiffness at first yield.
Specimen North direction stiffness (kips/in.)
South direction stiffness (kips/in.)
Average (kips/in.)
PreT-SF 180 175 177.5
PreT-CB 225 199 212
SF-2 127 149 138
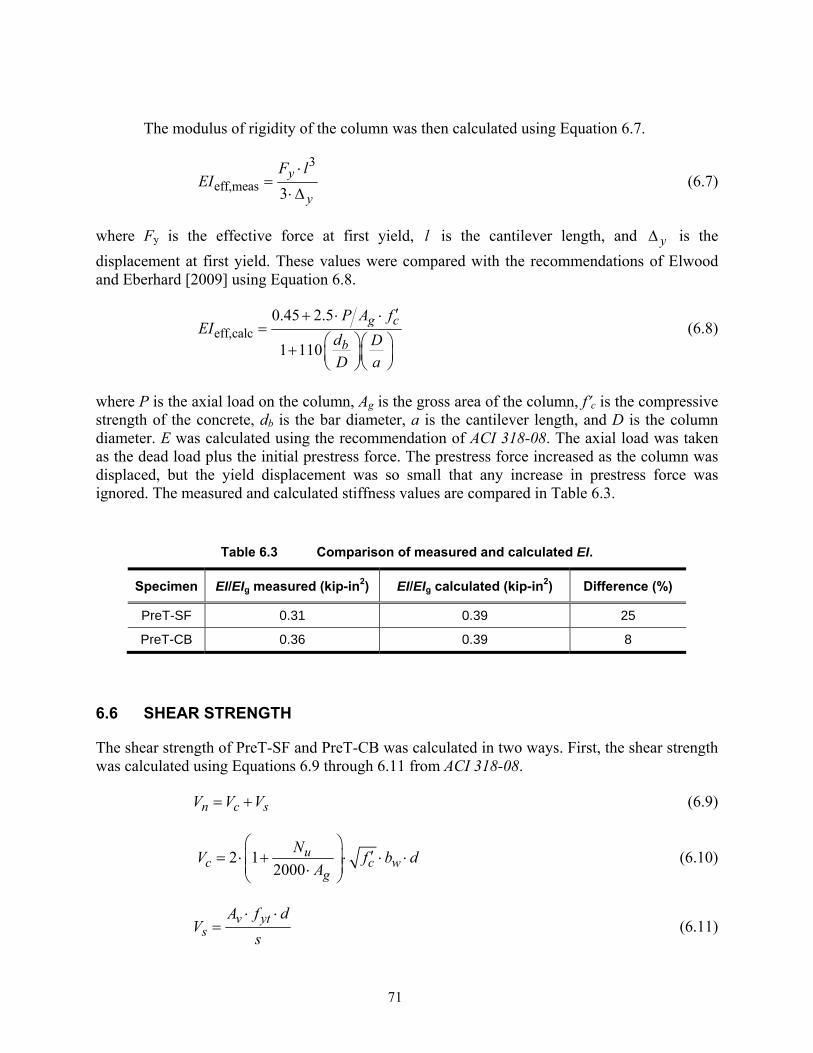
71
The modulus of rigidity of the column was then calculated using Equation 6.7.
3
eff,meas 3y
y
F lEI
⋅=
⋅Δ (6.7)
where Fy is the effective force at first yield, l is the cantilever length, and yΔ is the displacement at first yield. These values were compared with the recommendations of Elwood and Eberhard [2009] using Equation 6.8.
eff,calc0.45 2.5
1 110
g c
b
P A fEI
d DD a
′+ ⋅ ⋅=
⎛ ⎞⎛ ⎞+ ⎜ ⎟⎜ ⎟⎝ ⎠⎝ ⎠
(6.8)
where P is the axial load on the column, Ag is the gross area of the column, f′c is the compressive strength of the concrete, db is the bar diameter, a is the cantilever length, and D is the column diameter. E was calculated using the recommendation of ACI 318-08. The axial load was taken as the dead load plus the initial prestress force. The prestress force increased as the column was displaced, but the yield displacement was so small that any increase in prestress force was ignored. The measured and calculated stiffness values are compared in Table 6.3.
Table 6.3 Comparison of measured and calculated EI.
Specimen EI/EIg measured (kip-in2) EI/EIg calculated (kip-in2) Difference (%)
PreT-SF 0.31 0.39 25
PreT-CB 0.36 0.39 8
6.6 SHEAR STRENGTH
The shear strength of PreT-SF and PreT-CB was calculated in two ways. First, the shear strength was calculated using Equations 6.9 through 6.11 from ACI 318-08.
n c sV V V= + (6.9)
2 12000
uc c w
g
NV f b dA
⎛ ⎞′= ⋅ + ⋅ ⋅ ⋅⎜ ⎟⎜ ⎟⋅⎝ ⎠
(6.10)
v yts
A f dV
s⋅ ⋅
= (6.11)

72
where Vn is the nominal shear strength, Vc is the concrete contribution, Vs is the spiral contribution, Nu is the axial load, Ag is the gross area of the column, f′c is the compressive strength, bw is the column diameter, d is the depth from the extreme compression face to the centroid of the tension steel, Av is the area of the spiral, fyt is the yield strength of the spiral, and s is the spiral spacing. Nu was taken as the sum of the applied load and the force from the strand. As for the damage progression models, Vc was calculated in two ways: first using the applied load plus the initial prestress force and second using the applied load and the yielded prestress force, which produced shear strengths of 199.7 kips and 202.1 kips, respectively.
The second method was taken from Priestley et al. [1994] and used Equations 6.12 through 6.15.
n c p sV V V V= + + (6.12)
c c cV k f A′= ⋅ ⋅ (6.13)
2pD cV P
a−
= ⋅ (6.14)
cot 302
sh yhs
A f DV
sπ ′⋅ ⋅
= ⋅ ⋅ o (6.15)
where Vp is the axial load component, k varies depending on the displacement ductility of the member, Ac is taken as 0.8Ag, D is the diameter, c is the depth of the compression zone, a is the length of the cantilever, P is the axial load, Ash is the area of the spiral, fyh is the yield strength of the spiral, and D′ is the center to center diameter of the spiral.
The shear strength was calculated with the two different axial loads as before and with the maximum and minimum k value to get the maximum and minimum shear strength. The shear strength was calculated to be between 473 kips and 528 kips. The methods produce two very different shear strengths, but both are above the maximum shear of 51.4 kips that was placed on the column. Consistent with these calculations, shear failure was not observed in either of these columns.
6.7 FLEXURAL STRENGTH
The moment strength of the column was approximated using moment curvature analysis in OpenSees. The program used a zero length element to model the column. Even though the column was octagonal, a circular fiber section was defined to model the cross section to simplify the model. Three materials were defined to model the concrete and reinforcing steel: unconfined concrete, confined concrete, and reinforcing bars. The unconfined and confined concrete was modeled using the concrete04 material with f′c taken as the test day compressive strength and Ec taken as 57,000* cf ′ . The reinforcing bars were modeled using the steel02 material based on the Menegotto Pinto model, with fy taken as 68.4 ksi and E taken as 29,000 ksi. Since the strands were unbonded, the strain was distributed throughout the entire unbonded length making it
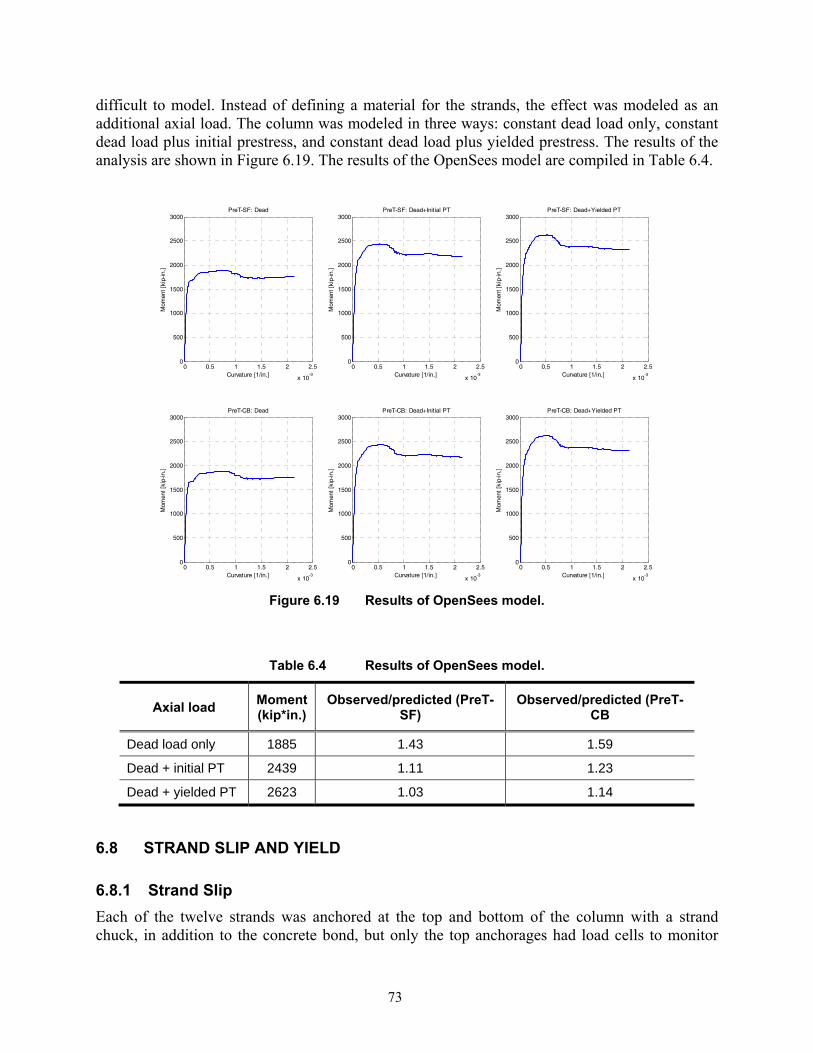
73
difficult to model. Instead of defining a material for the strands, the effect was modeled as an additional axial load. The column was modeled in three ways: constant dead load only, constant dead load plus initial prestress, and constant dead load plus yielded prestress. The results of the analysis are shown in Figure 6.19. The results of the OpenSees model are compiled in Table 6.4.
0 0.5 1 1.5 2 2.5
x 10-3
0
500
1000
1500
2000
2500
3000
Mom
ent
[kip
-in.]
Curvature [1/in.]
PreT-SF: Dead+Initial PT
0 0.5 1 1.5 2 2.5
x 10-3
0
500
1000
1500
2000
2500
3000
Mom
ent
[kip
-in.]
Curvature [1/in.]
PreT-CB: Dead+Initial PT
0 0.5 1 1.5 2 2.5
x 10-3
0
500
1000
1500
2000
2500
3000
Mom
ent
[kip
-in.]
Curvature [1/in.]
PreT-SF: Dead
0 0.5 1 1.5 2 2.5
x 10-3
0
500
1000
1500
2000
2500
3000
Mom
ent
[kip
-in.]
Curvature [1/in.]
PreT-CB: Dead
0 0.5 1 1.5 2 2.5
x 10-3
0
500
1000
1500
2000
2500
3000
Mom
ent
[kip
-in.]
Curvature [1/in.]
PreT-SF: Dead+Yielded PT
0 0.5 1 1.5 2 2.5
x 10-3
0
500
1000
1500
2000
2500
3000
Mom
ent
[kip
-in.]
Curvature [1/in.]
PreT-CB: Dead+Yielded PT
Figure 6.19 Results of OpenSees model.
Table 6.4 Results of OpenSees model.
Axial load Moment (kip*in.)
Observed/predicted (PreT-SF)
Observed/predicted (PreT-CB
Dead load only 1885 1.43 1.59
Dead + initial PT 2439 1.11 1.23
Dead + yielded PT 2623 1.03 1.14
6.8 STRAND SLIP AND YIELD
6.8.1 Strand Slip Each of the twelve strands was anchored at the top and bottom of the column with a strand chuck, in addition to the concrete bond, but only the top anchorages had load cells to monitor

74
potential strand slip. Of these twelve load cells, only one load cell (in PreT-CB) registered any load (maximum of 4.1 kips). It is possible that strand slip occurred at the unmonitored bottom anchorages, but would be unlikely, because the anchorage length was 31.5 in. at the bottom compared with 18 in. at the top.
In addition, in the strand pullout tests (Appendix D, summarized in Figure D.18) with a bonded length of 18 in., the epoxy coated strand was fully developed for five out of six tests, with some slip measured in the sixth test. Therefore, the fact that one of the 18-in. bonded strands in PreT-CB slipped is not completely unexpected. Additionally, from the results of the pullout tests, it is unlikely that any slip occurred in the anchored portions of strand without load cells, because they all had more than 18 in. of bonded length.
6.8.2 Strand Yield
No gauges were attached to the unbonded portions of the strand, so yield could not be measured directly. Instead, strand yield could only be approximated by calculating the elongation according to Equation 6.16.
1 1 2 2
1 2Elongation e e
e eΔ ⋅ + Δ ⋅
=+
(6.16)
where Δ1 and Δ2 are the measurements from the linear potentiometers on the north and south curvature rods, and e1 and e2 are the distances from the center of the column to the linear potentiometer. The elongation versus drift ratio is shown in Figure 6.20. Since the gauges on the curvature rods for PreT-CB were not working properly, the data is only shown for PreT-SF. Based on the initial strand stress and a yield stress of 240 ksi, the strands should have begun yielding at an elongation of approximately 0.15 in. which occurred at approximately 4% drift. From this approximation it is clear that the strands yielded during testing.
-6 -4 -2 0 2 4 6
-0.05
0
0.05
0.1
0.15
0.2
Drift (%)
Elo
ngat
ion
(in.)
Figure 6.20 Elongation versus drift for PreT-SF.
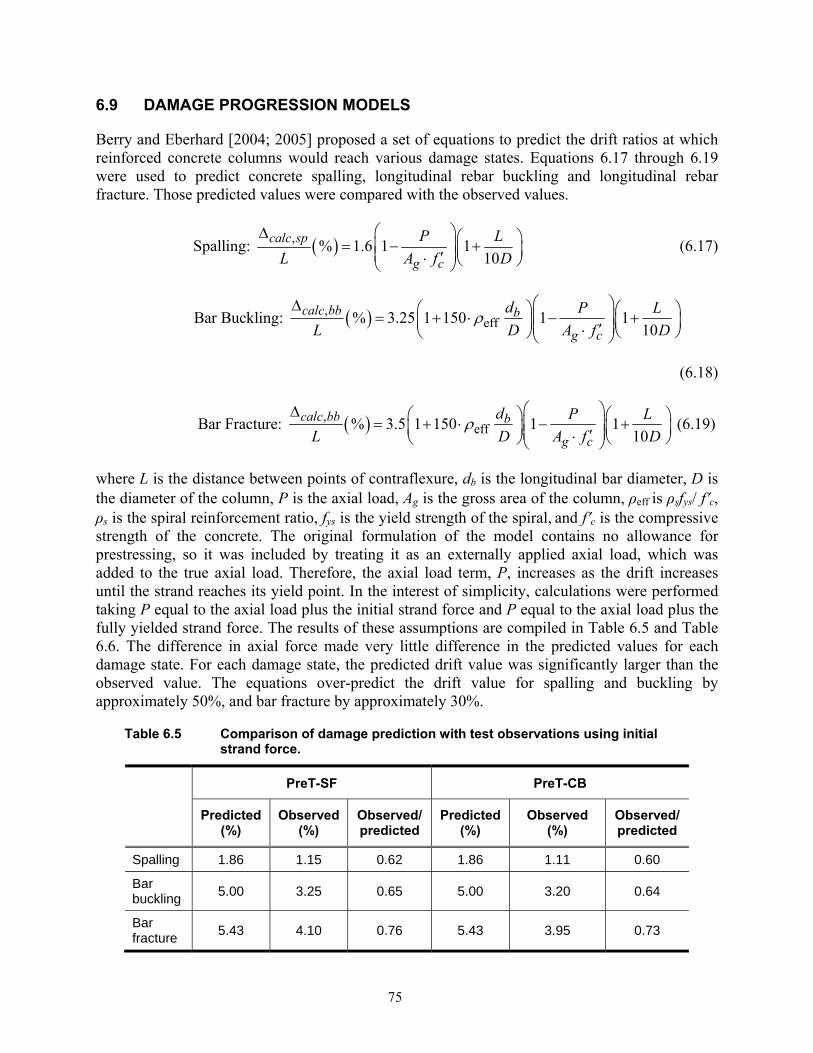
75
6.9 DAMAGE PROGRESSION MODELS
Berry and Eberhard [2004; 2005] proposed a set of equations to predict the drift ratios at which reinforced concrete columns would reach various damage states. Equations 6.17 through 6.19 were used to predict concrete spalling, longitudinal rebar buckling and longitudinal rebar fracture. Those predicted values were compared with the observed values.
( ),Spalling: % 1.6 1 110
calc sp
g c
P LL A f D
⎛ ⎞Δ ⎛ ⎞= − +⎜ ⎟⎜ ⎟⎜ ⎟′⋅ ⎝ ⎠⎝ ⎠ (6.17)
( ),effBar Buckling: % 3.25 1 150 1 1
10calc bb b
g c
d P LL D A f D
ρ⎛ ⎞Δ ⎛ ⎞ ⎛ ⎞= + ⋅ − +⎜ ⎟⎜ ⎟⎜ ⎟⎜ ⎟′⋅ ⎝ ⎠⎝ ⎠⎝ ⎠
(6.18)
( ),effBar Fracture: % 3.5 1 150 1 1
10calc bb b
g c
d P LL D A f D
ρ⎛ ⎞Δ ⎛ ⎞ ⎛ ⎞= + ⋅ − +⎜ ⎟⎜ ⎟⎜ ⎟⎜ ⎟′⋅ ⎝ ⎠⎝ ⎠⎝ ⎠
(6.19)
where L is the distance between points of contraflexure, db is the longitudinal bar diameter, D is the diameter of the column, P is the axial load, Ag is the gross area of the column, ρeff is ρsfys/ f′c, ρs is the spiral reinforcement ratio, fys is the yield strength of the spiral, and f′c is the compressive strength of the concrete. The original formulation of the model contains no allowance for prestressing, so it was included by treating it as an externally applied axial load, which was added to the true axial load. Therefore, the axial load term, P, increases as the drift increases until the strand reaches its yield point. In the interest of simplicity, calculations were performed taking P equal to the axial load plus the initial strand force and P equal to the axial load plus the fully yielded strand force. The results of these assumptions are compiled in Table 6.5 and Table 6.6. The difference in axial force made very little difference in the predicted values for each damage state. For each damage state, the predicted drift value was significantly larger than the observed value. The equations over-predict the drift value for spalling and buckling by approximately 50%, and bar fracture by approximately 30%.
Table 6.5 Comparison of damage prediction with test observations using initial strand force.
PreT-SF PreT-CB
Predicted (%)
Observed (%)
Observed/predicted
Predicted (%)
Observed (%)
Observed/predicted
Spalling 1.86 1.15 0.62 1.86 1.11 0.60
Bar buckling 5.00 3.25 0.65 5.00 3.20 0.64
Bar fracture 5.43 4.10 0.76 5.43 3.95 0.73
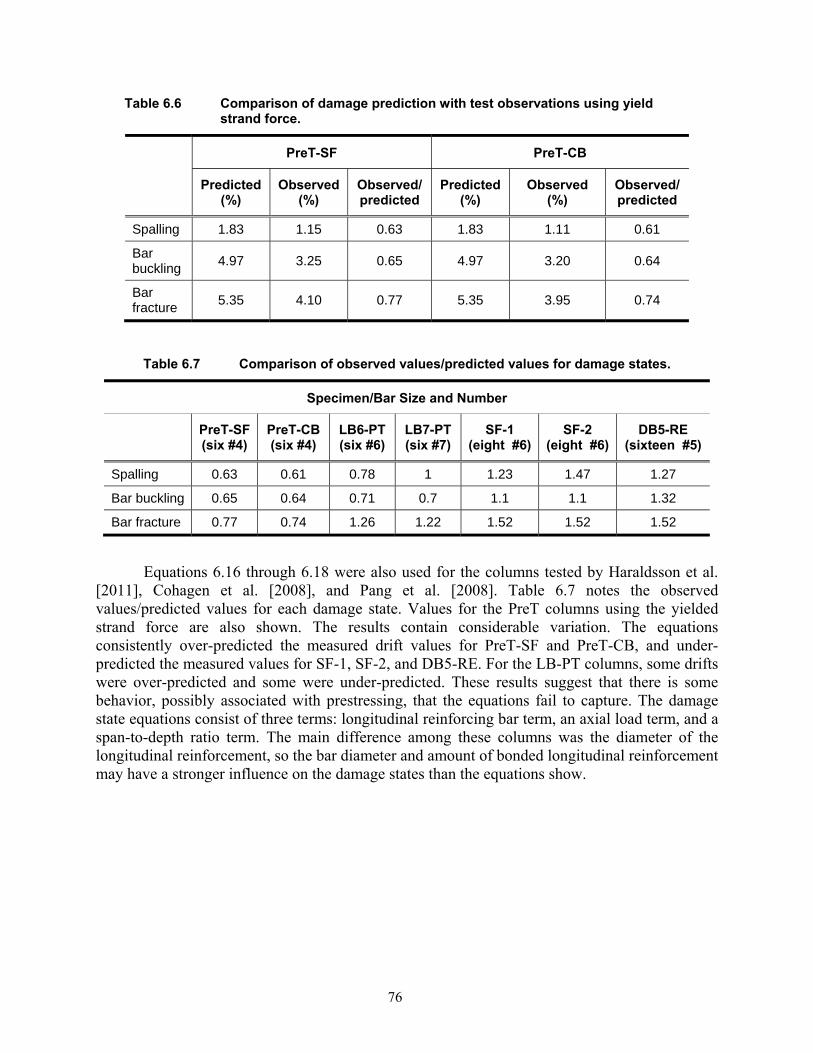
76
Table 6.6 Comparison of damage prediction with test observations using yield strand force.
PreT-SF PreT-CB
Predicted (%)
Observed (%)
Observed/predicted
Predicted (%)
Observed (%)
Observed/predicted
Spalling 1.83 1.15 0.63 1.83 1.11 0.61
Bar buckling 4.97 3.25 0.65 4.97 3.20 0.64
Bar fracture 5.35 4.10 0.77 5.35 3.95 0.74
Table 6.7 Comparison of observed values/predicted values for damage states.
Specimen/Bar Size and Number
PreT-SF (six #4)
PreT-CB (six #4)
LB6-PT (six #6)
LB7-PT (six #7)
SF-1 (eight #6)
SF-2 (eight #6)
DB5-RE (sixteen #5)
Spalling 0.63 0.61 0.78 1 1.23 1.47 1.27
Bar buckling 0.65 0.64 0.71 0.7 1.1 1.1 1.32
Bar fracture 0.77 0.74 1.26 1.22 1.52 1.52 1.52
Equations 6.16 through 6.18 were also used for the columns tested by Haraldsson et al. [2011], Cohagen et al. [2008], and Pang et al. [2008]. Table 6.7 notes the observed values/predicted values for each damage state. Values for the PreT columns using the yielded strand force are also shown. The results contain considerable variation. The equations consistently over-predicted the measured drift values for PreT-SF and PreT-CB, and under-predicted the measured values for SF-1, SF-2, and DB5-RE. For the LB-PT columns, some drifts were over-predicted and some were under-predicted. These results suggest that there is some behavior, possibly associated with prestressing, that the equations fail to capture. The damage state equations consist of three terms: longitudinal reinforcing bar term, an axial load term, and a span-to-depth ratio term. The main difference among these columns was the diameter of the longitudinal reinforcement, so the bar diameter and amount of bonded longitudinal reinforcement may have a stronger influence on the damage states than the equations show.
77
7 Summary and Conclusions
7.1 SUMMARY
Two cantilever concrete subassemblies that included unbonded prestressed reinforcement were tested under constant axial load and cyclic lateral loading. The test specimens represented the top and bottom connections for a new bridge column concept that is intended to re-center the bridge after an earthquake. Previous researchers have used post-tensioning for that purpose, but post-tensioning has significant drawbacks in terms of construction speed and quality control. The new system uses precast columns with pre-tensioned strands that are bonded at the ends and unbonded over the central portion of the column.
The external configuration of the columns and the details of the connections drew on previous work at the University of Washington on precast concrete columns [Pang et al. 2008, Haraldsson et al. 2011]. Each cantilever column represented one half of a prototype column, which was assumed to be fully fixed against rotation at the top and bottom.
The column-to-spread footing connection (PreT-SF) was a socket system in which a spread footing is cast in place around a previously erected precast column. The spread footing socket connection used the same overall geometry as Haraldsson’s [2011] specimen SF-2, but had two main differences: (1) PreT-SF was reinforced with a combination of bonded deformed bars and unbonded pre-tensioned strands; and (2) the PreT-SF specimen had an octagonal cross section whereas SF-2 was circular.
The column connection to the precast cap beam (PreT-CB) was made with longitudinal bars grouted into ducts. In the top connection, both strands and bars were anchored into the cap beam. A socket connection like the one at the footing was not possible because it would require too large an opening in the cap beam. Thus, the strands were placed in the central core of the column and a reduced diameter section was created at the top of the column to anchor the strands. This core was grouted into an opening in the cap beam and provided a shoulder on the column on which the precast cap beam could rest during construction. The deformed bars were placed around the perimeter of the column and projected out of the shoulder. The bars were grouted into ducts in the cap beam using the same procedure as that used by Pang et al. [2008].
Both pre-tensioned columns had the same reinforcing layout, which consisted of six #4 rebar and six 3/8-in. diameter epoxy-coated strands. The strand was unbonded for 54 in. to minimize the strain increase in the strand and delay yielding. The resulting elastic behavior provided a restoring force to the columns. The responses of PreT-SF and PreT-CB were compared with similar columns to evaluate the effects of the unbonded pre-tensioned strands.
78
7.2 CONCLUSIONS
The following conclusions were drawn from the study.
1. The response of both specimens was controlled by the column properties. Essentially no damage occurred in the connection region. Therefore the two specimens had nearly identical force-displacement responses and damage progressions.
2. The loading curves for the specimens were similar to those of previously tested specimens that had the same design strength but contained only deformed bar reinforcement. The measured column stiffnesses at first yield were similar to those calculated based on a procedure developed for conventional reinforced concrete columns.
3. The unloading curves showed that the pre-tensioned specimens would be likely to re-center better, and have lower residual drifts than the previously tested RC specimens without pre-tensioning. Both pre-tensioned columns returned to within approximately 1% of vertical after being displaced laterally to a drift ratio of 10%.
4. The pre-tensioned specimens dissipated less energy per cycle than did the previously tested RC specimens. At a drift ratio of 4%, the equivalent viscous damping values were approximately 15% and 22%, respectively.
5. The pre-tensioned specimens suffered spalling and bar buckling at lower drift ratios than did the previously tested RC specimens and at lower drift ratios than predicted for conventional RC columns. This difference was also observed for previously tested post-tensioned specimens of comparable size and strength. It is possible that these differences were attributable to differences in the size of longitudinal bars. However, despite their earlier onset of damage, the pre-tensioned specimens still maintained 80% of their lateral strength to a drift ratio of approximately 5%.
6. The presence of prestressing in the columns did not affect the constructability of the connections. The socket connection has essentially infinite capacity for adjustment and is easy to construct. The cap beam connection requires bars to be aligned with ducts at the same time that the projecting core of the column is fitted into its matching opening in the cap beam. The precasting, and absence of post-tensioning on site, means that the system is suitable for rapid construction techniques.
7.3 RECOMMENDATIONS
7.3.1 Recommendations for Practice The socket connection is simple to construct, but the cap beam connection can create some difficulty if the ducts are too small. The difficulty in construction of PreT-CB came from the size of ducts used in the cap beam. Specifically, #4 column bars were fitted into 1.25-in. diameter ducts in the cap beam which left little room for error during construction. Steuck et al. [2007] found that much larger ducts could be used for this connection. Larger ducts should be used to simplify the construction process.
79
7.3.2 Recommendations for Future Research Additional research is needed to develop a method of delaying the onset of bar buckling and fracture in similar columns. The pre-tensioned columns had the appropriate moment capacity but the strength degraded quickly, and bar buckling and fracture occurred shortly after the maximum moment was reached. Delaying bar buckling and fracture would increase the ductility of the columns.
One possibility for improving the columns is the use of fiber reinforced concrete. Fiber reinforced concrete has a much greater tensile capacity than standard concrete and can delay spalling in the column. The delay in concrete spalling might in turn delay bar buckling, and in turn bar fracture.

80
81
REFERENCES
AASHTO (2009). AASHTO Guide Specification for LRFD Seismic Bridge Design, Washington D.C. American Concrete Institute (2008). Building Code Requirements for Structural Concrete and Commentary, ACI
318−08, Farming Hills, MI. Berry, M.P., Eberhard, M.O. (2004). PEER Structural Performance Database User’s Manual Pacific Earthquake
Engineering Research Center, University of California, Berkeley, CA, www.ce.washington.edu/peeral. Berry, M.P., Eberhard, M.O. (2005). Practical performance model for bar buckling, ASCE, J. Struct.
Engrg.,131(7):1060−1070. Brown, W. (2008). Bar buckling in reinforced concrete bridge columns, Master’s Thesis, Dept. of Civil and
Environmental Engineering, University of Washington, Seattle, WA. Building Seismic Safety Council (2004) NEHRP Recommended Provisions for Seismic Regulations and for New
Buildings and Other Structures (FEMA 450), Washington, D.C. Caltrans (2006). Seismic Design Criteria Version 1.4, Sacramento, CA. Cohagen, L.S., Pang, J.B.K., Eberhard, M.O., Stanton, J.F. (2008). A precast concrete bridge bent designed to re-
center after an earthquake, Report No. WA-RD 684.3, Washington State Transportation Center (TRAC), Seattle, WA.
Elwood, K., Eberhard, M.O. (2009). Effective stiffness of reinforced concrete columns, ACI Struct. Journal, 106(4):476−484.
Haraldsson, O., Stanton, J., Eberhard, M.O. (2011). Laboratory Tests of Column-to-Footing: Socket Connection (Draft Report). Washington State Department of Transportation.
Logan, D.R. (1997). Acceptance criteria for bond 1uality of strand for pretensioned prestressed concrete applications, PCI Journal, 42(2):52−90.
Matsumoto, E. (2009). Emulative precast bent cap connections for seismic regions: component test report–cap pocket full ductility specimen (unit 3), Report No. ECS-CSUS-2009-03, California State University, Sacramento, Sacramento, CA.
Pang, J., Steuck., Cohagen, L., Eberhard, M.O., Stanton, J. (2008). Rapidly constructible large-bar precast bridge-bent seismic connection, Report No. WA-RD 684.2, Washington State Transportation Center (TRAC), Seattle, WA.
Priestley, M.J.N., Verma, R., Xiao, Y. (1994). Seismic shear strength of reinforced concrete columns, ASCE, J. Struct. Engrg.,120(8):2310−2329.
Priestley, M.J.N., Calvi, G.M., Kowalski, M.J., (2007). Displacement-Based Seismic Design of Structures, IUSS Press, Pavia, 721 pgs.
Restrepo, J., Matsumoto, E., Tobolski, M. (2010). Development of precast bent cap systems for seismic regions (Draft Final Report), Report No. NCHRP 12−74, National Cooperative Highway Research Program.
Stanton, J., Stone, W.C., Cheok, G.S. (1997). Hybrid reinforced precast frame for seismic regions, PCI Journal, 42(2):20−32.
Steuck, K., Pang, J., Stanton, J., Eberhard, M.O. (2007). Anchorage of large bars in grouted ducts, Report WA-RD 684.1, Washington State Transportation Center (TRAC), Seattle, WA.
Weinert, Michael. (2011). Substructure Connections for accelerated bridge construction in seismic regions. M.S. Thesis. University of Washington: USA
Washington State Department of Transportation (WSDOT) (2008). Bridge Design Manual (BDM), M23− 50..

82

83
Appendix A: Materials
CONCRETE STRENGTHS
The columns were constructed by Concrete Technology Corporation in Tacoma, Washington. Cylinders were delivered to the University of Washington with the columns, but only enough to report the test day strength of the columns. The test day strength of each column is summarized in Table A.1 as the average strength from two cylinders.
Table A.1 Column cylinder strengths.
Strength (psi) DaysPreT‐SF 7125 188
PreT‐CB 7020 231
ColumnSpecimen
Cylinders for the concrete in the footing and cap beam were prepared when the specimens were cast at the University of Washington and tested at 7, 14, 28 days, and on test day. The results are summarized in Table A.2 as the average from two cylinders.
Table A.2 Footing/Cap Beam strengths.
Footing Cap Beam7 5583 433414 5948 5765
28 6922 6325test day 8768 7835
Strength (psi)Days
GROUT STRENGTH
Target 1118 unsanded silica fume grout was used for the connection between the column and cap beam for PreT-SF. 2-in. by 2-in. grout cubes were made for testing and the results are shown in Table A.3. Three cubes were tested on each day and the table contains the average.
Table A.3 Grout strengths.
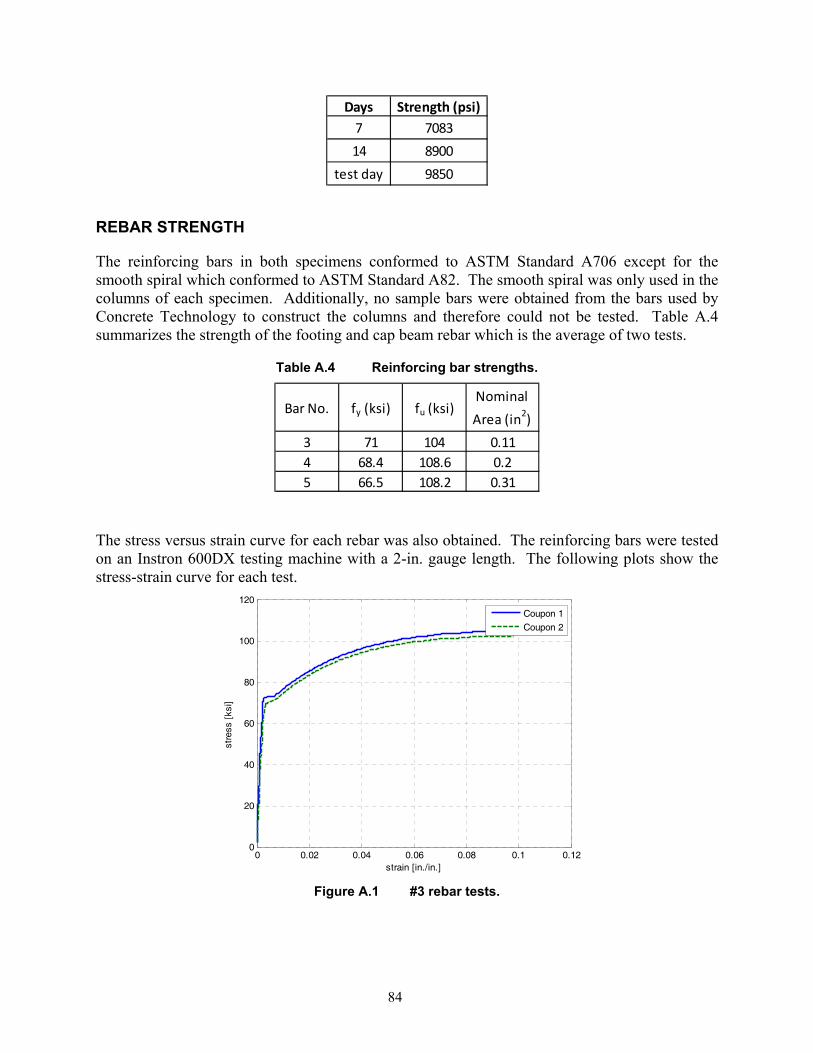
84
Days Strength (psi)7 708314 8900
test day 9850
REBAR STRENGTH
The reinforcing bars in both specimens conformed to ASTM Standard A706 except for the smooth spiral which conformed to ASTM Standard A82. The smooth spiral was only used in the columns of each specimen. Additionally, no sample bars were obtained from the bars used by Concrete Technology to construct the columns and therefore could not be tested. Table A.4 summarizes the strength of the footing and cap beam rebar which is the average of two tests.
Table A.4 Reinforcing bar strengths.
Bar No. fy (ksi) fu (ksi)Nominal Area (in2)
3 71 104 0.114 68.4 108.6 0.25 66.5 108.2 0.31
The stress versus strain curve for each rebar was also obtained. The reinforcing bars were tested on an Instron 600DX testing machine with a 2-in. gauge length. The following plots show the stress-strain curve for each test.
0 0.02 0.04 0.06 0.08 0.1 0.120
20
40
60
80
100
120
strain [in./in.]
stre
ss [
ksi]
Coupon 1
Coupon 2
Figure A.1 #3 rebar tests.
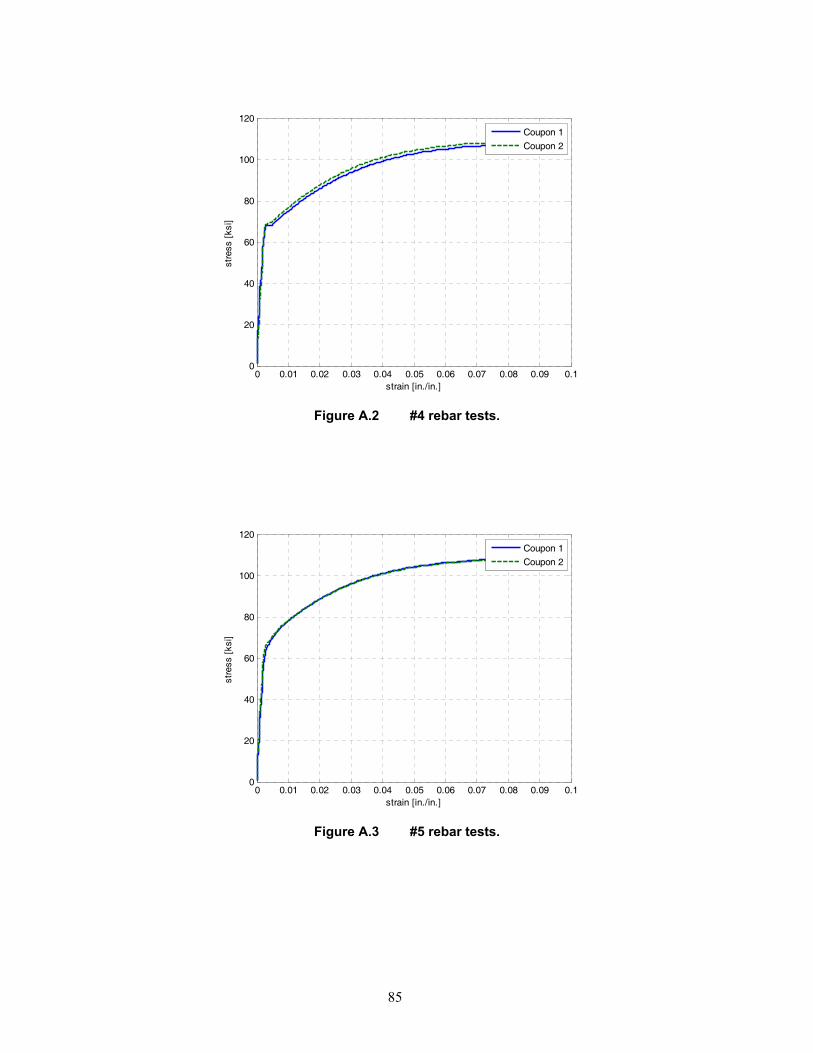
85
0 0.01 0.02 0.03 0.04 0.05 0.06 0.07 0.08 0.09 0.10
20
40
60
80
100
120
strain [in./in.]
stre
ss [
ksi]
Coupon 1
Coupon 2
Figure A.2 #4 rebar tests.
0 0.01 0.02 0.03 0.04 0.05 0.06 0.07 0.08 0.09 0.10
20
40
60
80
100
120
strain [in./in.]
stre
ss [
ksi]
Coupon 1
Coupon 2
Figure A.3 #5 rebar tests.

86
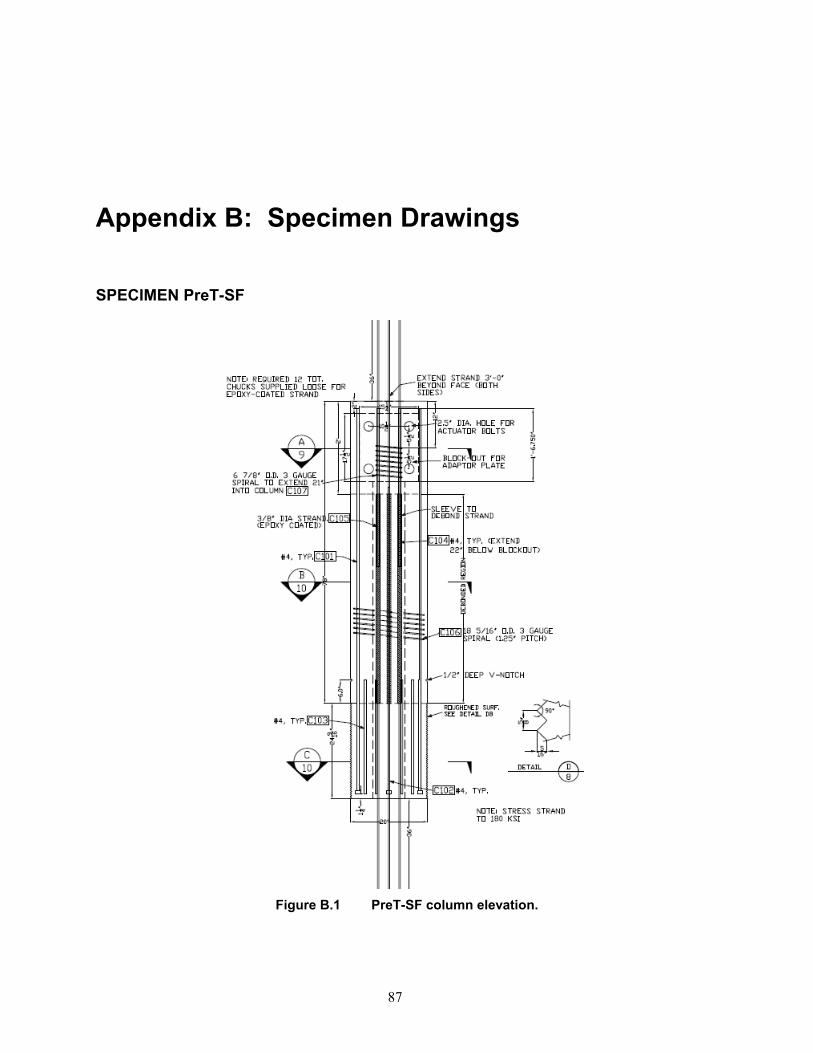
87
Appendix B: Specimen Drawings
SPECIMEN PreT-SF
Figure B.1 PreT-SF column elevation.

88
Figure B.2 PreT-SF column cross sections.
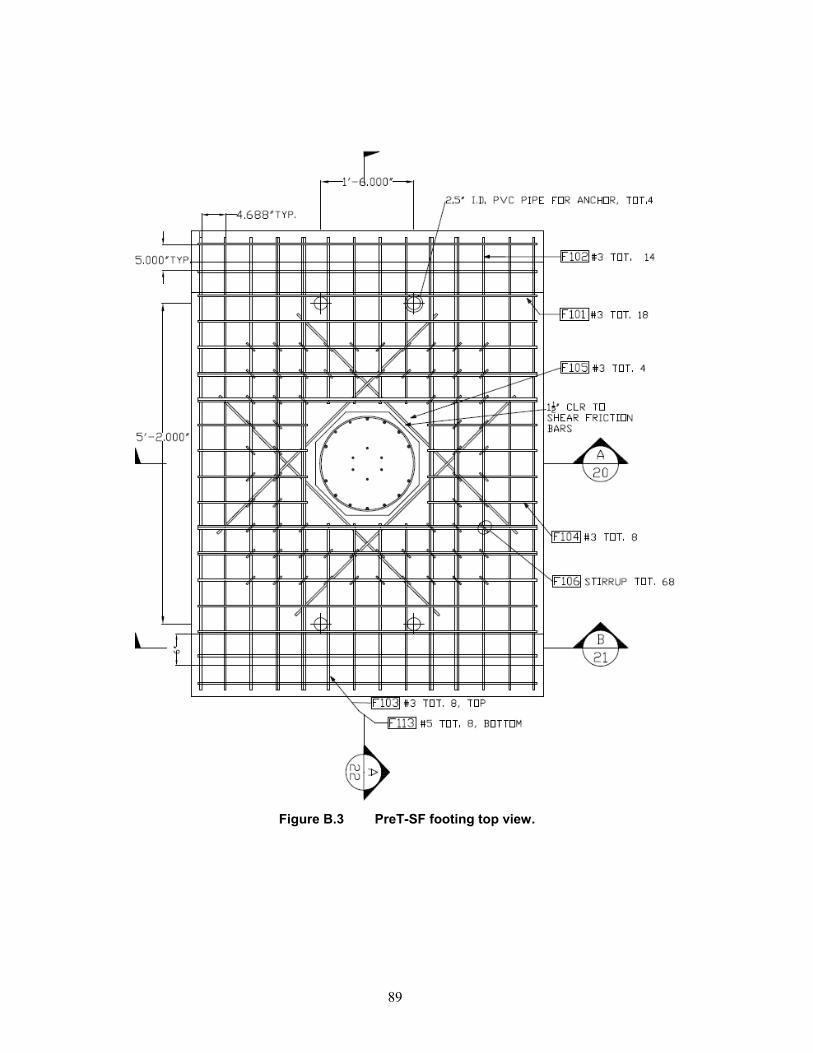
89
Figure B.3 PreT-SF footing top view.
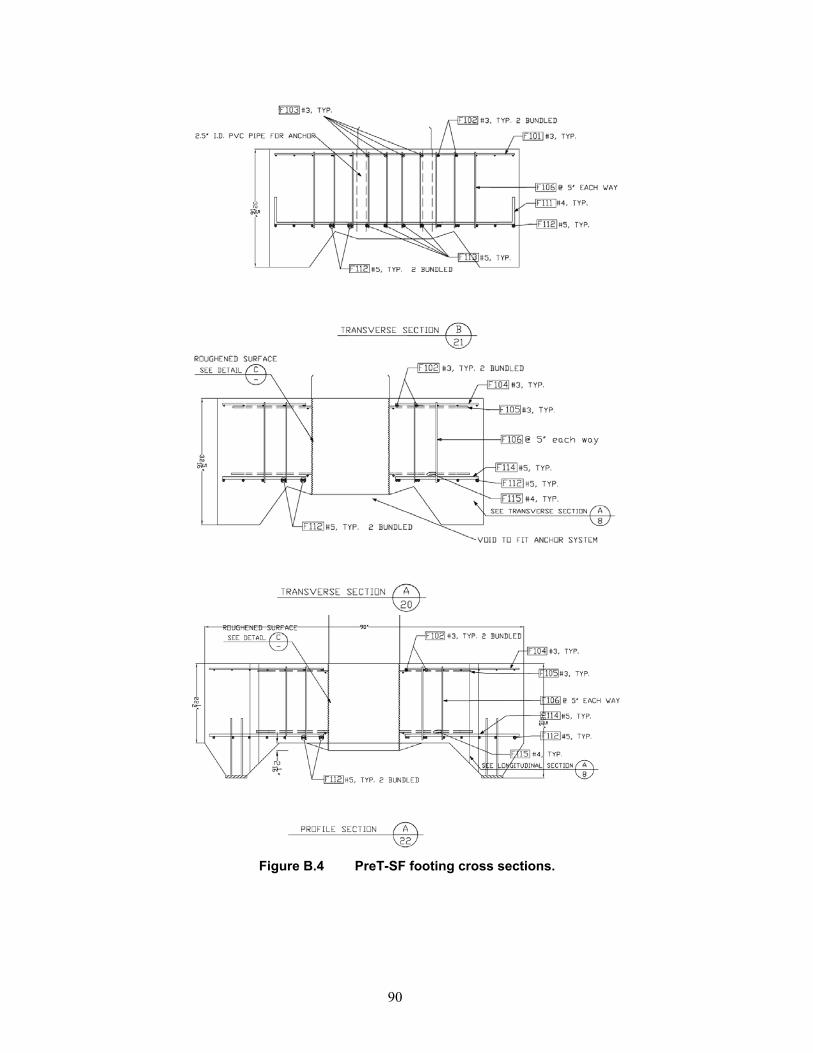
90
Figure B.4 PreT-SF footing cross sections.
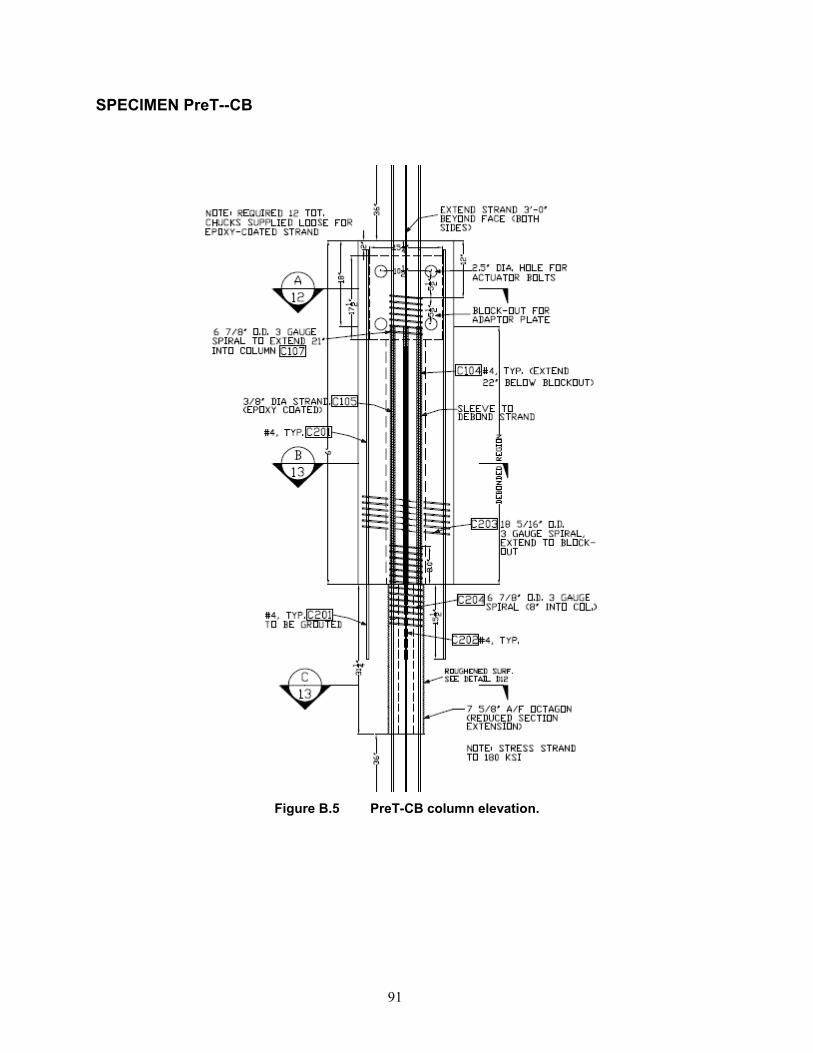
91
SPECIMEN PreT--CB
Figure B.5 PreT-CB column elevation.
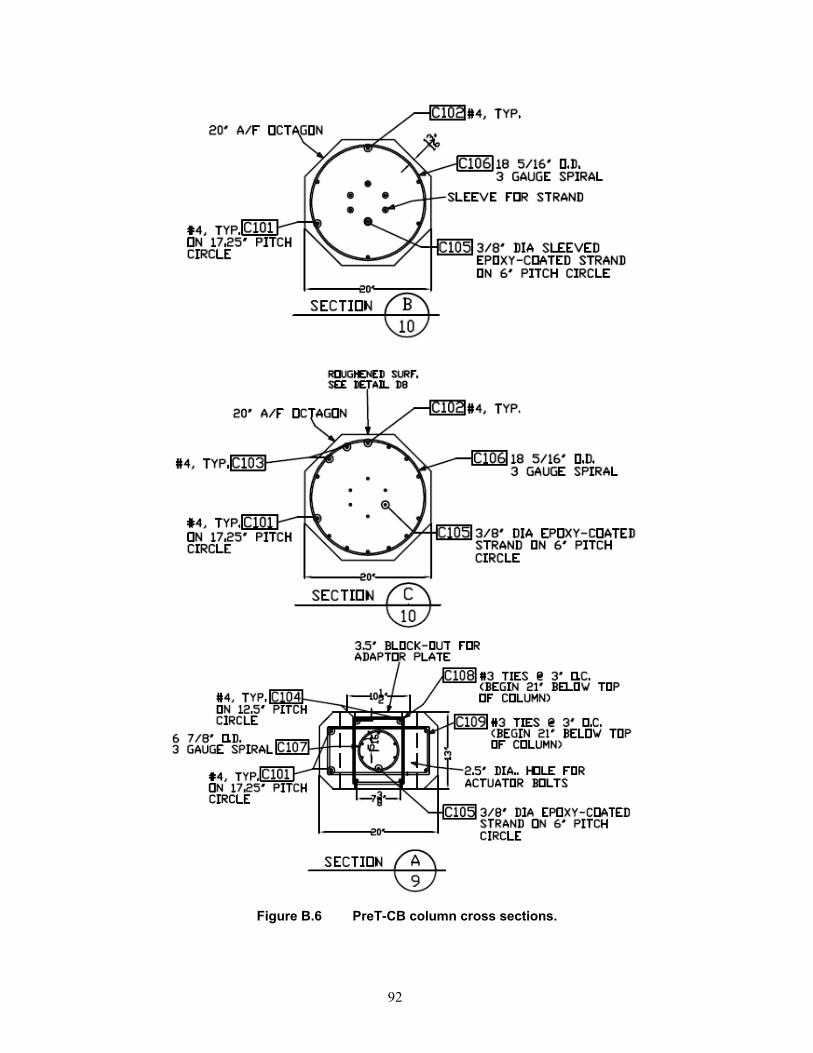
92
Figure B.6 PreT-CB column cross sections.

93
Figure B.7 PreT-CB cap beam top view.
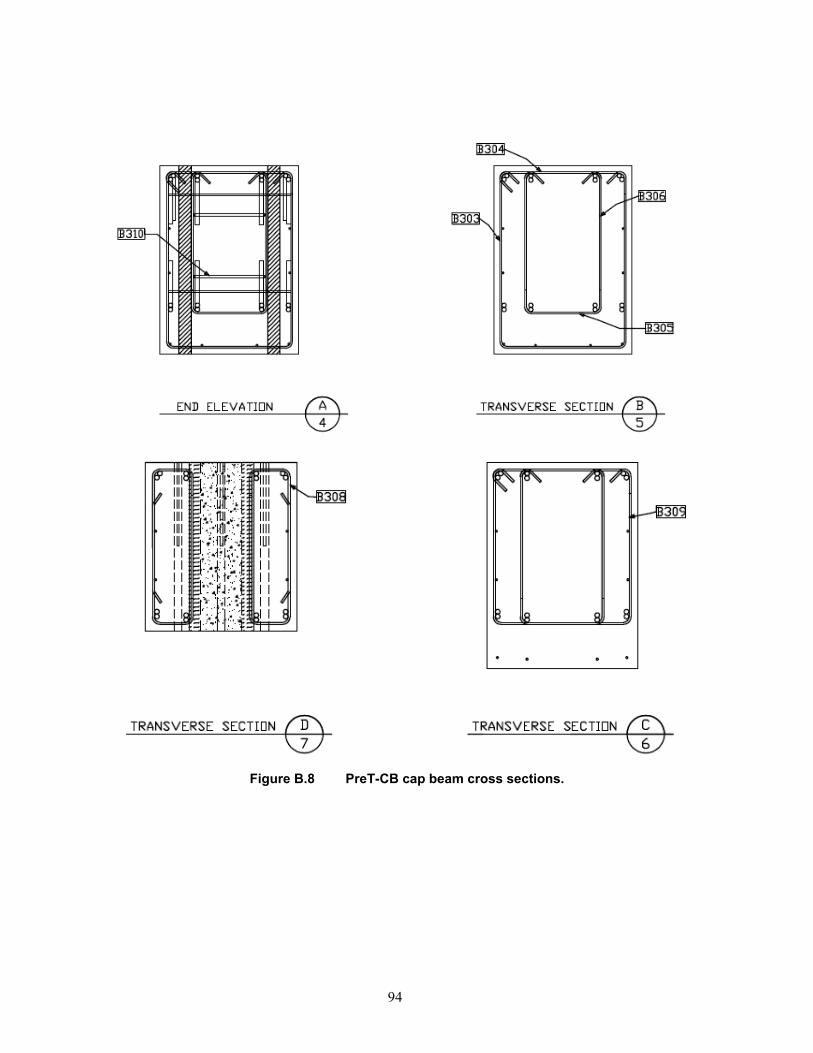
94
Figure B.8 PreT-CB cap beam cross sections.

95
Table B.1 Rebar types.
Bar Label Bar sizeF101 #3F111 #5F102 #3F103 #5F113 #3F104 #5F114 #5F105 #3F115 #4F106 #3F108 #6F109 #4B701 #7B702 #7B301 #3B302 #3B303 #3B304 #3B305 #3B306 #3B307 #3B308 #3B309 #3B310 #3B311 #3B312 #3
Drawings and specimen construction were performed by Todd Janes.

96
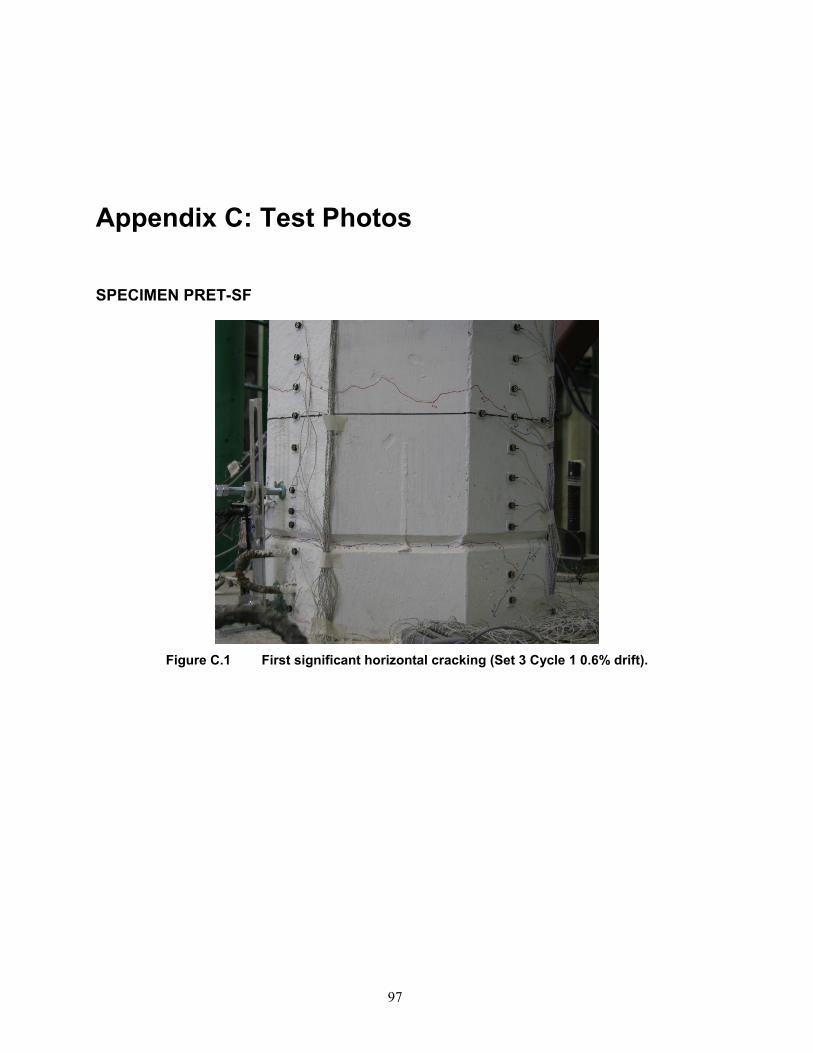
97
Appendix C: Test Photos
SPECIMEN PRET-SF
Figure C.1 First significant horizontal cracking (Set 3 Cycle 1 0.6% drift).
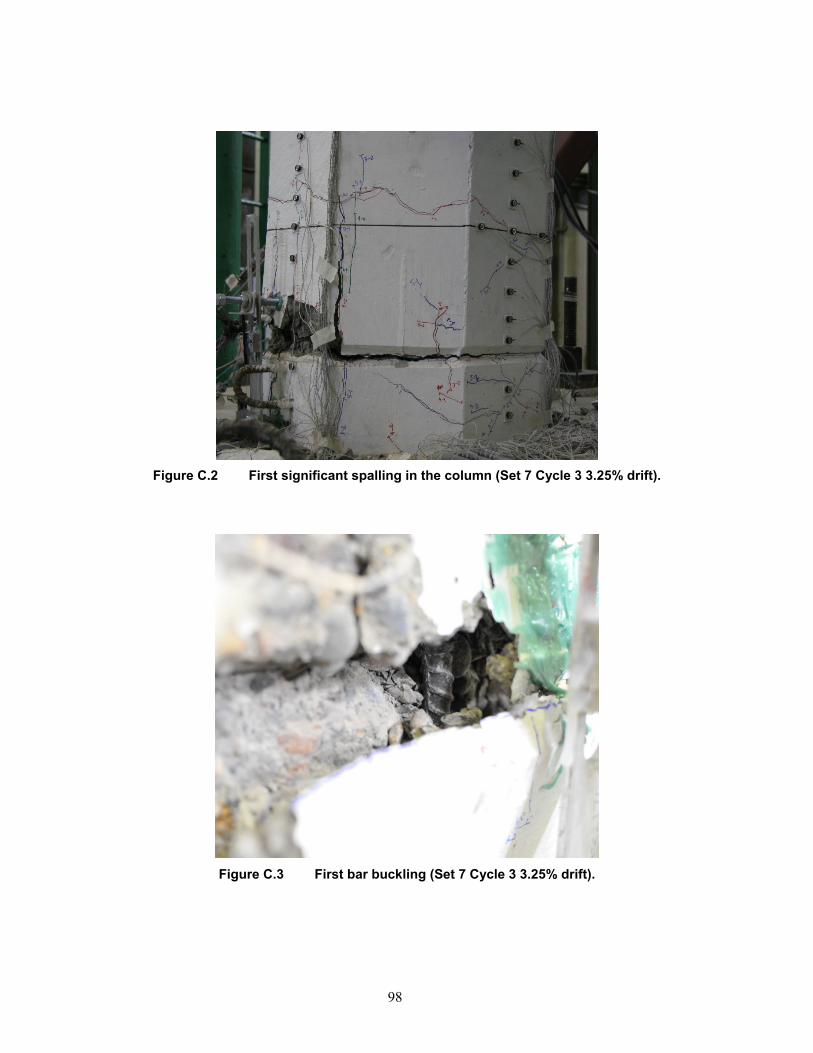
98
Figure C.2 First significant spalling in the column (Set 7 Cycle 3 3.25% drift).
Figure C.3 First bar buckling (Set 7 Cycle 3 3.25% drift).
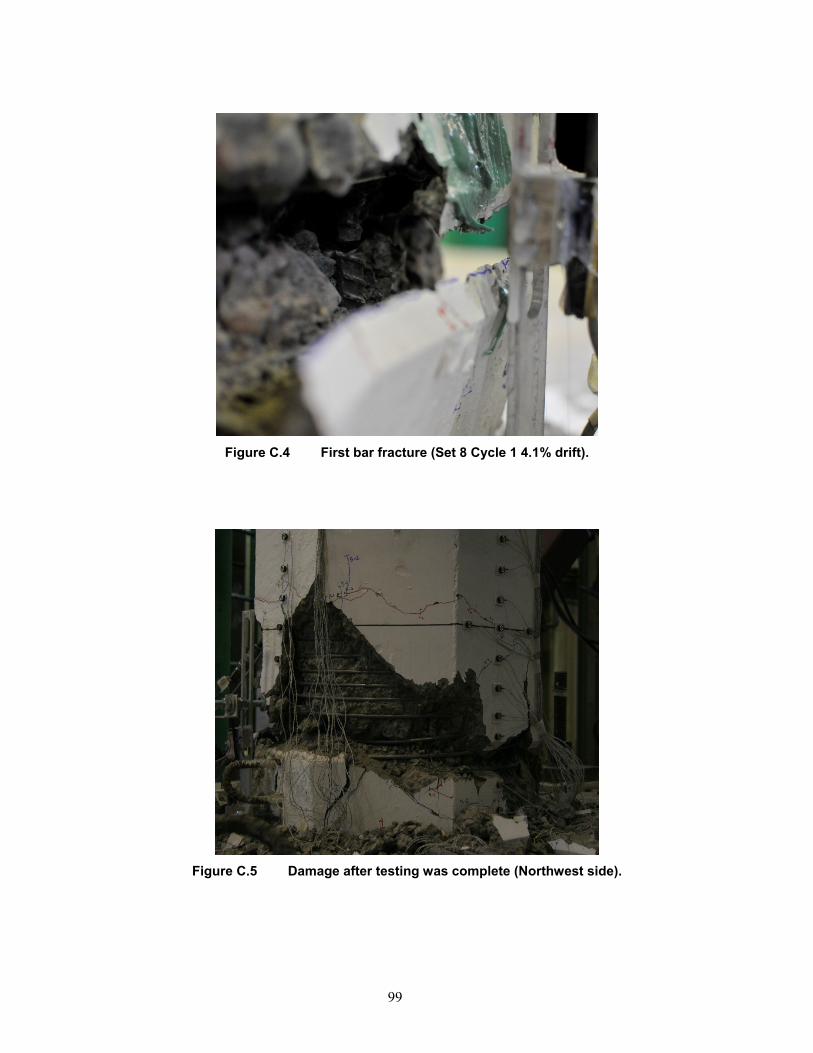
99
Figure C.4 First bar fracture (Set 8 Cycle 1 4.1% drift).
Figure C.5 Damage after testing was complete (Northwest side).
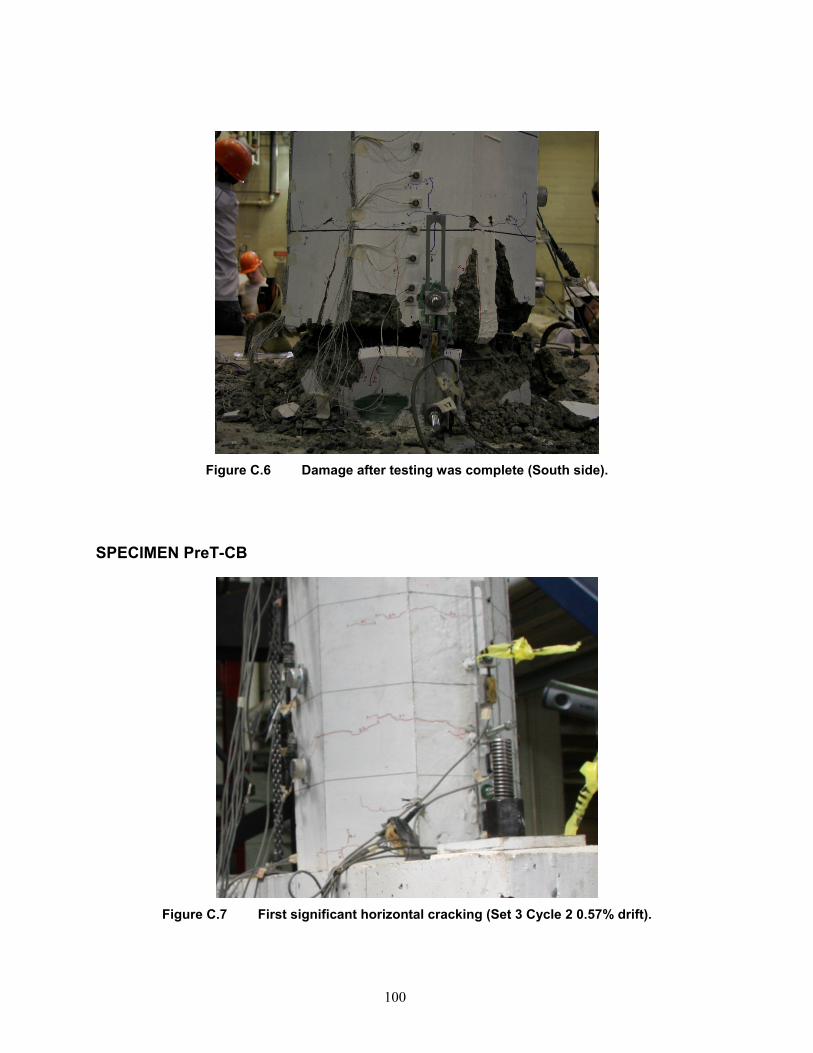
100
Figure C.6 Damage after testing was complete (South side).
SPECIMEN PreT-CB
Figure C.7 First significant horizontal cracking (Set 3 Cycle 2 0.57% drift).
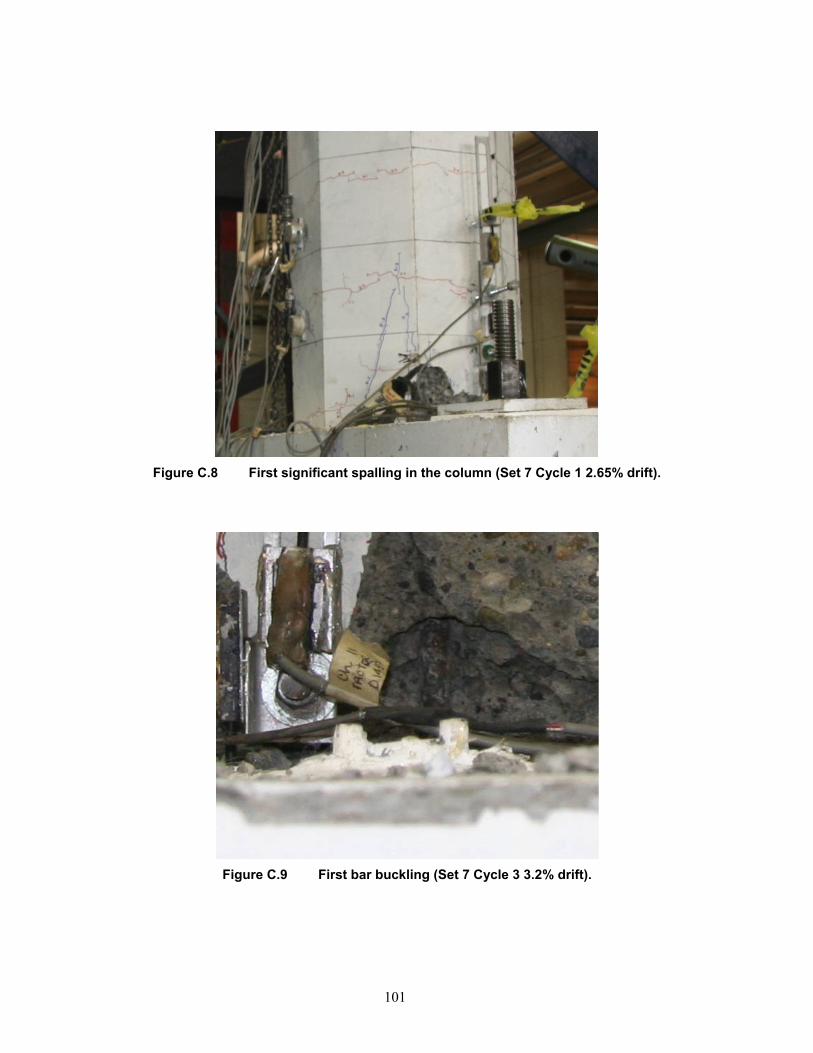
101
Figure C.8 First significant spalling in the column (Set 7 Cycle 1 2.65% drift).
Figure C.9 First bar buckling (Set 7 Cycle 3 3.2% drift).

102
Figure C.10 First bar fracture (Set 8 Cycle 1 3.95% drift).
Figure C.11 Damage after testing was complete (Northeast side).
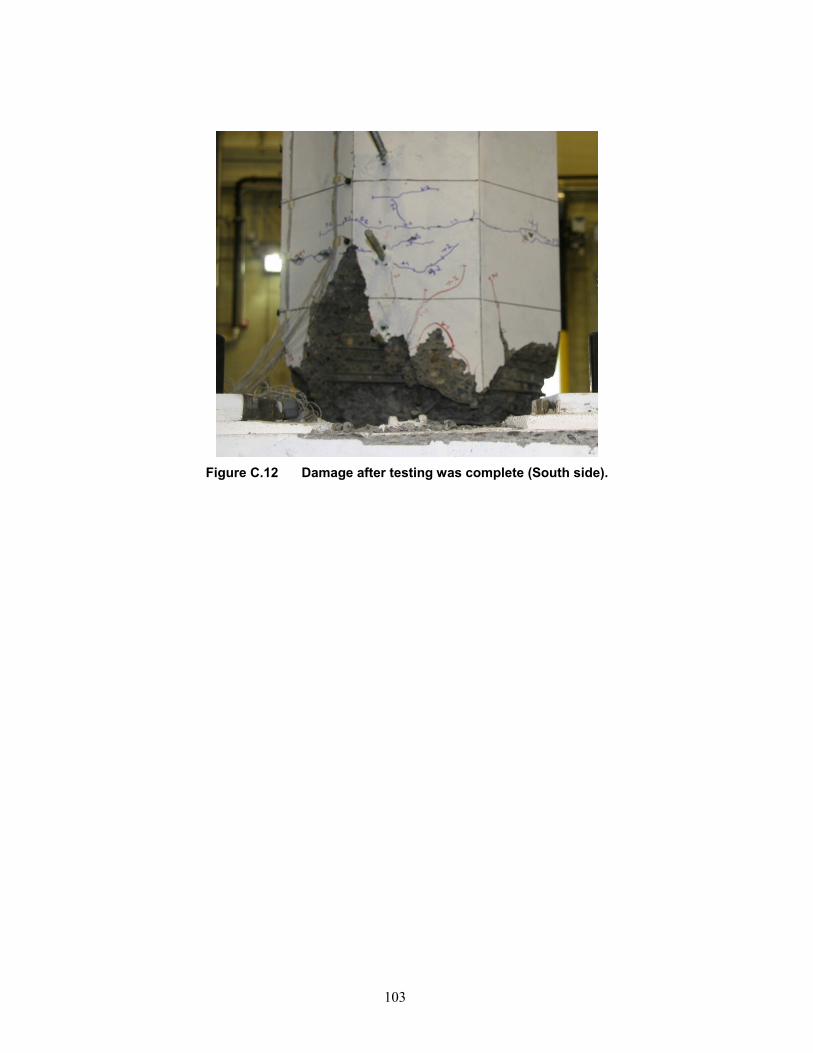
103
Figure C.12 Damage after testing was complete (South side).

104

105
Appendix D: Pull Out Tests
The pullout tests were performed according to the Moustafa Method [Logan 1997] with a slight variation. For these tests, the same size blocks and number of strands per block were used, but the bonded length was varied and the strands were allowed to project out the bottom of the blocks. This was done in order to measure the displacement at the back end of the strand in addition to the displacement at the front.
The specimens were loaded at a rate of 20 kips per minute using a 50 kip ram placed on top of a stand to elevate the ram off the top of the block. This was done for two reasons: (1) to prevent the reaction force of the ram from adding additional confining pressure to the concrete; and (2) to allow the displacement of the strand to be measured. A load cell and strand chuck was placed on top of the ram to measure the load placed on the strand. Figure D.1 shows the test set up used.
Figure D.1 Pullout test set up.

106
The load displacement curve for each test can be seen in the following figures. The load versus bottom displacement was not plotted for the 36-in. bonded lengths because no slip was recorded there.
PULL OUT TEST RESULTS
Figure D.2 36-in. bonded length epoxy strand.
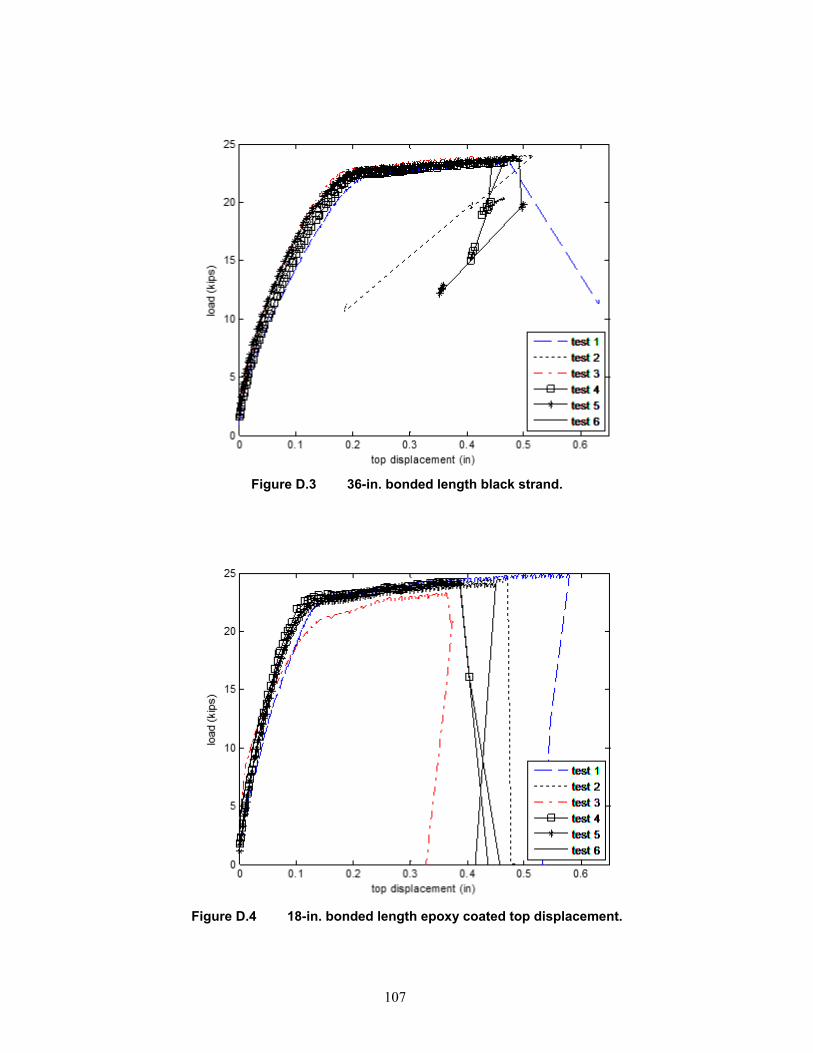
107
Figure D.3 36-in. bonded length black strand.
Figure D.4 18-in. bonded length epoxy coated top displacement.
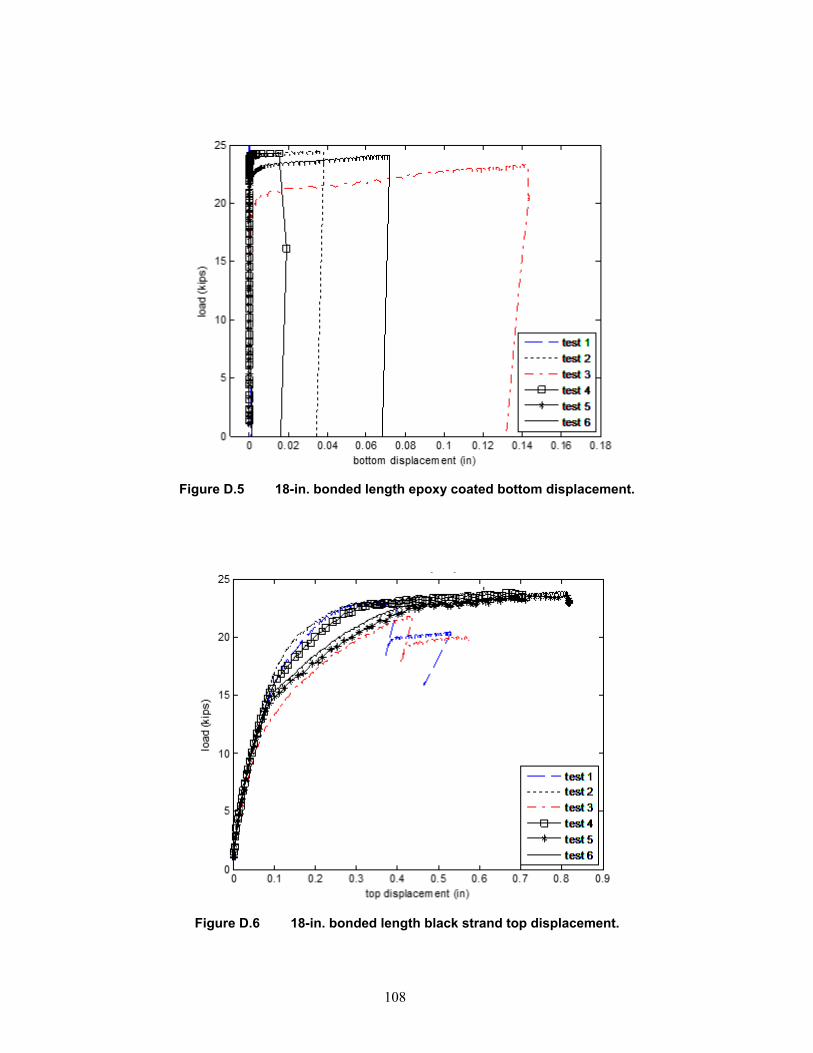
108
Figure D.5 18-in. bonded length epoxy coated bottom displacement.
Figure D.6 18-in. bonded length black strand top displacement.
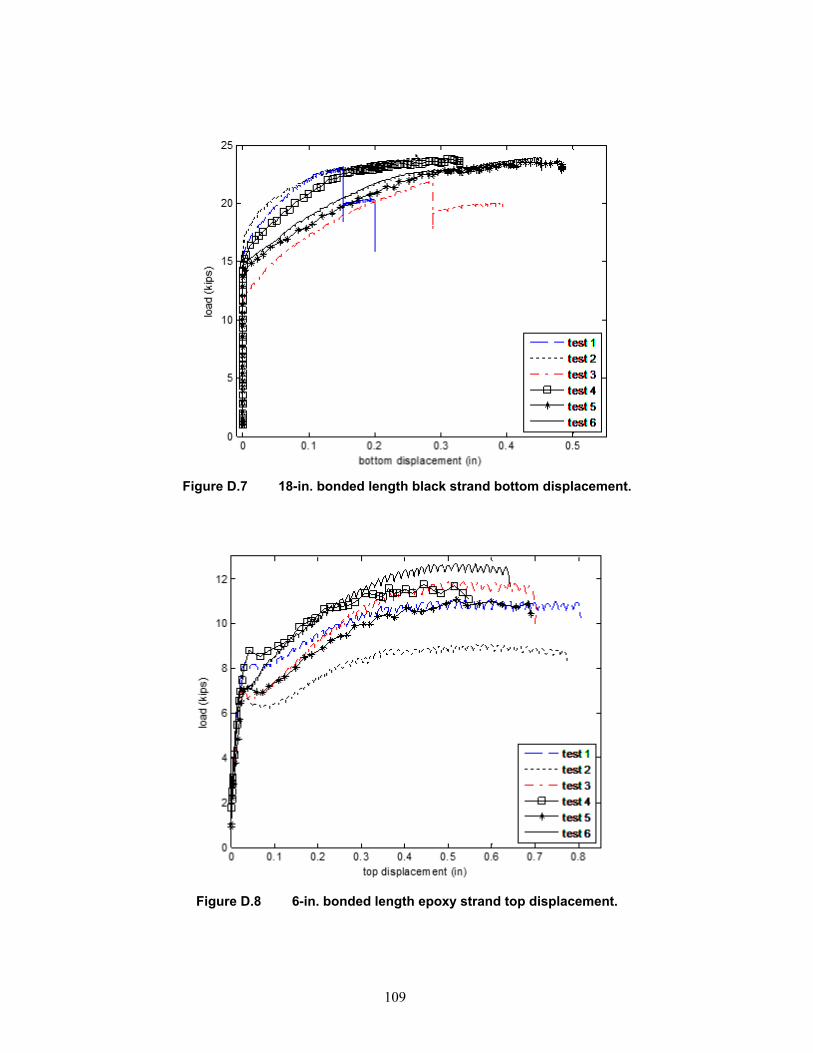
109
Figure D.7 18-in. bonded length black strand bottom displacement.
Figure D.8 6-in. bonded length epoxy strand top displacement.
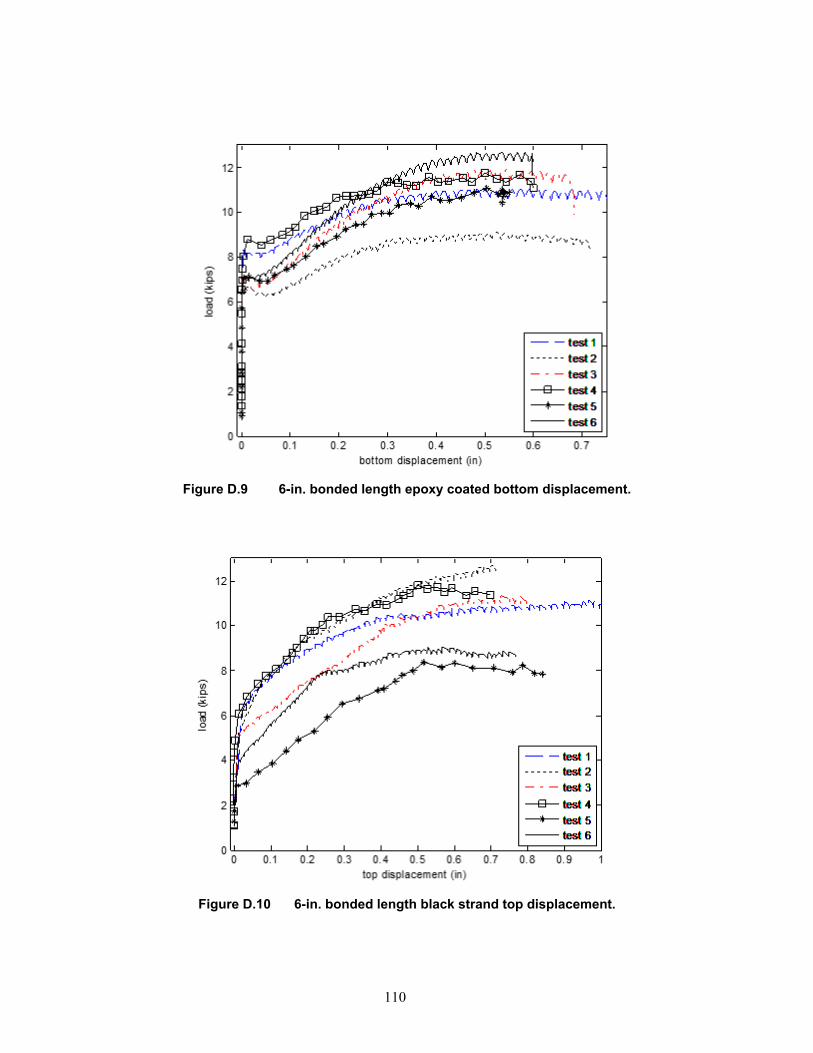
110
Figure D.9 6-in. bonded length epoxy coated bottom displacement.
Figure D.10 6-in. bonded length black strand top displacement.
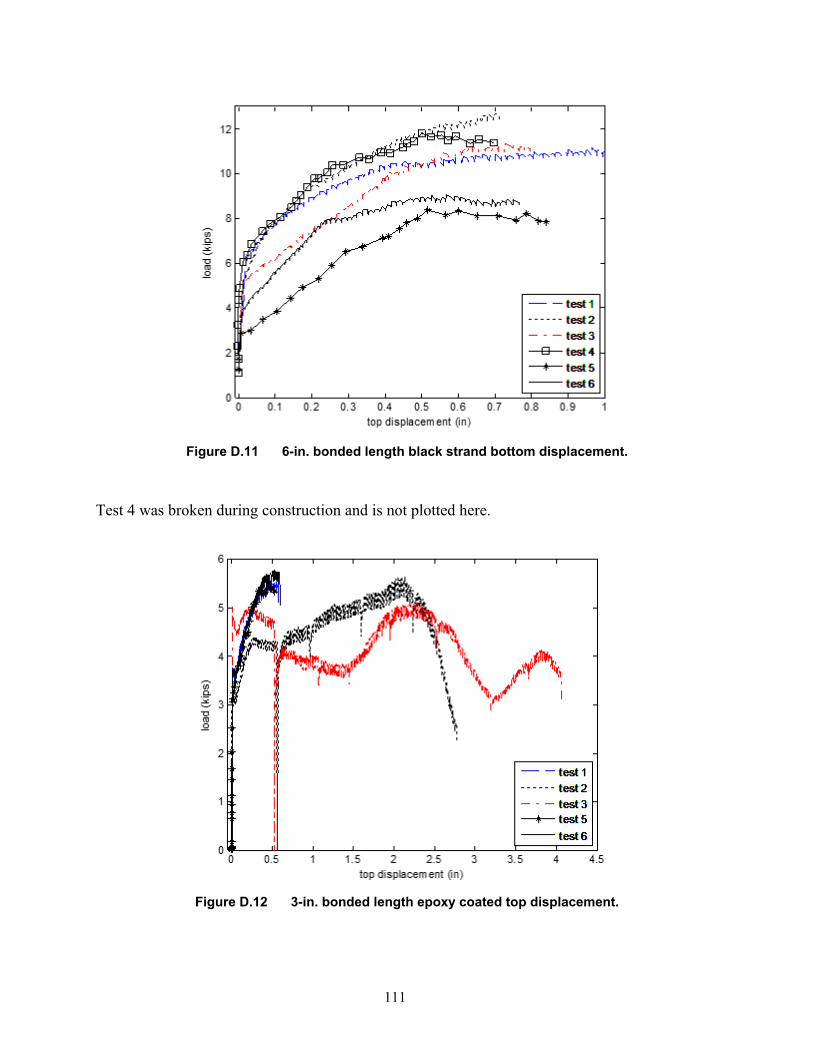
111
Figure D.11 6-in. bonded length black strand bottom displacement.
Test 4 was broken during construction and is not plotted here.
Figure D.12 3-in. bonded length epoxy coated top displacement.
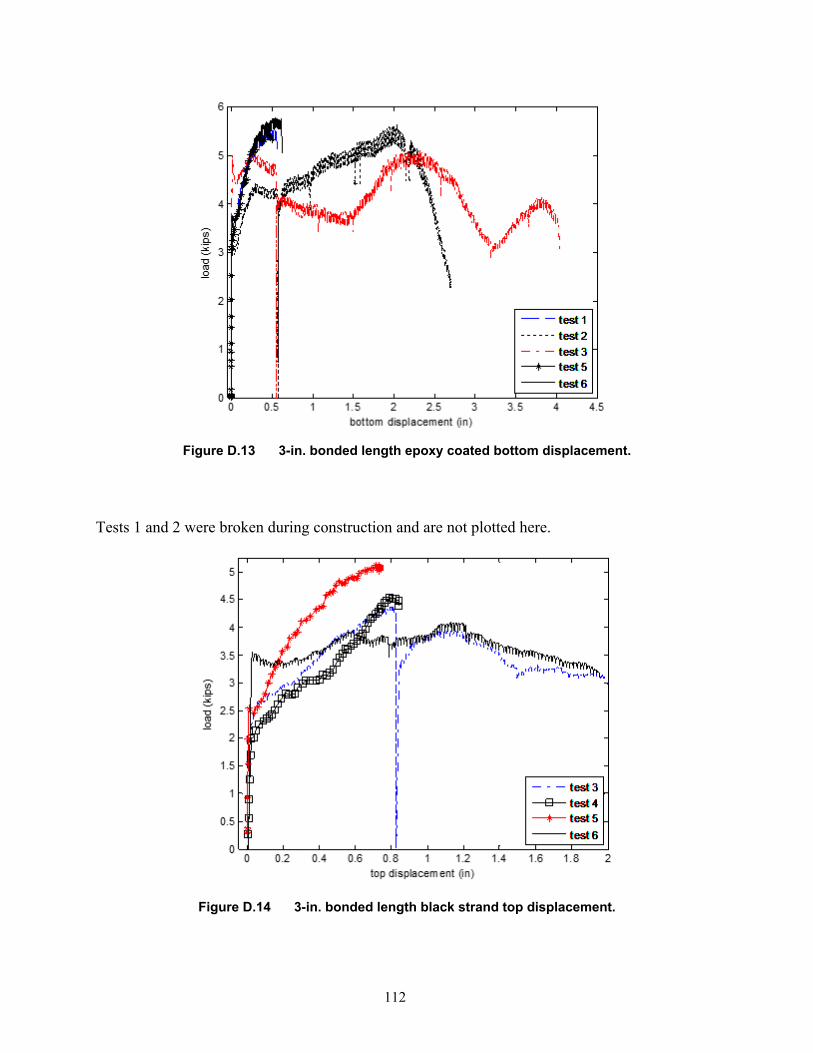
112
Figure D.13 3-in. bonded length epoxy coated bottom displacement.
Tests 1 and 2 were broken during construction and are not plotted here.
Figure D.14 3-in. bonded length black strand top displacement.
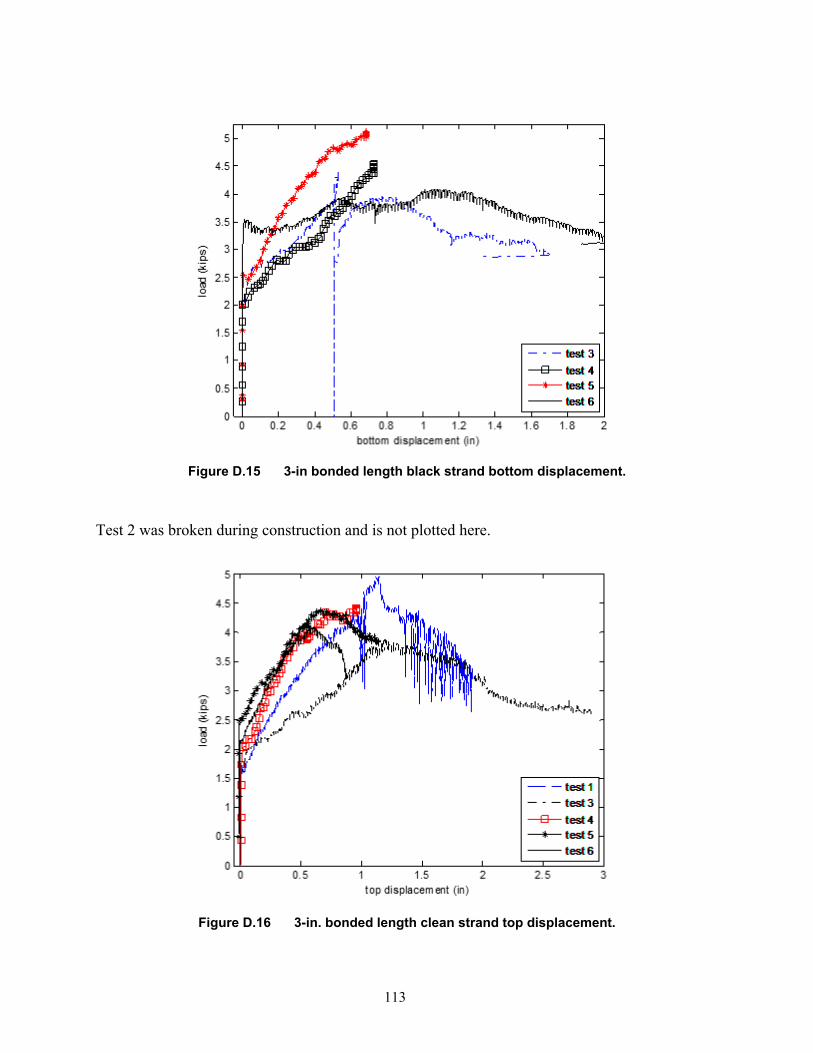
113
Figure D.15 3-in bonded length black strand bottom displacement.
Test 2 was broken during construction and is not plotted here.
Figure D.16 3-in. bonded length clean strand top displacement.
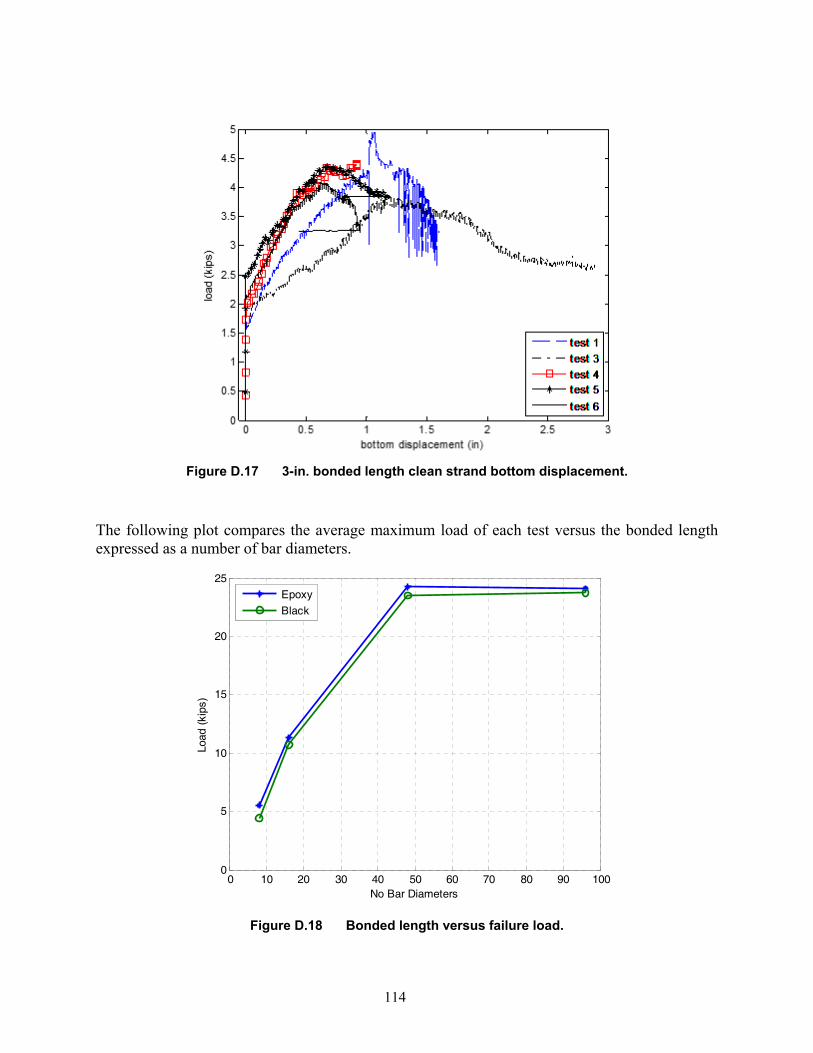
114
Figure D.17 3-in. bonded length clean strand bottom displacement.
The following plot compares the average maximum load of each test versus the bonded length expressed as a number of bar diameters.
0 10 20 30 40 50 60 70 80 90 1000
5
10
15
20
25
No Bar Diameters
Load
(ki
ps)
Epoxy
Black
Figure D.18 Bonded length versus failure load.

115

116

PEER REPORTS
PEER reports are available individually or by yearly subscription. PEER reports can be ordered at http://peer.berkeley.edu/publications/peer_reports.html or by contacting the Pacific Earthquake Engineering Research Center, 325 Davis Hall mail code 1792, Berkeley, CA 94720. Tel.: (510) 642-3437; Fax: (510) 665-1655; Email: [email protected]
PEER 2012/04 Unbonded Pre-Tensioned Columns for Bridges in Seismic Regions. Phillip M. Davis, Todd M. Janes, Marc O. Eberhard, and John F. Stanton. December 2012.
PEER 2012/03 Experimental and Analytical Studies on Reinforced Concrete Buildings with Seismically Vulnerable Beam-Column Joints. Sangjoon Park and Khalid M. Mosalam. October 2012.
PEER 2012/02 Seismic Performance of Reinforced Concrete Bridges Allowed to Uplift during Multi-Directional Excitation. Andres Oscar Espinoza and Stephen A. Mahin. July 2012.
PEER 2012/01 Spectral Damping Scaling Factors for Shallow Crustal Earthquakes in Active Tectonic Regions. Sanaz Rezaeian, Yousef Bozorgnia, I. M. Idriss, Kenneth Campbell, Norman Abrahamson, and Walter Silva. July 2012.
PEER 2011/10 Earthquake Engineering for Resilient Communities: 2011 PEER Internship Program Research Report Collection. Eds. Heidi Faison and Stephen A. Mahin. December 2011.
PEER 2011/09 Calibration of Semi-Stochastic Procedure for Simulating High-Frequency Ground Motions. Jonathan P. Stewart, Emel Seyhan, and Robert W. Graves. December 2011.
PEER 2011/08 Water Supply in regard to Fire Following Earthquake. Charles Scawthorn. November 2011.
PEER 2011/07 Seismic Risk Management in Urban Areas. Proceedings of a U.S.-Iran-Turkey Seismic Workshop. September 2011.
PEER 2011/06 The Use of Base Isolation Systems to Achieve Complex Seismic Performance Objectives. Troy A. Morgan and Stephen A. Mahin. July 2011.
PEER 2011/05 Case Studies of the Seismic Performance of Tall Buildings Designed by Alternative Means. Task 12 Report for the Tall Buildings Initiative. Jack Moehle, Yousef Bozorgnia, Nirmal Jayaram, Pierson Jones, Mohsen Rahnama, Nilesh Shome, Zeynep Tuna, John Wallace, Tony Yang, and Farzin Zareian. July 2011.
PEER 2011/04 Recommended Design Practice for Pile Foundations in Laterally Spreading Ground. Scott A. Ashford, Ross W. Boulanger, and Scott J. Brandenberg. June 2011.
PEER 2011/03 New Ground Motion Selection Procedures and Selected Motions for the PEER Transportation Research Program. Jack W. Baker, Ting Lin, Shrey K. Shahi, and Nirmal Jayaram. March 2011.
PEER 2011/02 A Bayesian Network Methodology for Infrastructure Seismic Risk Assessment and Decision Support. Michelle T. Bensi, Armen Der Kiureghian, and Daniel Straub. March 2011.
PEER 2011/01 Demand Fragility Surfaces for Bridges in Liquefied and Laterally Spreading Ground. Scott J. Brandenberg, Jian Zhang, Pirooz Kashighandi, Yili Huo, and Minxing Zhao. March 2011.
PEER 2010/05 Guidelines for Performance-Based Seismic Design of Tall Buildings. Developed by the Tall Buildings Initiative. November 2010.
PEER 2010/04 Application Guide for the Design of Flexible and Rigid Bus Connections between Substation Equipment Subjected to Earthquakes. Jean-Bernard Dastous and Armen Der Kiureghian. September 2010.
PEER 2010/03 Shear Wave Velocity as a Statistical Function of Standard Penetration Test Resistance and Vertical Effective Stress at Caltrans Bridge Sites. Scott J. Brandenberg, Naresh Bellana, and Thomas Shantz. June 2010.
PEER 2010/02 Stochastic Modeling and Simulation of Ground Motions for Performance-Based Earthquake Engineering. Sanaz Rezaeian and Armen Der Kiureghian. June 2010.
PEER 2010/01 Structural Response and Cost Characterization of Bridge Construction Using Seismic Performance Enhancement Strategies. Ady Aviram, Božidar Stojadinović, Gustavo J. Parra-Montesinos, and Kevin R. Mackie. March 2010.
PEER 2009/03 The Integration of Experimental and Simulation Data in the Study of Reinforced Concrete Bridge Systems Including Soil-Foundation-Structure Interaction. Matthew Dryden and Gregory L. Fenves. November 2009.
PEER 2009/02 Improving Earthquake Mitigation through Innovations and Applications in Seismic Science, Engineering, Communication, and Response. Proceedings of a U.S.-Iran Seismic Workshop. October 2009.
PEER 2009/01 Evaluation of Ground Motion Selection and Modification Methods: Predicting Median Interstory Drift Response of Buildings. Curt B. Haselton, Ed. June 2009.
PEER 2008/10 Technical Manual for Strata. Albert R. Kottke and Ellen M. Rathje. February 2009.

PEER 2008/09 NGA Model for Average Horizontal Component of Peak Ground Motion and Response Spectra. Brian S.-J. Chiou and Robert R. Youngs. November 2008.
PEER 2008/08 Toward Earthquake-Resistant Design of Concentrically Braced Steel Structures. Patxi Uriz and Stephen A. Mahin. November 2008.
PEER 2008/07 Using OpenSees for Performance-Based Evaluation of Bridges on Liquefiable Soils. Stephen L. Kramer, Pedro Arduino, and HyungSuk Shin. November 2008.
PEER 2008/06 Shaking Table Tests and Numerical Investigation of Self-Centering Reinforced Concrete Bridge Columns. Hyung IL Jeong, Junichi Sakai, and Stephen A. Mahin. September 2008.
PEER 2008/05 Performance-Based Earthquake Engineering Design Evaluation Procedure for Bridge Foundations Undergoing Liquefaction-Induced Lateral Ground Displacement. Christian A. Ledezma and Jonathan D. Bray. August 2008.
PEER 2008/04 Benchmarking of Nonlinear Geotechnical Ground Response Analysis Procedures. Jonathan P. Stewart, Annie On-Lei Kwok, Yousseff M. A. Hashash, Neven Matasovic, Robert Pyke, Zhiliang Wang, and Zhaohui Yang. August 2008.
PEER 2008/03 Guidelines for Nonlinear Analysis of Bridge Structures in California. Ady Aviram, Kevin R. Mackie, and Božidar Stojadinović. August 2008.
PEER 2008/02 Treatment of Uncertainties in Seismic-Risk Analysis of Transportation Systems. Evangelos Stergiou and Anne S. Kiremidjian. July 2008.
PEER 2008/01 Seismic Performance Objectives for Tall Buildings. William T. Holmes, Charles Kircher, William Petak, and Nabih Youssef. August 2008.
PEER 2007/12 An Assessment to Benchmark the Seismic Performance of a Code-Conforming Reinforced Concrete Moment-Frame Building. Curt Haselton, Christine A. Goulet, Judith Mitrani-Reiser, James L. Beck, Gregory G. Deierlein, Keith A. Porter, Jonathan P. Stewart, and Ertugrul Taciroglu. August 2008.
PEER 2007/11 Bar Buckling in Reinforced Concrete Bridge Columns. Wayne A. Brown, Dawn E. Lehman, and John F. Stanton. February 2008.
PEER 2007/10 Computational Modeling of Progressive Collapse in Reinforced Concrete Frame Structures. Mohamed M. Talaat and Khalid M. Mosalam. May 2008.
PEER 2007/09 Integrated Probabilistic Performance-Based Evaluation of Benchmark Reinforced Concrete Bridges. Kevin R. Mackie, John-Michael Wong, and Božidar Stojadinović. January 2008.
PEER 2007/08 Assessing Seismic Collapse Safety of Modern Reinforced Concrete Moment-Frame Buildings. Curt B. Haselton and Gregory G. Deierlein. February 2008.
PEER 2007/07 Performance Modeling Strategies for Modern Reinforced Concrete Bridge Columns. Michael P. Berry and Marc O. Eberhard. April 2008.
PEER 2007/06 Development of Improved Procedures for Seismic Design of Buried and Partially Buried Structures. Linda Al Atik and Nicholas Sitar. June 2007.
PEER 2007/05 Uncertainty and Correlation in Seismic Risk Assessment of Transportation Systems. Renee G. Lee and Anne S. Kiremidjian. July 2007.
PEER 2007/04 Numerical Models for Analysis and Performance-Based Design of Shallow Foundations Subjected to Seismic Loading. Sivapalan Gajan, Tara C. Hutchinson, Bruce L. Kutter, Prishati Raychowdhury, José A. Ugalde, and Jonathan P. Stewart. May 2008.
PEER 2007/03 Beam-Column Element Model Calibrated for Predicting Flexural Response Leading to Global Collapse of RC Frame Buildings. Curt B. Haselton, Abbie B. Liel, Sarah Taylor Lange, and Gregory G. Deierlein. May 2008.
PEER 2007/02 Campbell-Bozorgnia NGA Ground Motion Relations for the Geometric Mean Horizontal Component of Peak and Spectral Ground Motion Parameters. Kenneth W. Campbell and Yousef Bozorgnia. May 2007.
PEER 2007/01 Boore-Atkinson NGA Ground Motion Relations for the Geometric Mean Horizontal Component of Peak and Spectral Ground Motion Parameters. David M. Boore and Gail M. Atkinson. May. May 2007.
PEER 2006/12 Societal Implications of Performance-Based Earthquake Engineering. Peter J. May. May 2007.
PEER 2006/11 Probabilistic Seismic Demand Analysis Using Advanced Ground Motion Intensity Measures, Attenuation Relationships, and Near-Fault Effects. Polsak Tothong and C. Allin Cornell. March 2007.
PEER 2006/10 Application of the PEER PBEE Methodology to the I-880 Viaduct. Sashi Kunnath. February 2007.
PEER 2006/09 Quantifying Economic Losses from Travel Forgone Following a Large Metropolitan Earthquake. James Moore, Sungbin Cho, Yue Yue Fan, and Stuart Werner. November 2006.

PEER 2006/08 Vector-Valued Ground Motion Intensity Measures for Probabilistic Seismic Demand Analysis. Jack W. Baker and C. Allin Cornell. October 2006.
PEER 2006/07 Analytical Modeling of Reinforced Concrete Walls for Predicting Flexural and Coupled–Shear- Flexural Responses. Kutay Orakcal, Leonardo M. Massone, and John W. Wallace. October 2006.
PEER 2006/06 Nonlinear Analysis of a Soil-Drilled Pier System under Static and Dynamic Axial Loading. Gang Wang and Nicholas Sitar. November 2006.
PEER 2006/05 Advanced Seismic Assessment Guidelines. Paolo Bazzurro, C. Allin Cornell, Charles Menun, Maziar Motahari, and Nicolas Luco. September 2006.
PEER 2006/04 Probabilistic Seismic Evaluation of Reinforced Concrete Structural Components and Systems. Tae Hyung Lee and Khalid M. Mosalam. August 2006.
PEER 2006/03 Performance of Lifelines Subjected to Lateral Spreading. Scott A. Ashford and Teerawut Juirnarongrit. July 2006.
PEER 2006/02 Pacific Earthquake Engineering Research Center Highway Demonstration Project. Anne Kiremidjian, James Moore, Yue Yue Fan, Nesrin Basoz, Ozgur Yazali, and Meredith Williams. April 2006.
PEER 2006/01 Bracing Berkeley. A Guide to Seismic Safety on the UC Berkeley Campus. Mary C. Comerio, Stephen Tobriner, and Ariane Fehrenkamp. January 2006.
PEER 2005/16 Seismic Response and Reliability of Electrical Substation Equipment and Systems. Junho Song, Armen Der Kiureghian, and Jerome L. Sackman. April 2006.
PEER 2005/15 CPT-Based Probabilistic Assessment of Seismic Soil Liquefaction Initiation. R. E. S. Moss, R. B. Seed, R. E. Kayen, J. P. Stewart, and A. Der Kiureghian. April 2006.
PEER 2005/14 Workshop on Modeling of Nonlinear Cyclic Load-Deformation Behavior of Shallow Foundations. Bruce L. Kutter, Geoffrey Martin, Tara Hutchinson, Chad Harden, Sivapalan Gajan, and Justin Phalen. March 2006.
PEER 2005/13 Stochastic Characterization and Decision Bases under Time-Dependent Aftershock Risk in Performance-Based Earthquake Engineering. Gee Liek Yeo and C. Allin Cornell. July 2005.
PEER 2005/12 PEER Testbed Study on a Laboratory Building: Exercising Seismic Performance Assessment. Mary C. Comerio, editor. November 2005.
PEER 2005/11 Van Nuys Hotel Building Testbed Report: Exercising Seismic Performance Assessment. Helmut Krawinkler, editor. October 2005.
PEER 2005/10 First NEES/E-Defense Workshop on Collapse Simulation of Reinforced Concrete Building Structures. September 2005.
PEER 2005/09 Test Applications of Advanced Seismic Assessment Guidelines. Joe Maffei, Karl Telleen, Danya Mohr, William Holmes, and Yuki Nakayama. August 2006.
PEER 2005/08 Damage Accumulation in Lightly Confined Reinforced Concrete Bridge Columns. R. Tyler Ranf, Jared M. Nelson, Zach Price, Marc O. Eberhard, and John F. Stanton. April 2006.
PEER 2005/07 Experimental and Analytical Studies on the Seismic Response of Freestanding and Anchored Laboratory Equipment. Dimitrios Konstantinidis and Nicos Makris. January 2005.
PEER 2005/06 Global Collapse of Frame Structures under Seismic Excitations. Luis F. Ibarra and Helmut Krawinkler. September 2005.
PEER 2005//05 Performance Characterization of Bench- and Shelf-Mounted Equipment. Samit Ray Chaudhuri and Tara C. Hutchinson. May 2006.
PEER 2005/04 Numerical Modeling of the Nonlinear Cyclic Response of Shallow Foundations. Chad Harden, Tara Hutchinson, Geoffrey R. Martin, and Bruce L. Kutter. August 2005.
PEER 2005/03 A Taxonomy of Building Components for Performance-Based Earthquake Engineering. Keith A. Porter. September 2005.
PEER 2005/02 Fragility Basis for California Highway Overpass Bridge Seismic Decision Making. Kevin R. Mackie and Božidar Stojadinović. June 2005.
PEER 2005/01 Empirical Characterization of Site Conditions on Strong Ground Motion. Jonathan P. Stewart, Yoojoong Choi, and Robert W. Graves. June 2005.
PEER 2004/09 Electrical Substation Equipment Interaction: Experimental Rigid Conductor Studies. Christopher Stearns and André Filiatrault. February 2005.
PEER 2004/08 Seismic Qualification and Fragility Testing of Line Break 550-kV Disconnect Switches. Shakhzod M. Takhirov, Gregory L. Fenves, and Eric Fujisaki. January 2005.

PEER 2004/07 Ground Motions for Earthquake Simulator Qualification of Electrical Substation Equipment. Shakhzod M. Takhirov, Gregory L. Fenves, Eric Fujisaki, and Don Clyde. January 2005.
PEER 2004/06 Performance-Based Regulation and Regulatory Regimes. Peter J. May and Chris Koski. September 2004.
PEER 2004/05 Performance-Based Seismic Design Concepts and Implementation: Proceedings of an International Workshop. Peter Fajfar and Helmut Krawinkler, editors. September 2004.
PEER 2004/04 Seismic Performance of an Instrumented Tilt-up Wall Building. James C. Anderson and Vitelmo V. Bertero. July 2004.
PEER 2004/03 Evaluation and Application of Concrete Tilt-up Assessment Methodologies. Timothy Graf and James O. Malley. October 2004.
PEER 2004/02 Analytical Investigations of New Methods for Reducing Residual Displacements of Reinforced Concrete Bridge Columns. Junichi Sakai and Stephen A. Mahin. August 2004.
PEER 2004/01 Seismic Performance of Masonry Buildings and Design Implications. Kerri Anne Taeko Tokoro, James C. Anderson, and Vitelmo V. Bertero. February 2004.
PEER 2003/18 Performance Models for Flexural Damage in Reinforced Concrete Columns. Michael Berry and Marc Eberhard. August 2003.
PEER 2003/17 Predicting Earthquake Damage in Older Reinforced Concrete Beam-Column Joints. Catherine Pagni and Laura Lowes. October 2004.
PEER 2003/16 Seismic Demands for Performance-Based Design of Bridges. Kevin Mackie and Božidar Stojadinović. August 2003.
PEER 2003/15 Seismic Demands for Nondeteriorating Frame Structures and Their Dependence on Ground Motions. Ricardo Antonio Medina and Helmut Krawinkler. May 2004.
PEER 2003/14 Finite Element Reliability and Sensitivity Methods for Performance-Based Earthquake Engineering. Terje Haukaas and Armen Der Kiureghian. April 2004.
PEER 2003/13 Effects of Connection Hysteretic Degradation on the Seismic Behavior of Steel Moment-Resisting Frames. Janise E. Rodgers and Stephen A. Mahin. March 2004.
PEER 2003/12 Implementation Manual for the Seismic Protection of Laboratory Contents: Format and Case Studies. William T. Holmes and Mary C. Comerio. October 2003.
PEER 2003/11 Fifth U.S.-Japan Workshop on Performance-Based Earthquake Engineering Methodology for Reinforced Concrete Building Structures. February 2004.
PEER 2003/10 A Beam-Column Joint Model for Simulating the Earthquake Response of Reinforced Concrete Frames. Laura N. Lowes, Nilanjan Mitra, and Arash Altoontash. February 2004.
PEER 2003/09 Sequencing Repairs after an Earthquake: An Economic Approach. Marco Casari and Simon J. Wilkie. April 2004.
PEER 2003/08 A Technical Framework for Probability-Based Demand and Capacity Factor Design (DCFD) Seismic Formats. Fatemeh Jalayer and C. Allin Cornell. November 2003.
PEER 2003/07 Uncertainty Specification and Propagation for Loss Estimation Using FOSM Methods. Jack W. Baker and C. Allin Cornell. September 2003.
PEER 2003/06 Performance of Circular Reinforced Concrete Bridge Columns under Bidirectional Earthquake Loading. Mahmoud M. Hachem, Stephen A. Mahin, and Jack P. Moehle. February 2003.
PEER 2003/05 Response Assessment for Building-Specific Loss Estimation. Eduardo Miranda and Shahram Taghavi. September 2003.
PEER 2003/04 Experimental Assessment of Columns with Short Lap Splices Subjected to Cyclic Loads. Murat Melek, John W. Wallace, and Joel Conte. April 2003.
PEER 2003/03 Probabilistic Response Assessment for Building-Specific Loss Estimation. Eduardo Miranda and Hesameddin Aslani. September 2003.
PEER 2003/02 Software Framework for Collaborative Development of Nonlinear Dynamic Analysis Program. Jun Peng and Kincho H. Law. September 2003.
PEER 2003/01 Shake Table Tests and Analytical Studies on the Gravity Load Collapse of Reinforced Concrete Frames. Kenneth John Elwood and Jack P. Moehle. November 2003.
PEER 2002/24 Performance of Beam to Column Bridge Joints Subjected to a Large Velocity Pulse. Natalie Gibson, André Filiatrault, and Scott A. Ashford. April 2002.
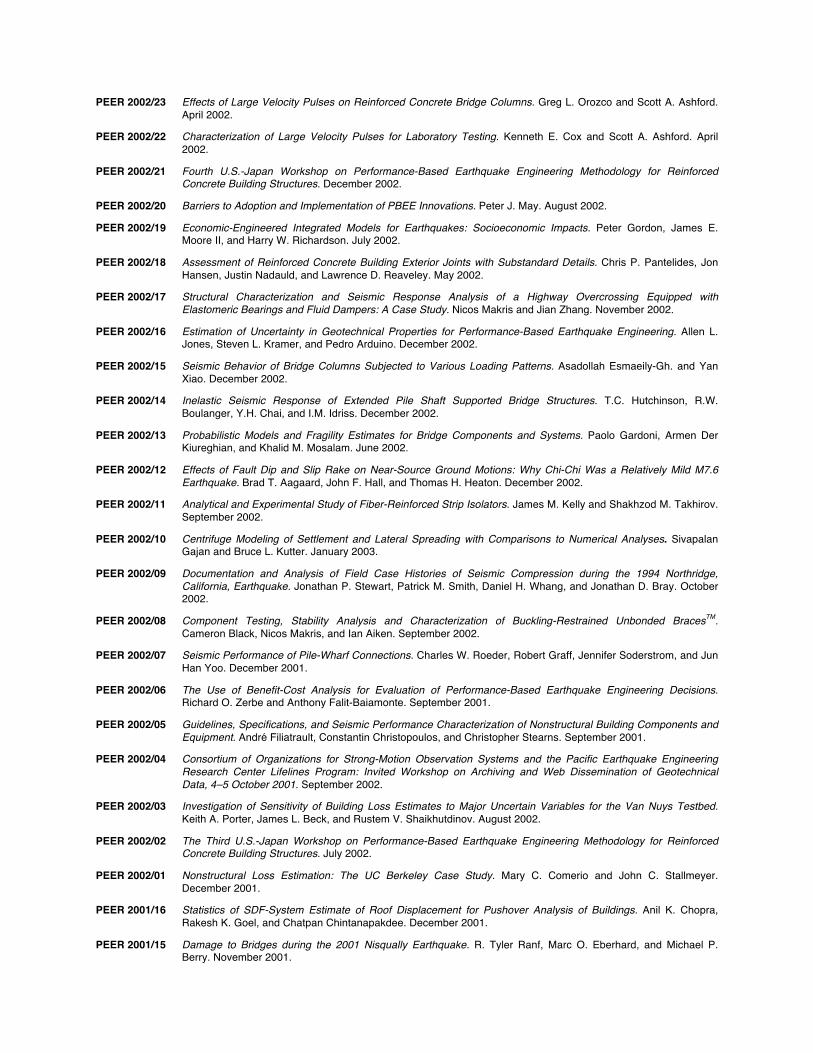
PEER 2002/23 Effects of Large Velocity Pulses on Reinforced Concrete Bridge Columns. Greg L. Orozco and Scott A. Ashford. April 2002.
PEER 2002/22 Characterization of Large Velocity Pulses for Laboratory Testing. Kenneth E. Cox and Scott A. Ashford. April 2002.
PEER 2002/21 Fourth U.S.-Japan Workshop on Performance-Based Earthquake Engineering Methodology for Reinforced Concrete Building Structures. December 2002.
PEER 2002/20 Barriers to Adoption and Implementation of PBEE Innovations. Peter J. May. August 2002.
PEER 2002/19 Economic-Engineered Integrated Models for Earthquakes: Socioeconomic Impacts. Peter Gordon, James E. Moore II, and Harry W. Richardson. July 2002.
PEER 2002/18 Assessment of Reinforced Concrete Building Exterior Joints with Substandard Details. Chris P. Pantelides, Jon Hansen, Justin Nadauld, and Lawrence D. Reaveley. May 2002.
PEER 2002/17 Structural Characterization and Seismic Response Analysis of a Highway Overcrossing Equipped with Elastomeric Bearings and Fluid Dampers: A Case Study. Nicos Makris and Jian Zhang. November 2002.
PEER 2002/16 Estimation of Uncertainty in Geotechnical Properties for Performance-Based Earthquake Engineering. Allen L. Jones, Steven L. Kramer, and Pedro Arduino. December 2002.
PEER 2002/15 Seismic Behavior of Bridge Columns Subjected to Various Loading Patterns. Asadollah Esmaeily-Gh. and Yan Xiao. December 2002.
PEER 2002/14 Inelastic Seismic Response of Extended Pile Shaft Supported Bridge Structures. T.C. Hutchinson, R.W. Boulanger, Y.H. Chai, and I.M. Idriss. December 2002.
PEER 2002/13 Probabilistic Models and Fragility Estimates for Bridge Components and Systems. Paolo Gardoni, Armen Der Kiureghian, and Khalid M. Mosalam. June 2002.
PEER 2002/12 Effects of Fault Dip and Slip Rake on Near-Source Ground Motions: Why Chi-Chi Was a Relatively Mild M7.6 Earthquake. Brad T. Aagaard, John F. Hall, and Thomas H. Heaton. December 2002.
PEER 2002/11 Analytical and Experimental Study of Fiber-Reinforced Strip Isolators. James M. Kelly and Shakhzod M. Takhirov. September 2002.
PEER 2002/10 Centrifuge Modeling of Settlement and Lateral Spreading with Comparisons to Numerical Analyses. Sivapalan Gajan and Bruce L. Kutter. January 2003.
PEER 2002/09 Documentation and Analysis of Field Case Histories of Seismic Compression during the 1994 Northridge, California, Earthquake. Jonathan P. Stewart, Patrick M. Smith, Daniel H. Whang, and Jonathan D. Bray. October 2002.
PEER 2002/08 Component Testing, Stability Analysis and Characterization of Buckling-Restrained Unbonded BracesTM. Cameron Black, Nicos Makris, and Ian Aiken. September 2002.
PEER 2002/07 Seismic Performance of Pile-Wharf Connections. Charles W. Roeder, Robert Graff, Jennifer Soderstrom, and Jun Han Yoo. December 2001.
PEER 2002/06 The Use of Benefit-Cost Analysis for Evaluation of Performance-Based Earthquake Engineering Decisions. Richard O. Zerbe and Anthony Falit-Baiamonte. September 2001.
PEER 2002/05 Guidelines, Specifications, and Seismic Performance Characterization of Nonstructural Building Components and Equipment. André Filiatrault, Constantin Christopoulos, and Christopher Stearns. September 2001.
PEER 2002/04 Consortium of Organizations for Strong-Motion Observation Systems and the Pacific Earthquake Engineering Research Center Lifelines Program: Invited Workshop on Archiving and Web Dissemination of Geotechnical Data, 4–5 October 2001. September 2002.
PEER 2002/03 Investigation of Sensitivity of Building Loss Estimates to Major Uncertain Variables for the Van Nuys Testbed. Keith A. Porter, James L. Beck, and Rustem V. Shaikhutdinov. August 2002.
PEER 2002/02 The Third U.S.-Japan Workshop on Performance-Based Earthquake Engineering Methodology for Reinforced Concrete Building Structures. July 2002.
PEER 2002/01 Nonstructural Loss Estimation: The UC Berkeley Case Study. Mary C. Comerio and John C. Stallmeyer. December 2001.
PEER 2001/16 Statistics of SDF-System Estimate of Roof Displacement for Pushover Analysis of Buildings. Anil K. Chopra, Rakesh K. Goel, and Chatpan Chintanapakdee. December 2001.
PEER 2001/15 Damage to Bridges during the 2001 Nisqually Earthquake. R. Tyler Ranf, Marc O. Eberhard, and Michael P. Berry. November 2001.

PEER 2001/14 Rocking Response of Equipment Anchored to a Base Foundation. Nicos Makris and Cameron J. Black. September 2001.
PEER 2001/13 Modeling Soil Liquefaction Hazards for Performance-Based Earthquake Engineering. Steven L. Kramer and Ahmed-W. Elgamal. February 2001.
PEER 2001/12 Development of Geotechnical Capabilities in OpenSees. Boris Jeremić. September 2001.
PEER 2001/11 Analytical and Experimental Study of Fiber-Reinforced Elastomeric Isolators. James M. Kelly and Shakhzod M. Takhirov. September 2001.
PEER 2001/10 Amplification Factors for Spectral Acceleration in Active Regions. Jonathan P. Stewart, Andrew H. Liu, Yoojoong Choi, and Mehmet B. Baturay. December 2001.
PEER 2001/09 Ground Motion Evaluation Procedures for Performance-Based Design. Jonathan P. Stewart, Shyh-Jeng Chiou, Jonathan D. Bray, Robert W. Graves, Paul G. Somerville, and Norman A. Abrahamson. September 2001.
PEER 2001/08 Experimental and Computational Evaluation of Reinforced Concrete Bridge Beam-Column Connections for Seismic Performance. Clay J. Naito, Jack P. Moehle, and Khalid M. Mosalam. November 2001.
PEER 2001/07 The Rocking Spectrum and the Shortcomings of Design Guidelines. Nicos Makris and Dimitrios Konstantinidis. August 2001.
PEER 2001/06 Development of an Electrical Substation Equipment Performance Database for Evaluation of Equipment Fragilities. Thalia Agnanos. April 1999.
PEER 2001/05 Stiffness Analysis of Fiber-Reinforced Elastomeric Isolators. Hsiang-Chuan Tsai and James M. Kelly. May 2001.
PEER 2001/04 Organizational and Societal Considerations for Performance-Based Earthquake Engineering. Peter J. May. April 2001.
PEER 2001/03 A Modal Pushover Analysis Procedure to Estimate Seismic Demands for Buildings: Theory and Preliminary Evaluation. Anil K. Chopra and Rakesh K. Goel. January 2001.
PEER 2001/02 Seismic Response Analysis of Highway Overcrossings Including Soil-Structure Interaction. Jian Zhang and Nicos Makris. March 2001.
PEER 2001/01 Experimental Study of Large Seismic Steel Beam-to-Column Connections. Egor P. Popov and Shakhzod M. Takhirov. November 2000.
PEER 2000/10 The Second U.S.-Japan Workshop on Performance-Based Earthquake Engineering Methodology for Reinforced Concrete Building Structures. March 2000.
PEER 2000/09 Structural Engineering Reconnaissance of the August 17, 1999 Earthquake: Kocaeli (Izmit), Turkey. Halil Sezen, Kenneth J. Elwood, Andrew S. Whittaker, Khalid Mosalam, John J. Wallace, and John F. Stanton. December 2000.
PEER 2000/08 Behavior of Reinforced Concrete Bridge Columns Having Varying Aspect Ratios and Varying Lengths of Confinement. Anthony J. Calderone, Dawn E. Lehman, and Jack P. Moehle. January 2001.
PEER 2000/07 Cover-Plate and Flange-Plate Reinforced Steel Moment-Resisting Connections. Taejin Kim, Andrew S. Whittaker, Amir S. Gilani, Vitelmo V. Bertero, and Shakhzod M. Takhirov. September 2000.
PEER 2000/06 Seismic Evaluation and Analysis of 230-kV Disconnect Switches. Amir S. J. Gilani, Andrew S. Whittaker, Gregory L. Fenves, Chun-Hao Chen, Henry Ho, and Eric Fujisaki. July 2000.
PEER 2000/05 Performance-Based Evaluation of Exterior Reinforced Concrete Building Joints for Seismic Excitation. Chandra Clyde, Chris P. Pantelides, and Lawrence D. Reaveley. July 2000.
PEER 2000/04 An Evaluation of Seismic Energy Demand: An Attenuation Approach. Chung-Che Chou and Chia-Ming Uang. July 1999.
PEER 2000/03 Framing Earthquake Retrofitting Decisions: The Case of Hillside Homes in Los Angeles. Detlof von Winterfeldt, Nels Roselund, and Alicia Kitsuse. March 2000.
PEER 2000/02 U.S.-Japan Workshop on the Effects of Near-Field Earthquake Shaking. Andrew Whittaker, ed. July 2000.
PEER 2000/01 Further Studies on Seismic Interaction in Interconnected Electrical Substation Equipment. Armen Der Kiureghian, Kee-Jeung Hong, and Jerome L. Sackman. November 1999.
PEER 1999/14 Seismic Evaluation and Retrofit of 230-kV Porcelain Transformer Bushings. Amir S. Gilani, Andrew S. Whittaker, Gregory L. Fenves, and Eric Fujisaki. December 1999.
PEER 1999/13 Building Vulnerability Studies: Modeling and Evaluation of Tilt-up and Steel Reinforced Concrete Buildings. John W. Wallace, Jonathan P. Stewart, and Andrew S. Whittaker, editors. December 1999.
PEER 1999/12 Rehabilitation of Nonductile RC Frame Building Using Encasement Plates and Energy-Dissipating Devices. Mehrdad Sasani, Vitelmo V. Bertero, James C. Anderson. December 1999.
PEER 1999/11 Performance Evaluation Database for Concrete Bridge Components and Systems under Simulated Seismic Loads. Yael D. Hose and Frieder Seible. November 1999.
PEER 1999/10 U.S.-Japan Workshop on Performance-Based Earthquake Engineering Methodology for Reinforced Concrete Building Structures. December 1999.
PEER 1999/09 Performance Improvement of Long Period Building Structures Subjected to Severe Pulse-Type Ground Motions. James C. Anderson, Vitelmo V. Bertero, and Raul Bertero. October 1999.
PEER 1999/08 Envelopes for Seismic Response Vectors. Charles Menun and Armen Der Kiureghian. July 1999.
PEER 1999/07 Documentation of Strengths and Weaknesses of Current Computer Analysis Methods for Seismic Performance of Reinforced Concrete Members. William F. Cofer. November 1999.
PEER 1999/06 Rocking Response and Overturning of Anchored Equipment under Seismic Excitations. Nicos Makris and Jian Zhang. November 1999.
PEER 1999/05 Seismic Evaluation of 550 kV Porcelain Transformer Bushings. Amir S. Gilani, Andrew S. Whittaker, Gregory L. Fenves, and Eric Fujisaki. October 1999.
PEER 1999/04 Adoption and Enforcement of Earthquake Risk-Reduction Measures. Peter J. May, Raymond J. Burby, T. Jens Feeley, and Robert Wood.
PEER 1999/03 Task 3 Characterization of Site Response General Site Categories. Adrian Rodriguez-Marek, Jonathan D. Bray, and Norman Abrahamson. February 1999.
PEER 1999/02 Capacity-Demand-Diagram Methods for Estimating Seismic Deformation of Inelastic Structures: SDF Systems. Anil K. Chopra and Rakesh Goel. April 1999.
PEER 1999/01 Interaction in Interconnected Electrical Substation Equipment Subjected to Earthquake Ground Motions. Armen Der Kiureghian, Jerome L. Sackman, and Kee-Jeung Hong. February 1999.
PEER 1998/08 Behavior and Failure Analysis of a Multiple-Frame Highway Bridge in the 1994 Northridge Earthquake. Gregory L. Fenves and Michael Ellery. December 1998.
PEER 1998/07 Empirical Evaluation of Inertial Soil-Structure Interaction Effects. Jonathan P. Stewart, Raymond B. Seed, and Gregory L. Fenves. November 1998.
PEER 1998/06 Effect of Damping Mechanisms on the Response of Seismic Isolated Structures. Nicos Makris and Shih-Po Chang. November 1998.
PEER 1998/05 Rocking Response and Overturning of Equipment under Horizontal Pulse-Type Motions. Nicos Makris and Yiannis Roussos. October 1998.
PEER 1998/04 Pacific Earthquake Engineering Research Invitational Workshop Proceedings, May 14–15, 1998: Defining the Links between Planning, Policy Analysis, Economics and Earthquake Engineering. Mary Comerio and Peter Gordon. September 1998.
PEER 1998/03 Repair/Upgrade Procedures for Welded Beam to Column Connections. James C. Anderson and Xiaojing Duan. May 1998.
PEER 1998/02 Seismic Evaluation of 196 kV Porcelain Transformer Bushings. Amir S. Gilani, Juan W. Chavez, Gregory L. Fenves, and Andrew S. Whittaker. May 1998.
PEER 1998/01 Seismic Performance of Well-Confined Concrete Bridge Columns. Dawn E. Lehman and Jack P. Moehle. December 2000.

ONLINE REPORTS
The following PEER reports are available by Internet only at http://peer.berkeley.edu/publications/peer_reports.html
PEER 2012/102 Procedure to Restart an Interrupted Hybrid Simulation: Addendum to PEER Report 2010/103. Vesna Terzic and Bozidar Stojadinovic. October 2012.
PEER 2012/101 Mechanics of Fiber Reinforced Bearings. James M. Kelly and Andrea Calabrese. February 2012.
PEER 2011/107 Nonlinear Site Response and Seismic Compression at Vertical Array Strongly Shaken by 2007 Niigata-ken Chuetsu-oki Earthquake. Eric Yee, Jonathan P. Stewart, and Kohji Tokimatsu. December 2011.
PEER 2011/106 Self Compacting Hybrid Fiber Reinforced Concrete Composites for Bridge Columns. Pardeep Kumar, Gabriel Jen, William Trono, Marios Panagiotou, and Claudia Ostertag. September 2011.
PEER 2011/105 Stochastic Dynamic Analysis of Bridges Subjected to Spacially Varying Ground Motions. Katerina Konakli and Armen Der Kiureghian. August 2011.
PEER 2011/104 Design and Instrumentation of the 2010 E-Defense Four-Story Reinforced Concrete and Post-Tensioned Concrete Buildings. Takuya Nagae, Kenichi Tahara, Taizo Matsumori, Hitoshi Shiohara, Toshimi Kabeyasawa, Susumu Kono, Minehiro Nishiyama (Japanese Research Team) and John Wallace, Wassim Ghannoum, Jack Moehle, Richard Sause, Wesley Keller, Zeynep Tuna (U.S. Research Team). June 2011.
PEER 2011/103 In-Situ Monitoring of the Force Output of Fluid Dampers: Experimental Investigation. Dimitrios Konstantinidis, James M. Kelly, and Nicos Makris. April 2011.
PEER 2011/102 Ground-motion prediction equations 1964 - 2010. John Douglas. April 2011.
PEER 2011/101 Report of the Eighth Planning Meeting of NEES/E-Defense Collaborative Research on Earthquake Engineering. Convened by the Hyogo Earthquake Engineering Research Center (NIED), NEES Consortium, Inc. February 2011.
PEER 2010/111 Modeling and Acceptance Criteria for Seismic Design and Analysis of Tall Buildings. Task 7 Report for the Tall Buildings Initiative - Published jointly by the Applied Technology Council. October 2010.
PEER 2010/110 Seismic Performance Assessment and Probabilistic Repair Cost Analysis of Precast Concrete Cladding Systems for Multistory Buildlings. Jeffrey P. Hunt and Božidar Stojadinovic. November 2010.
PEER 2010/109 Report of the Seventh Joint Planning Meeting of NEES/E-Defense Collaboration on Earthquake Engineering. Held at the E-Defense, Miki, and Shin-Kobe, Japan, September 18–19, 2009. August 2010.
PEER 2010/108 Probabilistic Tsunami Hazard in California. Hong Kie Thio, Paul Somerville, and Jascha Polet, preparers. October 2010.
PEER 2010/107 Performance and Reliability of Exposed Column Base Plate Connections for Steel Moment-Resisting Frames. Ady Aviram, Božidar Stojadinovic, and Armen Der Kiureghian. August 2010.
PEER 2010/106 Verification of Probabilistic Seismic Hazard Analysis Computer Programs. Patricia Thomas, Ivan Wong, and Norman Abrahamson. May 2010.
PEER 2010/105 Structural Engineering Reconnaissance of the April 6, 2009, Abruzzo, Italy, Earthquake, and Lessons Learned. M. Selim Günay and Khalid M. Mosalam. April 2010.
PEER 2010/104 Simulating the Inelastic Seismic Behavior of Steel Braced Frames, Including the Effects of Low-Cycle Fatigue. Yuli Huang and Stephen A. Mahin. April 2010.
PEER 2010/103 Post-Earthquake Traffic Capacity of Modern Bridges in California. Vesna Terzic and Božidar Stojadinović. March 2010.
PEER 2010/102 Analysis of Cumulative Absolute Velocity (CAV) and JMA Instrumental Seismic Intensity (IJMA) Using the PEER–NGA Strong Motion Database. Kenneth W. Campbell and Yousef Bozorgnia. February 2010.
PEER 2010/101 Rocking Response of Bridges on Shallow Foundations. Jose A. Ugalde, Bruce L. Kutter, and Boris Jeremic. April 2010.
PEER 2009/109 Simulation and Performance-Based Earthquake Engineering Assessment of Self-Centering Post-Tensioned Concrete Bridge Systems. Won K. Lee and Sarah L. Billington. December 2009.
PEER 2009/108 PEER Lifelines Geotechnical Virtual Data Center. J. Carl Stepp, Daniel J. Ponti, Loren L. Turner, Jennifer N. Swift, Sean Devlin, Yang Zhu, Jean Benoit, and John Bobbitt. September 2009.
PEER 2009/107 Experimental and Computational Evaluation of Current and Innovative In-Span Hinge Details in Reinforced Concrete Box-Girder Bridges: Part 2: Post-Test Analysis and Design Recommendations. Matias A. Hube and Khalid M. Mosalam. December 2009.
PEER 2009/106 Shear Strength Models of Exterior Beam-Column Joints without Transverse Reinforcement. Sangjoon Park and Khalid M. Mosalam. November 2009.
PEER 2009/105 Reduced Uncertainty of Ground Motion Prediction Equations through Bayesian Variance Analysis. Robb Eric S. Moss. November 2009.
PEER 2009/104 Advanced Implementation of Hybrid Simulation. Andreas H. Schellenberg, Stephen A. Mahin, Gregory L. Fenves. November 2009.
PEER 2009/103 Performance Evaluation of Innovative Steel Braced Frames. T. Y. Yang, Jack P. Moehle, and Božidar Stojadinovic. August 2009.
PEER 2009/102 Reinvestigation of Liquefaction and Nonliquefaction Case Histories from the 1976 Tangshan Earthquake. Robb Eric Moss, Robert E. Kayen, Liyuan Tong, Songyu Liu, Guojun Cai, and Jiaer Wu. August 2009.
PEER 2009/101 Report of the First Joint Planning Meeting for the Second Phase of NEES/E-Defense Collaborative Research on Earthquake Engineering. Stephen A. Mahin et al. July 2009.
PEER 2008/104 Experimental and Analytical Study of the Seismic Performance of Retaining Structures. Linda Al Atik and Nicholas Sitar. January 2009.
PEER 2008/103 Experimental and Computational Evaluation of Current and Innovative In-Span Hinge Details in Reinforced Concrete Box-Girder Bridges. Part 1: Experimental Findings and Pre-Test Analysis. Matias A. Hube and Khalid M. Mosalam. January 2009.
PEER 2008/102 Modeling of Unreinforced Masonry Infill Walls Considering In-Plane and Out-of-Plane Interaction. Stephen Kadysiewski and Khalid M. Mosalam. January 2009.
PEER 2008/101 Seismic Performance Objectives for Tall Buildings. William T. Holmes, Charles Kircher, William Petak, and Nabih Youssef. August 2008.
PEER 2007/101 Generalized Hybrid Simulation Framework for Structural Systems Subjected to Seismic Loading. Tarek Elkhoraibi and Khalid M. Mosalam. July 2007.
PEER 2007/100 Seismic Evaluation of Reinforced Concrete Buildings Including Effects of Masonry Infill Walls. Alidad Hashemi and Khalid M. Mosalam. July 2007.

The Pacific Earthquake Engineering Research Center (PEER) is a multi-institutional research and education center with headquarters at the University of California, Berkeley. Investigators from over 20 universities, several consulting companies, and researchers at various state and federal government agencies contribute to research programs focused on performance-based earthquake engineering.
These research programs aim to identify and reduce the risks from major earthquakes to life safety and to the economy by including research in a wide variety of disciplines including structural and geotechnical engineering, geology/seismology, lifelines, transportation, architecture, economics, risk management, and public policy.
PEER is supported by federal, state, local, and regional agencies, together with industry partners.
PEER Core Institutions:University of California, Berkeley (Lead Institution)
California Institute of TechnologyOregon State University
Stanford UniversityUniversity of California, DavisUniversity of California, Irvine
University of California, Los AngelesUniversity of California, San DiegoUniversity of Southern California
University of Washington
PEER reports can be ordered at http://peer.berkeley.edu/publications/peer_reports.html or by contacting
Pacific Earthquake Engineering Research CenterUniversity of California, Berkeley325 Davis Hall, mail code 1792
Berkeley, CA 94720-1792Tel: 510-642-3437Fax: 510-642-1655
Email: [email protected]
ISSN 1547-0587X