P. ROBOUCH, E. BULSKA, S. DUTA, M. LAUWAARS, I....
105
TrainMiC - Training in Metrology in Chemistry P. ROBOUCH, E. BULSKA, S. DUTA, M. LAUWAARS, I. LEITO, N. MAJCEN, J. NORGAARD, M. SUCHANEK, E. VASSILEVA and P. TAYLOR (project leader) Report EUR 20841 EN Training in Metrology in Chemistry
Transcript of P. ROBOUCH, E. BULSKA, S. DUTA, M. LAUWAARS, I....

TrainMiC - Training inMetrology in Chemistry
P. ROBOUCH, E. BULSKA, S. DUTA,M. LAUWAARS, I. LEITO, N. MAJCEN,
J. NORGAARD, M. SUCHANEK, E. VASSILEVAand P. TAYLOR (project leader)
Report EUR 20841 EN
Training in Metrology in Chemistry

The mission of IRMM is to promote a common European measurement system in support of EUpolicies, especially health and consumer protection, environment, agriculture, internal market andindustrial standards.
European CommissionDirectorate-General Joint Research CentreInstitute for Reference Materials and Measurements
Contact informationPiotr RobouchEuropean CommissionDirectorate-General Joint Research CentreInstitute for Reference Materials and MeasurementsRetiesewegB-2440 Geel • Belgium
E-mail: [email protected]
Tel.: +32 (0)14 57 19 80Fax: +32 (0)14 58 42 73
http://www.irmm.jrc.behttp://www.jrc.cec.eu.int
Legal NoticeNeither the European Commission nor any person acting on behalf of the Commission isresponsible for the use which might be made of the following information.
A great deal of additional information on the European Union is available on the Internet.It can be accessed through the Europa serverhttp://europa.eu.int
EUR Report 20841 ENLuxembourg: Office for Official Publications of the European Communities
ISBN 92-894-6238-8
© European Communities, 2003
Reproduction is authorised provided the source is acknowledged
Printed in Belgium

www.trainmic.org
EUR 20841 EN - 1 -
EUROMET/EURACHEM Project 693
Support Programme forMetrology in Chemistry
in EU Candidate Countries
The following authors prepared this report and the included training material:
- Philip TAYLOR, EC-JRC-IRMM (Project Leader)- Piotr ROBOUCH, EC-JRC-IRMM (Project Co-ordinator)
- Ewa BULSKA, Warsaw University, Faculty of Chemistry, Poland- Steluta DUTA, National Institute of Metrology, Bucharest, Romania- Margreet LAUWAARS, EC-JRC-IRMM- Ivo LEITO, University of Tartu, Estonia- Nineta MAJCEN, Metrology Institute of the Republic of Slovenia, MIRS,
Ljubljana, Slovenia- Jorgen NORGAARD, EC-JRC-IRMM- Miloslav SUCHANEK, Institute of Chemical Technology, Prague,
Czech Republic- Emilia VASSILEVA, University of Sofia, Bulgaria
Training in Metrology in Chemistry

www.trainmic.org
EUR 20841 EN - 2 -
From February 2001 to August 2003:
Abstract
A common understanding of issues related to measurement science appliedto chemistry is essential among European member states and acceding-candidate countries. An education platform was therefore created to respondto this challenge: TrainMiC, Training in Metrology in Chemistry.
After a brief presentation of TrainMiC and an overview of TrainMiC events,this report provides the complete set of the training material. The sevenmodules are included in the Appendix.
17 eventsin 8 countries =794 participants

www.trainmic.org
EUR 20841 EN - 3 -
Table of Contents
1. What is TrainMiC?
2. Mission, Vision and Credo
3. Description of the TrainMiC Modules
4. Past and next future of TrainMiC
Appendix: The Training Material
Module 1 = General Introduction to Metrology in Chemistry
Module 2 = Validation of Measurement Procedures
Module 3 = Traceability of Measurement Results
Module 4 = Uncertainty of Measurement Results
Module 5 = Applied Statistics
Module 6 = Use of Reference Materials
Module 7 = Inter-Laboratory Comparisons
List of Abbreviations
Glossary
Bibliography

www.trainmic.org
EUR 20841 EN - 4 -
1. What is TrainMiC?
Today’s society relies on a proper measurement infrastructure, e.g. to realisethe EU internal market and enable international trade, to implementregulations to, guarantee consumer protection, to support scientific research...
Key players in such an infrastructure are measurement service providers(national metrology institutes, national and community reference laboratories,inspection and control laboratories…), national accreditation bodies, andorganisations responsible for education & training.
IRMM is the metrology institute of the European Commission. The mission ofIRMM is to promote a common European measurement system in support ofEuropean Union policies. IRMM launched in 2001 its Metrology in Chemistrysupport programme for EU candidate countries in support of enlargement.One of the initiatives of the support programme is TrainMiC. TrainMiC hasbeen set up as a training platform for people out of all types of organisations.Via the TrainMiC platform, a set of training modules has been constructed thatprovides understanding in basic measurement matters, that applyacross sectors (food, environment, clinical…). It offers interpretation ofexisting documents and gives guidance by making available concreteexamples. The training material strives towards a congruent and up-to-date view (e.g. regarding uncertainty, traceability of measurements).
The target audience for such courses is:
� Measurement practitioners from laboratories
� Technical assessors involved in accreditation
� End-users of measurement data (e.g. from public bodies, enforcementagencies ...)
The training courses are organised by the local partners, such as NMIs,universities or accreditation bodies, in collaboration with the IRMM.

www.trainmic.org
EUR 20841 EN - 5 -
Why should I participate in TrainMiC?Better quality measurement results can be obtained if the people producingthese results have insight into basic measurement issues. This is why theISO/IEC 17025 requires the laboratory to address measurement traceability,uncertainty and validation. The course will help you to do this.
Who should attend TrainMiC courses?Laboratory managers, analysts or anyone responsible for the quality of theanalytical results.
What do I benefit from attending a TrainMiC course?During the training course you will be taught how to:- Validate measurement procedures;- Establish and demonstrate traceability of measurement results;- Estimate measurement uncertainty based on the Guide to the Expression
of Uncertainty in Measurements (GUM) and basic statistics supportingthese;
- Use properly reference materials- Interpret the outcome of inter-laboratory comparisons.
Questions after attending a TrainMiC course?IRMM staff is available to answer questions via the email [email protected] The TrainMiC web site (www.trainmic.org) can also act asa source of information for your questions.

www.trainmic.org
EUR 20841 EN - 6 -
2. Mission, Vision and Credo
Our Actions� TrainMiC events, using approved TrainMiC trainers and course materials;� National events with TrainMiC materials and additional lecturers and
complementary modules� Dedicated training of TrainMiC trainers
Our VisionWe want TrainMiC to be a European high qualityshareware product/process for training in genericissues related to the measurement science inchemical measurements (metrology in chemistry).
Our Values� Realism just do what you can, it will never be perfect;
the truth can only be approximated
� Transparancy document in an open and complete way
� Being critical
� Standardised we use a similar terminology and practicesterminology across disciplines & sectors, based on VIM
and ISO-GUM wherever possible
Our MissionOur purpose is to facilitate the training about metrology inchemistry to interested parties, such as metrologyorganisations, educators, decision-makers and accreditors, inorder to strengthen the measurement infrastructure. Hence, thetrustworthy results produced would then avoid economic orsocietal wastes.

www.trainmic.org
EUR 20841 EN - 7 -
Our StrategyTrainMiC is run in a distributed way, with national metrology institutes,selected academic faculties and national accreditation bodies together withtheir regional organisations EUROMET/EURACHEM and EA.The TrainMiC management board, chaired by the IRMM, consists of theproject leader, a project co-ordinator and one representative peracceding/candidate country, originating from the academia, accreditationbodies or metrology institutes. The board sets the TrainMiC policies, createsand controls the processes (e.g. the type of training courses) and the products(e.g. the course content).Members of TrainMiC management board are called ambassadors. Theirtask it is to coordinate all TrainMiC activities at the national level and refer tothe management board regarding ongoing courses, course content, newneeds, etc. The list of ambassadors can be found on the TrainMiC web site(www.trainmic.org).Training is performed using the TrainMiC material that has been reviewed,approved and edited by the board with the TrainMiC logo on each slide(cf. Appendix).Hard copies of the authorised training material are distributed to the trainingparticipants. The TrainMiC website contains some ‘appetiser’ extracts of thecourse and not the complete material, as we want attendants to follow andactively participate to this interactive course.The TrainMiC modules will be translated, when necessary, in locallanguages, under the responsibility of the ambassador.TrainMiC trainers are proposed by the ambassador, selected and authorisedby the board. The board organises training sessions for trainers.Certificates for participation to TrainMiC courses are awarded via theTrainMiC board, stating the modules that were followed.The TrainMiC logo can be used on the invitation to events, only when:
- at least one authorised TrainMiC module is presented and- the ambassador is responsible for the scientific programme of the
specific event.Such event may contain complementary presentations addressing the needsof specific audiences, without the TrainMiC logo.TrainMiC courses are organised at the national/regional level by a local hostorganisation, which is responsible for all practical arrangements (selection ofparticipants and logistics). This organiser can request sponsoring from IRMMfor this activity. Additionally, it can decide to charge a participation fee, so asto secure a self-sustaining operation.
Our major assets
- Well established contacts with the major Nationalstakeholders, such as academia, national metrologyinstitutes and accreditation bodies.
- Structured and coherent course material- Experienced trainers- Efficient national logistics and infrastructure

www.trainmic.org
EUR 20841 EN - 8 -
3. Description of the TrainMiC modules
3.1 General Introduction to Metrology in Chemistry.Quality of chemical measurements is an important issue in today’s world influencingquality of life, border-cross trade and commerce. On an international scale, the worldof chemical measurements is undergoing major changes. Since a decade initiativeshave been taken at an international level and across the measurement sectors toensure that the measurement science issues are applied in a systematic way. This isdone to improve the quality of chemical measurement results and thus make themacceptable everywhere. Only in recent years have the principles of measurementscience (metrology) in chemistry received the attention they should. This does notreplace the need for many aspects of quality assurance, but compliments this, i.e.bringing a solid foundation to build on.In the past, emphasis has been nearly exclusively on quality management systemsand accreditation. Today, the spotlight is finally back on the basics in measurementscience. TrainMiC applies the principles of the International Vocabulary of basic andgeneral terms in Metrology, VIM (ISO, 1993, ISBN 92-67-01075-1) and the Guide tothe Expression of Uncertainty in Measurements, GUM (ISO, 1993, ISBN 92-67-10188-9).
3.2 Validation of Measurement ProceduresValidation of a measurement procedure can be regarded as one of the mostimportant parts of the every day laboratory work. In choosing the most promisingcandidate method, one should consider the expertise in the laboratory, whether it isused routinely and whether the chosen method is fit for the intended purpose.Validation of the measurement procedure increases confidence for users of themeasurement procedure and measurement results, and provides information onprocedure performance characteristics. According to ISO/IEC 17025 the confirmationof validated procedures is required.
3.3 Traceability of Measurement ResultsIn this module, various issues concerning traceability of chemical measurementresults are addressed. According to VIM, “traceability” means “properties of the resultof a measurement or the value of a standard whereby it can be related to statedreferences, usually national or international standards, through an unbroken chain ofcomparisons all having stated uncertainties”. Therefore, every link in the traceabilitychain should consist of comparisons that are measurements in accordance with theabove-proposed meanings, which include the validation of the measurementprocedure and the use of reference materials. Not all-chemical measurements are, orshould be, traceable to the mole. Other stated references are accepted as well.
3.4 Uncertainty of Measurement ResultsMeasurement uncertainty is an important ISO/IEC 17025 requirement. This moduleexplains and demystifies the approach of the ISO-GUM (Guide to expression ofuncertainty in measurement) to estimate and report the uncertainty of ameasurement result obtained following a specific measurement procedure. A cleardescription of all steps needed for uncertainty evaluation is presented with therespective examples.

www.trainmic.org
EUR 20841 EN - 9 -
3.5 Applied StatisticsThe aim of this module is to focus on the few statistical tools that are required for theuncertainty evaluation and the interpretation of inter-laboratory comparisons (ILC).The following topics are presented: average, standard deviation, populationdistribution (normal, rectangular and triangular), law of uncertainty propagation, typeof uncertainties (A and B) and scoring of ILC. The proper understanding of theseissues is essential to achieve a correct evaluation of the “combined uncertainty”compliant with GUM. Several examples are discussed in detail.
3.6 Use of Reference MaterialsIn this module, definition, types of CRMs, their production and use are discussed andcritically evaluated, again with a number of examples. The properties of differentCRMs: pure substance for calibration, pure substance for matrix matching as well asmatrix CRMs are discussed. Several comments on the production procedure andrequirement are given as it is assumed that the user of CRMs should be aware of thefact that making CRMs is not a trivial task, but takes skills and proper installations.The user should know how to look for the most appropriate CRMs and should beaware that producers should provide respective information on traceability, whichshould be stated and demonstrated. It is concluded that a high quality CRM shouldhave a stated traceability of the certified value, state an ISO-GUM uncertainty of thecertified value, both should be demonstrated, and preferably be produced accordingto a method described under ISO-35.
3.7 Inter-Laboratory ComparisonsThe aim of this module is to focus on the different kinds of inter-laboratorycomparisons (ILCs) and/or proficiency tests (PTs). The goal is to demonstrate thatparticipating to ILCs or PTs enables to demonstrate ability to measure and shouldlead to improved quality of results. The results from ILCs or PTs are of crucialinterest for laboratories as these provide clear information of its ability to demonstratereliable results to its customers. It would be pointed out that the participation is eithervoluntary or forced by external requirements (e.g. legal, accreditation, controlbodies). Most ILCs and PT schemes involve comparison of participants results withan assigned value, which has been delivered by a reference laboratory, a sub-groupof participants, consensus from the overall population of test results or by some othermeans. Corrective actions after participation to ILCs are also briefly discussed.

www.trainmic.org
EUR 20841 EN - 10 -
4. Past and next future of TrainMiC
The workshop “Improving the Scientific Base for Metrology in Chemistry (MIC)in EU Accession Countries” organised in February 2001 by the IRMM, initiatedthe TrainMiC concept. Renowned speakers representing establishedorganisations in the field of metrology in chemistry gave plenary presentations.Several working group discussions followed [J.V. Norgaard, I. Papadakis, P.Taylor Accred Qual Assur 6 (2001) 443]. Accession/Candidates Countryrepresentatives from the academia, accreditation bodies and metrologyinstitutes expressed their needs and expectations in the field of MiC. One ofthe conclusions was the need to improve the knowledge transfer of the basicMiC concepts - already implemented in the ISO/IEC 17025 - to the laboratorypractitioners. The following key words were frequently cited: measurementuncertainty, traceability of a measurement result, validation of measurementprocedure and the proper use of certified reference materials. The differentingredients of the TrainMiC curricula were defined.The first TrainMiC event was held in September 2001 at Sinaia, Romania.Several speakers from different organisations were invited to lecture on theabove topics. This interdisciplinary course was appreciated and well perceivedby the participants, thus confirming the expectations expressed earlier in Geel.The next task was to prepare a structured and coherent training material to besystematically presented and distributed to participants.Two brainstorming retreats of several authors in Dendermonde and Mechelen(Belgium) resulted in a set of “TrainMiC” slides that were used throughout thedifferent 2002 courses and constantly refined.
TrainMiC’s table of past eventsDate City Country
17 19-20/06/2003 Plovdiv Bulgaria
16 11-13/05/2003 Antwerpen Belgium for EA technicalAssessors
15 24-25/04/2003 Ljubljana Slovenia14 17-18/03/2003 Bucharest Romania13 03-04/03/2003 Ljubljana Slovenia12 26-27/11/2002 Warsaw Poland11 21-22/11/2002 Nicosia Cyprus10 07-08/11/2002 Nicosia Cyprus9 04/09/2002 Blagoevgrad Bulgaria8 20-21/06/2002 Warsaw Poland7 03-05/06/2002 Vilnius Lithuania6 17/12/2001 Sofia Bulgaria5 06/12/2001 Prague Czech Republic4 14-16/11/2001 Ljubljana Slovenia3 05/11/2001 Warsaw Poland2 11-13/10/2001 Maribor Slovenia1 16-19/09/2001 Sinaia Romania
12-13/02/2001 Geel Belgium kickoff meeting

www.trainmic.org
EUR 20841 EN - 11 -
The first standardised version of the TrainMiC book was presented at theWarsaw event in November 2002. The “traceability” and “validation” moduleswere not included, as they required further refinement.The complete course material was provided to the European Accreditation(EA) technical assessors in May 2003, and to Bulgarian participants in June2003. The final version of seven modules is presented in the Appendix.Till August 2003, seventeen TrainMiC events were organised in eightcountries, thus reaching 794 participants from many different analyticalsectors. The final objective is to arrange two courses per year per country,thus resulting in approximately 20 events per year.Such an ambitious program requires the recruitment of additional trainers.National trainers were selected to palliate for any language problems duringthe lectures. When necessary, the modules included in this report will betranslated in various languages. The Polish, Bulgarian and Romanianversions are being prepared. TrainMiC courses in local (non-English)languages will be available in 2004.While TrainMiC is successfully propagating in the new acceding countries,new modules are under development, i.e. one about “sampling” and one onthe “interpretation of reported uncertainty”.
TrainMiC events remaining for 2003
Date City Country21 19-20/11/03 Warsaw Poland20 05-06/11/03 Budapest Hungary19 09-10/10/03 Warsaw Poland18 23-24/09/03 Veliko Tarnovo Bulgaria

www.trainmic.org
EUR 20841 EN

www.trainmic.org
EUR 20841 EN
- 1 -General Introduction toMetrology in Chemistry
Slide 1
TrainMiCTra in in g in Me t ro logy in Ch e m is t ry
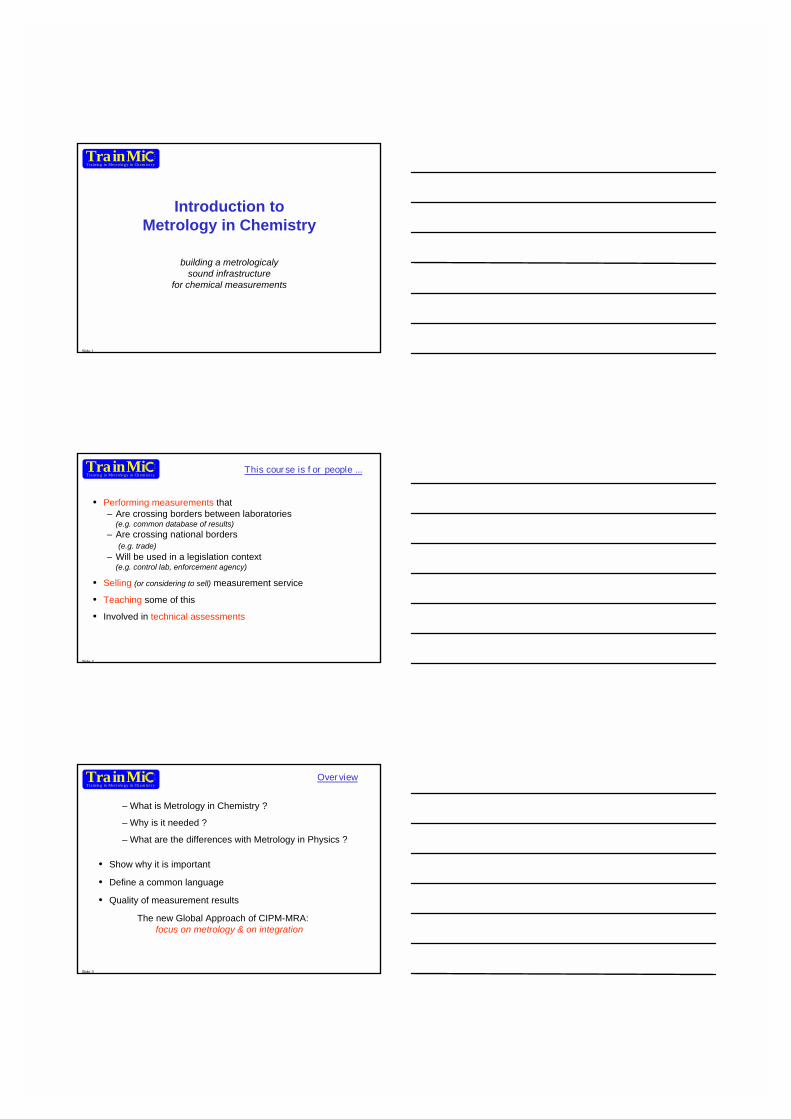
Introduction toMetrology in Chemistry
building a metrologicalysound infrastructure
for chemical measurements
Slide 2
TrainMiCTra in in g in Me t ro logy in Ch e m is t ry
• Performing measurements that– Are crossing borders between laboratories
(e.g. common database of results)– Are crossing national borders
(e.g. trade)– Will be used in a legislation context
(e.g. control lab, enforcement agency)
• Selling (or considering to sell) measurement service
• Teaching some of this
• Involved in technical assessments
This course is for people ...
Slide 3
TrainMiCTra in in g in Me t ro logy in Ch e m is t ry
Overview
• Show why it is important
• Define a common language
• Quality of measurement results
The new Global Approach of CIPM-MRA: focus on metrology & on integration
– What is Metrology in Chemistry ?
– Why is it needed ?
– What are the differences with Metrology in Physics ?

Slide 4
TrainMiCTra in in g in Me t ro logy in Ch e m is t ry
Metrology = Science of Measurements
Is about understanding the measurement procedure
(not about measuring with smallest achievable uncertainty)
Slide 5
TrainMiCTra in in g in Me t ro logy in Ch e m is t ry
Modern societies use measurements
• in technology• in trade• when making regulations
(about 40% EU directives involve measurements)
Metrology is important
and the EC supports it!
Slide 6
TrainMiCTra in in g in Me t ro logy in Ch e m is t ry
Approach in Analytical Chemistry
Traditional Metrological
Some principles :• remain the same ...• some are improved !• some are changed !
Slide 7
TrainMiCTra in in g in Me t ro logy in Ch e m is t ry
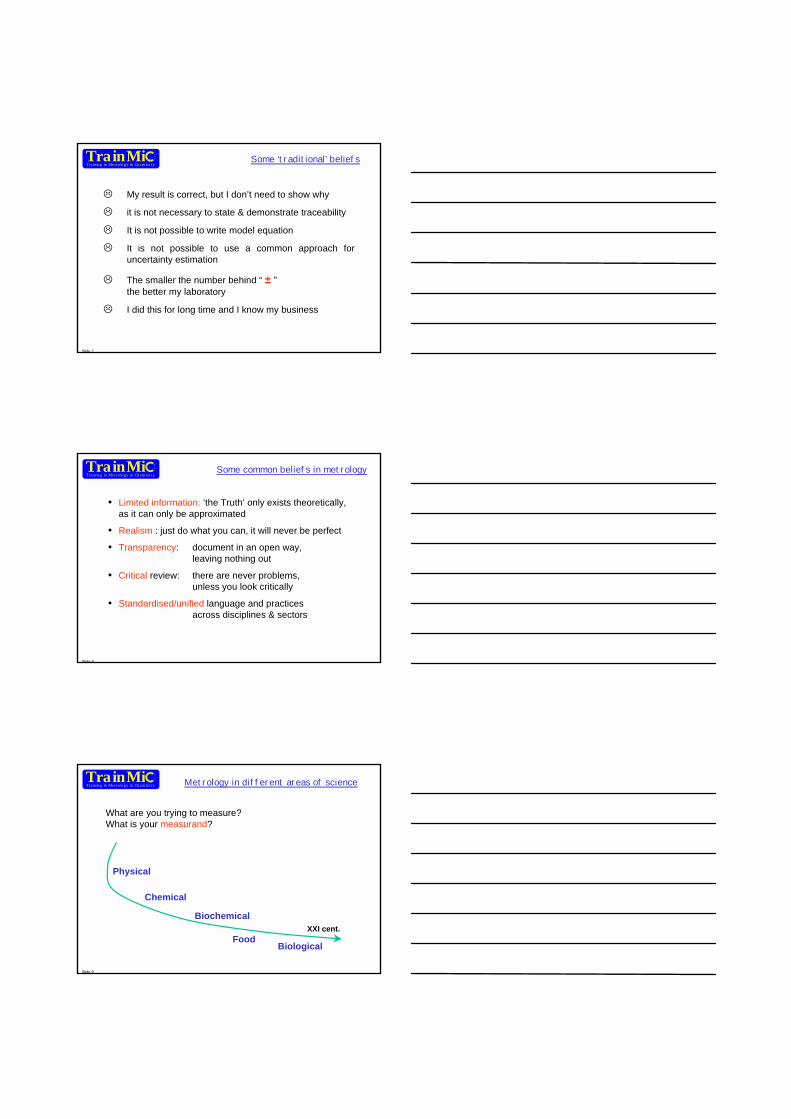
Some ‘traditional’ beliefs
� My result is correct, but I don’t need to show why
� it is not necessary to state & demonstrate traceability
� It is not possible to write model equation
� It is not possible to use a common approach foruncertainty estimation
� The smaller the number behind “ ± ”the better my laboratory
� I did this for long time and I know my business
Slide 8
TrainMiCTra in in g in Me t ro logy in Ch e m is t ry
Some common beliefs in metrology
• Limited information: ‘the Truth’ only exists theoretically,as it can only be approximated
• Realism : just do what you can, it will never be perfect
• Transparency: document in an open way,leaving nothing out
• Critical review: there are never problems,unless you look critically
• Standardised/unified language and practicesacross disciplines & sectors
Slide 9
TrainMiCTra in in g in Me t ro logy in Ch e m is t ry Metrology in different areas of science
Physical
Chemical
Biochemical
Biological
What are you trying to measure?What is your measurand?
XXI cent.Food

Slide 10
TrainMiCTra in in g in Me t ro logy in Ch e m is t ry
Metrology, a unified view
• Uncertainty expresses intrinsic reliability of the result
• ISO-GUM � Common way of estimating uncertainty
• Avoid sector-specific terms (such as ‘intermediateprecision’, in-between-method precision, etc …)
Laboratory provides results to Customer/Client
Result = value ± uncertainty
Slide 11
TrainMiCTra in in g in Me t ro logy in Ch e m is t ry
Metrology in Chemistry
� Tracing measurements to somelocal measurement standard issufficient
� Every sector decides on how toexpress reliability
� Repeating measurements givesall the needed information
� State, establish and demonstratetraceability
� GUM uncertainty �standardisedapproach across sectors
� Reliability is not improved just byrepeating measurements
Slide 12
TrainMiCTra in in g in Me t ro logy in Ch e m is t ry
Metrology in Chemistry
1. Is related to the fundamentals of analytical chemistry
2. Is needed to obtain good quality measurement results
3. Is the responsibility of every laboratory performing the
measurement

Slide 13
TrainMiCTra in in g in Me t ro logy in Ch e m is t ry
Metrology inPhysics v.s. Chemistry
MiP : Often relies on direct-measurements� to a large extent “sample-independent”
(length, mass, temperature, ...)
MiC : various factors affect the quality of results� strongly “sample-dependent”
Concentration of Cd in..� sea water� soils� blood� infant food
Slide 14
TrainMiCTra in in g in Me t ro logy in Ch e m is t ry
Metrology inPhysics v.s. Chemistry
MiP : Measurement = comparing a quantity (e.g. temperature), � relate to a unit (e.g. K)
Major Impact: (equipment) calibration
MiC : Chemical Measurement =comparing a quantity of analyte (e.g. [DDT] in milk),
� relate to a unit (e.g. mol/kg; mg/kg)
Major impact:sampling, DDT extraction, calibration solutions,matrix digestion, and… (equipment) calibration
Slide 15
TrainMiCTra in in g in Me t ro logy in Ch e m is t ry
Basic Glossary
‘Measurement’ : determining a value of a quantity
‘Measurand’ : what you try to measure
‘Analyte’ : the compound, species you measure
‘Model’ : the equation you use to calculate your final result(you always use one!). This model is an (approximating) description of reality
[VIM, 1993]

Slide 16
TrainMiCTra in in g in Me t ro logy in Ch e m is t ry Common language
Quantity Analyte Measurand Unit Stated Reference
Concentration DDT CDDT in soil ng/L SI
Amount Content Pbw(Pb) in
waste water ng/kg SI
Count E.Coli number of E.Coli/surface m-2 SI
Activity Amilase A(Amilase) Katal SI
pH pH unit pH scale
Hardness Mohs hardness Mohs scale
Octane index Octane number
Octane number scale
H+ ions c(H+) in drinking water
Slide 17
TrainMiCTra in in g in Me t ro logy in Ch e m is t ry A measurement in chemistry involves ...
� Sample Preparation in the laboratory(sampling, digestion, pre-concentration, separation,dilution, …)
� Calibration
� (Instrumental) Measurements
� Critical Data Evaluation
� Result Reporting: value ±±±± uncertainty
Slide 18
TrainMiCTra in in g in Me t ro logy in Ch e m is t ry
Quality of chemicalmeasurement results today
� A claim is not a demonstrated proof !
� Do not only look at systems & processes(e.g. quality management system,writtenstandards), but also at RESULTS

Slide 19
TrainMiCTra in in g in Me t ro logy in Ch e m is t ry
… some ‘traditional’ simplistic conceptson the road to better quality chemical measurements !
• …if you use a quality management system in your lab,you automatically get better quality results …
• if you use written standards, you automatically get betterquality results …
• if you use a CRM, you automatically get better qualityresults …
WRONG Conclusions
Slide 20
TrainMiCTra in in g in Me t ro logy in Ch e m is t ry
EC Directive 2001/22EC Regulation 2676/90EC Regulation 466/2001
� threshold value of 0.2 mg Pb /Kg
Lead concentration in Wine (IMEP-16)
Slide 21
TrainMiCTra in in g in Me t ro logy in Ch e m is t ry
13.6
16.3
19.0
21.7
24.5
27.2
29.9
32.6
35.3
38.1
40.8
-50
-40
-30
-20
-10
0
10
20
30
40
50
Pb amount content
Results from all participants
IMEP- 16: Pb in wineCertified value : 27.18 ± 0.25 µg·L-1 [U =k ·u c (k =2)]
5 'less than' values11 values
below -50%
28 valuesabove 50%
±50%

Slide 22
TrainMiCTra in in g in Me t ro logy in Ch e m is t ry
13,6
16,3
19,0
21,7
24,5
27,2
29,9
32,6
35,3
38,1
40,8
c
µ
g·L-1
-50
-40
-30
-20
-10
0
10
20
30
40
50
Dev
iatio
n fr
om th
e ce
rtifi
ed v
alue
in %
Experienced (self-declaration)
Less/non experienced (self-declaration)
No statement
Pb
g [ ( )]
Experienced 7
Less/non experienced 3
No statement 1
Values below -50%
Experienced 14
Less/non experienced 11
No statement 3
Values above 50%
Experienced 4
Less/non experienced 1
No statement
'Less than' value
Experienced – Not Experienced
Slide 23
TrainMiCTra in in g in Me t ro logy in Ch e m is t ry
13.6
16.3
19.0
21.7
24.5
27.2
29.9
32.6
35.3
38.1
40.8
c
µ
g·L-1
-50
-40
-30
-20
-10
0
10
20
30
40
50
Dev
iatio
n fr
om th
e ce
rtifi
ed v
alue
in %
EN45000 and/or ISO25
Other quality management system
No quality management system or no info
Pb
µg [ c ( )]
Quality management
system
Values below -50%
EN45000, ISO25 8Other 1None or no info 2
Quality management
system
Values above 50%
EN45000, ISO25 13Other 4None or no info 11
Quality management
system
'Less than' va lue
EN45000, ISO25 3Other 2
With – W/O Quality System
Slide 24
TrainMiCTra in in g in Me t ro logy in Ch e m is t ry
13.59
16.31
19.03
21.74
24.46
27.18
29.90
32.62
35.33
38.05
40.77
-50
-40
-30
-20
-10
0
10
20
30
40
50
EAT * ET-AAS F-AAS ICP-ES ICP-MS IDMS OTHERPb
* Electrochemical analytical techniques
Analytical technique
Values below -50%
EAT* 1ET-AAS 6F-AAS 1ICP-MS 1
None given 1OTHER 1
Analytical technique
Values above 50%
EAT* 3ET-AAS 11F-AAS 2ICP-ES 7
None given 2OTHER 3
Analytical technique
'Less than'
valuesET-AAS 1F-AAS 4
Depends on analytical technique used?
Slide 25
TrainMiCTra in in g in Me t ro logy in Ch e m is t ry
13.59
16.31
19.03
21.74
24.46
27.18
29.90
32.62
35.33
38.05
40.77
c
µ
g·L-1
-50
-40
-30
-20
-10
0
10
20
30
40
50
Dev
iatio
n fr
om th
e ce
rtifi
ed v
alue
in %
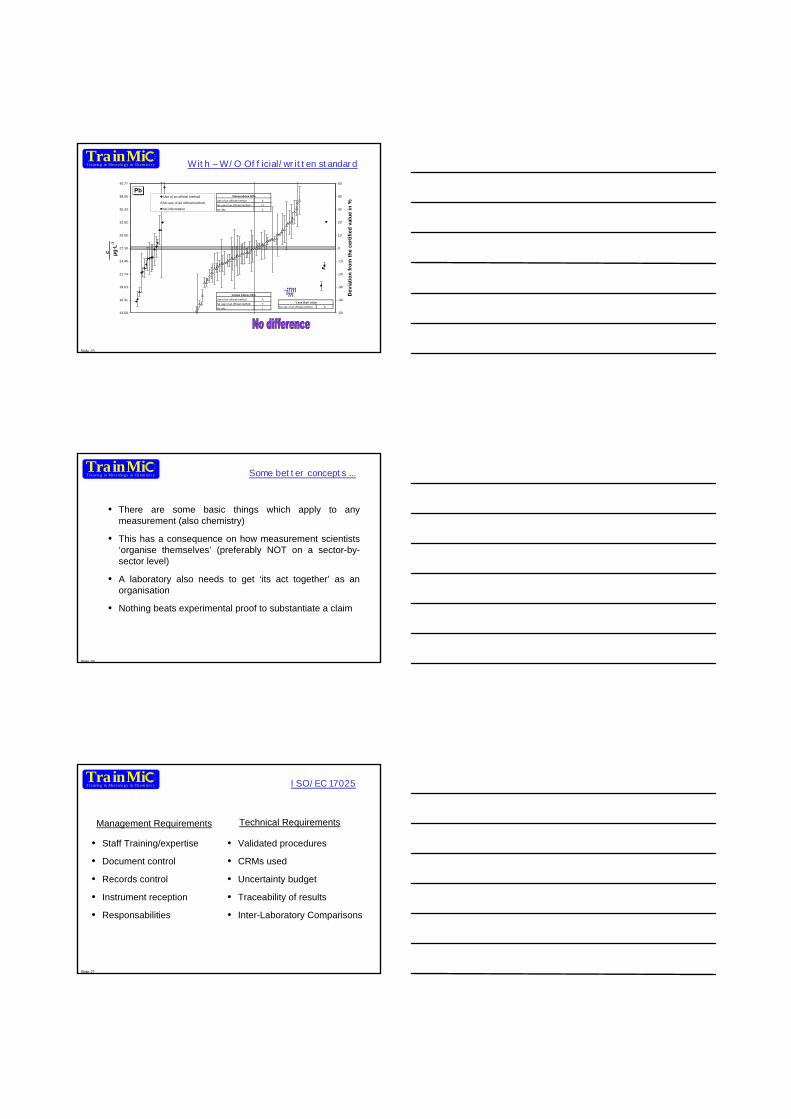
Use of an official method
No use of an official method
No information
Pb
Use of an official method 3No use of an official method 7No info 1
Values below -50%
No use of an official method 5 'Less than' value
Use of an official method 6No use of an official method 21No info 1
Values above 50%
With – W/O Official/written standard
Slide 26
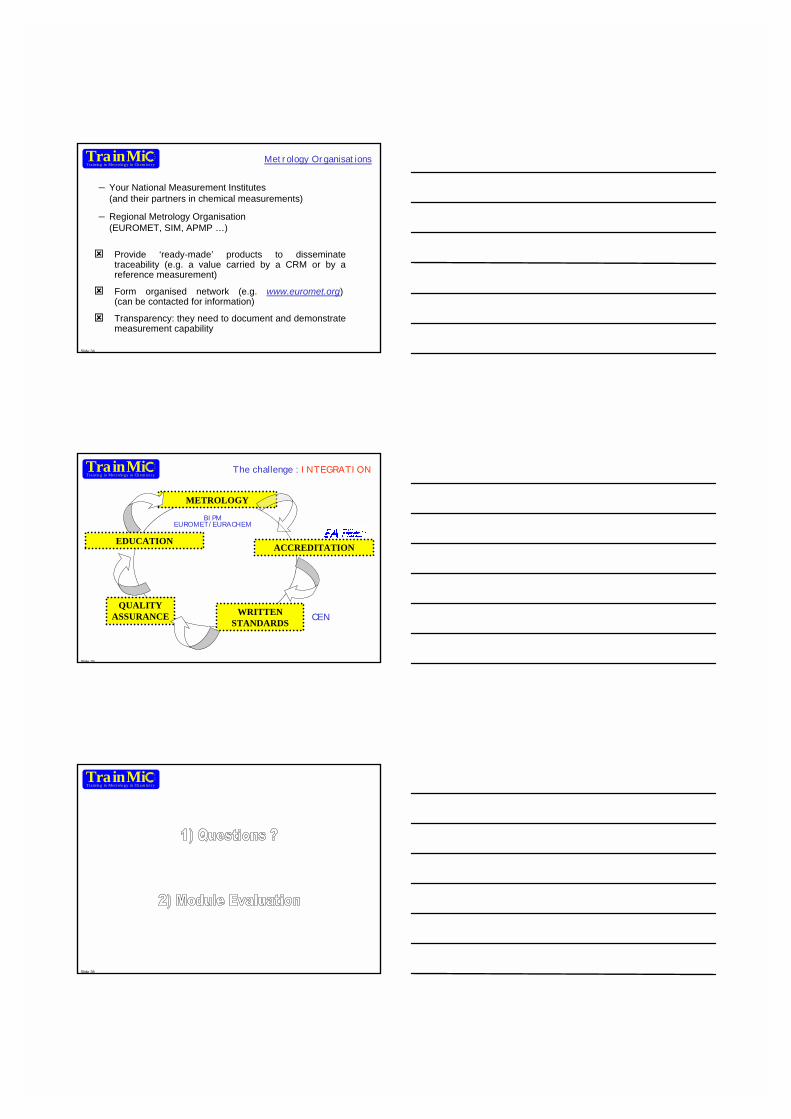
TrainMiCTra in in g in Me t ro logy in Ch e m is t ry Some better concepts ...
• There are some basic things which apply to anymeasurement (also chemistry)
• This has a consequence on how measurement scientists‘organise themselves’ (preferably NOT on a sector-by-sector level)
• A laboratory also needs to get ‘its act together’ as anorganisation
• Nothing beats experimental proof to substantiate a claim
Slide 27
TrainMiCTra in in g in Me t ro logy in Ch e m is t ry
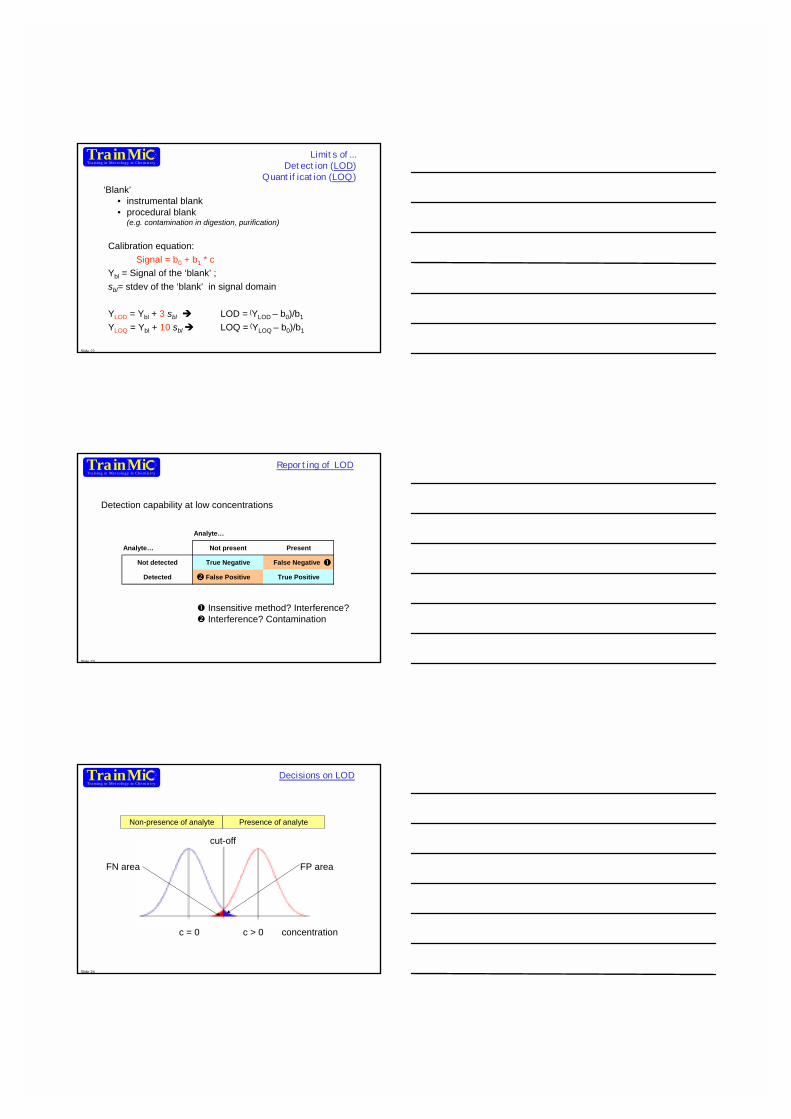
Management Requirements
• Staff Training/expertise
• Document control
• Records control
• Instrument reception
• Responsabilities
• Validated procedures
• CRMs used
• Uncertainty budget
• Traceability of results
• Inter-Laboratory Comparisons
Technical Requirements
ISO/EC 17025

Slide 28
TrainMiCTra in in g in Me t ro logy in Ch e m is t ry the Metrology ‘Cooking Art’
� Choose correct measurement systemtake a validated procedure and demonstrate/confirm it
� Describe measurement system correctly(measurement equation)
� State reference to which results are traceable,and demonstrate how
� Evaluate uncertainty of the results
� Choose suitable CRMs and use them properly
Slide 29
TrainMiCTra in in g in Me t ro logy in Ch e m is t ry
Metrology : putting the highlight onmeasurement basics/skills again !
• World wide initiative by metrology organisations
• Under the system of the Metre Convention
• Global approach : set up a general system (instead of sector-by-sector !)
The new global approach
Slide 30
TrainMiCTra in in g in Me t ro logy in Ch e m is t ry
Metre convention1875
Diplomatictreaty
CGPM
CIPM
Consultativecommittees
BIPM
Governments
Internationalorganisations
NationalLaboratories
Organising measurements on an international scale
The new global approach

Slide 31
TrainMiCTra in in g in Me t ro logy in Ch e m is t ry
‘once measured,all measurements
accepted everywhere’
The Mutual Recognition Arrangement (MRA)
Industrialised countries set up :
[signed at CIPM, Paris (October 1999)]
Easy to say, difficult to realise
Slide 32
TrainMiCTra in in g in Me t ro logy in Ch e m is t ry
Download fromwww.bipm.fr
Mutual recognitionof national measurement standards
and of calibration and measurement certificatesissued by national metrology institutes
Paris, 14 October 1999
Comité international des poids et mesuresBureau Organisationinternational intergouvernementaledes poids de la Conventionet mesure du Mètre
Slide 33
TrainMiCTra in in g in Me t ro logy in Ch e m is t ry
http://www.bipm.fr/enus/8_Key_Comparisons/welcome2.html
Mutual Recognition Arrangement (MRA)JRCB and BIPM key comparison database
At a meeting held in Paris on 14 October 1999, the director of the national metrologyinstitutes (NMIs) of the 33 Member States of the Meter Convention andrepresentatives of two international organisations signed a Mutual RecognitionArrangement (MRA) for national measurement standards and for calibration andmeasurement certificates issued by national metrology institutes.
This Mutual Recognition Arrangement is a response to a growing need for an open,transparent and comprehensive scheme to give users reliable quantitative informationon the comparability of national metrology services and to provide the technical basisfor a wider agreement negotiated for international trade, commerce and regulatoryaffairs.
Slide 34
TrainMiCTra in in g in Me t ro logy in Ch e m is t ry
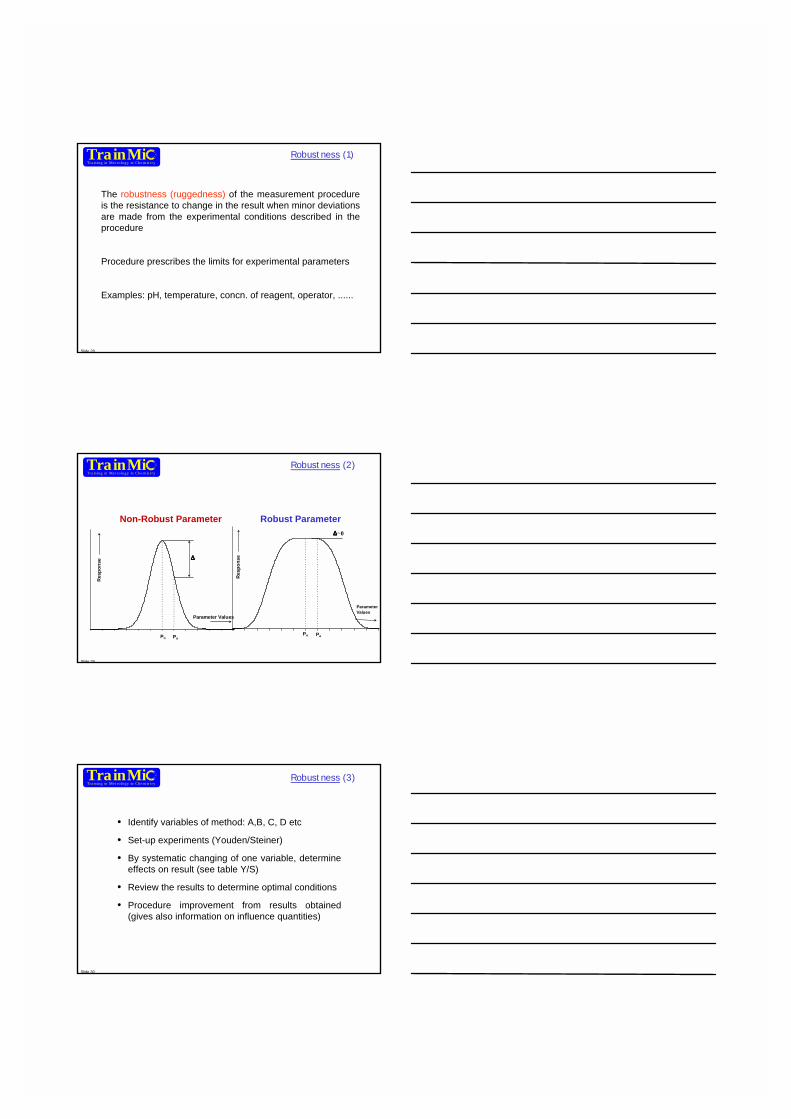
Metrology Organisations
� Provide ‘ready-made’ products to disseminatetraceability (e.g. a value carried by a CRM or by areference measurement)
� Form organised network (e.g. www.euromet.org)(can be contacted for information)
� Transparency: they need to document and demonstratemeasurement capability
– Your National Measurement Institutes(and their partners in chemical measurements)
– Regional Metrology Organisation (EUROMET, SIM, APMP …)
Slide 35
TrainMiCTra in in g in Me t ro logy in Ch e m is t ry
The challenge : INTEGRATION
METROLOGY
WRITTENSTANDARDS
ACCREDITATIONEDUCATION
QUALITYASSURANCE
BIPMEUROMET/EURACHEM
CEN
Slide 36
TrainMiCTra in in g in Me t ro logy in Ch e m is t ry

www.trainmic.org
EUR 20841 EN
- 2 -Validation ofMeasurementProcedures

Slide 1
TrainMiCTra in ing in Me t ro lo gy in Ch e m is t ry
Validation ofmeasurementprocedures
Slide 2
TrainMiCTra in ing in Me t ro lo gy in Ch e m is t ry
Content
• What is validation of a measurement procedure ?
• Why procedure validation ?
• Approach to procedure validation ?
• How to perform validation ?
• Outcome?– Validation Report,– Uncertainty
Slide 3
TrainMiCTra in ing in Me t ro lo gy in Ch e m is t ry
Beware
Difference in terminology between ISO/IEC 17025 and VIM(Internat. Vocabulary of basic and general terms in Metrology)
- ISO/IEC 17025 uses “method” � method validation
- VIM uses “(measurement) procedure” � procedure validation
- GLP uses “standard operating procedure”, SOP � SOP validation

Slide 4
TrainMiCTra in ing in Me t ro lo gy in Ch e m is t ry
Validation includes
� analytical requirements
� determination of procedure characteristics
� check that requirements can be fulfilled by the procedure
� statement on validity
Slide 5
TrainMiCTra in ing in Me t ro lo gy in Ch e m is t ry
What is validation ?
Validation is the confirmation by examination and
provision of objective evidence that the particular
requirements for a specific intended use are fulfilled
(ISO/IEC 17025)
Slide 6
TrainMiCTra in ing in Me t ro lo gy in Ch e m is t ry
Validation ofmeasurement procedure
Process of establishing- performance characterisation- scope & limitation of a measurement procedure- identification of the influences
which may change the characteristics and to what extent.
- Which analyte can it determine, in which matrices, in the presenceof which interference?
- Within these conditions (to be defined) what uncertainty can beachieved?
The process of verifying that a procedure is fit for purpose(i.e. for solving a particular analytical problem)

Slide 7
TrainMiCTra in ing in Me t ro lo gy in Ch e m is t ry
Intended use
- compliance with regulations
- maintain quality and process control
- make regulatory decisions
- support national and international trade
- support research
Slide 8
TrainMiCTra in ing in Me t ro lo gy in Ch e m is t ry
Why do we need it ?
Laboratories should demonstrate they operate within qualitysystem, are technically competent and are able to generatetechnically valid results
(ISO/IEC 17025)
Three milestones of ISO/IEC 17025:
� procedure validation
� traceability of results
� uncertainty of results
Validation is essential EVEN IFyou are not going for accreditation
Slide 9
TrainMiCTra in ing in Me t ro lo gy in Ch e m is t ry
Why validation ?
• Provides information on procedure performance characteristics
• Increases confidence:
– for users of the procedure (analyst)
– for users of measurement results (customer)
better understanding
� validation is a study of the procedure,NOT of the analyst or of the laboratory performance !

Slide 10
TrainMiCTra in ing in Me t ro lo gy in Ch e m is t ry
Often Encountered Terms
– Full Validation:where all relevant parameters of the procedure areinvestigated
– Degree of Validation:where only some of the performance parameters areinvestigated
– Confirmation:used in relation to (already validated) standardisedprocedures. No need for additional validation, just a“confirmation” in your lab.
Slide 11
TrainMiCTra in ing in Me t ro lo gy in Ch e m is t ry
Standard & non-standard methods (procedures)
Sources of standard method (procedures):
� procedures published in international, regional, nationalstandards (ISO, EN, DIN, BS, ASTM, …)
� procedures published by reputable organizations intheir publications (AOAC for food and agriculture; ICH for clinicalanalysis,….)
� not in scientific literature!
Slide 12
TrainMiCTra in ing in Me t ro lo gy in Ch e m is t ry
Which procedures should be validated?
� non-standard
� in-house developed
� standard ones used outside their intended scope
� modified standard
Will a validated procedure “automatically” work in my lab?
� (First) No, confirmation needed
� (Then) Yes, within the specified conditions

Slide 13
TrainMiCTra in ing in Me t ro lo gy in Ch e m is t ry
SelectedProcedure
AlreadyValidated
Confirmation validation
Yes No
When is a procedure validation needed?
Slide 14
TrainMiCTra in ing in Me t ro lo gy in Ch e m is t ry
Put the effort where it is needed
• validate whole procedure(from sample preparation to measured signal)
• validate full concentration range(intended use!)
• validate all intended types of matrices
Sampling& SampleTreatment
Data treat
Result
Instrumentcalib &measur
Slide 15
TrainMiCTra in ing in Me t ro lo gy in Ch e m is t ry
Required degree of validation
Decide which characteristics are most relevant for your validation(spend effort accordingly!!)
- cholesterol in serum,LOD not important (NO),uncertainty is important (YES)(e.g. better uncertainty of the results � USA saves 100 M$/year)
- survey of environmental contamination [to find hot spots]:range and linearity YES,LOD and size of uncertainty NO
- doping control (against limit):LOD is critical,uncertainty is extremely important;range, linearity is not important

Slide 16
TrainMiCTra in ing in Me t ro lo gy in Ch e m is t ry
Validation technique...
… recommended by ISO/IEC 17025
� evaluation of uncertainty = systematic assessment of the quantities influencing the result
� measurement of CRM
� participation in inter-laboratory comparison
� comparison of results achieved with other procedures
Slide 17
TrainMiCTra in ing in Me t ro lo gy in Ch e m is t ry
Use...
� Standards and/or reference materials� Investigate blanks � Artificially prepared samples (e.g. spiked)� Statistics� Common sense
Slide 18
TrainMiCTra in ing in Me t ro lo gy in Ch e m is t ry
Performance parameters of the procedure
(qualitative): � selectivity, specificity
(quantitative):� working (linear) range� detection & quantification/determination limits� sensitivity
Property of the result obtained with this procedure
� traceability (cf. other module)
� uncertainty, considering e.g.– recovery– robustness
Checklist
– repeatability– reproducibility

Slide 19
TrainMiCTra in ing in Me t ro lo gy in Ch e m is t ry
Selectivity, Specificity
• Selectivity refers to the extent to which the method can beused to determine particular analytes in mixtures or matriceswithout interferences from other components of similarbehaviour
(IUPAC, 2001)
• Specificity is 100% selectivity
• Few, if any methods are specific
• IUPAC recommends that the term specificity should beavoided
(IUPAC, 2001)
Slide 20
TrainMiCTra in ing in Me t ro lo gy in Ch e m is t ry
Selectivity, Specificity
Specific
Selectivity
IntermediateLow High
Acid-basetitration
Spectro-photometry Chromatography
EDTA titrationNeutron activation
analysis
GC-MSMS
Weighing
Slide 21
TrainMiCTra in ing in Me t ro lo gy in Ch e m is t ry
LinearityWorking Range
0
20
40
60
80
100
120
140
160
180
200
0 5 10 15 20Concentration
Resp
onse
LOD
LOQ
Linear range
Working range
Slide 22
TrainMiCTra in ing in Me t ro lo gy in Ch e m is t ry
Limits of...Detection (LOD)
Quantification (LOQ)
Calibration equation: Signal = b0 + b1 * c
Ybl = Signal of the ‘blank’ ;sbl= stdev of the ‘blank’ in signal domain
YLOD = Ybl + 3 sbl � LOD = (YLOD – b0)/b1
YLOQ = Ybl + 10 sbl � LOQ = (YLOQ – b0)/b1
‘Blank’• instrumental blank• procedural blank
(e.g. contamination in digestion, purification)
Slide 23
TrainMiCTra in ing in Me t ro lo gy in Ch e m is t ry
Reporting of LOD
� Insensitive method? Interference?� Interference? Contamination
Detection capability at low concentrations
Analyte…
Analyte… Not present Present
Not detected True Negative False Negative
Detected False Positive True Positive
�
�
Slide 24
TrainMiCTra in ing in Me t ro lo gy in Ch e m is t ry
Decisions on LOD
FP areaFN area
cut-off
c = 0 c > 0 concentration
Non-presence of analyte Presence of analyte

Slide 25
TrainMiCTra in ing in Me t ro lo gy in Ch e m is t ry
Sensitivity
• Definition:The change in the response of a measuring instrumentdivided by the corresponding change in the stimulus
(VIM 1993)
• What it means:The gradient (slope) of the calibration graph
Slide 26
TrainMiCTra in ing in Me t ro lo gy in Ch e m is t ry
Recovery (1)
A measure of the trueness of a (measurement) procedure
(IUPAC 1999)
Reference value from:
- CRM
- spike of pure substance
The closer R is to 1, the smaller the bias in the procedure
value_referencevalue_observedR =
CRM
observed
CCR =
spike
matrixobserved
cccR −=
Slide 27
TrainMiCTra in ing in Me t ro lo gy in Ch e m is t ry
Recovery (2)
The recovery for a particular sample, R, consist of threecomponents combined multiplicatively (VAM Project 3.2.1):
R = Rm * Rs * Rrep
Rm: mean recovery obtained from the analysis of aCRM or a spiked sample
u(Rm): uncertainty in cert. value / STD of replicate analyses
Rs: correction factor for various matrices
Rrep: correction factor for different in behaviour of analytein spike and real sample with incurred analyte
Slide 28
TrainMiCTra in ing in Me t ro lo gy in Ch e m is t ry
Robustness (1)
The robustness (ruggedness) of the measurement procedureis the resistance to change in the result when minor deviationsare made from the experimental conditions described in theprocedure
Procedure prescribes the limits for experimental parameters
Examples: pH, temperature, concn. of reagent, operator, ......
Slide 29
TrainMiCTra in ing in Me t ro lo gy in Ch e m is t ry
Parameter Values
Res
pons
e ∆∆∆∆
Pn Pa
Res
pons
e
∆∆∆∆~0
Pn Pa
ParameterValues
Non-Robust Parameter Robust Parameter
Robustness (2)
Slide 30
TrainMiCTra in ing in Me t ro lo gy in Ch e m is t ry
Robustness (3)
• Identify variables of method: A,B, C, D etc
• Set-up experiments (Youden/Steiner)
• By systematic changing of one variable, determineeffects on result (see table Y/S)
• Review the results to determine optimal conditions
• Procedure improvement from results obtained(gives also information on influence quantities)

Slide 31
TrainMiCTra in ing in Me t ro lo gy in Ch e m is t ry
Robustness (4)
Experiment no.: 1 2 3 4 5 6 7 8ParametersA pH 5 5 5 5 7 7 7 7B temp. 25 25 35 35 25 25 35 35C reaction time 30 60 30 60 30 60 30 60D reagent 1 1 1 2 2 2 2 1 1E reagent 2 1 2 1 2 2 1 2 1F age of column old new new old old new new oldG personnel xx yy yy xx yy xx xx yy
Response r t u v w x y z
ANOVA: A, B, and D are non-robust
� provide basic/preliminary information
� evaluate whether the model equation is valid
� better instructions for operators
Slide 32
TrainMiCTra in ing in Me t ro lo gy in Ch e m is t ry
Validation Report
• Procedure: Cadmium determination by GF-AAS
• Measurand: Cadmium concentration infood products
• Source of the Method: Developed in-house
• Intended Use: Screening of food samples
• Matrix: food and feed products
• Analytical protocol: Microwave digestion,followed by GF-AAS
• Calibration: with solution standards fromSupplier-ZZZ
• Working Range: up to 20 ng/g
• LOD: 1 ng/g
• LOQ: 3.5 ng/g
• Selectivity: Free from interference up to1000 ng/g of Chloride
• Traceability: to SI.Established by calibrationDemonstrated bymeasurement of certifiedreference material-YYY
• Typical Uncertainty: 10%, see Uncertaintybudget (Annex)
Name
Function LaboratoryAssistant
Head ofLaboratory
Signature
Date
Slide 33
TrainMiCTra in ing in Me t ro lo gy in Ch e m is t ry
Case Request Answer
1Cd in Milkexpected: 0.5 to 1.5 ng/g NO � LOD
2Cd in sea waterexpected: 5 to 10 ng/g
NO � acceptable working rangeBUT � high Cl - content
3Cd concentration in lake watersexpected 5 - 10 ng/g YES � fit for purpose
Can I do the work?

www.trainmic.org
EUR 20841 EN
- 3 -Traceability of
Measurement Results

TrainMiCTrainMiCTrainMiCTrainMiCTraining in Metrology in Chemistry
Slide 1
Traceability ofMeasurement results
TrainMiCTrainMiCTrainMiCTrainMiCTraining in Metrology in Chemistry
Slide 2
Scope of the lecture
• What is Traceability?• What is it needed for?• How to establish Traceability?• How to demonstrate Traceability?
TrainMiCTrainMiCTrainMiCTrainMiCTraining in Metrology in Chemistry
Slide 3
Quality of measurement
result
Validation ( method fit-for-purpose )
Uncertainty Budget(How well I know the result )
Traceability(my result is comparable - common reference)
www.NPL.co.uk

TrainMiCTrainMiCTrainMiCTrainMiCTraining in Metrology in Chemistry
Slide 4
Traceability of ...
Not concerned by:� … sample in the lab� … documents in a filing system
Not applicable to:� … institution� … method
Relevant for � … measurement results � … reference values
TrainMiCTrainMiCTrainMiCTrainMiCTraining in Metrology in Chemistry
Slide 5
Definition
Traceability is a property of the result of ameasurement or the value of a standardwhereby it can be related to stated references,usually national or international standards,through an unbroken chain of comparisons allhaving stated uncertainties.
[VIM, 6.10]
�
�
�
�
TrainMiCTrainMiCTrainMiCTrainMiCTraining in Metrology in Chemistry
Slide 6
Stated reference
Meaningful comparisons between measurements areonly possible if the results are expressed in the sameunits (measurement scale)
• SI units (m, kg, s, A, K, mol, cd) or combination• to best internationally agreed reference (if no SI), such
as:�delta scale for isotopic measurements� pH scale
� the scale of octane numbers for petroleum fuel� spectrophotometric measurement of lightness of
coatings (CIELab system, Lovibond,…)
TrainMiCTrainMiCTrainMiCTrainMiCTraining in Metrology in Chemistry
Slide 7
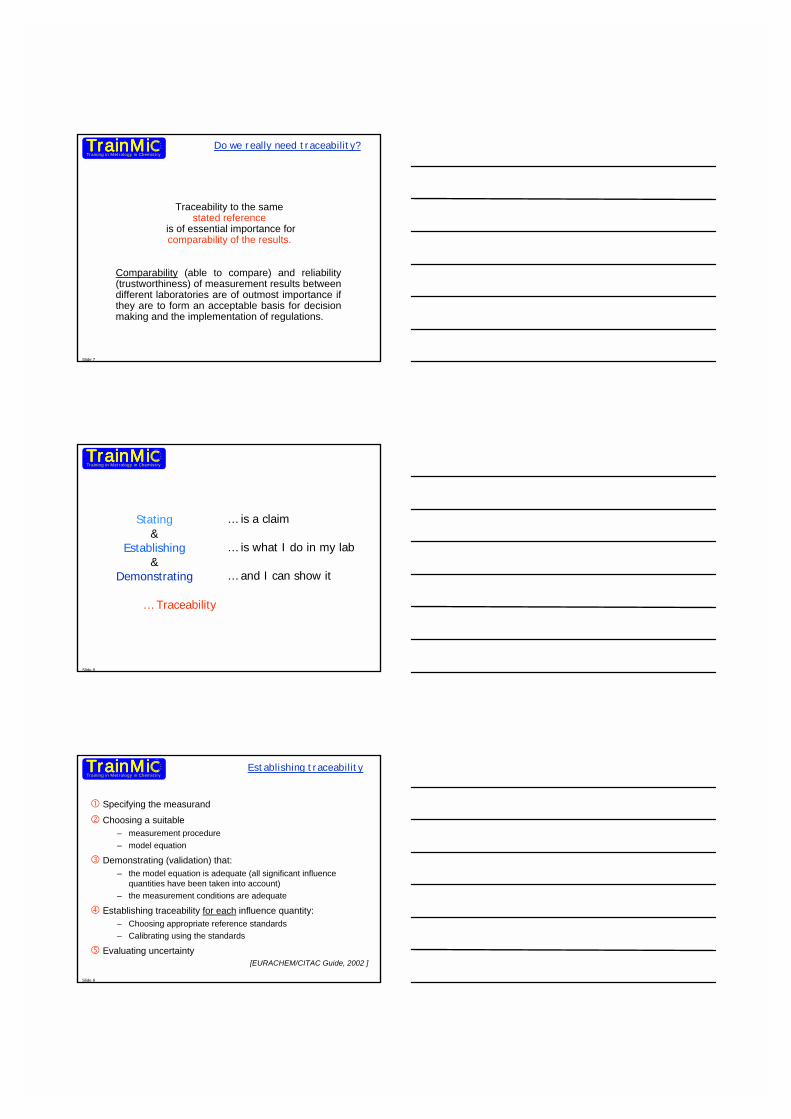
Do we really need traceability?
Traceability to the samestated reference
is of essential importance forcomparability of the results.
Comparability (able to compare) and reliability(trustworthiness) of measurement results betweendifferent laboratories are of outmost importance ifthey are to form an acceptable basis for decisionmaking and the implementation of regulations.
TrainMiCTrainMiCTrainMiCTrainMiCTraining in Metrology in Chemistry
Slide 8
Stating&
Establishing&
Demonstrating
… Traceability
… is a claim
… is what I do in my lab
… and I can show it
TrainMiCTrainMiCTrainMiCTrainMiCTraining in Metrology in Chemistry
Slide 9
Establishing traceability
� Specifying the measurand� Choosing a suitable
– measurement procedure– model equation
� Demonstrating (validation) that:– the model equation is adequate (all significant influence
quantities have been taken into account)– the measurement conditions are adequate
� Establishing traceability for each influence quantity:– Choosing appropriate reference standards– Calibrating using the standards
� Evaluating uncertainty[EURACHEM/CITAC Guide, 2002 ]

TrainMiCTrainMiCTrainMiCTrainMiCTraining in Metrology in Chemistry
Slide 10
Analyte: Article that is the subject of a measurement (GLP)e.g. cholesterol
Measurand: Particular quantity subject to measurement (VIM,2.6)e.g. concentration of cholesterol in serum
• Validation and Traceability are “correlated” validation is part of establishing traceability
• Traceability and Uncertainty are “correlated”“unbroken” chain of comparison &“unbroken” uncertainty propagation
Reminder
TrainMiCTrainMiCTrainMiCTrainMiCTraining in Metrology in Chemistry
Slide 11
Common language
Quantity Analyte Measurand Unit Statedreference
concentration c DDT c(DDT) in soil ng/kg SI
content w Pb w(Pb) in wastewater ng/L SI
count E. Coli Number of E.Coliper unit surface m-2 SI
activity amylase A(amylase) Katal SI
pH H+ ions c(H+) in wastewater
pHnumber pH scale
TrainMiCTrainMiCTrainMiCTrainMiCTraining in Metrology in Chemistry
Slide 12
C0
C1 RM1
RM2C2
Are C1 & C2Comparable?
Associativity of Comparability –choosing reference standard
Yes, throughcommon reference
�

TrainMiCTrainMiCTrainMiCTrainMiCTraining in Metrology in Chemistry
Slide 13
Traceability
• to be established for each input quantity specified inthe procedure / model equation
• established by calibration using appropriate standards
Calibration:Set of operations which establish, under specified conditions, therelationship between values indicated by a measuring instrument -(including chemical steps) and the corresponding known values ofthe measurand.
Must be performed by reference standards with demonstratedtraceability and adequately small uncertainty.
TrainMiCTrainMiCTrainMiCTrainMiCTraining in Metrology in Chemistry
Slide 14
Calibration Hierarchy
• Primary Std• International Std• National Std• Reference Std• Transfer Std• Travelling Std• Working Std
• BIPM• Nat. Metrology Institutes• Accredited Calib. Labs• Company (in-house)
- calibration centre- test laboratory
MetrologicalTraceability
Uncertainty
[ILAC-G2:1994] Traceability of Measurements
Tools Service Providers
TrainMiCTrainMiCTrainMiCTrainMiCTraining in Metrology in Chemistry
Slide 15
C.D.EHRLICH, S.D.RASBERRY J.Res. NIST 103 (1998) 93
Traceability Timeline
NMI
Calib-lab
Test-lab
P P QS1 P QS1
S S QS2 S QS2
C C QS3 C QS3
P S
S C
C Sample� Value and uncertainty propagation
Traceability

TrainMiCTrainMiCTrainMiCTrainMiCTraining in Metrology in Chemistry
Slide 16
Idem for Certified RM
Traceability Timeline
Traceable to SI via Internationally recognised measurement capabilities
producer
Test-lab
CRM
� Value and uncertainty propagation
CRM Production and certification
Stability monitoring
SampleCRM
Traceability
CRM QS CRM QS
TrainMiCTrainMiCTrainMiCTrainMiCTraining in Metrology in Chemistry
Slide 17
Result Traceable toValue of Reference Standard
I ns t
r um
e nta
l
0
2
4
6
8
Sign
al
Calibrationmodel
Reference Standard (mg/kg)
Sample Weighing
Traceable to? Via?
Traceable to? Via?
TrainMiCTrainMiCTrainMiCTrainMiCTraining in Metrology in Chemistry
Slide 18
Demonstrating Traceability
Rf
mA
VACw 1
dist
NONOstNO
33
3××
⋅
⋅=
−−
−
using matrix CRM(determining R)gravimetry
calibration(solution standard)
certificates ofmanufacturer
� measurand: content of nitrate in plants
� suitable model equation
� validation (ILC, CRM)
� traceability
� evaluate uncertainty

www.trainmic.org
EUR 20841 EN
- 4 -Uncertainty of
Measurement Results

Slide 1
TrainMiCTra in ing in Me t ro lo gy in Ch e m is t ry
Uncertainty ofMeasurement Results
Slide 2
TrainMiCTra in ing in Me t ro lo gy in Ch e m is t ry Overview
• Definitions
• Uncertainty - what for?
• Limitation of measurements
• GUM procedure for uncertainty evaluation
• Examples
Slide 3
TrainMiCTra in ing in Me t ro lo gy in Ch e m is t ry
When should you evaluateuncertainties of measurement results ?
• When a procedure is introduced inside your laboratory
• When a critical factor changes in the procedure(instrument, operator, …)
• During / together with procedure validation
� An individual evaluation process is NOT needed forevery individual result produced !

Slide 4
TrainMiCTra in ing in Me t ro lo gy in Ch e m is t ry
ISO Definition of Uncertainty
‘a parameter associated with the result of a measurement,that characterises the dispersion of the values that couldreasonably be attributed to the measurand ’
Result = Value ± uncertainty
(22.7 ± 4.8) mg/kg
The value is between 17.9 and 27.5 mg/kg(cf. range, interval)
Slide 5
TrainMiCTra in ing in Me t ro lo gy in Ch e m is t ry Why do we need uncertainty?
• It is required by ISO 17025 - Accreditation
• The uncertainty of the result demonstrates the metrologicalQUALITY of the measurements (not measuring with thesmallest achievable uncertainty)
• It improves the knowledge about the measurementprocedure
• In laboratory � document in transparent way themeasurement procedure
• For end-user � give the result with proper confidence
• To allow comparison of results
Slide 6
TrainMiCTra in ing in Me t ro lo gy in Ch e m is t ry
• A well documented uncertainty statement underpinsyour results and provides transparency!
• Identify major uncertainty contributors -find out ways to improve the procedure
• Demonstrate compliance with limits (legal orcontractual) and the establishment of acceptancecriteria
� Your best defence in discussions!
� Repeating the measurement 2, 10 or 100 times doesnot give you all information to have reliable results!
Why do we need uncertainty ? (2)

Slide 7
TrainMiCTra in ing in Me t ro lo gy in Ch e m is t ry True Value or
best estimate ofTrue Value
• We can approach to measure the true value bymeasuring the “the best estimate”
� aiming to know true value
- i.e. alcohol content of blood- i.e. nitrate content of drinking water- i.e. acrylamide content of crisp bread- i.e. lead content of wine
Slide 8
TrainMiCTra in ing in Me t ro lo gy in Ch e m is t ry
Are results different?
No results without uncertainty !R1 = 10.6 mg/kgR2 = 11.6 mg/kg
• Traditional approach: precisionR1 = (10.6 ± 0.2) mg/kgR2 = (11.6 ± 0.3) mg/kg
• GUM approach: uncertainty propagation (combined unc.)to take into account the contribution of all components
R1 = (10.6 ± 0.7) mg/kgR2 = (11.6 ± 0.7) mg/kg
No statistical tests required by GUM (almost) …/…cf. Visual comparison � overlapping ranges Y/N ?
Slide 9
TrainMiCTra in ing in Me t ro lo gy in Ch e m is t ry
Lab A Lab B
After uncertaintyevaluation
Lab A Lab B
No uncertainty evaluation
(only precision)
Lab A Lab B
10.5
11.5
11.0
12.0
12.5
mg
kg-1
value
Are these results different?

Slide 10
TrainMiCTra in ing in Me t ro lo gy in Ch e m is t ry
GUM does not requirestatistical tests
unless you need it …
“If it is deemed useful for the intended users of themeasurement result, ……, one may indicate - the
estimated effective degree of freedom…” – [GUM 7.2.1]
� when comparing results� for legal requirements� requested by customer
Slide 11
TrainMiCTra in ing in Me t ro lo gy in Ch e m is t ry
���� Don’t forget
Slide 12
TrainMiCTra in ing in Me t ro lo gy in Ch e m is t ry
What is new in GUM ?
• GUM is guide for a transparent, simple andstandardised documentation of the measure-ment procedure
• Using uncertainty evaluations, such as type A (measured in the lab) and type B (other)
Do NOT use random & systematic errors !
• The use of Combined/expanded Uncertainty

Slide 13
TrainMiCTra in ing in Me t ro lo gy in Ch e m is t ry
Type A evaluation of uncertainty: statistical analysis of series of observations.
Type A standard uncertainty is measured from repeatabilityexperiments and is quantified in terms of the standard deviation ofthe measured values
Type B evaluation of uncertainty:by other means than statistical analysis
(previous experiments, literature data, manufacturer’s information)
[GUM, 1993]
Uncertainty “Type”
Slide 14
TrainMiCTra in ing in Me t ro lo gy in Ch e m is t ry
“…The evaluation of uncertainty is neither a routinetask nor a purely mathematical one; it depends ondetailed knowledge of the nature of the measurandand of measurement…”
[GUM § 3.4.8]
Understanding the measurement !
Slide 15
TrainMiCTra in ing in Me t ro lo gy in Ch e m is t ry
How to apply GUM uncertainty ?
“…The pool of information may include:�previous measurement data;� validation data�experience with or general knowledge of the behaviour
and properties of relevant materials and instruments;�manufacturer’s specifications�data provided in calibration and other certificates;�uncertainty assigned to reference data taken from
handbooks”[GUM § 4.3.1]
Document the data you used as input for measurement!!

Slide 16
TrainMiCTra in ing in Me t ro lo gy in Ch e m is t ry
What do you need to know ?
some basic statistics
• average of the set of data;
• standard deviation;
• law of propagation;
• distribution (normal, rectangular, triangular…)
(cf. statistics module)
Slide 17
TrainMiCTra in ing in Me t ro lo gy in Ch e m is t ry
The 10-steps GUM Sequence
1 - Define the Measurand
2 - Describe the Model Equation (for the measurement procedure)
3 - Identify (all possible) sources of uncertainty
4 - Evaluate all input quantities
5 - Evaluate the standard uncertainty (1s) of each input quantities
Slide 18
TrainMiCTra in ing in Me t ro lo gy in Ch e m is t ry
The 10-steps GUM Sequence(continued)
6 - Calculate the value of the measurand (using the equation model)
7 - Calculate the combined standard uncertainty of the result
8 - Calculate the expanded uncertainty (with a selected k)
9 - Analyse the uncertainty contribution index (THINK !!)10- Document all steps in a Report.

Slide 19
TrainMiCTra in ing in Me t ro lo gy in Ch e m is t ry
Determination of Nitrateby Ion Chromatography
in Plant material
Sample treatment• Sample weighing, m• Extraction, R
• Preparing the samplesolution, VNO3-
• Dilution of the samplesolution, fdi
Preparing the standardsolution, Cst
Instrumentalmeasurement, ANO3-
Instrumentalmeasurement, Ast
Calculation ofthe result, QNO3-
Experimental Protocol
Slide 20
TrainMiCTra in ing in Me t ro lo gy in Ch e m is t ry
Step 1 - Definition of “Measurand”
Measurand = particular quantity subject tomeasurement
[VIM 2.6 / GUM B.2.9]
Example: content of NO3- in (mg/g)
Slide 21
TrainMiCTra in ing in Me t ro lo gy in Ch e m is t ry
Step 2 - Model Equation
The model of the measurement procedure is afunctional relation between input quantities andoutput quantity (result)
Y = f (X1, X2, ....., Xn)
Measurement MODEL is the equation you usefor the calculation of your result !

Slide 22
TrainMiCTra in ing in Me t ro lo gy in Ch e m is t ry
What are input quantities?
The output quantity Y depends oninput quantities X1, X2, …, Xn :
Y = f (X1, X2, ....., Xn) [GUM 4.1.2]
Input quantities (Xi) may be quantities whose value anduncertainty are directly determined in the currentmeasurement (Type A, statistical analysis of series ofobservation) or brought into the measurement fromexternal sources (Type B, previous experiments, literaturedata, information from manufacturer )
Slide 23
TrainMiCTra in ing in Me t ro lo gy in Ch e m is t ry
Model Equation
QNO3- nitrate content of the sample (mg/g)Cst nitrate concentration in standard solution (mg/l)ANO3- peak area for sample solutionAst peak area for standard solutionVNO3- volume of sample solution ( l )m mass of the sample (g)fdi dilution factor (no units);R recovery factor (cf. sample preparation)
Rf
mA
VACQ 1
dist
NONOstNO
33
3××
⋅
⋅=
−−
−
Slide 24
TrainMiCTra in ing in Me t ro lo gy in Ch e m is t ry
Step 3 - Possible Sources of Uncertainty
� recovery of analyte from a complex matrix� storage conditions� reagent purity� assumed stoichiometry� sampling� measurement conditions� instrument response� bias of instrument� instrument resolution� uncertainty of standards and CRM’s� variations in repeated observations

Slide 25
TrainMiCTra in ing in Me t ro lo gy in Ch e m is t ry
Step 3 - Possible Sources of Uncertainty
QNO3-
Standardconcentration, Cst
Recovery, R
Samplemass, m
Signal ofSample, ANO3
Purity
Standard mass
Volume, VNO3
balance calibration
GlasswareCertificate
Temperature
balance calibration
Instrumentcalibration
Signal ofStandard, Ast
Signal Stability
Collection of operations
Rf
mA
VACQ 1
dist
NONOstNO
33
3××
⋅
⋅=
−−
−
Slide 26
TrainMiCTra in ing in Me t ro lo gy in Ch e m is t ry
Step 4 - Input Quantities Uncertainty(evaluation type A & B)
• repeated observation (A)
• validation experiments (A and/or B)
• manufacturers’ specifications (B)
• calibration certificates (B)
• results of interlaboratory method validations (B)
• from experience and/or literature (B)
Slide 27
TrainMiCTra in ing in Me t ro lo gy in Ch e m is t ry
Step 5 - Convert to Standard Uncertainties
Before combining, all uncertainty contributions must beexpressed/converted as “estimated” standard uncertainty
when available as:
– standard deviation: use as is
– confidence intervals: convert
– stated range: convert
– expanded uncertainties: convert
See Module “Statistics”
Slide 28
TrainMiCTra in ing in Me t ro lo gy in Ch e m is t ry
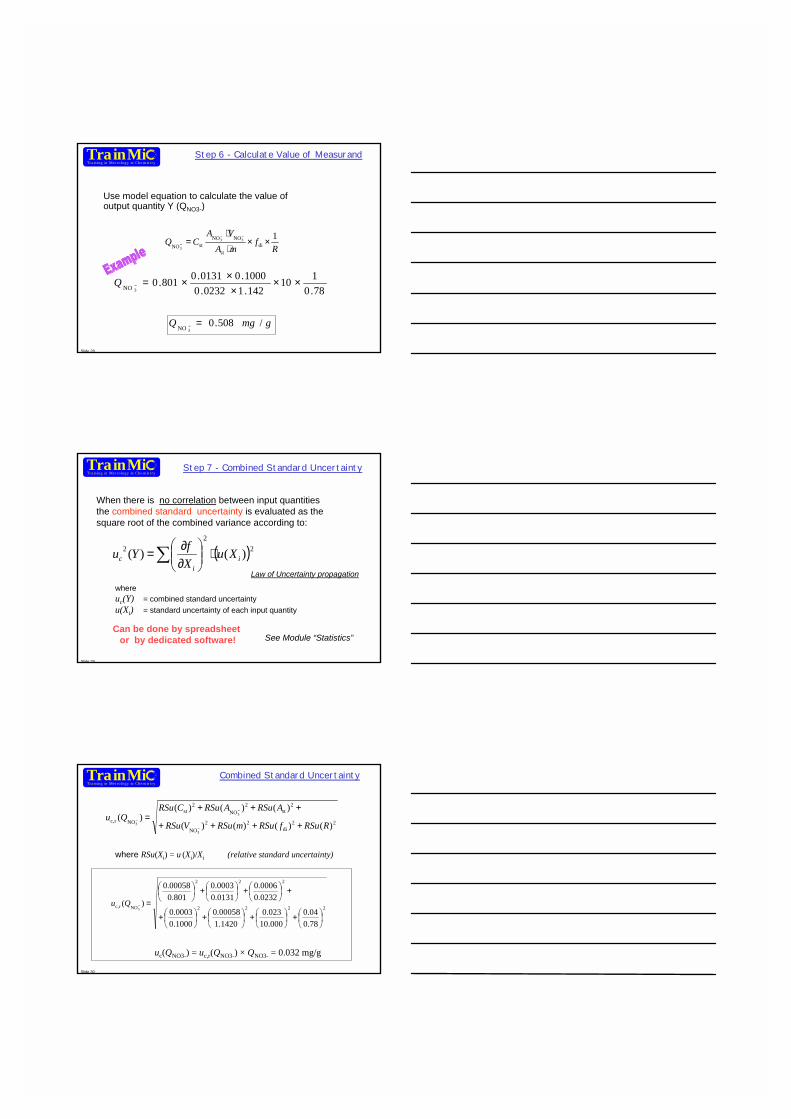
Step 6 - Calculate Value of Measurand
Use model equation to calculate the value ofoutput quantity Y (QNO3-)
78.0110
142.10232.01000.00131.0801.0
3NO ×××
××=−Q
gmgQ /508.03NO =−
Rf
mA
VACQ 1
dist
NONOstNO
33
3××
⋅
⋅=
−−
−
Slide 29
TrainMiCTra in ing in Me t ro lo gy in Ch e m is t ry
When there is no correlation between input quantitiesthe combined standard uncertainty is evaluated as thesquare root of the combined variance according to:
Step 7 - Combined Standard Uncertainty
( )22
2 )()( ii
c XuXfYu ⋅
∂∂=∑
Can be done by spreadsheet or by dedicated software!
whereuc(Y) = combined standard uncertaintyu(Xi) = standard uncertainty of each input quantity
Law of Uncertainty propagation
See Module “Statistics”
Slide 30
TrainMiCTra in ing in Me t ro lo gy in Ch e m is t ry
Combined Standard Uncertainty
where RSu(Xi) = u (Xi)/Xi (relative standard uncertainty)
22di
22NO
2st
2NO
2st
NOrc, )()()()(
)()()()(
3
3
3 RRSufRSumRSuVRSu
ARSuARSuCRSuQu
++++
+++=
−
−
−
2222
222
NOrc,
78.004.0
000.10023.0
1420.100058.0
1000.00003.0
0232.00006.0
0131.00003.0
801.000058.0
)(3
+
+
+
+
+
+
+
=−Qu
uc(QNO3-) = uc,r(QNO3-) × QNO3- = 0.032 mg/g

Slide 31
TrainMiCTra in ing in Me t ro lo gy in Ch e m is t ry
Step 8 - Expanded Uncertainty
The expanded uncertainty, U, is obtained by multiplying thecombined standard uncertainty uc(y) by a coverage factor k:
cukU ∗=
The result is then expressed as: ??)(Result =±= kUy
� the best estimate of the value attributed to the measurand is “y”,
� the interval [y – U , y + U] is the range that may be expected toencompass a large fraction of the distribution of values that couldreasonably be attributed to the measurand.
For the example: QNO3- = (0.51 ± 0.06) mg/g , k = 2
Slide 32
TrainMiCTra in ing in Me t ro lo gy in Ch e m is t ry
Standard uncertainty should be used inside the laboratory(to apply uncertainty propagation)
Expanded uncertainty is more realistic rangegiven for the end-users of the results
� Expanded uncertainty gives a more realistic range ofpossible values.
� The coverage factor usually used is k = 2, representing acoverage of about 95%, if the distribution is normal
Step 8 - Expanded Uncertainty (2)
Slide 33
TrainMiCTra in ing in Me t ro lo gy in Ch e m is t ry Step 9 - Uncertainty Contributions
Major Contributor :
• Type B? �• Type A? ☺• Replicates?• Much work?• Control Charts?
See Module “Statistics”
13.6%
17.4%
68.7%
0.3%
R
Ast ANO3-All others

Slide 34
TrainMiCTra in ing in Me t ro lo gy in Ch e m is t ry
Step 10 - Reporting Results
QNO3- = (0.51 ± 0.06) mg/g (*)
(*)the reported uncertainty is an expandeduncertainty calculated using a coverage factor ofk = 2, which gives a level of confidence ofapproximately 95%
Slide 35
TrainMiCTra in ing in Me t ro lo gy in Ch e m is t ry
Metrologists obsessed by small uncertainties ?
0.63
0.73
0.83
0.93
1.03
1.13
1.23
1.33
1.43
1.53
1.63
1.73
1.83
c
m
mol
·kg-1
-50
-40
-30
-20
-10
0
10
20
30
40
50
Devi
atio
n fr
om m
iddl
e of
cer
tifie
d ra
nge
in %
Cd
Results from all participants.
Certified range [U =k ·u c (k =2)]: 1.226 - 1.294 mmol·kg-1
9 values below -50%
3 values above 50%
Slide 36
TrainMiCTra in ing in Me t ro lo gy in Ch e m is t ry
Learning how to apply GUM:Better sell your results with
reliable uncertainty statement !
0.63
0.73
0.83
0.93
1.03
1.13
1.23
1.33
1.43
1.53
1.63
1.73
1.83
c
m
mol
·kg-1
-50
-40
-30
-20
-10
0
10
20
30
40
50
Dev
iatio
n fr
om m
iddl
e of
cer
tifie
d ra
nge
in %
Cd
Results from all participants.
Certified range [U =k ·u c (k =2)]: 1.226 - 1.294 mmol·kg-1
9 values below -50%
3 values above 50%

Slide 37
TrainMiCTra in ing in Me t ro lo gy in Ch e m is t ry
Summary: about uncertainty
� Uncertainty of measurement results evaluation accordingto the GUM is a useful and accepted concept to evaluateresults of a measurement;
� It allows others (e.g. assessors) to understand what &how things were done
� It allows the analyst to combine prior knowledge andobservations in a consistent and well defined way;
� It doesn’t requires to measure with smallest achievableuncertainty, but with the most realistic one
Slide 38
TrainMiCTra in ing in Me t ro lo gy in Ch e m is t ry
Uncertainty adopted and accepted by ...
� This concept is adopted and accepted by internationalinstitutions, such as NMIs and BIPM
� Is required under ISO 17025 for accreditation
� IUPAC, OIML and accreditation community such as EAand ILAC have accepted this concept
� CEN is incorporating these concepts
Slide 39
TrainMiCTra in ing in Me t ro lo gy in Ch e m is t ry

www.trainmic.org
EUR 20841 EN
- 5 -Applied
Statistics

Slide 1
TrainMiCTra in ing in Me t ro lo gy in Ch e m is t ry
AppliedAppliedStatisticsStatistics
Slide 2
TrainMiCTra in ing in Me t ro lo gy in Ch e m is t ry
• Evaluation of uncertainty of results according to ISO-GUM• Evaluation of Inter-Laboratory Comparison (ILC)• Quality assurance:
– method performance (accuracy; precision; ...)• Optimisation of measurement procedures
Statistics, why and when?
Slide 3
TrainMiCTra in ing in Me t ro lo gy in Ch e m is t ry
Statistics for evaluation of uncertainty

Slide 4
TrainMiCTra in ing in Me t ro lo gy in Ch e m is t ry
( )∑=
=n
iix
nx
1
1
( )2
111)( ∑
=
−⋅−
=n
iii xx
nxsStandard Deviation
Normal distribution
For a set of n values xi
)()( 2ii xsxV =Variance of the mean
Mean Value (average)
Relative Standard Deviation %)()( orabsolutexxsRSD i=
Freq
uenc
y
± 1 s
± 2 s
X
Slide 5
TrainMiCTra in ing in Me t ro lo gy in Ch e m is t ry
The Value is between the limits
The expectation
Assumed standard deviation:
3/as =
+− aa l
1/2a
2a(= ±±±± a)
X
axy ±=
Rectangular distribution
One can only assume that it is equally probable for the valueto lie anywhere within the interval
Slide 6
TrainMiCTra in ing in Me t ro lo gy in Ch e m is t ry
“It is likely that the value is somewhere in that range”
Rectangular distribution is usually described in terms of: the average value and the range (±a)
Certificates or other specification give limits where the value could be,without specifying a level of confidence (or degree of freedom).
The purity of the cadmium is given on the certificate as (99.99 ± 0.01) %Assuming rectangular distribution the standard uncertainty is:
%0058.03/01.03/)( ==== axus
Example of Rectangular distribution
lmgaxus /16.13/23/)( ====
Examples:Concentration of calibration standard is quoted as (1000 ± 2) mg/lAssuming rectangular distribution the standard uncertainty is:

Slide 7
TrainMiCTra in ing in Me t ro lo gy in Ch e m is t ry
6/1⋅= as
Distribution used when it issuggested that values near thecentre of range are more likelythan near to the extremes
Assumed standard deviation:
2a (=±±±±a)
1/a
X
axy ±=
Triangular distribution
Slide 8
TrainMiCTra in ing in Me t ro lo gy in Ch e m is t ry
Values close to x are more likely than near the boundaries
The available information concerning the value is less limitedthan for rectangular distribution.
Example (volumetric glassware)
The manufacture quotes a volume for the flask of(100 ± 0.1) ml at T = 20° C.
Nominal value most probable!Assuming triangular distribution the standard uncertainty is:
mlaxus 04.06/1.06/1)( ==⋅==
Example of Triangular distribution
In case of doubt, use the rectangular distribution
Slide 9
TrainMiCTra in ing in Me t ro lo gy in Ch e m is t ry
The individual observations are distributed about the bestestimate of the “True Value” with a spread, which dependson the precision
Confidence Interval
)(%)1( nCIx αµ −±=
nsntCI /*)1,05.0(%95 −=
The estimate of the “True Value” (µ) lies within theconfidence interval (CI), with a probability of (1-α),
having “n-1” degrees of freedom:(where n = number of replicates)

Slide 10
TrainMiCTra in ing in Me t ro lo gy in Ch e m is t ry
µ ± 1s 68 % µ ± 2s 95 % µ ± 3s 99.7%
Confidence Interval (2)Fr
eque
ncy
± 1 s
± 2 s
N(0,1)
Slide 11
TrainMiCTra in ing in Me t ro lo gy in Ch e m is t ry
Law of “Uncertainty Propagation”without correlation
22 )()()( buauCu +=)()(
baCbaC
−=+=
Y = f (X1, X2, ....., Xn)
( )22
2 )()( ii
c XuXfYu ⋅
∂∂= ∑
)/()(
baCbaC
=∗= 22 )()()(
+
=bbu
aau
CCu
Slide 12
TrainMiCTra in ing in Me t ro lo gy in Ch e m is t ry
Type A evaluation of uncertainty: statistical analysis of series of observations.
Type A standard uncertainty is measured from repeatabilityexperiments and is quantified in terms of the standard deviation ofthe measured values
Type B evaluation of uncertainty:by other means than statistical analysis
(previous experiments, literature data, manufacturer’s information)
[GUM, 1993]
Different estimation of uncertainty

Slide 13
TrainMiCTra in ing in Me t ro lo gy in Ch e m is t ry
Expanded Uncertainty, U, is obtained by multiplying thecombined standard uncertainty by a coverage factor k::
( )22
2 )()( ii
c xuxfyu ⋅
= ∑ δ
δ
According to GUM...
)(*)( yukyU c=
often k = 2
When there is no correlation between input quantitiesthe combined standard uncertainty is evaluated as thesquare root of the combined variance according to thelaw of uncertainty propagation:
Slide 14
TrainMiCTra in ing in Me t ro lo gy in Ch e m is t ry
But what is ∆x ?
xxR ∆±=
An uncertainty is given in the form of Standard Deviation [ s = u(x) ]
• Standard deviation ?• Rectangular distribution uncertainty ?• Triangular distribution uncertainty ?• Confidence interval w/o specified degree of freedom ?• Confidence Interval with specified degree of freedom ?• Combined Uncertainty ?• Expanded uncertainty ? Is “k” specified ?
Slide 15
TrainMiCTra in ing in Me t ro lo gy in Ch e m is t ry
s- provided by the instrument- calculated from (instrumental) replicates
1. Single measurement with several instrumental replicates:
sxR ±=
Standard deviationof a single measurement
0. Experimental Measurement � uncertainty (Type A) !

Slide 16
TrainMiCTra in ing in Me t ro lo gy in Ch e m is t ry
iii sxR ±=
2. Several (n) independent measurementswith several instrumental replicates
Standard deviationof n independent measurements
assuming that ALL si are similar (= s)
sxR ii ±=
nsRsRR imeani ±=±= )()(
Slide 17
TrainMiCTra in ing in Me t ro lo gy in Ch e m is t ry
R1 R2
After uncertaintyevaluation
R1 R2
No uncertainty evaluation
(only precision)
R1 R2
10.5
11.5
11.0
12.0
12.5
mg
kg-1
value
Are these results different?
Slide 18
TrainMiCTra in ing in Me t ro lo gy in Ch e m is t ry
Measurement Cd content in plant 3 digested samples
1st Digestion : 20.5 mg/kg
2nd Digestion : 21.0 mg/kg
3rd Digestion : 21.5 mg/kg
mean [Cd] = 21.0 mg/kg
(stdev) s = 0.5 mg/kg
(mean ±±±± stdev) CCd = (21.0 ± 0.5) mg/kg(mean ±±±± 95% CI) CCd = (21.0 ± 1.2) mg/kg, with n = 3
(Traditional) Statistical Approach
t(0.05,2)= 4.3

Slide 19
TrainMiCTra in ing in Me t ro lo gy in Ch e m is t ry
mean ±±±± Expanded uncertaintyCCd= (21.0 ± 4.2) mg/kg, with k = 2
Uncertainty Budget calculation � Combined Uncertainty (including contribution from all parameters)
GUM Approach
Measurement Cd content in plant 3 digested samples
1st Digestion : 20.5 mg/kg
2nd Digestion : 21.0 mg/kg
3rd Digestion : 21.5 mg/kg
mean [Cd] = 21.0 mg/kg
Combined unc. uc = 2.1 mg/kg
Slide 20
TrainMiCTra in ing in Me t ro lo gy in Ch e m is t ry
Statistics for method performance studies
Slide 21
TrainMiCTra in ing in Me t ro lo gy in Ch e m is t ry
Accurate? Precise?
no no
no yes
yes no
yes yes
(close) (scatter)
� � � � � ����� � � � � �
�����
Best estimate ofthe “True Value”
Precision: The closeness of agreement between independenttest results obtained under stipulated conditions [ISO 5725]
Precision � ⇒ Scatter � ⇒ uncertainty �

Slide 22
TrainMiCTra in ing in Me t ro lo gy in Ch e m is t ry
Closeness of agreement between a test result of ameasurement and the accepted reference value(ISO 3534-1)
Accuracy is not given by the spread of a normaldistribution, but by the deviation of the arithmetic mean ofa series of results from accepted reference value
Accuracy
Accuracy � ⇒ Deviation � (zero)
Slide 23
TrainMiCTra in ing in Me t ro lo gy in Ch e m is t ry
Precision recorded under repeatability conditions:
– same laboratory, analyst, equipment,time (short interval)
Typically used for studying variation
within a batch or between replicated measurements.
Within-run precision = Repeatability
Repeatability
Slide 24
TrainMiCTra in ing in Me t ro lo gy in Ch e m is t ry Reproducibility
Precision recorded under reproducibility conditions:
– different laboratory, analyst, equipment, time (short interval)
Typically used for studying variation
on measurements made between laboratories.
Between-run precision = Reproducibility

Slide 25
TrainMiCTra in ing in Me t ro lo gy in Ch e m is t ry
646566676869707172
0 2 4 6 8 10 12 14 16
Replicates 1 2 3 4 5 6Vials 1 66 68 67 69 70 69
2 66 67 68 68 68 693 71 67 68 69 68 704 66 68 67 68 68 695 67 67 66 69 69 686 65 67 67 69 68 697 67 68 68 68 69 698 67 66 66 68 68 699 67 67 66 69 68 69
10 66 65 67 68 69 6811 67 67 69 68 68 7012 67 68 69 69 68 6913 67 67 68 69 68 6814 67 68 68 69 68 6915 65 66 65 68 68 67
SUMMARYGroups Count Sum AverageVariance
1 6 409 68.2 2.22 6 406 67.7 1.13 6 413 68.8 2.24 6 406 67.7 1.15 6 406 67.7 1.56 6 405 67.5 2.37 6 409 68.2 0.68 6 404 67.3 1.59 6 406 67.7 1.510 6 403 67.2 2.211 6 409 68.2 1.412 6 410 68.3 0.713 6 407 67.8 0.614 6 409 68.2 0.615 6 399 66.5 1.9
ANOVASource of Variation SS df MS F P-value F crit
Between Groups 26.2 14 1.87 1.34 0.207 1.83Within Groups 104.8 75 1.40
Total 131.0 89
repeatability stdev sr 1.18 =sqrt(MSW)
reproducibility stdev sR 1.21 =sqrt(MSW+(MSB-MSW)/N)(n replicates)
Anova Single factor
R = 2* √2 * sRr = 2* √2 * sr
Slide 26
TrainMiCTra in ing in Me t ro lo gy in Ch e m is t ry
Statistics for Inter-Laboratory Comparison (ILC),
Proficiency Testing (PT)
Slide 27
TrainMiCTra in ing in Me t ro lo gy in Ch e m is t ry
Performance evaluation:0 <|Z|< 2 : good2 <|Z|< 3 : warning � preventive action
|Z|> 3 : unsatisfactory � corrective action
(Traditional) Z-score
"" sxx
Z reflab −=
Difference � distance � accuracy
• Target performance (i.e. 5%)• Reference uncertainty (nominal value)• Inter-Laboratory Comparison reproducibility
“Normalized” versus ...

Slide 28
TrainMiCTra in ing in Me t ro lo gy in Ch e m is t ry En-score according to GUM
)( 22reflab
reflab
uu
xxEn
+
−=
“Normalized” versus ...propagated combined uncertainties
Performance evaluation:0 <|En|< 2 : good2 <|En|< 3 : warning � preventive action
|En|> 3 : unsatisfactory � corrective action
Slide 29
TrainMiCTra in ing in Me t ro lo gy in Ch e m is t ry
The Uncertainty BudgetStep-by-step Tutorial
Slide 30
TrainMiCTra in ing in Me t ro lo gy in Ch e m is t ry
�RSD stdev value description?? 0,02 2,46 X1
3,0% ?? 4,32 X2?? 0,11 6,38 X3
2,3% ?? 2,99 X4
�RSD stdev value description0,8% 0,02 2,46 X13,0% 0,13 4,32 X21,7% 0,11 6,38 X32,3% 0,07 2,99 X4
�RSD stdev value description0,8% 0,02 2,46 X13,0% 0,13 4,32 X21,7% 0,11 6,38 X32,3% 0,07 2,99 X4
?? ?? 0,557 Result
� Model: Y = X1 * X2 / (X3 * X4) part 1

Slide 31
TrainMiCTra in ing in Me t ro lo gy in Ch e m is t ry
� RSD stdev value description X1 X2 X3 X40,8% 0,02 2,46 X1 2,46 2,46 2,463,0% 0,13 4,32 X2 4,32 4,32 4,321,7% 0,11 6,38 X3 6,38 6,38 6,382,3% 0,07 2,99 X4 2,99 2,99 2,99
?? ?? 0,557 Result
�RSD stdev value description X1 X2 X3 X40,8% 0,02 2,46 X1 2,48 2,46 2,46 2,463,0% 0,13 4,32 X2 4,32 4,45 4,32 4,321,7% 0,11 6,38 X3 6,38 6,38 6,49 6,382,3% 0,07 2,99 X4 2,99 2,99 2,99 3,06
0,557 Result 0,562 0,574 0,548 0,544
x+∆x
� diff 0,005 0,017 -0,009 -0,013 0,001
sumsq(diffi)
4,2% 0,024
� Model: Y = X1 * X2 / (X3 * X4) part 2
( )∑ −=i ic yyu 2
Slide 32
TrainMiCTra in ing in Me t ro lo gy in Ch e m is t ry � Model: Y = X1 * X2 / (X3 * X4) part 3
RSD stdev value description X1 X2 X3 X40,8% 0,02 2,46 X1 2,48 2,46 2,46 2,463,0% 0,13 4,32 X2 4,32 4,45 4,32 4,321,7% 0,11 6,38 X3 6,38 6,38 6,49 6,382,3% 0,07 2,99 X4 2,99 2,99 2,99 3,064,2% 0,024 0,557 Result 0,562 0,574 0,548 0,544
diff 0,005 0,017 -0,009 -0,013 0,001
�index 3,7% 50,8% 16,1% 29,4% 100,0%
sum
( )∑ −−=
i i
i
yyyyindex 2
2)(X1
X2
X3
X4
Major Contributor :
• Type B? �• Type A? ☺• Replicates?• Much work?• Control Charts?

www.trainmic.org
EUR 20841 EN
- 6 -Use of
Reference Materials

Slide 1
TrainMiCTra in in g in Me t ro logy in Ch e m is t ry
Use ofReference materials
Slide 2
TrainMiCTra in in g in Me t ro logy in Ch e m is t ry Overview
– Definitions– Types of RMs– RM production– Use of RMs– CRM suppliers– Examples on use
Slide 3
TrainMiCTra in in g in Me t ro logy in Ch e m is t ry Be aware!
What is presented here is best practiceon the use of reference materials
… in many cases this is not applied!
Quality Standards of preparationare not systematically applied
by all suppliers

Slide 4
TrainMiCTra in in g in Me t ro logy in Ch e m is t ry
� Suitable laboratory environment
� Educated, trained and skilled staff
� Suitable equipment
� Use of validated and documented
methods
� Quality control
� Training procedures and records
� Requirements for reagents,calibrants and measurementstandards
� Proper use of (certified)Reference Materials
� Procedures for checking andreporting results
� Proper storage and handling ofsamples
� Participation in proficiency tests
Role of RM in Analytical Chemistry
ISO17025 (QA) requirements
Slide 5
TrainMiCTra in in g in Me t ro logy in Ch e m is t ry You certainly heard about...
�Standards • Primary and Secondary standard• International (measurement) standard• National standard• Calibration standard• Measurement standard
�Reference Materials (CRM, SRM, ...)� Primary and Secondary RM � Laboratory RM� Internal, “in-house” RM� Matrix RM
+ Calibration solution+ Control sample
Slide 6
TrainMiCTra in in g in Me t ro logy in Ch e m is t ry
material or substance one or more of whose propertiesare sufficiently homogeneous and well established to beused for the calibration of an apparatus, the assessmentof a measurement method, or for assigning values tomaterials
Definition ofReference Materials (RM)
According to VIM,

Slide 7
TrainMiCTra in in g in Me t ro logy in Ch e m is t ry
reference material, accompanied by a certificate, one ormore of whose property values are certified by aprocedure which establishes traceability to an accuraterealization of the unit in which the property values areexpressed, and for which each certified value isaccompanied by an uncertainty at a stated level ofconfidence
Definition of CertifiedReference Materials (CRM)
According to VIM,
Slide 8
TrainMiCTra in in g in Me t ro logy in Ch e m is t ry
• Pure substances for calibration(e.g. solution of Pb to prepare calibrationsolution for AAS)
• Pure substances for matrix matching(e.g. high purity Cu to make a Zn/Cucalibration series for ICP-ES)
• matrix CRMs(e.g. cholesterol in serum)
Types of CRMsaccording to their use
Slide 9
TrainMiCTra in in g in Me t ro logy in Ch e m is t ry
Matrix (compositional) reference material :A “natural” substance more representative oflaboratory samples that has been chemicallycharacterised for one or more elements,constituents etc. with a known uncertainty
Matrix RM
According to VIM,
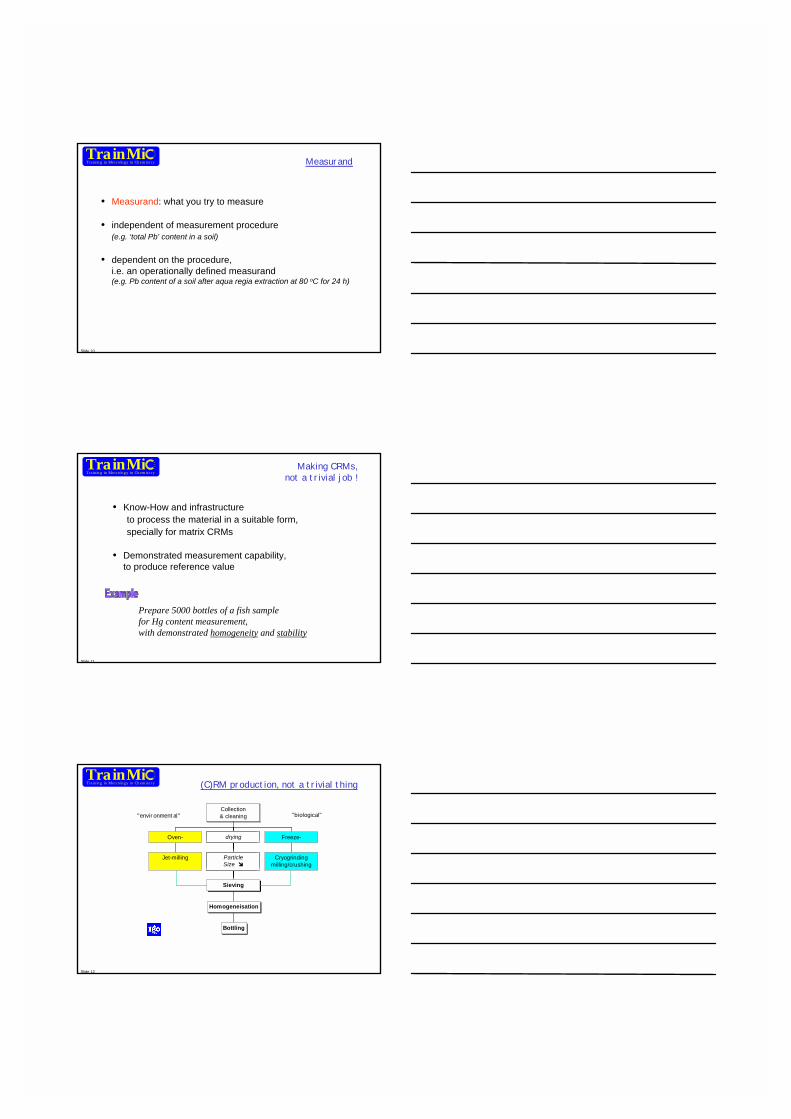
Slide 10
TrainMiCTra in in g in Me t ro logy in Ch e m is t ry
• Measurand: what you try to measure
• independent of measurement procedure(e.g. ‘total Pb’ content in a soil)
• dependent on the procedure,i.e. an operationally defined measurand(e.g. Pb content of a soil after aqua regia extraction at 80 oC for 24 h)
Measurand
Slide 11
TrainMiCTra in in g in Me t ro logy in Ch e m is t ry
Making CRMs,not a trivial job !
• Know-How and infrastructureto process the material in a suitable form,specially for matrix CRMs
• Demonstrated measurement capability,to produce reference value
Prepare 5000 bottles of a fish samplefor Hg content measurement,with demonstrated homogeneity and stability
Slide 12
TrainMiCTra in in g in Me t ro logy in Ch e m is t ry
"environmental" "biological"
Jet-milling
Oven-
Sieving
Bottling
Homogeneisation
ParticleSize �
drying
Cryogrindingmilling/crushing
Freeze-
Collection& cleaning
(C)RM production, not a trivial thing

Slide 16
TrainMiCTra in in g in Me t ro logy in Ch e m is t ry
– the integrated process of correct preparation,homogeneity and stability demonstration, andaccurate and traceable charaterisation,
– whereby all components of uncertainty of“the sample on the desk of the user”should be properly accounted for according tothe ISO Guide Uncertainty of Measurements (GUM)
According to ISO 35producing (C)RMs is ...
Slide 17
TrainMiCTra in in g in Me t ro logy in Ch e m is t ry
5 replicates
5 m
l am
poul
e �
Repeat with TWENTYampoules
� 5 * 20 results“independent”
Balanced ANOVA
uwb, ubb
Homogeneityof each element
61
63
65
67
69
71
73
0 5 10 15 20
1. Homogeneity contribution to uncertainty
Slide 18
TrainMiCTra in in g in Me t ro logy in Ch e m is t ry
15000
16000
17000
18000
19000
0 24 48 72
time (months)
Stability (40oC)
Stabilityof each element
6 12 18 24 m0 3 6 9 12 w
Reference
Isochronous
6 12 18 24 m0 3 6 9 12 w
Reference
Classical
-20oC+04oC+18oC+40oC
Measured under repeatability conditions
2. Stability contribution to CRM uncertainty & shelf-live

Slide 19
TrainMiCTra in in g in Me t ro logy in Ch e m is t ry
0.4 0.6 0.8 1.0 1.2
01-Z-ETA-AAS
01-ETAAS
02-Z-ETA-AAS
03-ICP-AES
03-ICP-MS
04-ICP-MS
05-ICP-MS
06-ETA-AAS
07-Z-ETA-AAS
08-ICP-MS
10-HR-ICP-MS (± 95% CI)
Certified element: Cd (in mg/kg)
“Characterisation”Value assignment
� by designation � 1 method / 1 lab� 1 method / M labs� N methods / 1 lab� N methods / M labs
3. Characterisation contribution to CRM uncertainty
Slide 20
TrainMiCTra in in g in Me t ro logy in Ch e m is t ry
Expanded Uncertainty UCRM of the averageconcentration of 1 unit after storage for (some) timeand after transport
(C)RM Uncertaintyaccording to GUM
Characterization(Certification)
Long-termstability
Between-Bottle
Coveragefactor
222charltsbbCRM uuukU ++⋅=
Slide 21
TrainMiCTra in in g in Me t ro logy in Ch e m is t ry A high quality (C)RM should :
• State traceability of certified value(e.g. traceability to S.I., or to values obtained with method XYZ)
• State an ISO-GUM uncertainty of certified value
• Demonstrate traceability & uncertainty of certified value(e.g. in a certification report ; experimental evidence of demonstratedcapability from participation to international intercomparisons such asthose from BIPM)
• Produced according to ISO-35 and ISO-34 (preferably)
OK, we can rely on (C)RMs

Slide 22
TrainMiCTra in in g in Me t ro logy in Ch e m is t ry How to handle CRMs ?
• Follow the “Instructions for use” given by the supplier
• Comply with the prescribed minimum sample intake
• Respect storage temperature (-20, +4, +18 oC ?)
• Beware of humidity/moisture uptake (e.g. biological activity)
• Avoid contamination
• If method prescribed, apply protocol accordingly
Slide 23
TrainMiCTra in in g in Me t ro logy in Ch e m is t ry Use of CRMs ?
I use a CRM, therefore my measurement result isautomatically correct
I use a CRM for:� calibration inside a measurement procedure
(cf. solution standards)
� validation of analytical procedure (do I get the value given inthe certificate, applying my experimental procedure ?)
� input parameter in the model equation (I.e. Recovery)
Con
cent
ratio
n Why is there a bias?What is wrong with my procedure?
Slide 24
TrainMiCTra in in g in Me t ro logy in Ch e m is t ry Choose the proper CRM
• Is there a choice (similar matrix) ?• What is your uncertainty requirement ?• What is the uncertainty UCRM ?• Contribution of UCRM on your measurement result
(if digestion is 90% of uncertainty … ) ?• Traceability of CRM values ?• CRM supplier with demonstrated capability ?• Cost ?

Slide 25
TrainMiCTra in in g in Me t ro logy in Ch e m is t ry
• Is your procedure validated ?
• What about your Quality System ?(procedure, Lab, instruments, your staff, your organisational processes)
• Do you participate to Inter-Laboratory Comparisons ?
CRMs yes, but ...
• Do NOT use CRMs as QC samplesuse “in-house” materials or QC materials, instead(LRM, expired CRMs, etc…)
Slide 26
TrainMiCTra in in g in Me t ro logy in Ch e m is t ry How to find (C)RMs
The selection of appropriate CRM‘s by the userwith respect to sample matrix, concentration rangeand uncertainty of certified properties is essential
Information and catalogues available on the web:IRMM www.irmm.jrc.beBAM www.bam.de (& COMAR dbase)NIST www.nist.govLGC www.lgc.co.ukothers …
Slide 27
TrainMiCTra in in g in Me t ro logy in Ch e m is t ry
1) Solution standard, � Calibration Pure substances � “matrix matching” (cf. water analysis)
� Spiking / standard addition(cf. Example 1: MPA in lemonade)
2) “matrix” CRMs available2.1 “matching”(sediment sample; sediment CRM; similar concentration range)
CRM
Sample
Experimental process
Result [CRM]
Result [sample] Validated ?!
CertificateAcceptable?
(C)RM no (C)RM ?

Slide 28
TrainMiCTra in in g in Me t ro logy in Ch e m is t ry
2) “matrix” CRMs available2.2 “similar”(sediment sample; soil CRM; different concentration range)
same reasoning as in 2.1BUT, do the two matrices behave the samethroughout the whole experimental process ?� measure other CRM for confirmation
3) no available (C)RM– use different sample treatments– use different experimental methods– use ILC results
� compare results …/...
(C)RM no (C)RM ?continued
Slide 29
TrainMiCTra in in g in Me t ro logy in Ch e m is t ry
Sample
SampleTreatment
Analyticalmethod
Result
Sample
SampleTreat-1
Analyticalmethod-1
Res-1
SampleTreat-2
Analyticalmethod-1
Res-2
Sample
SampleTreat-1
Analyticalmethod-1
Res-4
Analyticalmethod-2
Res-3
Compare Results
Use (C)RMs toestimate Uncertainties
Slide 30
TrainMiCTra in in g in Me t ro logy in Ch e m is t ry
Matching - No Matching
Similar matrix AND similar analyte concentration
• Serum sample v.s. serum CRM• steel v.s. steel CRM• natural water v.s. water CRM
Similar matrix / different analyte concentrationdifferent matrix / similar analyte concentration
• wine (country 1) v.s. wine (country 2) CRM• river sediment v.s. calcareous soil CRM
� check for interferences

Slide 31
TrainMiCTra in in g in Me t ro logy in Ch e m is t ry
Recent Food Scare:MPA* in Irish pharmaceutical sucrose waste,undeclared/illegal transport to Belgium
� ended up in human food!Measurement problem / Measurand:
Total MPA content in lemonade [mg/kg]CRM available:
pure MCA
*MPA = Medroxyprogesterone-acetate
Example 1Pure substance
Slide 32
TrainMiCTra in in g in Me t ro logy in Ch e m is t ry
Method:– Procedure for MPA in human serum by GC-MS
literature = [Choi et al. (2001)]– Modify procedure to measure MPA in lemonade sample– Use standard addition method– Spike the sample with pure MPA– Determine the MPA content in limonade.
Example 1continued
� Validation required � lemonade homogeneity � spike homogeneity in lemonade � spike and measurand behaviour in matrix � pure substance traceability
Slide 33
TrainMiCTra in in g in Me t ro logy in Ch e m is t ry
Measurement problem:Determine Cu and Fe content in paper,at mg/g levels, with uncertainty of 10%.
- No international written standard procedure- No (matching) paper CRM available
Example 2
Suggested procedure:sampling 0.8 g paper, microwave digestion…; dilution with HNO3 (1 M)- Measurement using ICP-MS; - Measurement range 0.1-100 ng/ml- Possible spectral interferences- Visual inspection of digested sample : complete digestion/no residues
� “digested paper sample” matched by a water CRM

Slide 34
TrainMiCTra in in g in Me t ro logy in Ch e m is t ry
Identify (all possible) sources of uncertainty :– dilution– weighing– contamination– digestion - recovery– spike homogeneity– spike/measurand chemical form– …
Some thinking
Slide 35
TrainMiCTra in in g in Me t ro logy in Ch e m is t ry
Slide 36
TrainMiCTra in in g in Me t ro logy in Ch e m is t ry

www.trainmic.org
EUR 20841 EN
- 7 -Inter-Laboratory
Comparisons

Slide 1
TrainMiCTra in ing in Me t ro lo gy in Ch e m is t ry
Inter-Laboratory Comparisons (ILC)
and Proficiency Testing (PT)
Slide 2
TrainMiCTra in ing in Me t ro lo gy in Ch e m is t ry
Overview
• Definitions• Types of ILCs• Why to participate• How ILC are organised• Assignment of values & evaluation• ILC organisers• Corrective Action after participation
Slide 3
TrainMiCTra in ing in Me t ro lo gy in Ch e m is t ry
Inter-Laboratory Comparison - ILC ‘Organisation, performance and evaluation of testson the same or similar test items by two or morelaboratories in accordance with predeterminedconditions’
(Laboratory) Proficiency Testing - PT‘Determination of laboratory testing performanceby means of inter-laboratory test comparisons’
[ISO/IEC Guide 43:1997]
Definitions

Slide 4
TrainMiCTra in ing in Me t ro lo gy in Ch e m is t ry
• ILC to demonstrate competence andestablish degree of equivalence betweenresults of the participating laboratories
• ILC used to assign certified values to RMs
• ILC to standardise/improve a method(determine repeatability, reproducibility, ...)
• ILC as a training exercise to improve skills
Goals of an ILC
Slide 5
TrainMiCTra in ing in Me t ro lo gy in Ch e m is t ry
‘trust is nice, proof is better’
• To demonstrate your competence to– ‘yourself’ (inside your lab)– to your direct customer– to 3rd parties (e.g. accreditation)
• To improve measurement skills (educational aspect)
According to the Guide for Accreditation Bodies (EN 45003:1995, § 6.8.1):”Laboratories shall be encouraged by the accreditation bodiesto participate in proficiency testing or other inter-laboratorycomparisons”
Why participate ?
Slide 6
TrainMiCTra in ing in Me t ro lo gy in Ch e m is t ry
I - Design• Establish objectives/ purpose• Selection of organiser• Selection of sample/matrix &
measurand/analyte• Selection material provider• Preparation of Test material• Test of Homogeneity and stability• Determination of assigned/reference value• Selection of participants
Organising PT/ILC (1)
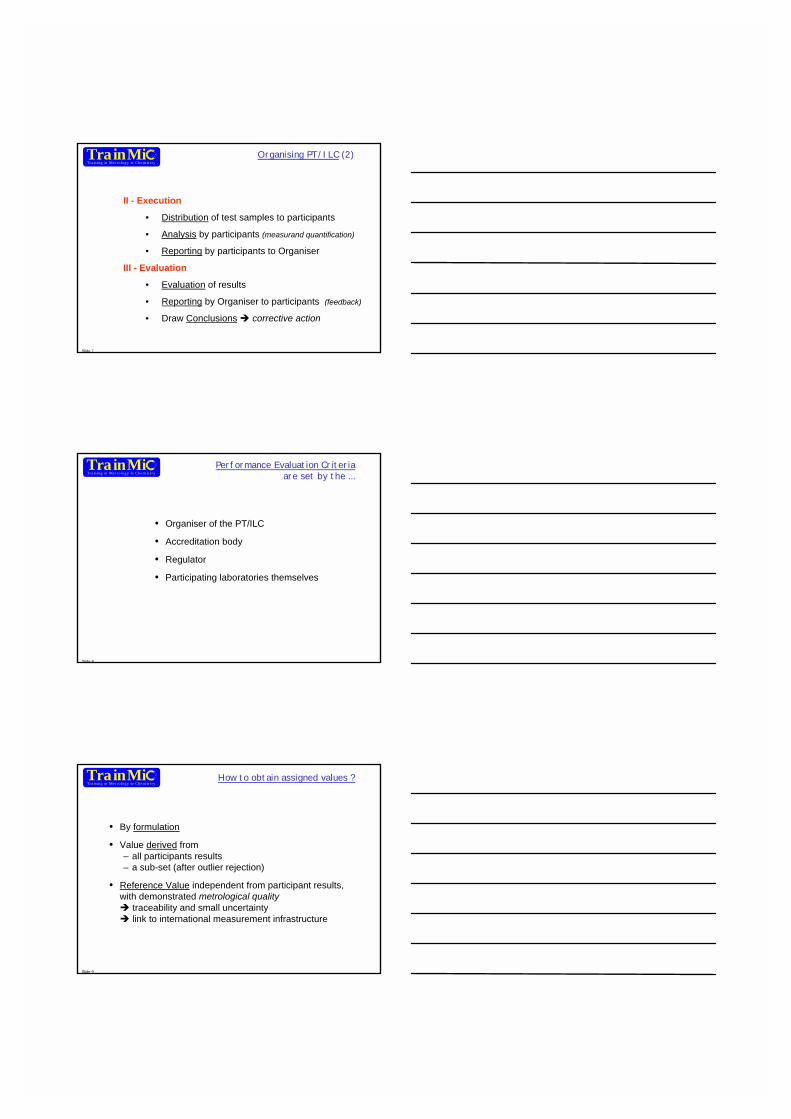
Slide 7
TrainMiCTra in ing in Me t ro lo gy in Ch e m is t ry
II - Execution
• Distribution of test samples to participants
• Analysis by participants (measurand quantification)
• Reporting by participants to Organiser
III - Evaluation
• Evaluation of results
• Reporting by Organiser to participants (feedback)
• Draw Conclusions � corrective action
Organising PT/ILC (2)
Slide 8
TrainMiCTra in ing in Me t ro lo gy in Ch e m is t ry
Performance Evaluation Criteriaare set by the ...
• Organiser of the PT/ILC
• Accreditation body
• Regulator
• Participating laboratories themselves
Slide 9
TrainMiCTra in ing in Me t ro lo gy in Ch e m is t ry
How to obtain assigned values ?
• By formulation
• Value derived from– all participants results– a sub-set (after outlier rejection)
• Reference Value independent from participant results,with demonstrated metrological quality� traceability and small uncertainty� link to international measurement infrastructure
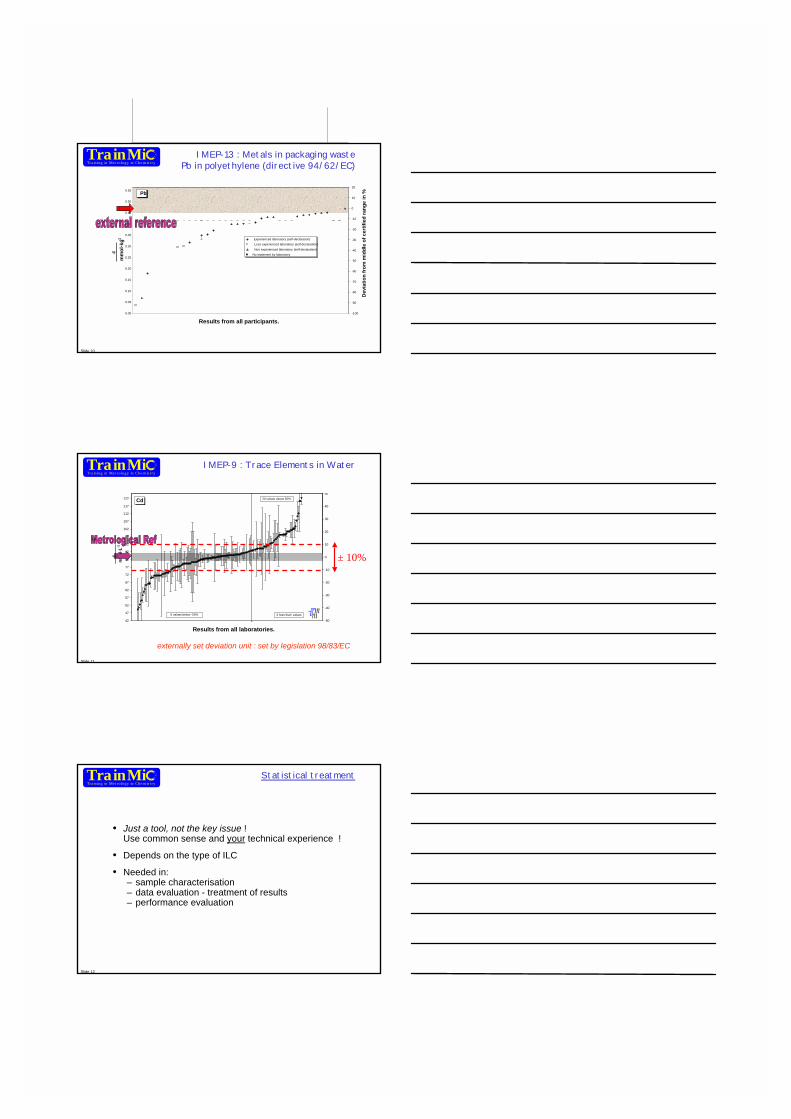
Slide 10
TrainMiCTra in ing in Me t ro lo gy in Ch e m is t ry
IMEP-13 : Metals in packaging wastePb in polyethylene (directive 94/62/EC)
0.00
0.05
0.10
0.15
0.20
0.25
0.30
0.35
0.40
0.45
0.50
0.55
c
m
mol
·kg-1
-100
-90
-80
-70
-60
-50
-40
-30
-20
-10
0
10
20
Dev
iatio
n fr
om m
iddl
e of
cer
tifie
d ra
nge
in %
Experienced laboratory (self-declaration)Less experienced laboratory (self-declaration)Non experienced laboratory (self-declaration)
No statement by laboratory
Pb
Results from all participants.
Slide 11
TrainMiCTra in ing in Me t ro lo gy in Ch e m is t ry
42
47
52
57
62
67
72
77
82
87
92
97
102
107
112
117
122
c
n
mol
·L-1
-50
-40
-30
-20
-10
0
10
20
30
40
50
Cd
Results from all laboratories.
3 'less than' values6 values below -50%
20 values above 50%
± 10%
externally set deviation unit : set by legislation 98/83/EC
IMEP-9 : Trace Elements in Water
Slide 12
TrainMiCTra in ing in Me t ro lo gy in Ch e m is t ry
Statistical treatment
• Just a tool, not the key issue !Use common sense and your technical experience !
• Depends on the type of ILC
• Needed in:– sample characterisation– data evaluation - treatment of results– performance evaluation

Slide 13
TrainMiCTra in ing in Me t ro lo gy in Ch e m is t ry
– Percent Error; %E = (xlab-xref )/xref
– Z-scores; Z = (xlab-xref )/s
– En numbers; En = (xlab-xref )/(ulab2+uref
2)½
Performance evaluation, P:P ≤ x, SatisfactoryP > x, Unsatisfactory
- x
+ x
0XREF
Performance Indicators
See Module “Statistics”
Slide 14
TrainMiCTra in ing in Me t ro lo gy in Ch e m is t ry
• Objective: determine procedure repeatability “sr” andreproducibility “sR”
• Evaluation using ANOVA (Analysis of Variance)
• Check for Outliers (before averaging/concluding)– Cochran test for variance outliers,– Grubbs test for average outliers
[ISO5725-2]
ILC for methodValidation
Slide 15
TrainMiCTra in ing in Me t ro lo gy in Ch e m is t ry
• Objective: determine the certified value and it’suncertainty for Reference Materials
• Uncertainty estimation, uchar (ISO-GUM)
• Technical Discussion Meeting
[BCR 1/97]
ILC for (C)RMcertification
See Module “CRM”

Slide 16
TrainMiCTra in ing in Me t ro lo gy in Ch e m is t ry
• Objective: determine the performance of laboratories
• Evaluation Parameters:– Assigned value– Deviation unit
• Evaluation of single performance
• Evaluation of combined performance with compositescores
[ISO Guide 43 & ISO/DIS 13528]
ILC for performanceevaluation
Slide 17
TrainMiCTra in ing in Me t ro lo gy in Ch e m is t ry
A real case example
Measurand = PbMatrix = WineMethods = (ET/GF)- AAS
ICP-MS, ICP-AESParticipants: 130Experienced Labs: Y/NWith Quality Systems : Y/NAccredited: Y/N
IMEP-16
Slide 18
TrainMiCTra in ing in Me t ro lo gy in Ch e m is t ry
I participate to ILC
Lab Code = XCountry = ???Instrumental Method: ####Sample Treatment (digestion, extraction, …)
Calibration (int, ext, std addition)
Humidity correction (when applicable)
Uncertainty Budget? � Y � NExperience in field? � Y � NPrescribed method? � Y � NQuality System? � Y � NAccredited? � Y � N
I got:[Pb] = (25.5 ± 1.6) µg/l (k=2)How did I perform?
Measurand & Matrixknown

Slide 19
TrainMiCTra in ing in Me t ro lo gy in Ch e m is t ry
0 20 40 60 80 100 120 140 1600
10
20
30
40
50
60
70
Freq
uenc
y
Pb mass fraction, µg/l
Values ranging from “- 130”“- 130” to “3000” (µg/l)
Distribution of results
Slide 20
TrainMiCTra in ing in Me t ro lo gy in Ch e m is t ry
All the results (130)
0
20
40
60
80
100
Pb m
ass
fract
ion,
µg/
l
Sorted by ascending Lab Number
Certified value[Pb] = (27.13 ± 0.33) µg/l (k=2)
Slide 21
TrainMiCTra in ing in Me t ro lo gy in Ch e m is t ry
Graph à la IMEP
0
20
40
60
80
100
Pb m
ass
fract
ion,
in µ
g/l
Sorted by ascending Measurand Value
Certified value[Pb] = (27.13 ± 0.33) µg/l (k=2)

Slide 22
TrainMiCTra in ing in Me t ro lo gy in Ch e m is t ry
Data EvaluationZ-scores
-18
-12
-6
0
6
12
18
Z-sc
ore
(1s
= 10
%)
Sorted by ascending Lab Number1s = 10%
± 3
Slide 23
TrainMiCTra in ing in Me t ro lo gy in Ch e m is t ry
How did I perform ?
value U (k=2) u RSuref 27.13 0.33 0.165 0.6%lab 25.5 1.6 0.8 3.1%
Expanded Combined
%E = 6%Z = 9.9
En = 2.0 passed
Slide 24
TrainMiCTra in ing in Me t ro lo gy in Ch e m is t ry
Preferred experimental method ?
0
20
40
60
80
100
Pb m
ass
fract
ion,
in µ
g/l
(ET/GF)-AAS ICP-OES ICP-MS

Slide 25
TrainMiCTra in ing in Me t ro lo gy in Ch e m is t ry
Normality Plot
-3 -2 -1 0 1 2 3
500
600
700
800
900
1000
1100
mas
s fra
ctio
n (m
g/kg
)
Normal order statistics medians
Slide 26
TrainMiCTra in ing in Me t ro lo gy in Ch e m is t ry Corrective Action after participation :
1) ‘blunder’(measurement system out of control, calculation error)
2) Measurement ‘model’ is not correct : the mathematicaldescription of reality is not complete enough,(e.g. bias not taken into account: digestion? extraction?)
3) Underestimated uncertainty of an influencing input quantity
4) Combination of 2) and 3)
Unsatisfactory performance? � Spot the mistake & implement Corrective Action
Slide 27
TrainMiCTra in ing in Me t ro lo gy in Ch e m is t ry
Solid External Referencesin CCQM-P16
0.066
0.088
0.110
0.132
0.154
0.176
0.198
-50
-40
-30
-20
-10
0
10
20
30
40
50
Results from all CCQM-P16 participants
grey band = IMEP-16 reference range

Slide 28
TrainMiCTra in ing in Me t ro lo gy in Ch e m is t ry
• CCQM (www.bipm.fr)• IMEP by IRMM (www.imep.ws)
– external reference value, linked to internationalmeasurement capability
– support to EA (European Cooperation Accreditation)– on issues related to EU directives, crossing borders of
sectors & geographic regions• FAPAS (www.fapas.com)• AFSSA (www.afssa.fr)• EA (www.european-accreditation.org)• Community Reference Laboratories (CRLs), for National
Reference Laboratories (NRLs)• Other � check www.eptis.bam.de
(European Information System on PT Schemes)
Who organises ILC/PT ?
Slide 29
TrainMiCTra in ing in Me t ro lo gy in Ch e m is t ry
AFSSAnational
CRL, NRLsinternational
CCQMmetrology
International measurementequivalence
Accreditation
FAPAScommercial
IRMM = 27.3 ± 0.3
Routine lab: 28 ± 2
(C)R
M
See PT organisers
Slide 30
TrainMiCTra in ing in Me t ro lo gy in Ch e m is t ry

www.trainmic.org
EUR 20841 EN
List ofAbbreviations

www.trainmic.org
EUR 20841 EN
AFSSA Agence Française de Sécurité Sanitaire des Aliments
French Food Safety Agency
APLAC Asia Pacific Laboratory Accreditation Cooperation
APMP Asia-Pacific Metrology Programme
BIPM Bureau International des Poids et Mesures
International Bureau for Weights and Measures
CCQM Consultative Committee for Amount of Substance
CEN Comité Européen de Normalisation
European Committee for Standardization
CGPM Conférence Générale des Poids et Mesures
General Conference on Weights and Measures
CIPM Comité International des Poids et Mesures
International Committee for Weights and Measures
EA European Accreditation
EUROMET European Collaboration in Measurement Standards
FAPAS Food Analysis Performance Assessment Scheme
GUM Guide to Expression of Uncertainty in Measurement
ILAC International Laboratory Accreditation Cooperation
ISO International Organization for Standardization
IUPAC International Union for Pure and Applied Chemistry
OIML International Organisation for Legal Metrology
MRA Mutual Recognition Arrangement
SIM Inter-American Metrology System
VIM International Vocabulary of Basic and General Terms in Metrology
www.trainmic.org
EUR 20841 EN
Glossary

www.trainmic.org
EUR 20841 EN
Terms DefinitionsAccuracy of measurement Closeness of the agreement between the result of a
measurement and a true value of the measurand[VIM 3.5]
Calibration Set of operations that establish, under specifiedconditions, the relationship between values ofquantities indicated by a measuring instrument ormeasuring system, or values represented by a materialmeasure or a reference materials, and the corres-ponding values realized by standards [VIM 6.11]
Certified Reference Materials Reference Materials, accompanied by a certificate,one or more of whose property values are certified bya procedure which establishes traceability to anaccurate realization of the unit in which the propertyvalues are expressed, and for which each certifiedvalue is accompanied by an uncertainty at a statedlevel of confidence [VIM 6.14]
Expanded uncertainty Quantity defining an interval about the result of ameasurement that may be expected to encompass alarge fraction of the distribution of values that couldreasonably be attributed to the measurand
International (measurement)standard
Standard recognized by an international agreement toserve internationally as the basis for assigning valuesto other standards of the quantity concerned [VIM 6.2]
Measurand Particular quantity subject to measurement [VIM 2.1]
Measurement Set of operations having the object of determining avalue of a quantity [VIM 2.1]
Measurement procedure Set of operations, described specifically, used in theperformance of particular measurements according toa given method [VIM 2.5]
Measurement standard (etalon) Material measure, measuring instrument, referencematerial or measuring system intended to define,realize, conserve or reproduce a unit or one morevalues of a quantity to serve as a reference [VIM 6.1]
Method of measurement Logical sequence of operations, described generically,used in the performance of measurements [VIM 2.4]
Metrology Science of measurement - Metrology includes allaspects both theoretical and practical with reference tomeasurements, whatever their uncertainty, andwhatever fields of science or technology they occur[VIM 2.2]
Model equation The equation used to calculate the result of ameasurement
National(measurement) standard Standard recognized by a national decision to serve, ina country, as the basis for assigning values to otherstandards of the quantity concerned [VIM 6.3]
Primary method A method of the highest metrological quality whichwhen implemented can be described and understoodcompletely, and for which a complete uncertaintybudget can be provided in SI units, the results of whichcan therefore be accepted without reference to astandard for the magnitude being measured.

www.trainmic.org
EUR 20841 EN
Terms DefinitionsPrimary standard Standard that is designated or widely acknowledged
as having the highest metrological quantities andwhose value is accepted without reference to otherstandards of the same quantity [VIM 6.4]
Quantity Attribute of a phenomenon, body or substance thatmay be distinguished qualitatively and determinedquantitatively [VIM 1.1]
Reference Material Material or substance one or more of whose propertyvalues are sufficiently homogeneous and wellestablished to be used for the calibration of anapparatus, the assessment of a measurement method,or for assigning values to materials [VIM 6.13]
Repeatability (of results ofmeasurements)
Closeness of the agreement between the results ofsuccessive measurements of the same measurandcarried out under the same conditions of measurement[VIM 3.6]
Reproducibility (of results ofmeasurements)
Closeness of the agreement between the results ofmeasurements of the same measurand carried outunder changed conditions of measurement [VIM 3.7]
Result of a measurement Value attributed to a measurand, obtained bymeasurement [VIM 3.1]
SI system The international system of unit continuing the formaldefinition of all SI basic units, approved by the GeneralConference on Weights and Measures
Standard uncertainty Uncertainty of the results of a measurement expressedas a standard deviation
Traceability Property of result of a measurement or the value of astandard whereby it can be related to statedreferences, usually national or international standards,through an unbroken chain of comparisons all havingstated uncertainties [VIM 6.10]
True value (of a quantity) Value consistent with the definition of a given particularquantity [VIM 1.19]
Uncertainty of measurement Parameter, associated with the result of ameasurement, that characterizes the dispersion of thevalues that could reasonably be attributed to themeasurand [VIM 3.9]
Unit (of measurement) Particular quantity defined and adopted by convention,with which other quantities of the same kind arecompared in order to express their magnitudes relativeto that quantity.
Value (of a quantity) Magnitude of a particular quantity generally expressedas a unit of measurement multiplied by a number[VIM 1.18]

www.trainmic.org
EUR 20841 EN
Bibliography

www.trainmic.org
EUR 20841 EN
1 B. King The practical realisation of the traceability of chemical measurementsstandards, Accred. & Qual. Assurance (2000), 5: 429-436
2 Eurachem/CITAC Guide: Quantifying Uncertainty in Analytical Measurement, 2ndEdition, 2000
3 Eurachem/CITAC Guide: A Fitness for Purpose of Analytical Measurements: ALaboratory Guide to Method validation and related topics, 1998
4 Eurachem/CITAC Guide: Quality Assurance for Research and Development and Non-routine Analysis,1998
5 Eurachem/CITAC Guide: Traceability in Chemical Measurement, Voting Draft , 20036 GUM-Guide to Expression of Uncertainty in Measurement, ISO, 19957 ILAC Guide 13: Requirements for the Accreditation of Providers of Proficiency
Testing Schemes8 ISO 21748: GUM approach9 ISO 3534-1: Statistics – Vocabulary and symbols; Part 1: Probability and general
statistical terms10 ISO 5725 Part 1-6: Accuracy (trueness and precision) of measurement methods and
results11 ISO Guide 30: Certification of reference materials. General and Statistical Principles,
1998512 ISO Guide 30: Terms and definitions used in connection with reference materials,
198113 ISO Guide 31: Content of certificates of reference materials, 198114 ISO Guide 33: Uses of certified reference materials15 ISO Guide 34: Quality system requirements for reference materials producers, 199416 ISO Guide 43: Proficiency Testing by interlaboratory comparisons17 ISO/DIS 13528: Statistical methods for use in proficiency testing by interlaboratory
comparisons18 ISO/IEC 17025: General Requirements for the Competence of Testing and
Calibration Laboratories, 199919 J.C. Miller, J.N. Miller, Statistics for Analytical Chemistry, Ellis & Horwood, Chichester
(ISBN 0-13-845421-3)20 Kragten, J., The Analyst 119 (1994), 2161-216521 Massat et. Al. . 1997, Handbook of Chemometrics and Qualimetrics. Elsevier,
Amsterdam (ISBN 0-444-82854-0)22 Metrological Time lines in Traceability, J. of Research of NIST, Vol. 103, No. 1, Jan-
Febr. 199823 Protocol for the design, conduct and interpretation of inter-laboratory studies, Pure
and Applied Chemistry, 67, 331-243, 199524 Recovery Factors, Pure and Applied Chemistry, Vol. 71, 337-348, 199925 The International Harmonised Protocol for the Proficiency Testing of (chemical)
Analytical Laboratories, J. AOAC Int. 76: 926-94026 VIM-International Vocabulary of Basic and General Terms in Metrology, ISO, 1993

www.trainmic.org
EUR 20841 EN

European Commission
EUR 20841 EN– DG Joint Research Centre, Institute for Reference Materials and Measurements –TrainMiC – Training in Metrology in ChemistryEditor(s): P. Robouch, E. Bulska, S. Duta, M. Lauwaars, I. Leito, N. Majcen, J.Norgaard, M. Suchanek,E. Vassileva and P. TaylorLuxembourg: Office for Official Publications of the European Communities2003 – 102 pp. – 21.0 x 29.7 cmScientific and Technical Research seriesISBN 92-894-6238-8
AbstractA common understanding of issues related to measurement science applied to chemistry is essentialamong European member states and acceding- candidate countries. An education platform was thereforecreated to respond to this challenge: TrainMiC, Training in Metrology in Chemistry.After a brief presentation of TrainMiC and an overview of TrainMiC events, this report provides thecomplete set of the training material. The seven modules are included in the Appendix.

The mission of the Joint Research Centre is to provide customer-driven scientific and technicalsupport for the conception, development, implementation and monitoring of European Unionpolicies. As a service of the European Commission, the JRC functions as a reference centre ofscience and technology for the Community. Close to the policy-making process, it serves thecommon interest of the Member States, while being independent of commercial and nationalinterests.
15LA-N
A-20841-EN-C