Ozone Water Disinfection - Purdue Engineeringjafvert/GEP_EEE/Ozone...Ozone is used for disinfection...
54
Final Project Report: Ozone Water Disinfection Design Team: Kelsey Hunter 1 , Dianne Kaminsky 1 , Clinton Pflum 1 , Fernando Segovia 2 1 Second Semester Senior Design Student 2 GEP Student 1 Division of Environmental & Ecological Engineering, Purdue University 04/26/2013 Faculty Advisers: John Howarter Chad T. Jafvert Materials Engineering, and Civil Engineering, and Environmental & Ecological Engineering Environmental & Ecological Engineering email: [email protected] email: [email protected] Graduate Assistants: Dan Su Yingcan Zhao
Transcript of Ozone Water Disinfection - Purdue Engineeringjafvert/GEP_EEE/Ozone...Ozone is used for disinfection...

Final Project Report:
Ozone Water Disinfection
Design Team:
Kelsey Hunter1, Dianne Kaminsky1, Clinton Pflum1, Fernando Segovia2
1Second Semester Senior Design Student 2GEP Student
1Division of Environmental & Ecological Engineering, Purdue University
04/26/2013
Faculty Advisers: John Howarter Chad T. Jafvert Materials Engineering, and Civil Engineering, and Environmental & Ecological Engineering Environmental & Ecological Engineering email: [email protected] email: [email protected] Graduate Assistants: Dan Su Yingcan Zhao
1
Executive Summary The presence of parasites and microbiological organisms in water treated by slow sand filtration indicates that further treatment is necessary prior to human consumption. Chlorination is the most commonly used method of water disinfection, but chlorine is not always effective at inactivating Giardia lamblia (EPA, 1999), which is particularly prevalent in South America. Chlorination is therefore not a viable single method of disinfection for the community partner (i.e. on the mountain slopes of Barbosa, Colombia). On the other hand, ozone has been shown to be effective at inactivating Giardia (EPA, 1999). Ozone is typically expensive and energy intensive to produce and thus it has been predominantly used in municipal waste water treatment facilities. Furthermore, point-of-use (POU) ozone generators are not common, and therefore commercial systems are too expensive and not viable options. However because of the effectiveness of ozone disinfection against Giardia, an alternative to commercial ozone POU generators was pursued. The Ozone Disinfection Team was created to research and design a cost effective, batch ozone disinfection system to be used as secondary treatment in series with slow sand filtration. Previously established slow sand filtration (SSF) systems are effective at removing dissolved organic matter (DOM) and total suspended solids (TSS) from drinking water. Sand particles provide filtration and a medium for growth of the Schmutzdecke (i.e. biological) layer. Efforts by previous Global Design Teams (GDTs) at Purdue have successfully shown SSFs, operated in batch mode, as a successful method for removing DOM and TSS. The successes achieved by those projects have gone a long way toward increasing water quality for rural communities in Barbosa, Colombia (i.e. our community partner). However, while SSF is an effective way to remove DOM and TSS, disinfection is required for the inactivation of any residual microorganisms and parasites. In Colombia, one of the most problematic parasites is Giardia lamblia. It is estimated that in developing countries, much like Colombia, nearly 33% of the people have suffered from Giardiasis (a diarrheal disease caused by Giardia lamblia) (Center for Disease Control and Prevention, 2012). The reason that chlorination generally is ineffective for Giardia is due to the parasite’s sturdy outer shell (Center for Disease Control and Prevention, 2011). As a result, teams are working on projects aimed at implementing alternative methods for disinfection: UV and Ozone. This report specifically addresses the development of methods for ozone production at the point-of-use home or school scale. Ozone is well known to be a very powerful oxidant and is already used in many disinfection settings in developed countries. The goal of this project was to design and construct a point-of-use ozone generator for use by our community partners in South America. In order to meet expectations, the following series of goals and criteria were established:
a. The reactor should be constructed of common, low technology and low cost items that will generate a sufficient supply of ozone for point-of-use application.
b. An effective method for measuring the concentration of ozone in aqueous solution should be developed.
c. Through research and experimentation, the aqueous phase concentration and contact time of ozone that is required to effectively inactivate Giardia lamblia should be determined.

2
List of Terms and Acronyms
Cryptosporidium – Genus of protozoa with similar characteristics to G. lamblia DI – Deionized (water); all ions (Na+, Ca2+, Cl-, SO4
2-, etc.) removed Disinfection – Removal of harmful micro-organisms from drinking water, either via filtration or
chemical addition. DOM – Dissolved organic matter Giardia lamblia – Protozoan parasite found in contaminated water. Giardiasis – Infection of G. lamblia in the small intestine. Can cause severe diarrhea and dehydration. GFP – Ground fault protection gpm – Gallons per minute Half-Life – The time required for a quantity to be reduced to ½ its original amount. Inactivation – Destruction of a micro-organism’s ability to infect other cells. Indigo trisulfonate – Chemical indicator dye used to react with ozone in order to monitor O3
aqueous phase concentration. MF – Membrane Filtration NEMA – National Electrical Manufacturers Association NOM – Natural organic matter OM – Organic Matter Oxidant – Oxidizing agent. Can be used to break down organic matter. POU – Point-of-use pp(m/b) – parts per (million/billion) Residual – Chemical disinfectant remaining in solution with the drinking water throughout the
distribution network. Intended to prevent microbial contaminants form forming between initial disinfection and human consumption.
Schmutzedecke – Naturally occurring biological layer at surface of SSF. Consumes much of the OM from filtering water.
SOC – Synthetic organic compounds Sodium dihydrogen phosphate – Chemical used in Indigo Reagent I. SSF – Slow sand filtration TNTC – too numerous to count Transformer – A static electrical device which transfers energy by inductive coupling between
its winding circuits. TSS – Total suspended solids UV – Ultraviolet radiation. Wavelength approximately 10-400 nm.

3
I. Introduction
Project Background To address some of the drinking water quality issues of our partner community in Colombia, previous Global Engineering Program design teams have constructed several slow sand filters in rural elementary schools in the Barbosa area. These filters are comprised of two 5 gallon pails stacked upon one another, each containing layered sand and gravel filtration media. Slow sand filtration (SSF) systems are effective at removing dissolved organic matter (DOM) and total suspended solids (TSS) from surface waters. Suspended particles are removed by attachment to the sand grains as the water flows through the sand (i.e., filtration). The sand particles also provide a large surface area to which the desired microorganisms can attach. These microorganisms mineralize the filtered particles and the dissolved organic matter. As a result, both the turbidity of the water (caused by suspended particles), and the color or tint of the water (caused by DOM), are removed. After several weeks of operation, a schmutzdecke (i.e. biological slime layer) begins to form on the top surface of the sand. This layer of microorganisms further increases TSS and DOM removal rates. Although the SSF system is highly effective, disinfection of the effluent water is still needed due to the possible presence of human pathogens. Chlorination is the most commonly used method of water disinfection, but is generally ineffective at inactivating Giardia lamblia (EPA, 1999), a common intestinal infecting protozoa found in South America. Chlorination alone is therefore not a viable disinfection method for our community partner. On the other hand, ozone has been shown to be effective at inactivating Giardia (EPA, 1999). Ozone can be expensive and energy intensive to produce, and thus has been predominantly used in municipal wastewater treatment facilities. Furthermore, point-of-use (POU) ozone generators are not common, and therefore commercial systems are expensive and not viable options. Due to its effectiveness against Giardia, an alternative to commercial POU generators was pursued. The Ozone Disinfection Team was created to research and design a cost effective, batch ozone disinfection system to be used to disinfect the effluent water from the slow sand filters. Generation of Ozone There are three common methods used to produce ozone: corona discharge, UV radiation, and cold plasma. All of these methods can be achieved for POU generation (i.e. as opposed to industrial scale generation.) In all of these methods molecular oxygen molecules are energetically excited to the point where separation of the oxygen atoms is induced followed immediately by recombination with molecular oxygen (O2) forming O3 (Singer et al., 1982),
O2 � energy 2 O· (1)
O· � O2 O3 (2)
4
Corona Discharge. In corona discharge, ozone is generated by causing a voltage drop between two conductors separated by an insulator and passing ambient air through the system. Without an insulator, the current will arc and generate heat (i.e., lightning arcs through air). As will be described latter, the prototype generator designed in this study uses a transformer (AKA voltage multiplier) to create a large enough voltage drop (3,600 V) that O2 molecules split by oscillating charge between electrodes (i.e. from one conductor to another). The effect created by the oscillating charges is called the corona (USA Patent 4892713; Jung et al., 2008). UV Radiation. This method uses the same mechanism that occurs in the stratosphere of the earth where shorter wavelength UV radiation from the sun (< 300 nm) exists. Artificially generating ozone is less effective because it requires gas (ambient air, or oxygen) exposed to UV radiation in batch. Appropriate flow rates thus need to be experimentally established to account for UV bulb output decay. Cold Plasma. This method nearly mimics corona discharge except that the voltage drop is created across a dielectric insulating barrier (as opposed to a neutral insulator). The ozone yield by cold plasma is larger than that of corona discharge because ambient air is exposed to more energy due to the exposure to the plasma region (ionized gas) created by the dielectric barrier separating the electrodes (Bes et al., 1985). In the United States, the first ozonation plant for the disinfection of municipal effluent water was built in 1975 (Paraskeva and Graham, 2002). Although ozone can be used as a sustainable disinfectant, it seems unlikely that it will replace chlorine because of the expense of industrial ozone generators and the lack of a disinfectant residual in the drinking water, due to the short half-half of ozone. This report explores the feasibility of using ozone as a primary disinfectant for point of use applications because the water disinfected in batch mode can either be immediately consumed or further disinfected with a chlorine residual. Ozone and its Effect on Giardia lamblia Ozone is used for disinfection and oxidation in water treatment (EPA, 1999). It is one of the most powerful oxidants utilized in treating water. Ozone decomposition forms hydroxyl radicals, which reacts with natural organic matter (NOM), bromide, and bicarbonate. In addition it reacts with organic constituents and pathogens. When applied to drinking water treatment, ozone is used to disinfect, remove inorganic pollutants, and oxidize organic micropollutant and macropollutant materials (EPA, 1999). The inactivation of bacteria by ozone is attributed to oxidation reactions known to effect glycoproteins or glycolipids in bacterial membranes or through reactions with certain amino acids (EPA, 1999). In viruses, ozone attacks the protein capsid, liberates the nucleic acid and inactivates the DNA. With Giardia muris, ozone is thought to affect the cysts wall making it more permeable, damaging the plasma membranes, which eventually affects the nucleus, ribosomes, and other cell components. One of the main concerns with disinfection treatment involves the inactivation of protozoa, specifically Giardia lamblia pictured in Figure 1. Giardia lamblia has created some of the

5
largest problems for disinfection in Colombia. In developing countries, it is estimated that 33% of people have contracted Giardiasis, a diarrheal disease caused by Giardia (Center for Disease Control and Prevention, 2012). Giardia lamblia has sensitivity to ozone that is similar to the popular forms of Mycobacteria (EPA, 1999). In terms of disinfection, ozone is more effective than chlorine, chloramines, and chlorine dioxide for inactivation of viruses, Cryptosporidium, and Giardia (EPA, 1999). Owens et al., (2000) state: “Protozoan cysts, specifically Giardia and Cryptosporidium, and bacterial spores are more resistant to ozone than bacteria and viruses, although moderate degrees of inactivation have been demonstrated under realistic ozonation conditions” . Furthermore, it has been reported that microorganism reactivation after ozonation is unlikely to occur (Paraskeva et al., 2002) and therefore should meet inactivation regulations.
Both Giardia and Cytosporidium are prevalent in raw water and have become concerns of public health as waterborne pathogens. A study completed by Hsu and Yeh (2003) examined the effects of parasites in water samples taken from three separate pilot-scale plant processes. The study was aimed at determining the most efficient method of water filtration that will remove the largest percentage of both protozoan parasites. Coagulation and sedimentation removed the majority of Giardia and Cytosporidium in the raw water samples. However, the study showed that through the use of pre-ozonation, the protozoa concentrations were decreased to non-detectable levels for Giardia cysts. This shows that pre-ozonation treatment can damage the structure of (oo)cysts effectively, while post-ozonation was proven better for (oo)cysts inactivation compared to chlorine (Hsu and Yeh, 2003). The use of ozone as a disinfectant shows promising results in terms of the ability to destroy specific protozoan that are known to infect drinking water sources in Colombia. Measuring Ozone Concentration in Water To determine if the ozone generator produces sufficient ozone to disinfect water, and to ensure that residual ozone does not make the treated water unsafe to consume, it was necessary to measure aqueous ozone concentrations. Ozone in water decays rapidly and typically has a half-life of ten to fifteen minutes (Standard Methods, 2005). Ozone test-strips are often used to
Figure 1. Photograph of Giardia cysts (Source: microbiology.mtsinai.on.ca)

6
measure the concentration of ozone present in spas or pools that are treated with ozone. A more accurate method, especially at low concentrations, is the indigo colorimetric method. The indigo colorimetric method is the most accurate and accepted method for measuring aqueous ozone concentrations. Standard Methods discusses the indigo colorimetric method, originally developed by Badger and Hoigené (1980). Indigo and its water soluble derivatives, such as indigo trisulfonate, were first used to measure ozone in air or exhaust gases. Bader and Hoigené developed a method using indigo trisulfonate for the purpose of analyzing ozone concentrations in aqueous systems. The method involves determining aqueous ozone concentrations by the decolorization of indigo (Bader and Hoigené, 1980) as ozone rapidly decolorizes (i.e., oxidizes) indigo in acidic solution (Standard Methods, 2005). The indigo method was not originally developed with the intentions of analyzing ozone in drinking water, but is applicable to lake water, river infiltrate, manganese-containing groundwaters, extremely hard groundwaters, and biologically treated domestic wastewaters (Standard Methods, 2005). The indigo colorimetric method is applicable to this project as it is the standard method for measuring aqueous concentrations of ozone and is more accurate and less expensive than ozone test-strips. In the indigo method, indigo trisulfonate is added to a water sample and then the decolorization (i.e., loss in light absorbance) is measured with a UV/Vis spectrophotometer at 600 nm. In addition, the materials needed in order to perform an aqueous ozone analysis include: distilled water, concentrated phosphoric acid, potassium indigo trisulfonate, sodium dihydrogen phosphate, malonic acid, and glycerin (Bade and Hoigené, 2005). The acid is needed to reduce the pH below 4 – the pH required for ozone to rapidly decolorize indigo (Standard Methods, 2005). Once the pH has been reduced and the indigo is added, the spectrometer is used to determine concentrations based on the difference in absorbance between the sample and a blank. The procedure varies slightly depending on the range of ozone concentrations; for samples, with higher concentrations, more indigo is added. Ozone test-strips are helpful for determining the concentration range of interest. The indigo colorimetric method has several advantages. A main advantage is that it uses commercially available and affordable reagents. Another advantage is that it precisely measures ozone concentrations with an error of generally less than 5%, and often within 2% (Bader and Hoigené, 1980). The reagent solution remains stable for three months, indicating that a stock solution can be made to reduce procedure time and materials cost. The developers of this method state that the indigo colorimetric method is sensitive, precise, fast, specific, and easy to perform (Bader and Hoigené, 1980). The indigo method does have certain limitations. The practical lower limit for residual measurement is 10 to 20 µg/L O3 (Standard Methods, 2005) which is much lower than the practical lower limit of the test-strips. Furthermore, the presence of chlorine or bromine in water samples has the potential to interfere with measurements. Contact Time for Giardia Inactivation According to Colombia Water Regulations, drinking water must be treated so that a 2 log – or 99% - inactivation of Giardia lamblia is achieved (Colombia Ministry of the Environment, 2007). The U.S. EPA provides information about the effectiveness of inactivation for various

7
disinfectants. In a health advisory report about Giardia, the U.S. EPA analyzes typically utilized water disinfectants including ozone, mixed oxidants, chlorine dioxide, iodine, free chlorine, and chloramines. Of the disinfectants mentioned, ozone is the most efficient disinfectant in terms of Giardia inactivation and chloramines are the least efficient (U.S. EPA, November 1999). This document also provides the necessary contact times to achieve 99% inactivation of Giardia cysts for each type of disinfectant. Contact time is the concentration of the disinfection (in mg/L) multiplied by time (in minutes). The contact time necessary for ozone to disinfect water at 25°C is 0.2 mg/L × min (U.S. EPA, November 1999). At 5°C the necessary contact time with ozone as the disinfectant is 0.5 mg/L × min (U.S. EPA, November 1999). These are significantly more efficient contact times as compared to the most efficient form of chlorine, chlorine dioxide. The contact times for chlorine dioxide are 5 mg/L × min at 25°C and 11 mg/L × min at 5°C (U.S. EPA, November 1999). In order to disinfect slow-sand filtered water, it must be treated with ozone for a period of time that achieves a contact time of 0.2 mg/L × min. The necessary time the ozone disinfection system must operate is established based on the aqueous concentration of ozone the ozone generator is able to produce. Standards for Electrical Enclosures The National Electrical Manufacturers Association (NEMA) defines standards for various grades of electrical enclosures. The enclosure that is most applicable to this project is a NEMA Type 3 enclosure and is defined in NEMA 250 as:
“Enclosures constructed for either indoor or outdoor use to provide a degree of protection to personnel against incidental contact with the enclosed equipment; to provide a degree of protection against falling dirt, rain, sleet, snow, and windblown dust; and that will be undamaged by the external formation of ice on the enclosure” (NEMA 250, 2003).
A safe electrical enclosure is necessary for the ozone generation system in order to protect the users. As it is possible that the schools in Colombia will place the unit outside, an enclosure type that will protect personal and equipment both indoors and outdoors is necessary. The selected electrical enclosure for the ozone generation system must therefore comply with NEMA Type 3 standards. II. Design Goals, Tasks, and Criteria Design Goals The overall goal of this project was to research, construct, and evaluate an ozone disinfection system to be combined with a slow sand filtration system for rural schools in Barbosa, Colombia. This disinfection method should disinfect in accordance with Colombian drinking water standards. In addition, it should be safe and easy to operation, with minimal instructions, and housed in a proper casing material and contain components that are resistant to ozone degradation and that will withstand the electrical voltage that develops during corona discharge.

8
Project Tasks The overall project task was to research and develop a disinfection system to treat slow sand filtered water. The delivered disinfectant dose must satisfy Colombia drinking water standards. One of the main targets of disinfection is the protozoa, Giardia lamblia. As a result, the disinfection system was designed to target this protozoon. The materials should be resistant to oxidation and electrical current as well as comply with NEMA standards of safety. The design of the system should be compatible with the slow sand filter system, as they will be used in tandem. The ozone disinfection system needs to treat the volume of water produced daily by the SSFs. The disinfection batch size was determined based on these operating conditions. The final project task concerns the overall price of the system. As this system will be implemented in a rural area in a developing country, cost is a major factor for the project design. Design materials were chosen for their effectiveness, safety, and additionally, their price and availability. Design Criteria The design criteria for this project have been designated as either must criteria or want criteria. The must criteria include effective disinfection, appropriate materials, and operation safety. The want criteria include batch size and price. Each of these criteria is described in more detail below. Must Criteria: Disinfection: The extent of disinfection (i.e., dose) should comply with the Colombia drinking water standards set in place by the national government. Currently, teachers at the schools where SSFs were installed, boil the water after SSF in order to remove the remaining pathogens. This is costly and requires much time. Ozone is one of the most powerful oxidants utilized in treating water (EPA, 1999) and an ozone disinfection system would eliminate the need for boiling, as well as reduce the dependence on propane. As a standard for disinfection, the Colombia Water Regulation committee requires a two log, or 99%, reduction in the protozoa Giardia, (Colombia Water Regulations, 2007). Materials: Because ozone is a highly corrosive gas, all materials need to be resistant to oxidation. Hence, system components, including the tubing, diffuser, insulator, conductors, unit casing, and water container need to be ozone resistant. In addition, the system operates on an AC electric current to generate the corona discharge. As a result, all materials should be in compliance with NEMA safety standards. Operation Safety: The stakeholders and operators of the ozone disinfection systems are teachers in rural Colombian schools. Therefor a necessary design criterion was to provide a degree of safety during system operation. A protective casing is required to minimize exposure to the
9
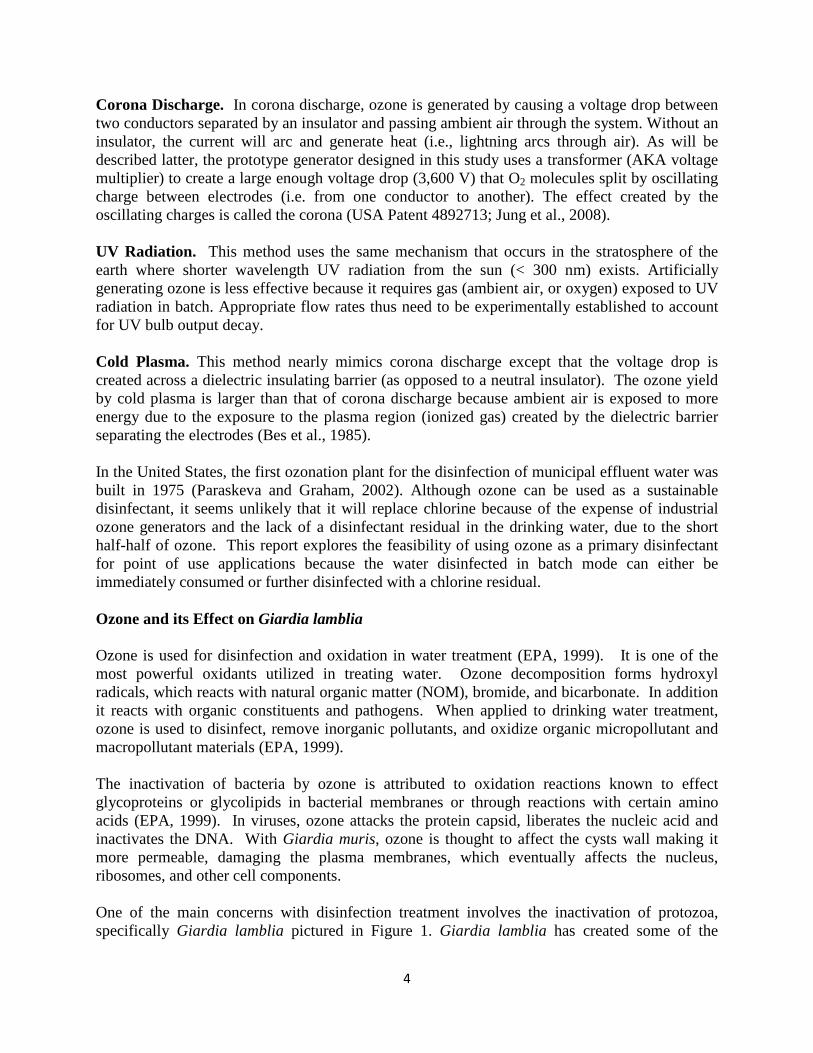
transformer and electrical cords. The system should be easy to use and maintain to keep the operator and school children safe. Want Criteria: Batch Size: The current SSF systems operate with a batch size of 5 L. Therefore the ozone generator was designed to disinfection 5 L in batch mode (i.e., without flow-through). Price: An aim is to create an effective ozone generator for less than $50 USD. III. Project Results Design and Prototype A prototype ozone generator was constructed using the corona discharge method. The system generates ozone inside a sealed insulated glass reactor that uses a 0.608 gpm aquarium pump to transport ambient air through the reactor. The corona effect is achieved by an early model neon sign transformer called a Core & Core (C&C) neon transformer (Input: 60Hz 120V & Output: 8 mA / 3500V). Sponholtz (1999), Yehia et al. (2000), and Ibarra et al. (2008) have shown that transformer induced coronas are the most viable method for producing the required voltage drops for ozone generation in small scale reactors. C&C transformers are not embedded with ground fault protection (GFP) circuits that immediately shut off the power when current runs to either electrode sporadically (i.e., not constant). Transformer GFP circuits are calibrated to avoid exposed circuits and thus injuries in commercial products. Any final ozone generator can be calibrated with a GFP to incorporate a factor of safety. The C&C transformer is pictured in Figure 2.
The ozone reactor is housed in a glass jar used mainly for containment of the generated ozone. Inside, is a smaller glass jar used to separate the two conductors. The conductors were stainless steel in the case of Prototype I, and aluminum foil in the case of Prototype II, and are connected to the power source. A schematic of the ozone generator is shown in Figure 3.
Figure 2. Core Coil Neon Transformer: Input: 120V. Output: 8 mA / 3500V

10
Materials and Cost Analysis Materials used in the construction of the ozone generator include: a 32 oz. glass jar; an 8 oz. glass jar; a neon transformer; high-voltage electrical wires; plastic tubing; a diffuser stone; and aluminum foil. One of the design criteria of this project was to construct the generator for less than $50. A cost analysis was performed to determine if this criterion was met. In this analysis, the prices of each item used in construction were converted into the price per unit of material. This “per unit price” was then multiplied by the approximate amount of material used in the construction of the prototype. These values were summed to estimate the price per ozone generator. The cost analysis is summarized in Table 1. Table 1. Prototype Cost Analysis
Item Description Item
Purchase Cost ($)
Per Unit Cost ($)
Amount Used
Cost per Generator ($)
302°F High-Voltage Wire, 22AWG, 0.111" OD, 10000 VDC, White
1.91 1.91 2 ft 3.82
Push-in Grommet 1/8" ID, 11/32" OD, 1/16" Thk for 3/16" Dia Panel Hole, packs 100
3.62 0.04 8 grommets 0.15
Push-in Grommet 1/4" ID, 1/2" OD, 1/16" Thk for 3/8" Dia Panel Hole, packs of 100
5.66 0.06 8 grommets 0.45
Air Pump-Tubing (25 ft) 3.56 0.14 4 ft 0.57
Diffuser Stone (2 pack) 2.53 1.27 1 rock 1.27
Figure 3. Reactor Prototype Schematic

11
Electrical Tape (20 ft) 2.03 0.10 1 ft 0.10
Aluminum Foil (25 sq ft) $ 3.95
0.16 1 ft2 0.16
Economy Clear Glass Jar 8oz. 250 mL, 2-7/8" Base Diameter, 3-1/2" Height
3.99 3.99 1 jar
3.99
Economy Clear Glass Jar 32 oz, 1,000ml, 3-3/4' Base Diameter, 6-5/8" Height
5.56 5.56 1 jar 5.56
Neon Transformer 24.53 24.53 1 transformer 24.53
Tetra Whisper Air Pump 13.97 13.97 1 pump 13.97
Total Cost:
$54.57
Table 1 shows that the approximate cost to construct a single ozone generator is $55, which is close to the goal of $50 per generator. Experimental Procedures: Measuring Ozone Three methods of measuring ozone concentrations have been used in lab experiments. These methods include ozone test strips, the indigo colorimetric method and an ozone detection meter. The first two methods were utilized for measuring the aqueous phase concentration of ozone. The ozone meter measures the concentration of ozone in the gaseous phase and outputs a dynamic volumetric ppm measurement. Ozone Test-Strip Trials Ozone Test Strips from SenSafe where used to estimate a concentration range in ppm (or mg/L O3). Two trials of measuring ozone concentration were performed with the ozone test strips. The first trial involved measuring ozone concentrations in water produced by the small-design ozone generator. The small-design ozone generator consisted of a 2-1/8 inch base diameter glass jar containing a layer of aluminum foil wrapped around the outside and the inside of the inner jar. The inner jar acted as an insulator and was then placed in a 2-7/8 inch base diameter glass jar. The neon transformer and air-pump were then connected to this jar. The effluent airflow tubing was placed in a 1 L column filled with water. The small-design ozone generator ran for 15 minutes. After the 15 minute time period, the ozone generator was turned off. Immediately following this, a test strip was used to take the first ozone concentration measurement. Subsequent measurements were taken using the test strips. For each measurement, 50 mL of water from the 1000 mL column was pipetted into a glass beaker. The test strip was then placed

12
in the 50 mL sample for 10 seconds, removed, and compared to the concentration key provided on the SenSafe test-strip bottle. The test was compared to samples of di-ionized water (DI) water. This key on the test strip bottle is shown in Figure 4.
The second trial used the same procedure except that it involved producing ozone with the large-scale ozone generator. The interior jar had a 2-7/8 inch base diameter and the exterior jar had a 3-3/4 inch base diameter. The procedure for measuring ozone in the water with the test strips was the same as in trial 1. The results from these two trials are shown in Figure 5. Both trials resulted in the same initial ozone concentration of 0.1 mg/L. In both trials, ozone decayed at a similar rate. Note that distilled water produced some color on the test strips, similar to the final concentration measured in the ozonated water, indicated the limit of detection with the test strips. It was expected that the larger ozone generator would produce a higher initial aqueous ozone concentration, however, the small and large generators produced equal initial ozone concentrations. While these measurements are rather imprecise due to human involvement in determining the color, it is clear that not much difference in the aqueous concentrations occurred between the two generators. This may indicate that smaller containers can be used without significantly decreasing the rate of ozone production.
Figure 4. Concentration key on ozone test strip bottle

Two conclusions can be drawn from the results of measuring ozone concentrations with test strips. First, the ozone generator produced a sufficient ozone dosage to the water. This can be seen as both trials resulted in initial concentrations the DI water control. The second conclusion is that another method is needed in order to obtain more precise ozone concentration measurements.
Indigo Colorimetric Method:
Several trials of the indigo colorimetric methodconcentrations produced by the prototype ozonethe indigo colorimetric method isset-up.
In each experiment, a spectrophotometer the absorbance of the blanks and samples atwith the ozone generated by the larger reactor, and after 5 minutes, a 27 mL sample was
Figure
Figure 6. Indigo Colorimetric Method Experim
13
Two conclusions can be drawn from the results of measuring ozone concentrations with test strips. First, the ozone generator produced a sufficient ozone dosage to be able to measure it
water. This can be seen as both trials resulted in initial concentrations measured The second conclusion is that another method is needed in order to obtain
precise ozone concentration measurements.
indigo colorimetric method were performed to determine aqueous ozone prototype ozone generator. The standard operating is in Appendix B. Figure 6 shows an image of the
spectrophotometer and 10 cm path-length cuvettes were the absorbance of the blanks and samples at 600 nm. In each experiment, 1 L water was sparged with the ozone generated by the larger reactor, and after 5 minutes, a 27 mL sample was
Figure 5. Plot of Ozone Concentration vs. Time
digo Colorimetric Method Experimental Set-up
Two conclusions can be drawn from the results of measuring ozone concentrations with test be able to measure it in
measured well above The second conclusion is that another method is needed in order to obtain
were performed to determine aqueous ozone The standard operating procedure for
image of the experimental
used, monitoring In each experiment, 1 L water was sparged
with the ozone generated by the larger reactor, and after 5 minutes, a 27 mL sample was

14
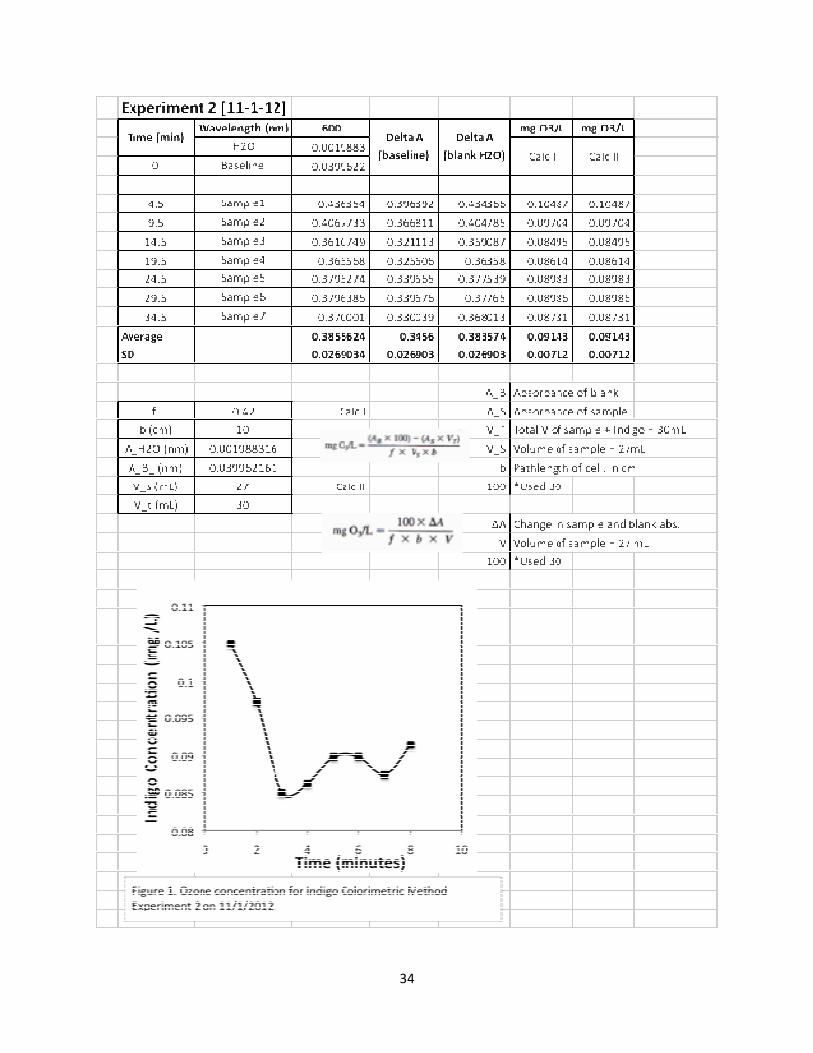
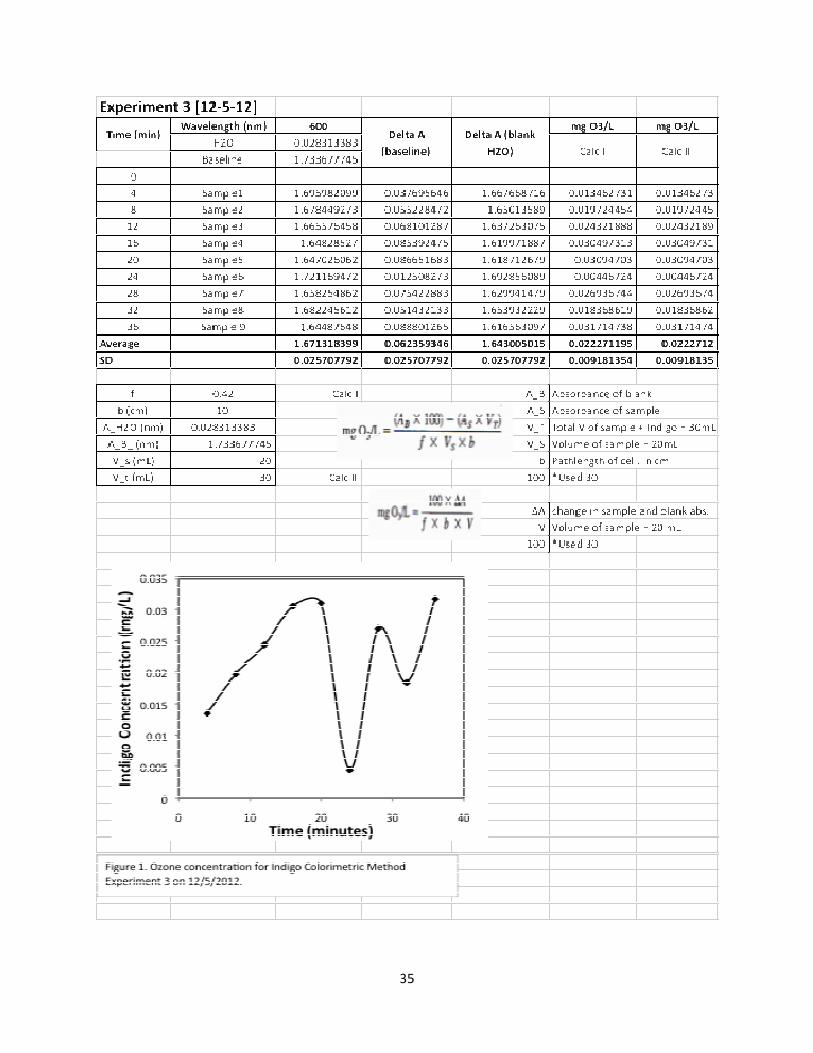
removed and immediately added to a test tube containing 3 mL of the indigo method reagents. Additional 27 mL samples were removed as a function of time, under continued sparging. Experiment Calculations. The concentration of ozone in each aqueous sample was calculated with the following equation,
mg O3
L=
30 × ∆A
f × b × V (3)
where, ∆� = difference in absorbance between the sample and blank (i.e., unreacted indigo solution) � = path length of cell (10 cm) � = volume of sample (27 mL) � = 0.42 The factor, f, is a sensitivity factor for the change of absorbance at 600 nm per mole of added ozone per liter. The UV absorbance of ozone in pure water may serve as a secondary standard since ozone has an absorption coefficient in water of ε = 2950 M-1cm-1 at 258 nm.
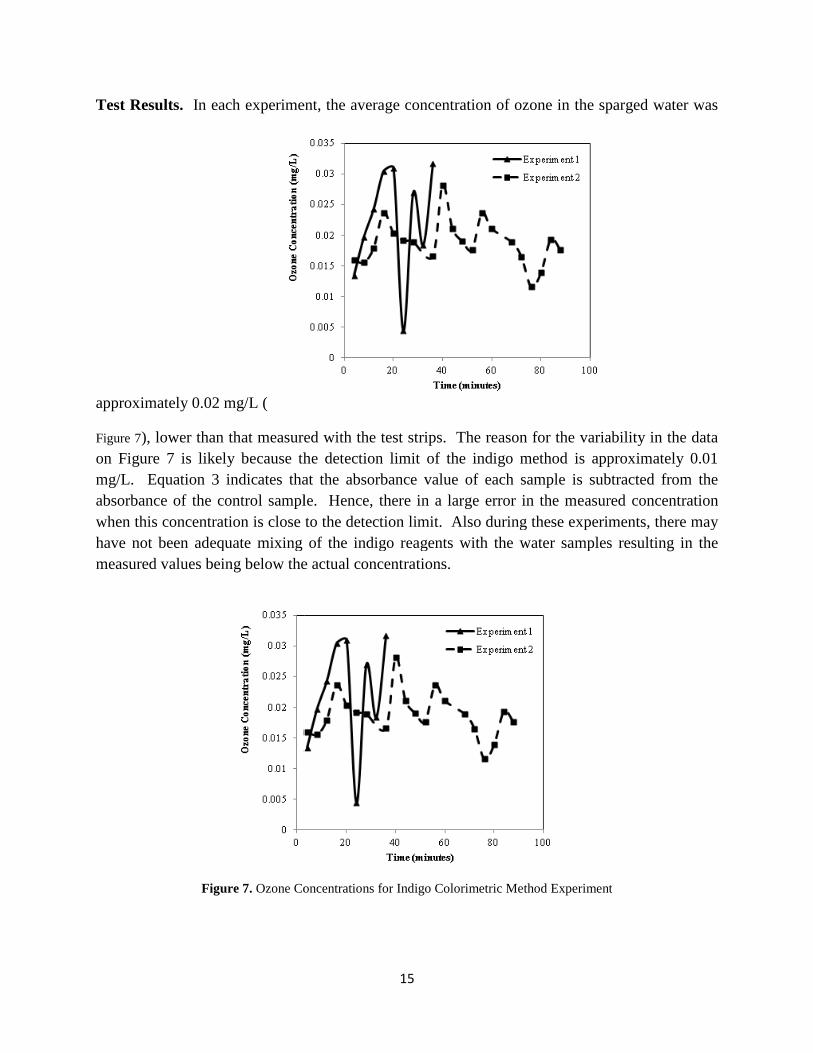
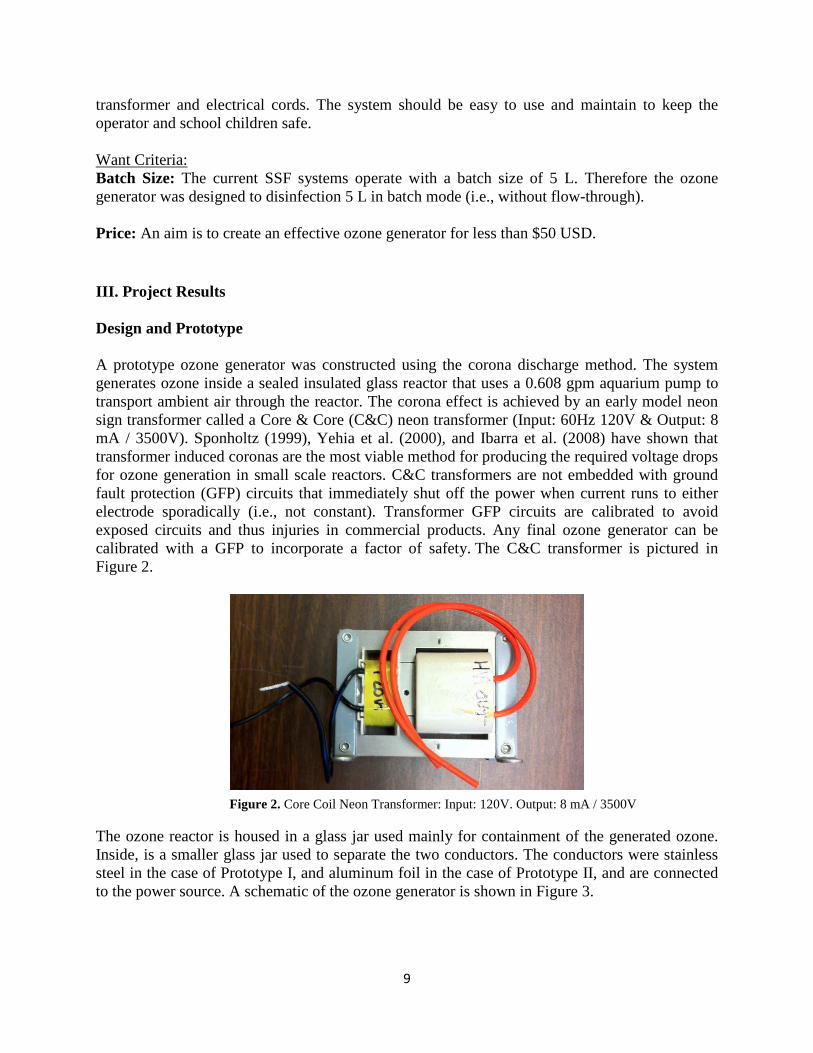
Test Results. In each experiment
approximately 0.02 mg/L (
Figure 7), lower than that measured with the test stripson Figure 7 is likely because the detection limit of the indigo method is approximately 0.01 mg/L. Equation 3 indicates that the absorbance value of each sample is subtracted from the absorbance of the control samplwhen this concentration is close to the detection limit. Also during these experiments, there may have not been adequate mixing of the indigo reagents with the water samplemeasured values being below the
Figure 7. Ozone Concentrations for Indigo Colorimetric Method Experiment
15
xperiment, the average concentration of ozone in the sparged water was
), lower than that measured with the test strips. The reason for the variability in the data on Figure 7 is likely because the detection limit of the indigo method is approximately 0.01 mg/L. Equation 3 indicates that the absorbance value of each sample is subtracted from the absorbance of the control sample. Hence, there in a large error in the measured concentration when this concentration is close to the detection limit. Also during these experiments, there may have not been adequate mixing of the indigo reagents with the water samples
the actual concentrations.
Ozone Concentrations for Indigo Colorimetric Method Experiment
the average concentration of ozone in the sparged water was
reason for the variability in the data on Figure 7 is likely because the detection limit of the indigo method is approximately 0.01 mg/L. Equation 3 indicates that the absorbance value of each sample is subtracted from the
e. Hence, there in a large error in the measured concentration when this concentration is close to the detection limit. Also during these experiments, there may
s resulting in the
Ozone Concentrations for Indigo Colorimetric Method Experiment
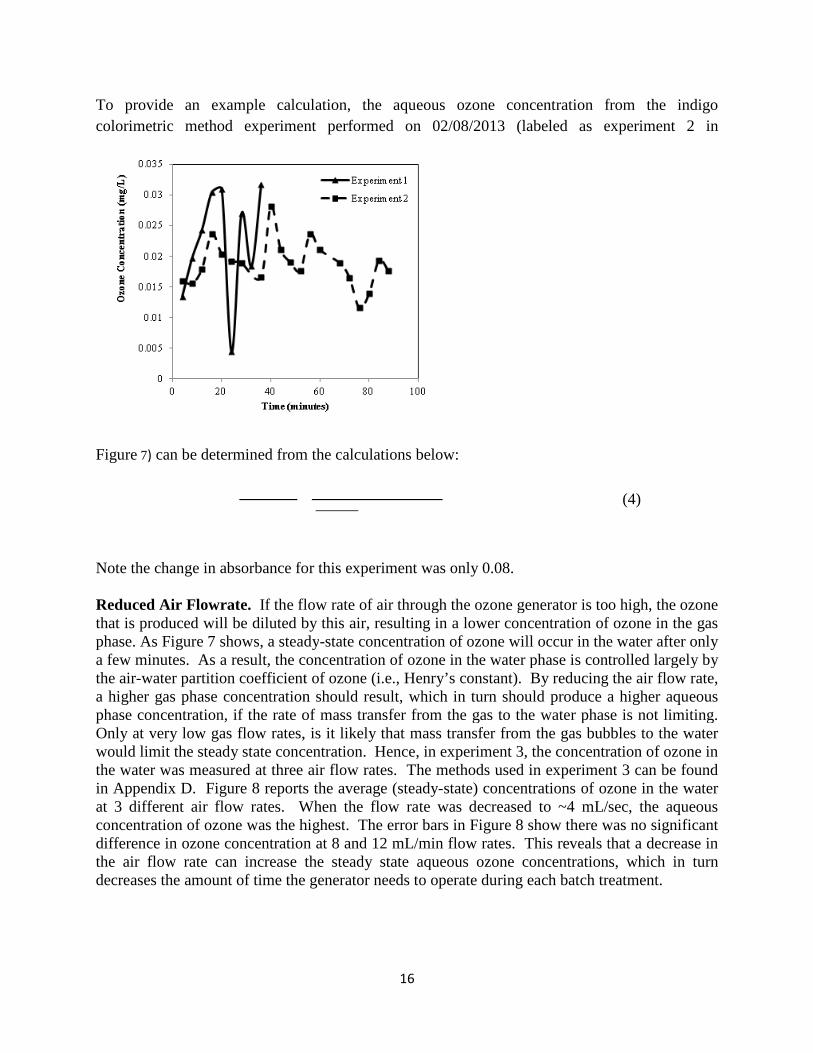
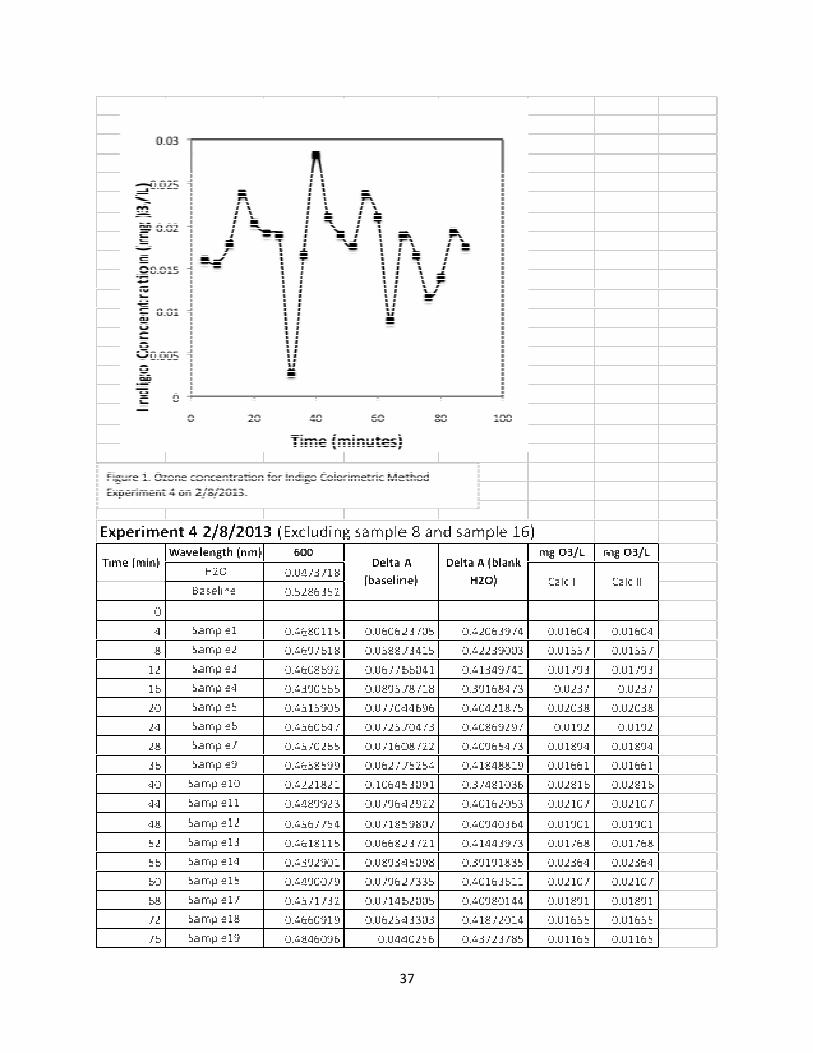
To provide an example calculation, tcolorimetric method experiment
Figure 7) can be determined from the calculations below:
Note the change in absorbance for this experiment was Reduced Air Flowrate. If the flow rate of air through the ozone generator is too high, the ozone that is produced will be diluted by this air, resulting in a lower concentration of ozone in the gas phase. As Figure 7 shows, a steadya few minutes. As a result, the concentration of ozone in the water phasthe air-water partition coefficient of ozone (i.e., Henry’s constant). By reducing the air flow rate, a higher gas phase concentration should result, which in turn should produce a higher aqueous phase concentration, if the rate of mass transfer from the gas to the water phase is not limitingOnly at very low gas flow rates, iwould limit the steady state concentrationthe water was measured at three in Appendix D. Figure 8 reports the average (steadyat 3 different air flow rates. Whenconcentration of ozone was the highestdifference in ozone concentration at the air flow rate can increase the decreases the amount of time the generator needs to
16
To provide an example calculation, the aqueous ozone concentration from the experiment performed on 02/08/2013 (labeled as experiment 2 in
determined from the calculations below:
he change in absorbance for this experiment was only 0.08.
If the flow rate of air through the ozone generator is too high, the ozone will be diluted by this air, resulting in a lower concentration of ozone in the gas
phase. As Figure 7 shows, a steady-state concentration of ozone will occur in the water after only a few minutes. As a result, the concentration of ozone in the water phase is controlled largely by
water partition coefficient of ozone (i.e., Henry’s constant). By reducing the air flow rate, a higher gas phase concentration should result, which in turn should produce a higher aqueous
of mass transfer from the gas to the water phase is not limitingvery low gas flow rates, is it likely that mass transfer from the gas bubbles to the water
the steady state concentration. Hence, in experiment 3, the concentration of the water was measured at three air flow rates. The methods used in experiment
reports the average (steady-state) concentrations of ozone in the water When the flow rate was decreased to ~4 mL/sec
he highest. The error bars in Figure 8 show there was difference in ozone concentration at 8 and 12 mL/min flow rates. This reveals that a decrease in
increase the steady state aqueous ozone concentrationsdecreases the amount of time the generator needs to operate during each batch treatment
he aqueous ozone concentration from the indigo labeled as experiment 2 in
(4)
If the flow rate of air through the ozone generator is too high, the ozone will be diluted by this air, resulting in a lower concentration of ozone in the gas
state concentration of ozone will occur in the water after only e is controlled largely by
water partition coefficient of ozone (i.e., Henry’s constant). By reducing the air flow rate, a higher gas phase concentration should result, which in turn should produce a higher aqueous
of mass transfer from the gas to the water phase is not limiting. likely that mass transfer from the gas bubbles to the water
Hence, in experiment 3, the concentration of ozone in experiment 3 can be found
state) concentrations of ozone in the water to ~4 mL/sec, the aqueous
there was no significant mL/min flow rates. This reveals that a decrease in
aqueous ozone concentrations, which in turn operate during each batch treatment.

Figure 8. Ozone Concentration Measured at Three Different Flow Rates
Measuring the Gas-Phase Ozone Concentration
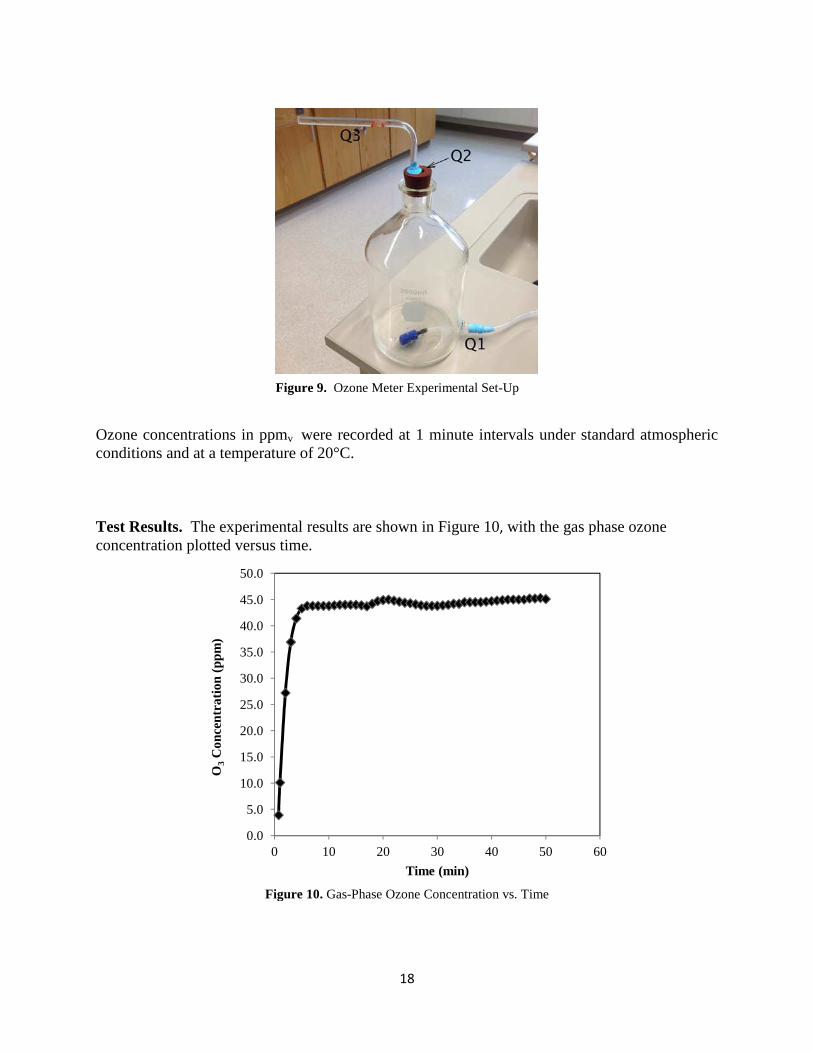
An InDevR 2B Technologies Ozone Meter was used to measure the gasconcentration produced by the ozone in a flow-through system over a period of 50 minutes using the InDevR 2B Ozone detector. The flow-through system (i.e., container) was a 2 Linch opening at the top. The bottom PTFE thread tape to seal around the tubingrubber stopper was used: One outlet the other outlet was open to the atmosphere The flow rate (Equation 6) of the ozone reactorInDevR meter requires a minimum flow rate (The team therefore used the third outletadditional gas from the generator,
The arrangement of the ozone meter
17
Ozone Concentration Measured at Three Different Flow Rates
Phase Ozone Concentration
2B Technologies Ozone Meter was used to measure the gasconcentration produced by the ozone generator. Ozone gas-phase concentrations were measured
system over a period of 50 minutes using the InDevR 2B Ozone detector. The container) was a 2 L glass flask with an inlet at the bottom and a one
ing at the top. The bottom inlet (Q1) was used for ozone input from thePTFE thread tape to seal around the tubing (Figure 9). On the top of the flask, a two
outlet was used to connect the InDevR detector’s tubingwas open to the atmosphere (Q3).
) of the ozone reactor with no water head is approximately 2 L/sec. The requires a minimum flow rate (eqs 6 and 7) of 1 L/sec for accurate
The team therefore used the third outlet (Q3) that was open to the atmosphere to additional gas from the generator,
The arrangement of the ozone meter experiment is shown in Figure 9.
2B Technologies Ozone Meter was used to measure the gas-phase ozone phase concentrations were measured
system over a period of 50 minutes using the InDevR 2B Ozone detector. The let at the bottom and a one-
rom the reactor using On the top of the flask, a two-holed
detector’s tubing (Q2) and
approximately 2 L/sec. The ) of 1 L/sec for accurate measurements.
to the atmosphere to vent the
(5)
(6)
Ozone concentrations in ppmv were conditions and at a temperature of 20°C. Test Results. The experimental concentration plotted versus time.
Figure
0.0
5.0
10.0
15.0
20.0
25.0
30.0
35.0
40.0
45.0
50.0
0
O3
Con
cent
rati
on (
ppm
)
Figure
18
were recorded at 1 minute intervals under standard atmospheric of 20°C.
experimental results are shown in Figure 10, with the gas phaseversus time.
Figure 10. Gas-Phase Ozone Concentration vs. Time
10 20 30 40 50 60
Time (min)
Figure 9. Ozone Meter Experimental Set-Up
under standard atmospheric
hase ozone

19
From the average measured gas phase concentration of 45 ppmv O3 (Figure 10), the aqueous concentration at equilibrium can be calculated using Henry’s Law constant for ozone. After rearranging and showing all unit conversions, this produces:
KH � 0.012 molL � atm � �O3 aq
PO3 (7)
�O3 aq � #0.012 molL � atm$ # 45
106 atm$ #48 gmol$ #1000 mg
g $ �0.026 mgL O3 (8)
The above calculations yield a calculated steady-state aqueous ozone concentration of 0.026 mg/L. This calculation confirms the results of the indigo colorimetric method experiment performed on 02/08/2013 (= 0.021 mg/L). The necessary contact time can be determined for this aqueous ozone concentration of 0.021mg/L. In order to achieve a Ct value of 0.2 mg × min × L-1, the water disinfection system must be operated for approximately 9.5 minutes. To account for a 15 minute period to achieve a steady ozone concentration, the water disinfection system should be operated for approximately 25 minutes. The decreased air flow rate as observed in Figure 8 results in an increase aqueous ozone concentration. This increased ozone concentration would reduce the required contact time. Membrane Filtration Technique The membrane filtration technique has been adapted from EPA Method 9132 in order to test the ability of the ozone generator to disinfect microorganisms. A standard method for measuring Giardia does not exists, and local water sources do not necessarily contain high amounts of Giardia; therefore, EPA Method 9132 was utilized to test the reactors ability to inactivate coliform bacteria. The membrane filtration technique is used to monitor drinking water and natural waters for the presence of “coliform” bacteria. However, the membrane filtration (MF) technique is not reliable for high turbidity samples and for water containing large numbers of non-coliform bacteria. When viewing MF samples, the typical coliform colony has a pink to a dark-red color with a metallic surface sheen. Colonies that lack sheen may be pink, red, white, or colorless, and are considered to be non-coliform colonies. The coliform density is usually reported as (total) coliform per 100 mL. The coliform count is computed using membrane filters with 20 to 80 coliform colonies, and no more than 200 colonies, by Equation 9,
Total coliform colonies
100 mL= coliform colonies counted
mL sample filtered x 100 (9)
If confluent growth occurs, that is, growth covering either the entire filtration area of the membrane or a portion of it, the colonies are not discrete and results are reported as "confluent growth with (or without) coliforms." If the total number of bacterial colonies, coliforms plus

20
non-coliforms, exceeds 200 per membrane, or if the colonies are not discrete enough for accurate counting, results are reported as "too numerous to count" (TNTC). The standard operating procedure is in Appendix B.
Membrane Filtration Experiment I. The first trial of the MF technique tested nine samples: three controls that used sterilized DI water; three samples that used SSF water; and three samples that used SSF water treated with ozone. The first membrane filtration experiment was designed to measure the residual coliform bacteria before and after ozonating 5 L slow sand filtered water. The original water source was the Wabash River. Five liters of each (SSF water and ozonated SSF water) were tested. The ozonated SSF water was collected from the SSF and immediately ozonated for 25 minutes. The experiment was conducted using three control variables to test for contamination during the experiment. Three samples were taken for each water sample type. The results were inconclusive. After the required incubation period, two out of the three ozonated water samples showed no coliforms and neither of the un-ozonated water samples showed coliform growth. Interestingly, all of the ozonated samples showed non-coliform microbial growth. The volume of solution used in preparing the broth used in the test may have been miscalculated. The samples were incubated for an additional 24 hours to note any further development. The images in Figure 11 show the membrane filters of the SSF water (right) and ozonated SSF water (left) after twice the required incubation period. See Appendix E for an image of the control membranes.
The ozonated water shows three microbial colonies, however none were coliform bacteria. The un-ozonated water sample shows more bacterial growth. There was one possible coliform
Figure 11. Ozonated slow sand filtered Wabash River water (left) compared to Un-ozonated SSF Wabash River water (right).

21
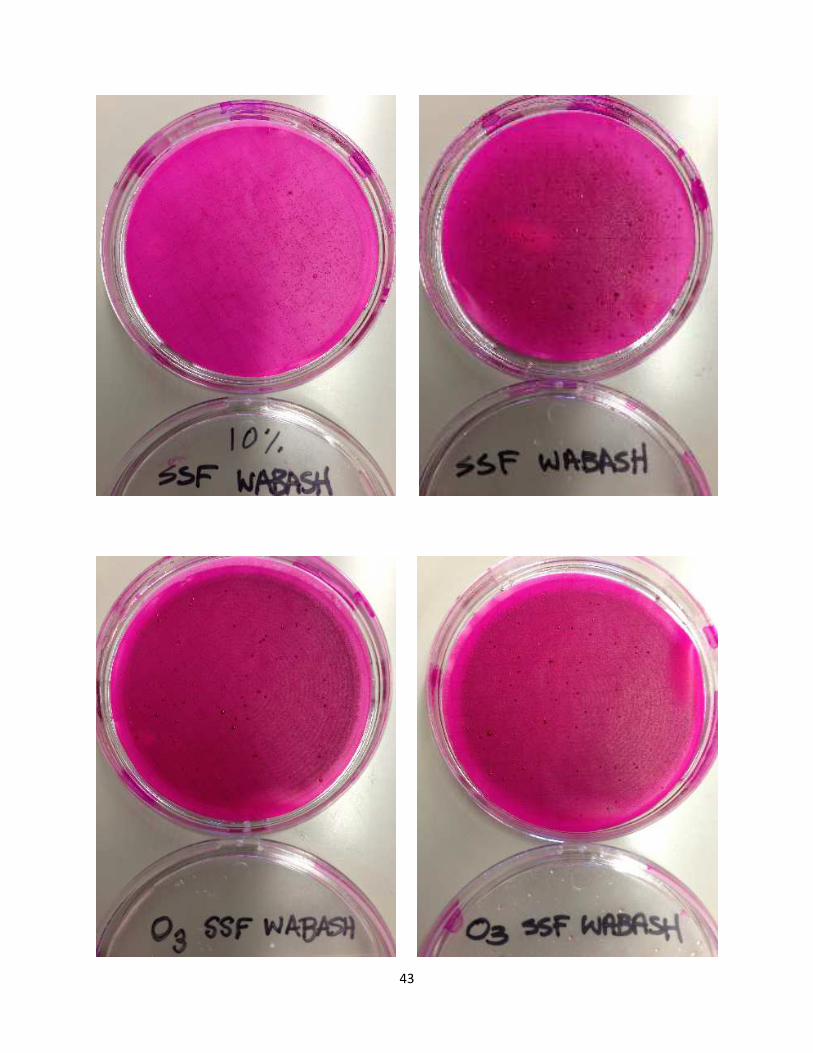
colony, but after an additional 24 hours of incubation, no additional growth developed and no definitive conclusions could be made. Membrane Filtration Experiment II. In repeating the membrane filtration experiment, a larger variety of sample types were tested. The first membrane filtration experiment tested three sample types: (1) controls of sterilized water; (2) SSF water; and (3) ozonated SSF water. The second membrane filtration experiment tested six sample types:
(1) Sterilized DI water (control) (2) Ozonated DI water (3) Diluted untreated Wabash River water:
1 mL with 99 mL DI water (1% dilution) (4) SSF Wabash River water (5) Diluted SSF Wabash River water:
10 mL with 90 mL DI water (10% dilution) (6) Ozonated SSF water
The same MF standard operating procedure was used. This procedure is in Appendix C. Two diluted samples were used because the membrane filtration technique has problems with high turbidity samples and water containing large numbers of non-coliform bacteria. By diluting the samples, the turbidity of the samples was reduced and the results of the membrane filtration experiment should be more accurate. For each of the sample types, the resulting number of coliform per 100 mL sample is shown in Table 2. Adequate materials were not available to run two filtrations at each sample time, however the sample types that were filtered twice are reported in Table 2 separated by a comma. Table 2. Membrane Filtration Experiment II Results
Sample Type # Coliforms/100 mL
Sterilized DI Water 0, 0 Ozonated DI Water 0, 0 Diluted Wabash River Water 0, 1 SSF Water 10 Diluted SSF Water 1 Ozonated SSF Water 61, 48 Both control samples (i.e., sterilized DI water) showed no contamination, as was the case in the first membrane filtration experiment. The diluted Wabash River water, SSF water, and the diluted SSF water all resulted in contamination. It was expected that these sample types would result in some contamination as we know that microorganisms persist in the water even after slow sand filtration. A surprising result from this experiment is that the coliform count for the ozonated SSF Wabash River water was significantly higher than the coliform counts for the un-ozonated Wabash River water. Procedural errors and contamination could possibly be the cause of this result. To determine if this was the case, the membrane filtration experiment should be

22
repeated and an additional sample should be analyzed as a positive reference with a high dose of chlorine to help determine where contamination is occurring. Another possible explanation for this result is that the ozonated SSF water was not ozonated for a sufficient amount of time. Instead, only material that holds the bacterial clumps together may have been oxidized, allowing more colonies to grow. Thus, these membrane filtration experiments have not confirmed the theoretically determined contact time of 0.2 mg/L × min. The contact time should be experimentally determined by repeated the membrane filtration experiment and varying the time of ozonation. Because the indigo method showed that a reduced air flow results in a higher ozone concentration, repeating the membrane filtration experiment with at a reduced air flow could be performed. Additional photographs of the Petri dishes are shown in Appendix F. IV. Scale-up to 5 L Batch Size The ozone system is designed to disinfect water after slow sand filtration. The slow sand filters already in use in Colombia were designed to output five liters in each batch. Therefore, the scalability of the system was determined by measuring the steady-state concentration of ozone in five liters of water, using the same type of pail used to collect the water in each school in Colombia. Again, the Indigo method was used to measure the aqueous phase O3 concentration after the system reached steady state.
Ozone was sparged into 5 L DI water at 12.45 mL/sec for 17 minutes. Three 27 mL water samples were removed at 17, 20, and 23 minutes and each sample was immediately mixed with 3 mL of Indigo Reagent I. The samples were measured using a UV/Vis spectrometer at 600 nm. As can be seen in Error! Reference source not found., the calculate aqueous ozone concentration at steady state was 0.02 mg/L, consistant with the previous measurements made on 1 L water samples. Note, that in this experiment, the samples were mixed immediately after adding the sample to the indigo reagent by inverting the tubes, resulting in very reproducible results.

Figure 12. Indigo Colorimetric Method of Batch Scale Comparing this aqueous ozone concentration with the concentration of 0.0205 mg/L from indigo colorimetric method experiments with 1L, it can be determined results in a slightly lower aqueous ozone concentration. This may or may not have significant effects on contact time required for disinfection. Additional testing is needed to conclusively determine the effect of a larger bacontact time. V. Electrical Enclosure As the designed ozone generator prototype has electrical components such as a neon transformer, an electrical enclosure is needed. The electrical enclosure ipeople who operate it or have the potential to come into contact with important as these devices will be utilized in schools and the children need to be protected from potential harm. An electrical enclosurgenerator from weather or physical electrical enclosure is an appropriate electrical enclosur Many companies carry electrical enclosures that are containers are typically expensive or are not lFor instance, the image on the left in McMaster-Carr that has dimensions of 15electrical enclosure is not large enough for the than the cost of the system components
23
Indigo Colorimetric Method of Batch Scale-up
Comparing this aqueous ozone concentration with the concentration of 0.0205 mg/L from indigo colorimetric method experiments with 1L, it can be determined that a larger batch size of 5L results in a slightly lower aqueous ozone concentration. This may or may not have significant effects on contact time required for disinfection. Additional testing is needed to conclusively determine the effect of a larger batch size on aqueous ozone concentration and disinfection
As the designed ozone generator prototype has electrical components such as a neon transformer, an electrical enclosure is needed. The electrical enclosure is necessary to protect the
or have the potential to come into contact with it. This is especially important as these devices will be utilized in schools and the children need to be protected from potential harm. An electrical enclosure system is also needed to prevent damage to the ozone generator from weather or physical contact. It has been determined that a NEMA Type 3
appropriate electrical enclosure.
Many companies carry electrical enclosures that are NEMA ranked and certified. These containers are typically expensive or are not large enough to accommodate the
the image on the left in Figure 13 shows an electrical enclosure available from Carr that has dimensions of 15×12×6 inch3 and costs $62.20 (McMaster
electrical enclosure is not large enough for the existing ozone generator and its cost is higher components. A larger certified electrical enclosure box costs
Comparing this aqueous ozone concentration with the concentration of 0.0205 mg/L from indigo that a larger batch size of 5L
results in a slightly lower aqueous ozone concentration. This may or may not have significant effects on contact time required for disinfection. Additional testing is needed to conclusively
tch size on aqueous ozone concentration and disinfection
As the designed ozone generator prototype has electrical components such as a neon s necessary to protect the
. This is especially important as these devices will be utilized in schools and the children need to be protected from
e system is also needed to prevent damage to the ozone . It has been determined that a NEMA Type 3
NEMA ranked and certified. These ozone generator.
shows an electrical enclosure available from (McMaster-Carr). This
ozone generator and its cost is higher . A larger certified electrical enclosure box costs
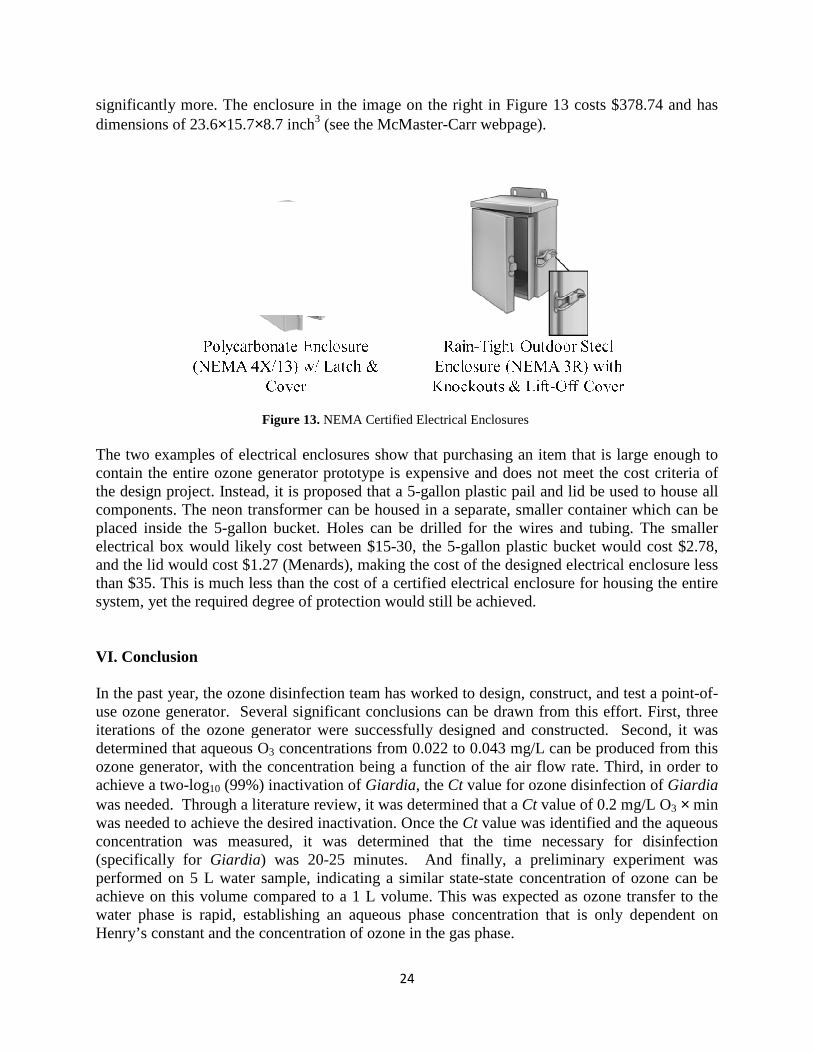
significantly more. The enclosure indimensions of 23.6×15.7×8.7 inch The two examples of electrical enclosures show that purchasing an item that is large enough to contain the entire ozone generator prototype is expensive and does not meet the the design project. Instead, it is proposecomponents. The neon transformer placed inside the 5-gallon bucket. Holes electrical box would likely cost between $15and the lid would cost $1.27 (Menards), than $35. This is much less than the system, yet the required degree of protection VI. Conclusion In the past year, the ozone disinfection team has worked to use ozone generator. Several significant conclusionsiterations of the ozone generatordetermined that aqueous O3 concentrationozone generator, with the concentration being a function of the air flow rateachieve a two-log10 (99%) inactivation of was needed. Through a literature reviewwas needed to achieve the desired inactivation. Once the concentration was measured, it was determined that (specifically for Giardia) was performed on 5 L water sample, indicating a similar stateachieve on this volume compared to a 1 L volumewater phase is rapid, establishing an aqueous phase concentration that is only dependent on Henry’s constant and the concentration of ozone in the gas phase.
Figure 13
24
significantly more. The enclosure in the image on the right in Figure 13 costs $378.74 and has inch3 (see the McMaster-Carr webpage).
examples of electrical enclosures show that purchasing an item that is large enough to contain the entire ozone generator prototype is expensive and does not meet the
proposed that a 5-gallon plastic pail and lid be used to house all . The neon transformer can be housed in a separate, smaller container which
gallon bucket. Holes can be drilled for the wires and tubing. The smaller likely cost between $15-30, the 5-gallon plastic bucket w
(Menards), making the cost of the designed electrical enclosure less than the cost of a certified electrical enclosure for h
degree of protection would still be achieved.
In the past year, the ozone disinfection team has worked to design, construct, and test a pointsignificant conclusions can be drawn from this effort
iterations of the ozone generator were successfully designed and constructed. concentrations from 0.022 to 0.043 mg/L can be produced
, with the concentration being a function of the air flow rate. Third, i(99%) inactivation of Giardia, the Ct value for ozone disinfection of
literature review, it was determined that a Ct value of 0.2 mgwas needed to achieve the desired inactivation. Once the Ct value was identified
it was determined that the time necessary for disinfection 20-25 minutes. And finally, a preliminary
water sample, indicating a similar state-state concentration of ozone can be achieve on this volume compared to a 1 L volume. This was expected as ozone transfer to the
is rapid, establishing an aqueous phase concentration that is only dependent on Henry’s constant and the concentration of ozone in the gas phase.
13. NEMA Certified Electrical Enclosures
costs $378.74 and has
examples of electrical enclosures show that purchasing an item that is large enough to contain the entire ozone generator prototype is expensive and does not meet the cost criteria of
be used to house all be housed in a separate, smaller container which can be
be drilled for the wires and tubing. The smaller n plastic bucket would cost $2.78,
making the cost of the designed electrical enclosure less for housing the entire
design, construct, and test a point-of-can be drawn from this effort. First, three
successfully designed and constructed. Second, it was produced from this Third, in order to
value for ozone disinfection of Giardia value of 0.2 mg/L O3 × min
was identified and the aqueous time necessary for disinfection
preliminary experiment was state concentration of ozone can be
This was expected as ozone transfer to the is rapid, establishing an aqueous phase concentration that is only dependent on

25
VII. Suggested Future Work As this is a continuing project, the ozone disinfection team has several suggestions for work to be completed in the future. Literature Review. While the current team has completed a considerable literature review, there are some additional topics that need to be researched further. One such topic is how ozone may affect or react with the materials being used in the generator. A more complete understanding of oxidation chemistry will allow the team to recommend possible alternative materials that are more resistant to oxidation. Additional research is needed on how the surface area of an electrode affects the rate of ozone generation by a corona discharge. A better understanding of how electrode surface area and ozone generation are related would provide insight in redesigning the generator to maximize efficiency and minimize space and costs. Additional Membrane Filtration Experiments. As previously mentioned, additional membrane filtration experiments are needed to determine if there is a procedural error or source of contamination, and to experimentally determine the appropriate contact time needed for disinfection. Whether some coliform bacteria are more resistant to ozone than Giardia needs to be documented. Electrical Enclosure. A design concept has been developed for the electrical enclosure. Next, materials for the enclosure need to be identified and purchased, and the electrical enclosure needs to be constructed. Once constructed, measurable criteria for the safety performance of the electrical enclosure should be established and the enclosure should be tested based on these criteria. Scale-up to 5 L Batch Size. An indigo colorimetric method experiment has been performed using a 5 L batch size. Additional ozone measurements and membrane filtration tests should be performed to definitively measure concentration and inactivation for this larger batch-size. VIII. Outreach The ozone disinfection team has participated in numerous outreach events over the last two semesters. These events include those in which either the ozone disinfection project was presented or the team represented the entire Colombia drinking water project. The team twice presented at the Ecological and Environmental Engineering Senior Design Review. Additionally, the project was presented at the Global Engineering Design Team Expo, the Purdue Sustainability Summit, and the College of Engineering Research and Poster Symposium. Finally, the team represented the Colombia project at the STEAM! Innovation Fair at Conner Prairie. IX. Acknowledgements

26
We wish to acknowledge and thank the Purdue Global Engineering Program and Kimberly-Clark Corporation for their continued support. The Ozone Disinfection Team would also like to thank Dr. Chad Jafvert, Dr. John Howarter, Leila Nyberg, and Dan McMahon for their advising and assistance on this project.

27
X. References
American Public Health Association (APHA). Standard Methods for the Examination of Water
and Wastewater. American Public Health Association, American Water Works Association, Water Environment Federation publication. APHA, Washington D.C., 1992, 21, 4-144 – 4-146
Bader, H.; Hoigené, J.; Determination of Ozone in Water by the Indigo Method. Water
Research., 1981, 15, 449-456 Bes, R. S., R. J. Routie, and C. Coste. "Ozone Production - Economical Operation of a Cold-
Plasma Reactor." Ozone-Science & Engineering 7.4 (1985): 299-312. Print. Center for Disease Control and Prevention, Parasites – Giardia. 2011,
<http://www.cdc.gov/parasites/Giardia/>. Center for Disease Control and Prevention, Epidemiology & Risk Factors, 2012.
<http://www.cdc.gov/parasites/Giardia/epi.html>. Colombia Ministry of the Environment. "Resolution Number 2115." Colombia Water
Regulations. N.p.: n.p., 2007. Print. Consultants in Environmental Sciences, Ltd. (1988) Review of Operational & Experimental
Techniques for the Removal of Bacteria, Viruses & Pathogens from Sewage Effluents ; PECD 7/7/260; Department of the Environment: London, September.
Hsu, B. M. and Yeh, H. H. Removal of Giardia and Cryptosporidium in drinking water
treatment: a pilot-scale study. Water Research. 2003, 37, 1111-1117. Ibarra, D. F. E., et al. "Experimental Results of a Cost-Effective Ozone Generator for Water
Treatment in Colombia." Ozone-Science & Engineering 30.3 (2008): 202-09. Print. Jung, Jae-Seung, and Jae-Duk Moon. "Corona discharge and ozone generation characteristics of
a wire-plate discharge system with a glass-fiber layer." Journal of Electrostatics 66 (2008): 335-41. Print.
McMaster-Carr, Electrical Enclosures - NEMA 3. Web. 14 Apr. 2013.
http://www.mcmaster.com/#electrical-enclosures/=mhaau3 Menards, 5 Gallon Menard Pail. Web. 14 Apr. 2013.
<http://www.menards.com/main/housewares/cleaning-supplies/buckets/5-gallon-menard-pail/p-1319254-c-7112.htm>
National Electrical Manufacturers Association. "NEMA Standards Publication 250 Section 2.2."
Rosslyn, VA: National Electrical Manufacturers Association, 2003. 5-8. Web. 18 Mar.
28
2013. https://dlweb.dropbox.com/get/2013%20Spring%20Purdue/Senior%20Design/NEMA%20Standards/Nema_250-225408_tech_notes.pdf?w=AAAz-HwZag95eoNWCFPUI6q9dfUVNMJp_Xus8L4CrmbuRw
Owens, J. H., et al. "Pilot-Scale Ozone Inactivation of Cryptosporidium and Other
Microorganisms in Natural Water." Ozone-Science & Engineering 22.5 (2000): 501-17. Print.
Paraskeva, P., and N. J. D. Graham. "Ozonation of Municipal Wastewater Effluents." Water
Environment Research 74.6 (2002): 569-81. Print. Shin, Won-Tae, et al. "A pulseless corona-discharge process for the oxidation of organic
compounds in water." Ind. Eng. Chem. Res. 39 (2000): 4408-14. Print. Singer, Philip C; Gurol, D. Mirat. "Kinetics of Ozone Decomposition: A Dynamic Approach."
Environmental Science & Technology 16.7 (1982): 377-83. Print. Sponholtz, Debra J., et al. "A Simple and Efficient Ozone Generator." Journal of Chemical
Education 76.12 (1999): 1712-13. Print. Tyrrell, S. A.; Rippey, S. R.; Watkins, W. D. (1995) Inactivation of Bacterial and Viral
Indicators in Secondary Sewage Effluents Using Chlorine and Ozone. Water Res., 29, 2483–2490.
U.S. EPA Office of Water. Giardia: Drinking Water Health Advisory. Washington D.C.: U.S.
EPA, 1999. Web. 26 Jan. 2013. <Colombia Ministry of the Environment. "Resolution Number 2115." Colombia Water Regulations. N.p.: n.p., 2007. Print. >.
U.S. EPA. “Ozone Guidance Manual Alternative Disinfectants”. Environmental Protection
Agency. 1999, 3-1 – 3-50. Yehia, A., A. Mizuno, and K. Takashima. "On the characteristics of the corona discharge in a
wire-duct reactor." J. Phys. D: Appl. Phys. 33 (2000): 2807-12. Prin
29
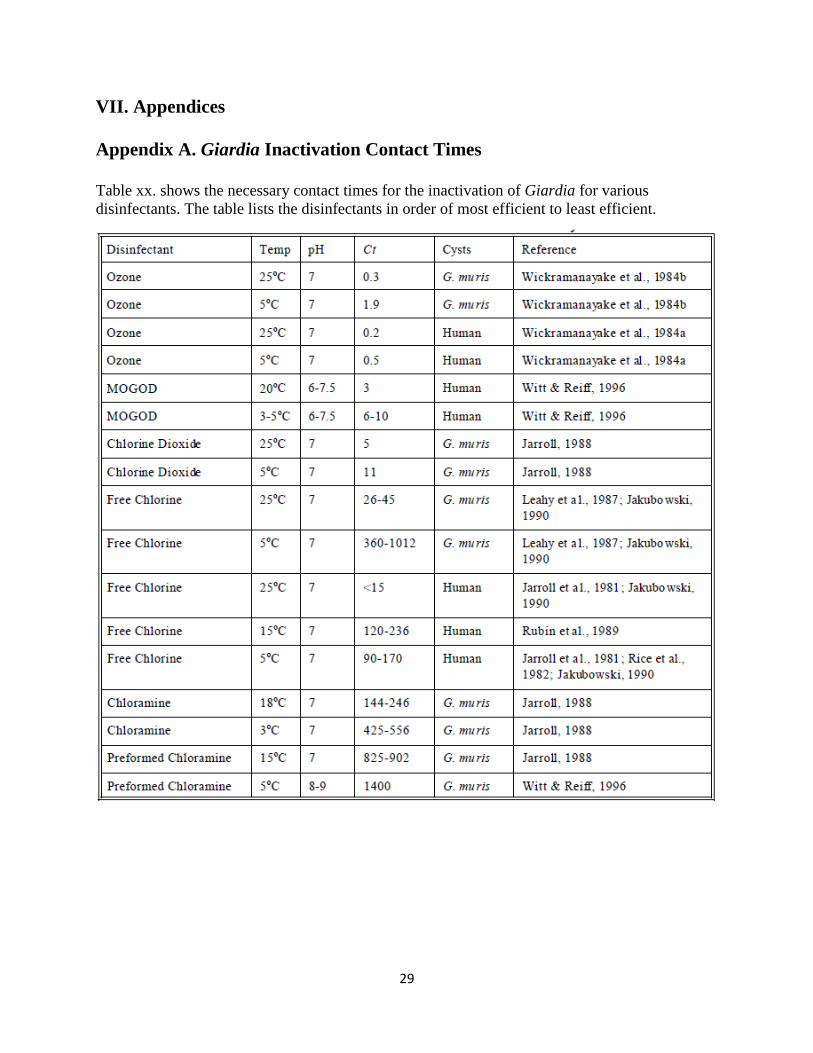
VII. Appendices Appendix A. Giardia Inactivation Contact Times Table xx. shows the necessary contact times for the inactivation of Giardia for various disinfectants. The table lists the disinfectants in order of most efficient to least efficient.

30
Appendix B. Standard Operating Procedure for Indigo Colorimetric Method The ozone disinfection team developed a standard operating procedure for the indigo colorimetric method which involved modifying the amount of chemicals used proportionally to achieve the desired sample volume of 30mL. The developed procedure is as follows: Reagents: The ozone test strip experiments resulted in aqueous ozone concentrations within the range of 0.01 to 0.1 ppm. Therefore the indigo stock solution and indigo reagent I are needed. There is no need to make indigo reagent II which is used in the presence of ozone concentrations ranging between 0.05 and 0.5 ppm. Indigo Stock Solution: In a 100-mL volumetric flask, add 5 mL distilled water and 0.1 mL concentrated phosphoric acid. Then stir and add 77 mg potassium indigo trisulfonate. Fill the 100-mL volumetric flask to the mark with distilled water. Transfer to storage container and store in a dark location for up to four months.
Indigo Reagent I: In a 200-mL volumetric flask, add 4 mL indigo stock solution, 2.3 g of sodium dihydrogen phosphate monohydrate (NaH2PO4*H2O), and 1.4 mL concentrated phosphoric acid. Dilute to the mark with distilled water. Sodium dihydrogen phosphate monohydrate can be substituted with 2 g of sodium dihydrogen phosphate (NaH2PO4). Procedure 1: A schematic of the indigo colorimetric method is pictured above in Figure 7. For the first four indigo colorimetric experiments, one control is made with distilled water not exposed to ozone. Use a 30-mL test tube for each sample. Add 3mL of indigo reagent I to each test tube. Remove 27mL of water every four minutes once the ozone generator begins to pump ozonated air into a 32 oz glass bottle containing distilled water. Continue until the desired number of samples has been collected.
Spectrophotometric, gravimetric procedure: Calibrate the spectrophotometer using distilled water in a 10-cm cuvette. Add the sample from each test tube to 10-cm cuvette. Measure absorbance of each sample at 600 nm in chronological order. Procedure 2: The fifth indigo experiment involves changes with the flow rate of the prototype air pump by tying off the air pump. Take twelve samples during this procedure. Three samples are of the standard control with 3mL of the indigo reagent and 27mL of distilled water excluding ozone. The fastest flow rate is utilized first and measured with the bubble meter for a flow rate. Run the ozone prototype generator for fifteen minutes with three samples of the ozonated water collected at run time of 15 minutes, 17.5 minutes and 20 minutes and mix with the indigo reagent. Change the flow rate and measure using the bubble meter to a medium flow rate. Run the prototype for 15 minutes and take samples of the ozonated water at a run time of 15 minutes, 17.5 minutes and 20 minutes and mix with the indigo reagent. Finally, change the flow rate and measure using the bubble meter to a slow flow rate. Run the prototype for 15 minutes and take sample of the ozonated water are taken at a run time of 15 minutes, 17.5 minutes and 20 minutes and mixed with the indigo reagent.

31
Spectrophotometric, gravimetric procedure: Calibrate the spectrophotometer using distilled water in a 10-cm cuvette. Add the sample from each test tube to 10-cm cuvette. Measure absorbance of each sample at 600 nm in chronological order.
32
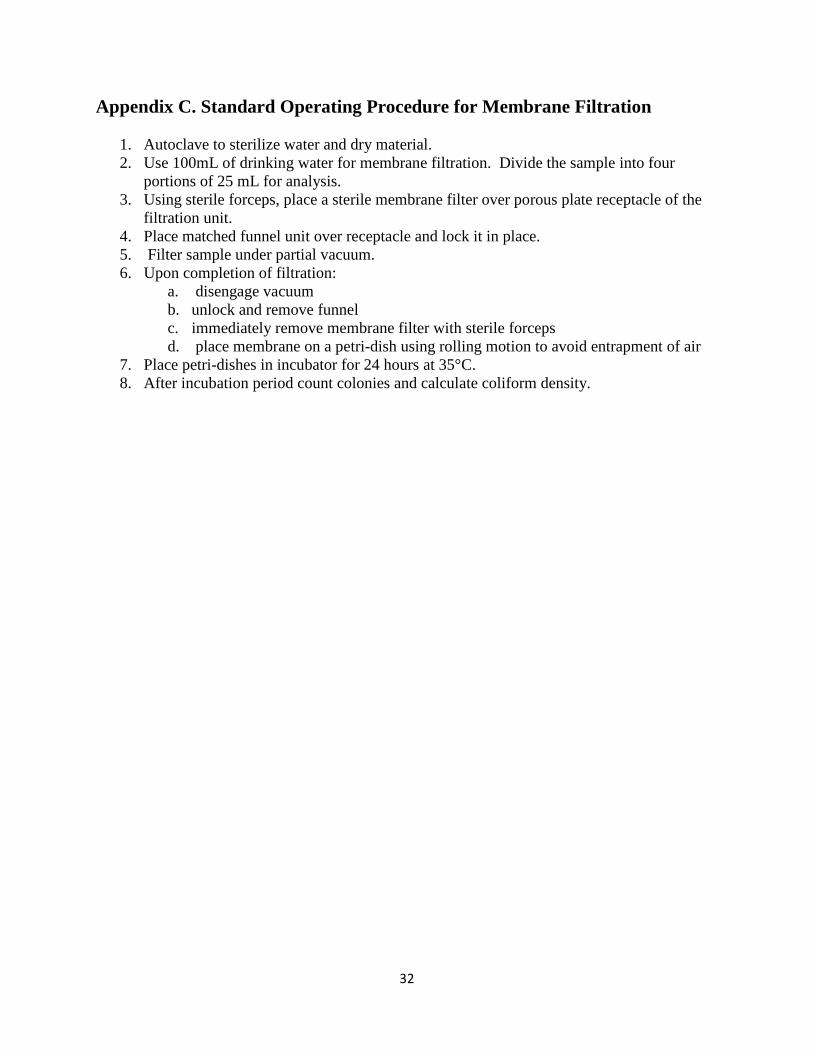
Appendix C. Standard Operating Procedure for Membrane Filtration
1. Autoclave to sterilize water and dry material. 2. Use 100mL of drinking water for membrane filtration. Divide the sample into four
portions of 25 mL for analysis. 3. Using sterile forceps, place a sterile membrane filter over porous plate receptacle of the
filtration unit. 4. Place matched funnel unit over receptacle and lock it in place. 5. Filter sample under partial vacuum. 6. Upon completion of filtration:
a. disengage vacuum b. unlock and remove funnel c. immediately remove membrane filter with sterile forceps d. place membrane on a petri-dish using rolling motion to avoid entrapment of air
7. Place petri-dishes in incubator for 24 hours at 35°C. 8. After incubation period count colonies and calculate coliform density.
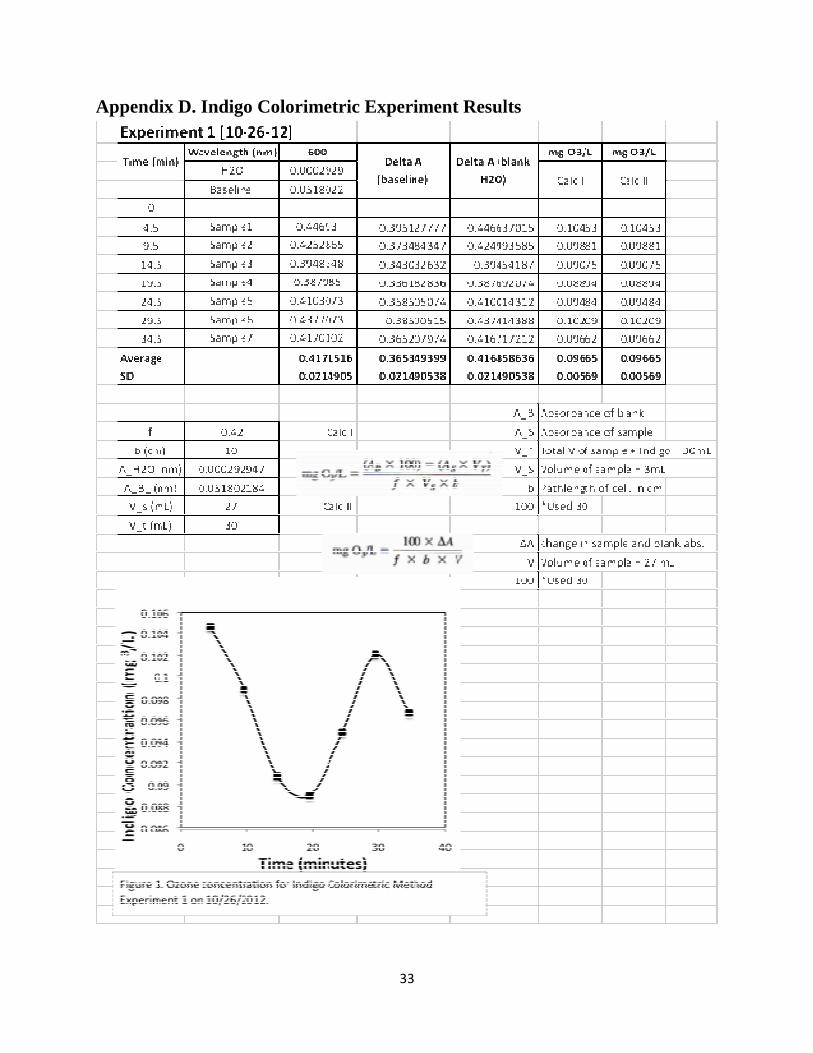
Appendix D. Indigo Colorimetric Experiment Results
33
Indigo Colorimetric Experiment Results
34
35

36
37

38

39

40

41
Appendix E. Membrane Filtration Experiment 1 - Control Samples

42
Appendix F. Membrane Filtration Experiment 2
43

44

Appendix G. Expense Report
45
Expense Report

46
Appendix H. Purchase Request Forms
Order Form 1 (9/6/2012):
Vendor InformationVendor: McMaster-Carr Name:
Contact: http://www.mcmaster.com/ Building:
Address: 200 New Canton Way Room:
City: Robbinsville Phone:
State: New Jersey ZIP: 08691-2343 Email:
Phone: (609) 689-3415 / (609) 259-8900
Fax: (609) 259-3575 / (609) 689-3280
Begin Date
ITEM DESCRIPTION TOTAL COST
3.01$
3.25$
3.55$
3.99$
5.37$
3.01$
3.25$
3.55$
3.99$
5.37$
7.64$
7.52$
53.50$
Does the pro ject require animal & care approval? Yes ______ No ______ If yes, please provide PACUC #: __________________
Signature Date
Signature Date
Signature Date
Signature Date
1
Economy Clear Glass Jar 2oz. 60 mL, 2-1/8" Base Diameter, 1-7/8" Height 1qty 3.01$ 4231T21
qty 1 3.25$ 4231T22 Economy Clear Glass Jar 4oz. 125 mL, 2-3/8" Base Diameter, 2-5/8" Height
1qty4231T21 Economy Clear Glass Jar 2oz. 60 mL, 2-1/8" Base Diameter, 1-7/8" Height 3.01$
Order Placed By:
REQUISITION TOTAL
Dept. Head/ Advisor/PI:
Comptroller:
Chemical Order:
Business Office Use Only:
Is t here a d isco unt ? Y es _ _ _ _ _ N o _ _ _ _ _ ( F i l l o ut t he F o rm 4 1B) I f ed ucat io nal d isco unt , t rack int ernally. Has an eq uipment screening b een comp let ed ? Y es _ _ _ _ _ No _ _ _ _ _ ( R eq uired f or >=$2 5,0 0 0 o n Sp onso red A cct s, D esired f o r al l o t her acco unt s) ? Has t he R equest f o r W aiver o f C o mpet it ive B id d ing d ocument b een comp let ed ? Y es _ _ _ _ _ No _ _ _ _ _ ( Req uired f o r al l single source acq uisit ions >=$10 ,0 0 0 ) . Is t here p rop er do cument at io n f ro m t he PI ap pro ving t he p urchase ( signat ure, email , o t her _ _ _ _ _ _ _ _ _ _ _ _ _ _ _ _ ) ?
Card #
Conf#
Trans ID#
Ref. Doc#
Reconciled:
Received:
4231T23 Economy Clear Glass Jar 8oz. 250 mL, 2-7/8" Base Diameter, 3-1/2" Height
qty 1 3.25$
qty 1 3.55$
4231T22 Economy Clear Glass Jar 4oz. 125 mL, 2-3/8" Base Diameter, 2-5/8" Height
4231T72 Economy Clear Glass Jar 6oz. 180 mL, 2-5/8" Base Diameter, 3-1/8" Height
qty 1 3.99$
qty 1 5.37$ 7545A471 Multipurpose Silicone Adhesive / Sealant 2.8oz Tube, Translucent
CATALOG # QUANUNIT UNIT COST
Account Balance
Project PeriodDateExpiration
Purpose/Specific Benefit to the Project:
Account Information Legacy Account # ______________________________
$ Amount or %Cost Center G/L AccountFund Internal Order
SC #
PO #
Deliver To:
PURCHASE REQUEST
These materials will be used to help develop an ozone-production unit. The ozone generated will be used for
disinfection of contaminated drinking water.
Professor:Special Shipping
Instructions
4
1
3.55$
3.99$
1.91$
7.52$
8296K11
85385T702
Economy Clear Glass Jar 6oz. 180 mL, 2-5/8" Base Diameter, 3-1/8" Height
Economy Clear Glass Jar 8oz. 250 mL, 2-7/8" Base Diameter, 3-1/2" Height
302°F High-Voltage Wire, 22AWG, 0.111" OD, 10000 VDC, White
Corrosion-Resistant 304 SS Woven Wire Cloth 9x9 Mesh, 0.023" Wire Diameter, 12"x12" Sheet
qty
qty
ft
qty
7545A471 Multipurpose Silicone Adhesive / Sealant 2.8oz Tube, Translucent qty 1 5.37$
4231T72
4231T23
1
47
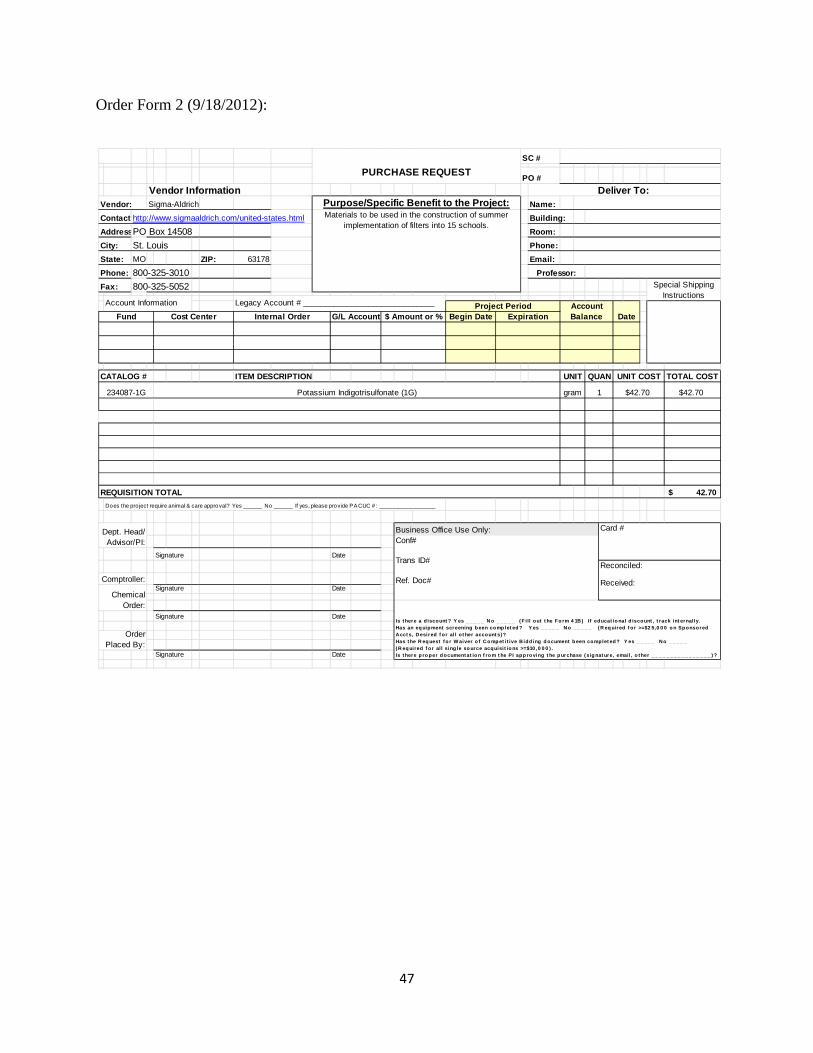
Order Form 2 (9/18/2012):
Vendor InformationVendor: Sigma-Aldrich Name:
Contact:http://www.sigmaaldrich.com/united-states.html Building:
Address:PO Box 14508 Room:
City: St. Louis Phone:
State: MO ZIP: 63178 Email:
Phone: 800-325-3010
Fax: 800-325-5052
Begin Date
ITEM DESCRIPTION TOTAL COST
$42.70
42.70$
Does the project require animal & care approval? Yes ______ No ______ If yes, please provide PACUC #: __________________
Signature Date
Signature Date
Signature Date
Signature Date
SC #
PO #
Deliver To:
PURCHASE REQUEST
Materials to be used in the construction of summer implementation of filters into 15 schools.
Professor:Special Shipping
Instructions
Purpose/Specific Benefit to the Project:
Account Information Legacy Account # ______________________________
$ Amount or %Cost Center G/L AccountFund Internal OrderAccount Balance
Project PeriodDateExpiration
CATALOG # QUANUNIT UNIT COST
1gram234087-1G Potassium Indigotrisulfonate (1G) $42.70
Order Placed By:
REQUISITION TOTAL
Dept. Head/ Advisor/PI:
Comptroller:
Chemical Order:
Business Office Use Only:
Is t here a d iscount ? Y es _ _ _ _ _ N o _ _ _ _ _ ( F i ll out t he Fo rm 4 1B ) I f educat io nal d iscount , t rack int ernal ly. Has an eq uipment screening b een comp let ed ? Y es _ _ _ _ _ N o _ _ _ _ _ ( R eq uired f or >=$2 5,0 0 0 o n Sponsored A cct s, D esired f or al l o t her account s) ? Has t he R eq uest f o r W aiver o f C o mp et it ive B idd ing d ocument b een complet ed ? Y es _ _ _ _ _ N o _ _ _ _ _ ( R eq uired f or al l sing le so urce acquisit io ns >=$10 ,0 0 0 ) . Is t here p ro per d ocument at io n f ro m t he PI app ro ving t he p urchase ( sig nat ure, email , o t her _ _ _ _ _ _ _ _ _ _ _ _ _ _ _ _ ) ?
Card #
Conf#
Trans ID#
Ref. Doc#
Reconciled:
Received:

48
Order Form 3 (9/20/2012):
Vendor InformationVendor: McMaster-Carr Name:
Contact: http://www.mcmaster.com/ Building:
Address: 200 New Canton Way Room:
City: Robbinsville Phone:
State: New Jersey ZIP: 08691-2343 Email:
Phone: (609) 689-3415 / (609) 259-8900
Fax: (609) 259-3575 / (609) 689-3280
Begin Date
ITEM DESCRIPTION TOTAL COST
3.50$
5.66$
11.88$
3.62$
2.99$
2.99$
5.56$
36.20$
Does the pro ject require animal & care approval? Yes ______ No ______ If yes, please provide PACUC #: __________________
Signature Date
Signature Date
Signature Date
Signature Date
SC #
PO #
Deliver To:
PURCHASE REQUEST
Materials to be used in the construction of summer implementation of filters into 15 schools.
Professor:Special Shipping
Instructions
Purpose/Specific Benefit to the Project:
Account Information Legacy Account # ______________________________
$ Amount or %Cost Center G/L AccountFund Internal OrderAccount Balance
Project PeriodDateExpiration
CATALOG # QUANUNIT UNIT COST
9600K25 Push-in Grommet 1/4" ID, 1/2" OD, 1/16" Thk for 3/8" Dia Panel Hole, packs of 100
8296K14 302 Degree F High-Voltage Wire 20 AWG, .128" OD, 1500 VDC, White
pack 1 3.62$
pack 1 2.99$ 7060K19 Insulated Barrel Quick-Disconnect Terminal Standard Female, 22-18 AWG, .25" W X .032" Thk Tab, packs of 10
25ft50375K41 High-Pressure/Vacuum Polyethylene Tubing 1/8" ID, 1/4" OD, 1/16" Wall Thickness, White 0.14$
Order Placed By:
REQUISITION TOTAL
Dept. Head/ Advisor/PI:
Comptroller:
Chemical Order:
Business Office Use Only:
Is t here a d isco unt ? Y es _ _ _ _ _ N o _ _ _ _ _ ( F i ll o ut t he Fo rm 4 1B ) I f ed ucat ional d isco unt , t rack int ernally. Has an eq uip ment screening b een co mp let ed ? Y es _ _ _ _ _ N o _ _ _ _ _ ( R eq uired f o r >=$2 5,0 0 0 o n Sp o nso red A cct s, D esired f or al l o t her acco unt s) ? Has t he R eq uest f o r W aiver o f C o mp et it ive B idd ing d o cument b een co mp let ed? Y es _ _ _ _ _ N o _ _ _ _ _ ( R eq uired f o r al l sing le so urce acq uisit io ns >=$10 ,0 0 0 ) . Is t here p ro p er do cument at io n f ro m t he PI ap p ro ving t he purchase ( sig nat ure, email , o t her _ _ _ _ _ _ _ _ _ _ _ _ _ _ _ _ ) ?
Card #
Conf#
Trans ID#
Ref. Doc#
Reconciled:
Received:
9600K17 Push-in Grommet 1/8" ID, 11/32" OD, 1/16" Thk for 3/16" Dia Panel Hole, packs 100
pack 1 5.66$
ft 6 1.98$
Insulated Barrel Quick-Disconnect Terminal Standard Male, 22-18 AWG, .25" W X .032" Thk Tab, packs of 10 1pack 2.99$ 7060K81
item 1 5.56$ 4231T25 Economy Clear Glass Jar 32 oz, 1,000ml, 3-3/4' Base Diameter, 6-5/8" Height

Order Form 4 (1/15/2013):
49

Order Form 5 (1/15/2013):
50
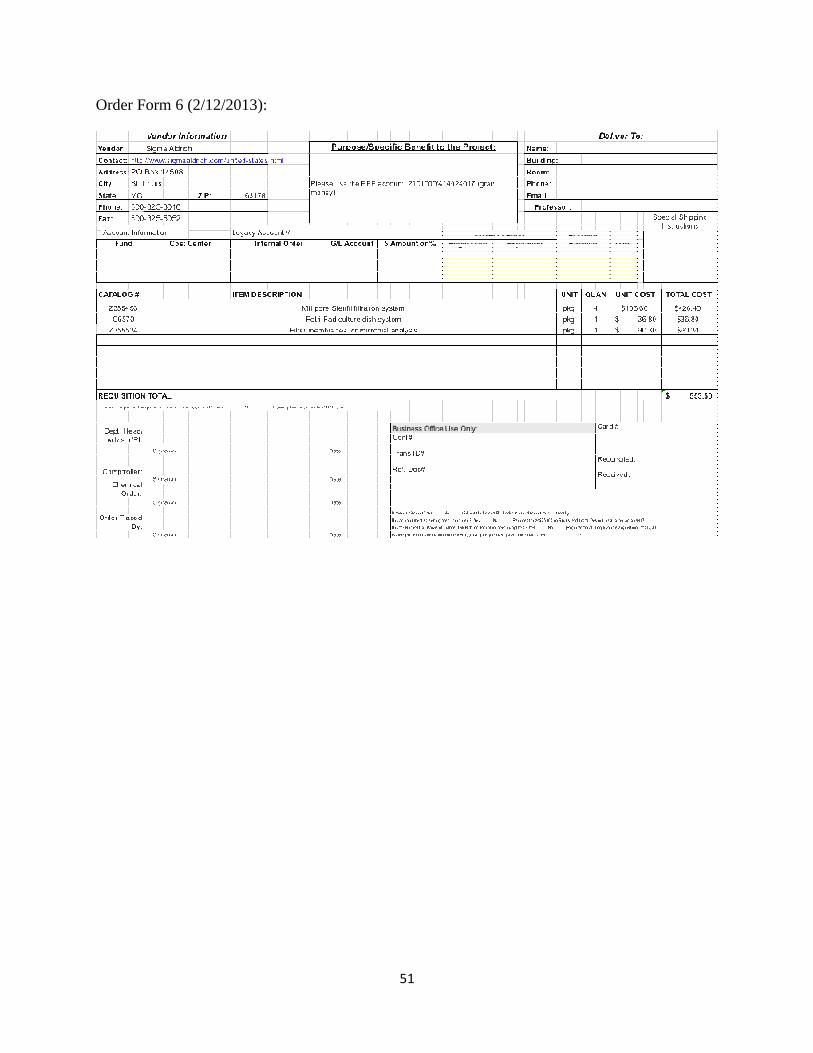
Order Form 6 (2/12/2013):
51

52
Order Form 7 (04/01/2013):
Vendor InformationVendor: Fisher Scientific Name:
Contact:http://www.fishersci.com/ecomm/servlet/cmstatic?storeId=10652&ddkey=http:home Building:
Address:300 Industry Drive Room:
City: Pittsburgh Phone:
State: PA ZIP: 15275 Email:
Phone: 1-800-766-7000
Fax: 1-800-926-1166
Begin Date
ITEM DESCRIPTION TOTAL COST
$60.38
60.38$
Does the project require animal & care approval? Yes ______ No ______ If yes, please provide PACUC #: __________________
Signature Date
Signature Date
Signature Date
Signature Date
1pk09-720-501LC Petri Dish Pad 47mm Sterile 150/pk $60.38
Order Placed By:
REQUISITION TOTAL
Dept. Head/ Advisor/PI:
Comptroller:
Chemical Order:
Business Office Use Only:
Is t here a d iscount ? Y es _ _ _ _ _ N o _ _ _ _ _ ( F i ll out t he Fo rm 4 1B ) I f educat io nal d iscount , t rack int ernal ly. Has an eq uipment screening b een comp let ed ? Y es _ _ _ _ _ N o _ _ _ _ _ ( R eq uired f or >=$2 5,0 0 0 o n Sponsored A cct s, D esired f or al l o t her account s) ? Has t he R eq uest f o r W aiver o f C o mp et it ive B idd ing d ocument b een complet ed ? Y es _ _ _ _ _ N o _ _ _ _ _ ( R eq uired f or al l sing le so urce acquisit io ns >=$10 ,0 0 0 ) . Is t here p ro per d ocument at io n f ro m t he PI app ro ving t he p urchase ( sig nat ure, email , o t her _ _ _ _ _ _ _ _ _ _ _ _ _ _ _ _ ) ?
Card #
Conf#
Trans ID#
Ref. Doc#
Reconciled:
Received:
CATALOG # QUANUNIT UNIT COST
Account Balance
Project PeriodDateExpiration
Purpose/Specific Benefit to the Project:
Account Information Legacy Account # ______________________________
$ Amount or %Cost Center G/L AccountFund Internal Order
SC #
PO #
Deliver To:
PURCHASE REQUEST
Please use the EEE account: 2101000/414024017 (grant money)
Professor:Special Shipping
Instructions
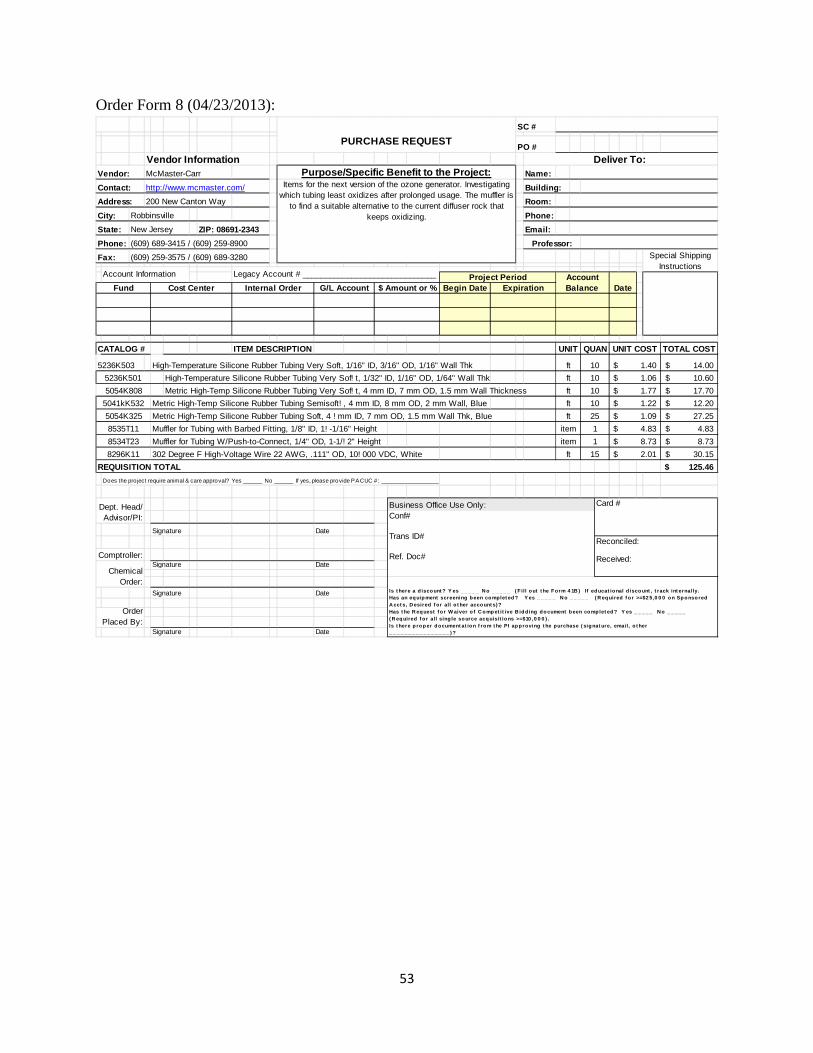
53
Order Form 8 (04/23/2013):
Vendor InformationVendor: McMaster-Carr Name:
Contact: http://www.mcmaster.com/ Building:
Address: 200 New Canton Way Room:
City: Robbinsville Phone:
State: New Jersey ZIP: 08691-2343 Email:
Phone: (609) 689-3415 / (609) 259-8900
Fax: (609) 259-3575 / (609) 689-3280
Begin Date
ITEM DESCRIPTION TOTAL COST
5236K503 High-Temperature Silicone Rubber Tubing Very Soft, 1/16" ID, 3/16" OD, 1/16" Wall Thk 14.00$
High-Temperature Silicone Rubber Tubing Very Sof! t, 1/32" ID, 1/16" OD, 1/64" Wall Thk 10.60$
Metric High-Temp Silicone Rubber Tubing Very Sof! t, 4 mm ID, 7 mm OD, 1.5 mm Wall Thickness 17.70$
Metric High-Temp Silicone Rubber Tubing Semisoft! , 4 mm ID, 8 mm OD, 2 mm Wall, Blue 12.20$
Metric High-Temp Silicone Rubber Tubing Soft, 4 ! mm ID, 7 mm OD, 1.5 mm Wall Thk, Blue 27.25$
Muffler for Tubing with Barbed Fitting, 1/8" ID, 1! -1/16" Height 4.83$
Muffler for Tubing W/Push-to-Connect, 1/4" OD, 1-1/! 2" Height 8.73$
302 Degree F High-Voltage Wire 22 AWG, .111" OD, 10! 000 VDC, White 30.15$
125.46$
Does the pro ject require animal & care approval? Yes ______ No ______ If yes, please provide PACUC #: __________________
Signature Date
Signature Date
Signature Date
Signature Date
8296K11 ft 15 2.01$
1item 4.83$ 8535T11
item 1 8.73$ 8534T23
Order Placed By:
REQUISITION TOTAL
Dept. Head/ Advisor/PI:
Comptroller:
Chemical Order:
Business Office Use Only:
Is t here a d isco unt ? Y es _ _ _ _ _ N o _ _ _ _ _ ( F i l l o ut t he F orm 4 1B ) If ed ucat io nal d isco unt , t rack int ernally. Has an eq uip ment screening b een co mplet ed ? Y es _ _ _ _ _ N o _ _ _ _ _ ( R eq uired f o r >=$2 5,0 0 0 o n Sp o nso red A cct s, D esired f or al l o t her acco unt s)? Has t he R eq uest fo r W aiver o f C o mp et it ive B id ding d o cument b een co mp let ed ? Y es _ _ _ _ _ N o _ _ _ _ _ ( R eq uired f o r al l sing le so urce acq uisit io ns >=$10 ,0 0 0 ) . Is t here p ro p er d ocument at io n f ro m t he PI ap p roving t he purchase ( sig nat ure, email , o t her _ _ _ _ _ _ _ _ _ _ _ _ _ _ _ _ ) ?
Card #
Conf#
Trans ID#
Ref. Doc#
Reconciled:
Received:
ft 25 1.09$ 5054K325
10ft 1.40$
5041kK532
ft 10 1.06$
ft 10 1.77$
UNIT COST
5236K501
5054K808
ft 10 1.22$
CATALOG # QUANUNIT
Account Balance
Project PeriodDateExpirationFund Internal Order $ Amount or %Cost Center G/L Account
Purpose/Specific Benefit to the Project:
Account Information Legacy Account # ______________________________
Items for the next version of the ozone generator. Investigating which tubing least oxidizes after prolonged usage. The muffler is
to find a suitable alternative to the current diffuser rock that keeps oxidizing.
Professor:Special Shipping
Instructions
SC #
PO #
Deliver To:
PURCHASE REQUEST