Training Induced Acceleration of Oxygen Uptake Kinetics in Skeletal Muscle the Underlying Mechanisms
Upload
ezinne-ofoegbuCategory
view
37download
1description
Engage.. Ignite.. Empower..©
Developed by: Fabio Comana, MA., MS.
NASM CPT, CES & PES; ACE CPT & LWMC, ACSM HFS, CSCS, CISSN Genesis Wellness Group
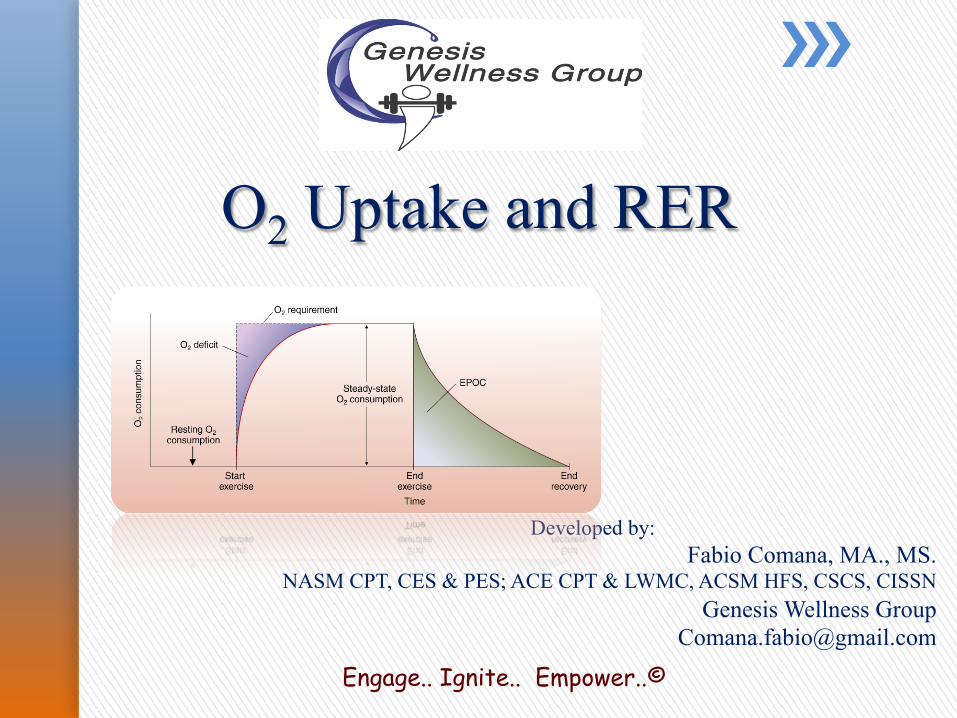
O2 Uptake and RER

Engage.. Ignite.. Empower..©
Steady State, Oxygen Deficits and EPOC » Oxygen uptake into muscle cells increases rapidly during first few minutes of
exercise, reaching a plateau within a short time frame of 90 seconds up to 3 - 4 minutes. ü Plateau described as Steady State:
o Defined as the balance between the energy required by working muscles and the rate of aerobic ATP production.
» The rate at which one achieves steady state exercise is dependent upon: ü Training status. ü Intensity of exercise. ü Modality of exercise. ü Degree to which exercise intensity is constant.
Existing O2 Need
New O2 Need
Time Needed to Meet New Need

» Until steady state is achieved - additional energy demands met by anaerobic pathways: ü Creates a deficiency called the Oxygen Deficit.
o Defined as the “difference between total oxygen consumed during exercise and the amount that would have been consumed had steady state been reached immediately.”

» During recovery, oxygen consumption remains elevated above actual oxygen needs for a period of time. ü Originally called Oxygen Debt - believed to be repayment of anaerobic
energy borrowed before steady state. (NOTE – O2 Debt is No Longer used)
ü But O2 utilization is bigger than oxygen deficit, implying the involvement of other events = Excess Post-exercise Oxygen Consumption (EPOC).
Rapid Phase
Slow Phase
Recovery Begins

EPOC contains two components: » Rapid component (first 2-3 minutes up to 30 – 60 minutes):
ü Primarily the: o Restoration of phosphagen, reconversion of lactate. o Reloading hemoglobin / myoglobin with O2.
» Slow component (up to 24 hours or more): ü Primarily the:
o Thermoregulation, greater respiratory demand. o Increased metabolism due to tissue / glycogen synthesis, and repair. o Residual hormone effects. o Removing of accumulated CO2 in body tissues.

» High-intensity interval training (HIIT), heavy resistance training and long duration (energy-depleting) workouts create large EPOCs.
o Can boost metabolism by average of 12 % temporarily for a few hours, but remain elevated for 24 hours + (muscle building).
o Typically only represents 7 – 25 % of energy expended during workout (~ 60 – 150 kcal).
o Key fuel source for EPOC = fats.
» By comparison – EPOC for people performing light-to-moderate activity (e.g., walking, light jogs) is almost 0 kcal.
Study: 10 young, well-conditioned men performing sustained, vigorous-intensity exercise – 45 minutes at ~ 70% of VO2max (~ 85% of maximal effort)
ü Total caloric expenditure = 519 kcal. ü EPOC increased for 14 hours following exercise = 190 kcal (13.6 kcal/hour), representing
37% kcal expended during exercise). ü Translated into lay terms:
o 3,500 kcal = one pound (equals 0.15 lb.) o If performed 3x/week, 52x/year – EPOC total = 29,640 kcal (8½ pounds)
Reference: Knab, A.M., Shanely, A., Corbin, K.D., Jin, F., Sha, W., and Neiman, D.C., (2011). A 45-minute vigorous exercise bout increases metabolic rate for 14 hours. Medicine and Science in Sports and Exercise, 43:1643–1648.

» Measure of body’s O2 consumption or utilization. ü Reflects body’s ability to deliver O2 to
exercising muscles and extract O2 from capillaries for delivery to the mitochondria.
» VO2max or maximal oxygen uptake measures upper limit of O2 utilization. ü Higher VO2 score reflects greater O2
utilization and greater capacity for physical work.
» As a Marker of Performance: ü Old standard for measuring exercise performance, but still a good
indicator of cardiorespiratory endurance and aerobic fitness. ü Better marker of health – VO2max standards been established to
reflect an individual’s level of conditioning.

Individual Differences in VO2: » Differs according to sex, body size, age, and is greatly influenced by the
level of aerobic training.
Heredity Gender State of Training
Mode Physiological Differences
Accounts for 20 – 30 % of VO2
differences, 50 % of maximal heart rate and 70 % of physical working
capacity
15 – 30 % higher in males
(testosterone, hemoglobin and lean body mass).
Improves 6 – 20 % on average,
although greater improvements in de-conditioned
individuals
5 – 10 % higher scores in running
activities vs. cycling due to greater muscle involvement.
Enzyme activity levels, capillary
and mitochondrial density, gas ventilation
efficiency, etc.).

» VO2 is generally expressed in units of volume of oxygen consumed per unit of time. ü Volume = L or mL (1 L = 1,000 mL). ü Time = 1 minute.
» VO2 is calculated by the difference between the volume of inspired O2 and expired O2. ü Absolute VO2 (L/min): Volume of O2 consumed / unit of time.
o Represents total O2 consumed by entire body, regardless of size. o Unfair to compare scores due to differences in body size, hemoglobin
and lean body mass content.
ü Relative VO2: (mL/kg/min): Volume of O2 consumed / unit of time / unit of body weight. o Score measures oxygen consumption relative to a unit of measurement
equal on all individuals à 1 kg of body weight.
Conversions: • 1 fluid oz. = 29.57 mL • 8 oz. = 236.5 mL • 16.9 fluid oz. = 500 mL

L / min (O2 consumption)
Absolute VO2
mL / min (O2 consumption)
Absolute VO2
x 1,000
3 L / min 3,000 mL / min
÷ body weight mL / min per Kg or mL / Kg / min
Relative VO2
3,000 mL / min ÷ 50 Kg = 60 mL / Kg / min
METS 3.5 mL / Kg / min = 1 MET
60 mL / Kg / min ÷ 3.5 = 17.1 METS
Absolute VO2 to Relative VO2 or METS

Relative VO2 to Absolute VO2 or Kcal
L / min Absolute VO2
mL / min Absolute VO2
x body weight
3 L / min 60 mL / Kg / min x 50 Kg = 3,000 mL / min
÷ 1,000 mL / Kg / min Relative VO2
60 mL / Kg / min
Kcal 1 L / min of O2 consumption = ~ 5 kcal
3 L / min x 5 = 15 kcal / min

Example: » Subject A: A female weighting 110 lb. (50 kg), is measured with an absolute
VO2max of 2.0 L/min.
» Subject B: A male weighing 220 lb. (100 kg), is measured with an absolute VO2max of 3.0 L/min.
» Is it fair to conclude that Subject B is 50.0 % more fit than Subject A, based on his greater capacity to consume oxygen?

Subject A Subject B
Absolute VO2 (L/Min) 2.0 L/min 3.0 L/min
Absolute VO2 (mL/min) x 1,000 2,000 mL/min 3,000 mL/min
Body weight (Kg) 50 Kg 100 Kg
Relative VO2 (absolute ÷ body weight) 40 mL/Kg/min 30 ml/Kg/min
» For Subject A: If 50 kg consumes 2,000 ml/minute, 1 kg consumes 40 ml/min.
» For Subject B: If 100 kg consumes 3,000 ml/minute, 1 kg consumes 30 ml/min.

Simpler Solutions without Gas Analysis? VO2max and Heart Rate Measurements » As true VO2max is difficult to measure, heart rate (HR) is used as HR and
VO2 show similar relationships when plotted against workloads. ü HR is generally considered a valid method to predict VO2.

Simpler Solutions without Gas Analysis?

Respiratory Exchange Ration (RER)

» Metabolic reaction to generate energy is represented as follows:
Fuel + Oxygen = Energy + Carbon Dioxide + Water
» Differences in molecular structure between carbohydrates, fats and proteins requires different amounts of oxygen and generates different amounts of carbon dioxide.
» Ratio of CO2 produced to O2 consumed provides an approximation of the fuel utilized for energy - ratio originally called Respiratory Quotient (RQ). ü Now called RER or R.
RER / R = Quantity Carbon Dioxide produced ÷ Quantity Oxygen consumed
RER / R = VCO2 / VO2
Assumption: Gas ratios measured at lungs accurately represent gas ratios in cells.

FUEL + OXYGEN = ENERGY + CARBON DIOXIDE + WATER
Balanced Equation Example: C6H12O6 + 6O2 à 36 ATP + 6CO2
Balanced Equation Example: C16H32O2 + 23O2 à 129 ATP + 16CO2
Glucose
Fats

» Carbohydrates hold a 2:1 ratio of hydrogen-to-oxygen atoms: ü Glucose: C6H12O6 + 6O2 ⇔ 6CO2 + 6H2O. ü RQ = 6 ÷ 6
RQ score of 1.00 indicates carbohydrate utilization.
» Fats hold a 16: 1 ratio of hydrogen-to-oxygen atoms: ü Palmitic acid a 16-C fatty acid - oxidized as follows:
ü C16H32O2 + 23O2 ⇔ 16CO2 + 16H2O. ü RQ = 16 ÷ 23
RQ = 0.69. RQ scores between 0.69 – 0.73 (averaging 0.70) indicates fat utilization.

Macronutrient Contributions to Respiratory Exchange Ratio (RER) Scores
Energy % kcal % kcal
RER Kcal / L O2 Carbohydrates Fats
0.70 4.69 0.0 % 100.0 %
0.75 4.74 15.6 % 84.4 %
0.80 4.80 33.4 % 66.6 %
0.85 4.86 50.7 % 49.3 %
0.90 4.92 67.5 % 32.5 %
0.95 4.99 84.0 % 16.0 %
1.00 5.05 100.0 % 0.0 %
Which fuel yields more energy per Liter of O2?

Fuel Utilization Ratios:
Fuel Rest Low-intensity High-intensity
Fats 50 – 67 % 60 – 80 % 0 – 20 %
Carbohydrates 33 – 50 % 20 – 40 % 80 – 100%
Influenced by: (1) Macronutrient intake (2) Conditioning level.
Shift to fats represents increased O2 delivery v. small energy demand.
Shift to carbohydrates represents limitations in
O2 delivery v. large energy demand
Rest Low Intensity Moderate intensity High Intensity
Fuel Utilization
100 %
50%
0%
Carbohydrate Utilization Fat Utilization
VT1 “crossover point” VT2
RER
1.00 0.85 0.70
RER Score
Daily RER derived from a mixture of available fuels. Average resting
RER = 0.78 - 0.84.

Assumptions
» Until recently, researchers believed that ONLY carbohydrates and fats contributed to metabolism. ü Recent research demonstrates contributions from proteins to daily
energy expenditure. ü Additionally, gas ratios at lungs DO NOT always mirror gas ratios at
cellular level. o RQ replaced with Respiratory Exchange Ratio (RER or R) to reflect
these differences - calculated in same manner as RQ.
» Protein (e.g., albumin) is oxidized as follows:
C72H112N2O22S + 77O2 = Energy + 63CO2 + 38H2O + SO3 + 9CO(NH2)2 (urea)
ü RER = 0.818.

RQ / RER Limitations » RQ, RER or R scores are based upon the assumption that gas exchanges at
pulmonary (lung) level and at cellular level are proportional. ü While holding true during steady-state exercise, several conditions can
alter this ratio to no longer reflect cellular substrate utilization. ü CO2 pools within the body are quite large and can be altered simply by
breathing deeply, by diet, exercise intensity or during recovery.
» RER scores are skewed / can fall outside of 0.7 – 1.00 range under specific conditions: ü Lactate production and clearance. ü Hemoglobin and myoglobin reloading. ü Bicarbonate regeneration. ü Lipogenesis with excessive carbohydrate intakes. ü Gluconeogenesis.

Lactic Acid Production and Clearance:
» Exclusive utilization of carbohydrates during high-intensity exercise creates RER scores of 1.00.
» Anaerobic respiration = lactic acid - buffered by sodium bicarbonate (NaHCO3) producing additional CO2.
» Additional CO2 increases scores > 1.00 to 1.50. ü RQ scores are 1.00 with carbohydrates (VCO2 / VO2). ü CO2 from metabolism and lactic acid buffering increases score > 1.00. ü This may elevate RER scores during intense exercise and up to 30 – 60
minutes during recovery.
RER = VCO2 / VO2 If CO2 levels measured at lungs increase = increased RER score

Hemoglobin and Myoglobin Reloading:
» During higher-intensity exercise, hemoglobin and myoglobin release more O2 to cells.
» During recovery, these molecules must be reloaded with O2. ü Some O2 breathed is not consumed by muscle cells, but used to
reload hemoglobin and myoglobin. ü Quantity of O2 consumed (measured at lungs) does not reflect true O2
consumption at cellular level.
» Additional O2 may decrease scores towards or < 0.70.
RER = VCO2 / VO2 If O2 levels measured at lungs show more consumption = decreased RER score

Bicarbonate Regeneration:
» During recovery after high-intensity, exhaustive exercise, blood MUST retain some carbon dioxide produced during metabolism (in muscle cells) to replenish depleted bicarbonate buffering system. ü Lowers measured amounts of carbon dioxide collected at lungs.
» Lowered CO2 may decrease scores towards or < 0.70.
RER = VCO2 / VO2 If CO2 levels measured at lungs decrease = decreased RER score
Na + HCO3 à CO2 + H2O -- In recovery we need H2O + CO2

Lipogenesis with Excessive Carbohydrate Intakes:
» Excess carbohydrate intakes result in lipogenesis – changes resting RER scores due to different hydrogen-to-oxygen ratios between carbohydrates and fats.
Carbohydrates = 2:1 ratio vs. fats = 16:1 ratio.
ü Lipogenesis releases this excess O2 in the cell to modify needed ratios for making fats.
ü O2 released in cell used for normal cell metabolism - reduces quantity needed from inspired air (measured at the lungs).
» Reduced O2 may increase scores towards or > 1.00.
RER = VCO2 / VO2 If O2 levels measured at lungs show less consumption = increased RER score

Gluconeogenesis
» Manufacture of glucose from amino acids or glycerol requires additional oxygen to achieve required hydrogen-to-oxygen ratio for glucose. ü Process requires additional O2 (measured at lungs), but not metabolized
in metabolism at the cellular level.
» Additional O2 may decrease scores towards or < 0.70.
RER = VCO2 / VO2 If O2 levels measured at lungs increase = decreased RER score
Glucose: C6H12O6 = 2-to-1 ratio Amino Acid Example: C3H7NO2 = 7-to-2 ratio