Oxygen Isotope Composition of Seawater
9
This article was originally published in the Encyclopedia of Quaternary Science published by Elsevier, and the attached copy is provided by Elsevier for the author's benefit and for the benefit of the author's institution, for non-commercial research and educational use including without limitation use in instruction at your institution, sending it to specific colleagues who you know, and providing a copy to your institutions administrator. All other uses, reproduction and distribution, including without limitation commercial reprints, selling or licensing copies or access, or posting on open internet sites, your personal or institutions website or repository, are prohibited. For exceptions, permission may be sought for such use through Elsevier's permissions site at: http://www.elsevier.com/locate/permissionusematerial Rohling E.J. (2013) Oxygen Isotope Composition of Seawater. In: Elias S.A. (ed.) The Encyclopedia of Quaternary Science, vol. 2, pp. 915-922. Amsterdam: Elsevier. © 2013 Elsevier Inc. All rights reserved.
Transcript of Oxygen Isotope Composition of Seawater

This article was originally published in the Encyclopedia of Quaternary Science published by Elsevier, and the attached copy is provided by Elsevier for the author's benefit and for the benefit of
the author's institution, for non-commercial research and educational use including without limitation use in instruction at your institution, sending it to specific colleagues who you know, and
providing a copy to your institution�’s administrator.
All other uses, reproduction and distribution, including without limitation commercial reprints, selling or licensing copies or access, or posting on open internet sites, your personal or institution�’s
website or repository, are prohibited. For exceptions, permission may be sought for such use through Elsevier's permissions site at:
http://www.elsevier.com/locate/permissionusematerial Rohling E.J. (2013) Oxygen Isotope Composition of Seawater. In: Elias S.A. (ed.) The Encyclopedia
of Quaternary Science, vol. 2, pp. 915-922. Amsterdam: Elsevier.
© 2013 Elsevier Inc. All rights reserved.

Oxygen Isotope Composition of SeawaterE J Rohling, The Australian National University, Canberra, ACT, Australia
ã 2013 Elsevier B.V. All rights reserved.
Introduction
This article deals with processes that affect the ratio of the twomost common stable isotopes of oxygen in seawater and ex-plores ways in which this has changed during the Quaternary.Both text and figures draw heavily on the water-based oxygenisotope part of a previously published essay on stable oxygenand carbon isotopes in Foraminifera (Rohling and Cooke,1999). In contrast to the current text, which offers only thefundamental key references, the essay of Rohling and Cooke(1999) contains a very extensive set of references, and wouldtherefore be a useful first step for further and more specializedreading.
Natural Abundance, Measurement, andPhysicochemical Behavior
Oxygen exists in nature in the form of three stable isotopes:16O, 17O, and 18O. Their relative natural abundances are 99.76,0.04, and 0.20%, respectively. Because of the higher abun-dances and the greater mass difference between 16O and 18O,research on oxygen isotope ratios normally concerns 18O/16Oratios.
The word isotope (Greek, meaning ‘equal places’) impliesthat the various isotopes occupy the same position in thePeriodic Table. The difference between the atomic masses ofthe isotopic species for each element consists of a differentnumber of neutrons in the nucleus, but isotopes have thesame number of protons. The oxygen isotope 16
8O contains8 protons and 8 neutrons, giving it an atomic mass of 16. Theisotope 18
8O contains 8 protons and 10 neutrons, giving it anatomic mass of 18.
While the absolute abundances of minor isotopes (such as18O) cannot be determined accurately, it is still possible to getquantitative results by comparing the result given for a knownexternal standard with that for the unknown sample. Thesedifferences in isotope ratios, known as d values, are defined as:
dsam ! Rsam " Rstd
Rstd# 1000
Here, sam is the sample value and std is the standard orreference value. These variations in composition are given indelta (d) notation and are reported in parts per thousand (permille,%). R stands for the heavy/light ratio between the abun-dances of any two isotopes (e.g., 18O/16O). A positive d valueindicates enrichment in the heavy isotope, relative to the stan-dard, and conversely, depletion is shown by a negative d value.The standard used today in the analysis of d18O in water is theVienna Standard Mean Ocean Water (VSMOW).
All isotopes of a given element contain the same numberand arrangement of electrons, and so broadly display similarityin their chemical behavior. However, the mass differences of
different isotopes impose subtle differences in their physico-chemical properties. The mass differences are particularlyimportant in light elements (low numbers in the PeriodicTable). Molecules vibrate with a fundamental frequencywhich depends on the mass of the isotopes from which theyare composed. The resultant differences in dissociation energyof the light and heavy isotopes imply that bonds formed bylight isotopes are weaker than those formed by heavy isotopes.Hence, as a rule of thumb, molecules comprised of the lightisotopes react somewhat more easily than those comprised ofthe heavy isotopes.
The partitioning of isotopes between substances with dif-ferent isotopic compositions is called ‘fractionation.’ The frac-tionation factor (a), which quantifies isotopic fractionationbetween two substances A and B, is defined as a!RA/RB.Here, RA and RB are the heavy/light ratios between the abun-dances of any two isotopes (e.g., 18O/16O) in the exchangingchemical compounds A and B, respectively. Fractionationmainly results from: (1) isotope exchange reactions and (2)kinetic effects. Isotope exchange reactions concern partitioningof isotopes between phases that are in equilibrium, and aretherefore also known as ‘equilibrium isotope fractionation’processes. Processes of equilibrium fractionation are essen-tially temperature dependent. Kinetic effects cause deviationsfrom the simple equilibrium processes due to different rates ofreaction for the various isotopic species (due directly to vibra-tion differences, or indirectly through differences in bondingenergies). Important kinetic effects are associated withdiffusion.
Processes Controlling Oxygen Isotope Ratios inSeawater
The oxygen isotope ratio of seawater is intimately linked withfractionation processes within the hydrological cycle. Schemat-ically, this cycle is comprised of evaporation, atmosphericvapor transport, precipitation, and subsequent return of fresh-water to the ocean (directly via precipitation and via runoff oriceberg melting). Long-term storage of freshwater in aquifersand especially ice sheets is also important for seawater isotoperatios (Figure 1). Formation and melting of seasonal sea iceimposes strong local variability. Finally, the spatial distributionof oxygen isotopes in the world’s oceans depends on processesof advection and mixing of water masses from different sourceregions with different isotopic signatures. The various influ-ences are discussed below, but it should be noted that thisforms only a basic introduction, and specialist texts and re-views should be consulted before advanced applications. Keytexts and overviews can be found in Craig and Gordon (1965),Dansgaard (1964), Garlick (1974), Gonfiantini (1986), Hoefs(1997), Hoffmann and Heimann (1997), Joussaume andJouzel (1993), Jouzel et al. (1975), Majoube (1971), Merlivat
915
Author's personal copy
Encyclopedia of Quaternary Science, (2013), vol. 2, pp. 915-922

and Jouzel (1979), Rohling and Cooke (1999), Rozanski et al.(1982, 1993), and Stewart (1975).
Evaporation
The isotopic exchange at the sea–air interface is given by:
H216Oliquid $ H2
18Ovapor , H218Oliquid $ H2
16Ovapor
Molecules composed of lighter isotopes have higher vaporpressures and the lighter molecular species are therefore pref-erentially enriched in the vapor phase. The fractionation factorfor the equilibrium exchange is al"v! [18O/16O]l/[
18O/16O]v.The most commonly used relationship between al"v and tem-perature during evaporation is that given by Majoube (1971):
al"v! exp f%1:137 T"2g "%0:4156 T"1&"2:0667#10"3g
where T is in Kelvin. This relationship illustrates a decreasein fractionation with increasing temperature. The fractionationcauses a difference between d18O of seawater and d18O of vaporevaporated from that seawater equal to d18Ol"d18Ov!103 ln(a) %. At a temperature of 20 'C this difference amounts toabout 9.8%. The equilibrium enrichment factor e is defined ase!a"1, and is often reported as a % value. For a!1.010,e!10%.
Craig and Gordon (1965) found that, in addition to equi-librium fractionation, further fractionation should have oc-curred to explain their observations of stronger depletions invapor than expected from equilibrium fractionation only. Thisfurther depletion is thought to be due to kinetic effects duringmolecular diffusion within the boundary layer between thewater–air interface and the fully turbulent region (where nofurther fractionation occurs). Within that boundary layer, dif-fusion predominates because of slow atmospheric transport.The kinetic enrichment factor (De) for oxygen isotopes de-pends on the relative air humidity (h) in the turbulent regionoutside the boundary layer, giving a relationship for mostnatural circumstances of De!14.2 (1"h) %, where h is pre-sented as a fraction (i.e., 0.7 means 70% relative humidity).
Since diffusion rates depend on property gradients, the finalisotopic composition of newly evaporated water also dependson the isotopic composition (d18Oatm) of vapor already pre-sent in the turbulent region of the atmosphere, and on d18O ofthe surface water (Gonfiantini, 1986):
d18OE ! 1
1" h$ Ded18OSea surface " e
a" hd18Oatm " De
! "
Here, the d18O, De, and e values, normally reported in%, are tobe used in true form, that is, value #10"3. It will be obviousthat the preferential uptake of the lighter isotope during evap-oration causes a shift to heavier d18O values in the remainingsurface waters.
Precipitation and Atmospheric Vapor Transport
Fractionation processes during the formation of droplets arebasically the same as during evaporation, but work in theopposite direction. Droplets are normally near equilibriumwith atmospheric vapor, due to an absence of significantkinetic fractionation during condensation when relativehumidity is 100%. The equilibrium fractionation factor forcondensation is the same as that for evaporation and maytherefore be determined with Majoube’s (1971) equation forthe appropriate temperature, and then used in d18Ol"d18Ov!103 ln (a) % to determine the isotopic compositionof the droplets for any given atmospheric vapor composition.
Since condensation preferentially removes the heavierisotope 18O, the d18O of the remaining atmospheric vaporbecomes progressively more depleted. Relative to an originalatmospheric vapor composition that is given by the composi-tion of evaporated water (d18OE), the isotopic compositionof the atmospheric vapor (AV) is approximated byd18OAV!d18OE$103(a"1) lnf (Dansgaard, 1964), where a isthe fractionation factor at condensation temperature and fis the fraction of atmospheric vapor remaining after rain-out(e.g., 0.7 if 70% of the evaporated water remains as atmo-spheric vapor due to 30% rain-out). The isotopic composition
EvaporationEquilibrium andkinetic effects
PrecipitationEquilibrium and
kinetic (snow formation)effects
PrecipitationPredominantly equilibrium
effects
Runoff
Groundwaterstorage
(104 years)
Icestorage
(104–105 years)
Rayleigh distillation
Iceberg calving
Enrichment DepletionDepletion from melting
Storage effects ‘fix’ 16O: cause 18O enrichment throughout oceans
Figure 1 Schematic presentation of the hydrological cycle influences on oxygen isotope ratios. Effects on seawater are described in italics (reproducedfrom Rohling EJ and Cooke S (1999) Stable oxygen and carbon isotope ratios in foraminiferal carbonate. In: Sen Gupta BK (ed.) Modern Foraminifera,pp. 239–258. Dordrecht, The Netherlands: Kluwer Academic). The ‘fix’ comment refers to the storage of preferentially 16O-enriched precipitationin ice sheets and groundwater, which constitutes a preferential removal of 16O from the oceans and thus a relative 18O-enrichment in the oceans.
916 PALEOCEANOGRAPHY, PHYSICAL AND CHEMICAL PROXIES | Oxygen Isotope Composition of Seawater
Author's personal copy
Encyclopedia of Quaternary Science, (2013), vol. 2, pp. 915-922

of precipitation formed in equilibrium with the atmosphericvapor is found according to d18OP"d18OAV!103 ln a. Fromthese relationships, which represent a basic Rayleigh distilla-tion process, it is immediately obvious that the first precipi-tation will be of a similar isotopic composition as the originalseawater, and that a longer pathway from the source region(and consequently more rain-out) causes atmospheric vaporto become more and more depleted. New precipitation fromthis vapor reflects this depletion (Figure 2). As a result,precipitation is significantly more depleted at high latitudesthan in the tropics (reaching values as low as "57% inAntarctica).
The magnitude of rain-out is strongly temperature depen-dent. As atmospheric vapor is transported toward colderregions, it experiences successive condensations. This effect –rather than temperature dependence of the fractionation factor –determines a basic quasilinear relationship of 0.69% 'C"1
between d18O of precipitation and temperature, as has beenobserved for temperatures between "40 and $15 'C. Above15 'C, this relationship with temperature breaks down.There, mainly in areas with strong convection in the atmo-sphere, the so-called amount effect dominates. This effectapproximately determines 1.5% depletion in the d18O ofprecipitation for every 100 mm increase in rainfall.
The changes in oxygen-isotope composition of atmosphericvapor and precipitation affect surface waters in the world’soceans through addition of freshwater via precipitation directlyonto the sea surface or via runoff. Arid, evaporative areasdemonstrate the evaporative surface water d18O enrichment.Regions in reasonable proximity to a river mouth will beaffected by the volumetrically weighted average isotopic com-position of precipitation over the river’s catchment area. A
high-latitude river system imports freshwater with generallylower d18O values than those of a low latitude river – forexample, the average (pre-Aswan dam) Nile river d18O compo-sition was near "2%, whereas the Arctic McKenzie river dis-charges waters with a composition around "20%.
Two crucial ‘delayed’ responses need to be taken into ac-count. Both result from long-term storage of precipitation.Besides runoff from rivers, icebergs calving from continentalice sheets also provide a source of ‘continental’ freshwater.Icebergs import into the ocean a ‘fossil’ isotopic signaturedepending on the age of the calving ice. Since ice cores in theGreenland and Antarctic Ice Sheets penetrate ice aged well over100000 years, and (in Antarctica) even reach 900000 years,the isotopic signatures of bergs shed by those ice sheets shouldnot be considered as a result of the present-day freshwatercycle. Similarly, but much less importantly, fossil waters mayaccumulate in aquifers and at a much later stage contribute toriver discharge into the oceans, thus causing deviations fromthe isotopic compositions of rivers expected from precipitationin the catchment basin. Fossil ground waters may be as old as35000 years.
Long-Term ‘Storage’: Glacial Ice Volume
Apart from delayed return of ‘fossil’ isotopic signals back intothe ocean, long-term storage systems, such as glacial ice sheetsand – to a much lesser extent – major aquifers, may also affectthe global d18O balance. Because the timescales of storage (onthe order of 104–105 years) exceed those of ocean ventilation(on the order of 103 years), the modification of ocean waterd18O due to these storage effects will be mixed throughout theocean and, therefore, will be manifest both at the surface and atdepth.
The main influence is related to the volume of glacial icesheets. These are built up by high latitude precipitation(snow) at very low temperatures toward the end of the Ray-leigh distillation process (Figure 1), and so record extremelylight d18O values (Figure 2). This preferential sequestration of16O in ice sheets leaves the oceans relatively enriched in 18O.At the same time, build-up of ice volume lowers global sealevel. Research on d18O changes in fossil carbonate, comple-mented by accurate constraints on sea level changes fromfossil coral reef studies, suggests that the relationship betweensea level lowering and mean oceanic d18O enrichment approx-imates 0.012(0.001%m"1. Work on d18O values of actualglacial waters, trapped as pore water in marine sediments, hasrevised this relationship to about 0.010(0.001%m"1 (seethe Section ‘Processes Controlling Oxygen Isotope Ratios inSeawater’).
The above relationships provide a sound workingmodel fora time with a well-matured ice sheet, but it should be notedthat the processes behind it may invoke a more nonlinearrelationship for growing or recently matured ice sheets. Icesheets go through a cycle of growth (young), equilibrium(mature), and decay. Mature ice sheets are mass balanced: iceaccumulates at the surface, then flows from the surface to thebottom and out to the edges, where it is shed through icebergcalving and/or melting. Precipitation reaching the summit of arecently ‘matured’ ice sheet may therefore be significantly moredepleted in d18O than that lost from the edges at the same time,
100 90 80 70 60 50 40 30 20 10 0Fraction of atmospheric vapor remaining (%)
-60.0
-50.0
-40.0
-30.0
-20.0
-10.0
0.0
Oxy
gen
isot
ope
valu
e (p
er m
il)
Condensate(precipitation)
Remainingatmosphericvapor
Initial value atevaporation
Seawatercomposition
Figure 2 The relationships between isotopic composition ofatmospheric vapor and precipitation relative to evaporation with anoriginal composition of "10% and fractionation at a constanttemperature of 15 'C. Reproduced from Rohling EJ and Cooke S (1999)Stable oxygen and carbon isotope ratios in foraminiferal carbonate.In: Sen Gupta BK (ed.) Modern Foraminifera, pp. 239–258. Dordrecht,The Netherlands: Kluwer Academic.
PALEOCEANOGRAPHY, PHYSICAL AND CHEMICAL PROXIES | Oxygen Isotope Composition of Seawater 917
Author's personal copy
Encyclopedia of Quaternary Science, (2013), vol. 2, pp. 915-922

which concerns ice deposited when the ice sheet was much‘younger’ (smaller/lower with higher temperatures than overthe mature ice sheet). Therefore, an ice sheet may be massbalanced, but not yet isotopically balanced. After a significantlag (>104 years), the ice reaching the edges will be that built upon a mature ice sheet, and the isotopic composition of accu-mulating and calving ice will be more or less the same; onlythen will the ice sheet have reached isotopic balance.
Sea Ice Freezing and Melting
The d18O of newly formed sea ice is 2.57(0.10% enrichedrelative to that of seawater. Although this is a small offsetcompared with the massive salinity difference between sea-water (S usually >30 p.s.u.) and sea ice (S<20 p.s.u.), theisotopic difference still imposes a major seasonal fluctuationassociated with sea ice formation and melting. It is tempting toassume that such seasonal influences would cancel out in thelong term, but increases in surface water salinity due to salt(brine) rejection when sea ice is formed may lead to convec-tion and transport of existing surface waters into the oceaninterior. The removed surface waters would be replaced bysurface waters that were not (as much) affected by freezingprocesses, and when the sea ice subsequently melts the isotopiceffect would not cancel out. The ‘brine rejection’ influence ofsea ice formation can thus lead to significant regional verticaland horizontal d18O anomalies.
Advection and Diffusion
Advection and mixing of water masses from different sourceareas strongly affect the basic d18O composition observed atany site. Each ‘source area’ concerns a basin or region – whichmay be very remote from the study site – where surface watersare ‘imprinted’ with a certain d18O composition, through ac-tion of the freshwater cycle, freezing/melting of sea ice, etc.This ‘preset’ isotopic composition may be considered as avirtually conservative property for the newly formed water
mass, as long as this water mass does not come into contactwith other sinks or sources of d18O, notably the freshwatercycle. In practice, therefore, d18Omay be used as a conservativetracer for transport (advection) and mixing of water masses inthe subsurface ocean.
Amixing end product receives a d18O composition resultingfrom the volumetrically weighted averaged d18O compositionsof its components: d18Oend product!(A d18OA$B d18OB$Cd18OC)/(A$B$C) where A, B, and C are the volumes ofthree mixing components and d18OA, d18OB, and d18OC aretheir isotopic compositions, respectively. Any change in rela-tive proportions or the individual ‘preset’ isotopic composi-tions of the various mixing components would, therefore,affect the isotopic composition of the mixing end product.Any change in isotopic composition must therefore be viewedwithin the broader context of water mass formation and mix-ing on ocean-wide scales, and should not be purely ascribed tolocal changes in surface forcing (e.g., freshwater budget). It hasbeen found that these hitherto ‘ignored’ processes may beparticularly important for the global d18O distribution duringtimes with comprehensively rearranged ocean circulation (e.g.,glacial periods).
Global Seawater d18O Distribution
The combined processes listed above result in a global seawaterd18O distribution. A current collection exists of over 20000seawater d18Omeasurements made since about 1950 (Schmidtet al., 1999). The date of that reference refers to the originalappearance date, based on compilations made for two publi-cations (Bigg and Rohling, 2000; Schmidt et al., 1999), but thedatabase is current up to the present. From that database,Figure 3 shows the integrated surface ocean (top 50 m) d18Ofield interpolated onto a 4º#5º grid. Data are registered fromall depths and are accompanied by a variety of other oceano-graphic measurements, most notably salinity. A diverse seriesof search modes allows extraction of data from the databaseaccording to specific research needs.
Global surface seawater d18O v1.21
-6.9 -4.5 -4 -3.5 -3 -2.5 -2 -1.5 -1 -.5 0 .5 1 1.5 2
Figure 3 Example of output from the Schmidt et al. (1999) global sea water d18O database (extracted 13 January 2012). The image shows surfacewater d18O integrated over the top 50 m on a 4#5' grid.
918 PALEOCEANOGRAPHY, PHYSICAL AND CHEMICAL PROXIES | Oxygen Isotope Composition of Seawater
Author's personal copy
Encyclopedia of Quaternary Science, (2013), vol. 2, pp. 915-922

Oxygen Isotope Ratios in Seawaters of the Quaternary
Oxygen isotope ratios in seawater have changed considerablyin the geological past. Apart from regional and short-termtemporal variability, there have been fluctuations on globalscales and of long ()104 years) duration. These global-scaleand long-duration fluctuations were mostly associated withchanges in continental ice volume. In this section, it is dis-cussed how we know of such past d18O variations.
Seawater d18O Inferred from Measurements on FossilCarbonates
By far the most common manner to evaluate past changes inseawater d18O is via an indirect method, which starts with theanalysis of d18O in fossil carbonates – mostly the shells ofunicellular zooplankton (Foraminifera). The stable isotopesof oxygen (and carbon) in carbonates are analyzed by massspectrometric determination of the mass ratios of carbondioxide (CO2) obtained from the sample, with reference toa standard carbon dioxide of known composition. The CO2
is produced by reaction of the carbonate with phosphoricacid: CaCO3$H3PO4,CaHPO4$CO2$H2O. The d18O ofcarbonates is not measured against the VSMOW standard butagainst the Vienna Pee Dee Belemnite (VPDB) standard. TheVPDB and VSMOW scales relate to one another according tod18OVSMOW!1.03092 d18OVPDB$30.92.
There are several processes that determine the oxygen iso-tope composition of newly formed foraminiferal carbonate.Firstly, equilibrium fractionations between water and thevarious carbonate species (CaCO3, H2CO3, HCO3
", CO32")
determine an important temperature influence on the d18O offoraminiferal carbonate. Secondly, there are considerablekinetic effects, notably as the shell growth-rate changesthrough the organism’s life cycle. To minimize the influenceof kinetic effects, often grouped under the name ‘vital effects,’analytical strategies have been designed that focus on timeseries of single species (to avoid vital effect differences betweenspecies), and that use very narrow size windows from whichspecimens are picked for analysis (to minimize changes in thevital effects with growth). There are other, currently lesswell-constrained influences, such as the concentration of thecarbonate ion (CO3
2"). Stable isotope ratios in carbonate arediscussed in a separate chapter, and the present discussion isrestricted to equilibrium fractionation between water andcarbonate, which holds important clues regarding the way wecan determine past seawater d18O changes.
The overall reaction involved in the precipitation of carbon-ate is: Ca2$$2HCO3
",CaCO3$CO2$H2O. Where oxygenis concerned, the various carbonate species in seawater, includ-ing the predominant bicarbonate (HCO3
") ion, are isotopi-cally equilibrated with the water (H2O) molecules. The overallequilibrium fractionation between calcite and water is a func-tion of temperature. For the range of 0–500 'C, O’Neil et al.(1969) determined that the equilibrium fractionation factorac " w between calcite and water (ac"w) changes with temper-ature according to: ac"w!exp{(2.78 T"2)#103–3.39#10"3}where T is in Kelvin. Other workers have reported slightlydifferent equations, for example, with the last coefficient at
2.89#10"3 rather than 3.39#10"3. The summary effect ofequilibrium fractionation is a roughly 0.2% depletion incarbonate d18O for every 1 'C temperature increase, althoughKim and O’Neil (1997) presented a more detailed relationshipwhere the d18O change with temperature is more pronouncedat low temperatures (up to 0.25% 'C"1) than at higher tem-peratures (around 0.2% 'C"1).
A first observation to be made regarding planktonicForaminifera is that several species may inhabit differentdepths at different stages of their life cycle. Since temperaturedecreases with increasing depth in the surface oceans, verticalmigrations influence equilibrium fractionation. This again is aproblem that can be circumvented by analytical strategy; timeseries of data are considered for single species in very narrowsize windows, so the habitat-depth effect should be similar forall and thus will not affect the inferred variability sea waterd18O over time.
Simplified, therefore, a time series of d18O analyzed fromfossil planktonic Foraminifera in a sediment core is dominatedby two main variables: temperature variability and seawaterd18O variability. The temperature changes can be ‘corrected for’using other methods for estimating past seawater temperatures(e.g., Mg/Ca ratios in the foraminiferal carbonate, organicgeochemical biomarker ratios, or statistical transforms ofmicrofossil abundance variations). This then allows the esti-mation of past changes in seawater d18O.
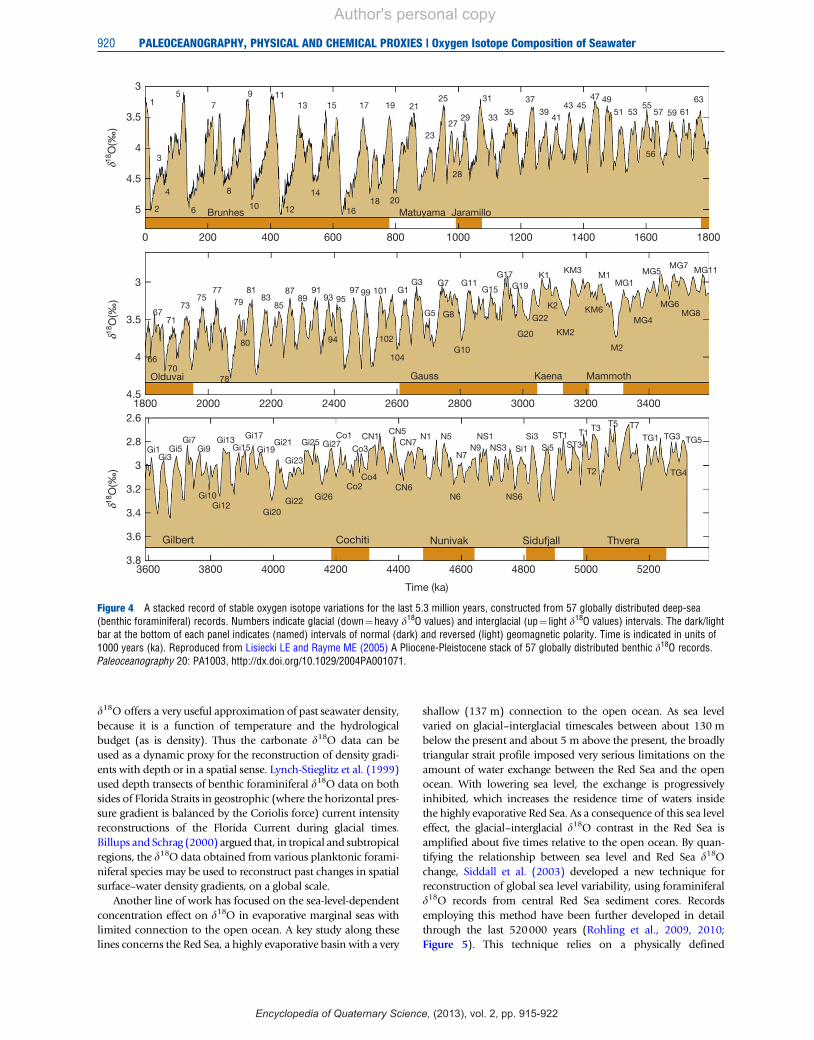
Time series of foraminiferal d18O and – by implication –seawater d18O illustrate that glacial ice volume has variedstrongly over the last 2 million years, a period known on thegeological timescale to fall within the Quaternary. Duringthe last 400000 years, the main variability can be seen as arough sawtooth pattern with a 100000-year rhythm of glacial–interglacial cycles, which is mainly related to global ice volumefluctuations (Figure 4). Ice sheets grew spasmodically overperiods of roughly 90000 years, reaching a maximum extentthat was followed by a very abrupt ice volume reductionheralding the onset of an interglacial maximum with a typicalmean duration of some 10000 years. Between 0.4 and1 million years ago, there was a less well-defined state, with acomplex interplay between main periods of 100000 and41000 years for the glacial cycles. Prior to 1 million years ago(especially in the interval between 2.5 and 1million years ago),the glacial cycles followed a well-developed 41000-yearperiod, and in that period the glacial cycles did not have aconspicuously sawtoothed temporal structure (Figure 4). Fol-lowing calibration with dated fossil coral reefs, the past d18Ofluctuations were found to indicate that global ice volumehas waxed and waned so much that global sea level variationsoccurred between 140 m below and 5–10 m above the present-day level. For the last glacial cycle, such studies suggested arelationship between sea level lowering and mean oceanicd18O enrichment in the region of 0.012(0.001%m"1.
Other Uses of Foraminifer-Based d18O in Paleoceanography
There have been recent forays into alternative uses of forami-niferal carbonate-based d18O that avoid the complicationsinvolved in deconvolving the carbonate d18O data in termsof past temperature and seawater d18O. These studies havefocused instead on the fact that, in specific settings, carbonate
PALEOCEANOGRAPHY, PHYSICAL AND CHEMICAL PROXIES | Oxygen Isotope Composition of Seawater 919
Author's personal copy
Encyclopedia of Quaternary Science, (2013), vol. 2, pp. 915-922
d18O offers a very useful approximation of past seawater density,because it is a function of temperature and the hydrologicalbudget (as is density). Thus the carbonate d18O data can beused as a dynamic proxy for the reconstruction of density gradi-ents with depth or in a spatial sense. Lynch-Stieglitz et al. (1999)used depth transects of benthic foraminiferal d18O data on bothsides of Florida Straits in geostrophic (where the horizontal pres-sure gradient is balanced by the Coriolis force) current intensityreconstructions of the Florida Current during glacial times.Billups and Schrag (2000) argued that, in tropical and subtropicalregions, the d18O data obtained from various planktonic forami-niferal species may be used to reconstruct past changes in spatialsurface–water density gradients, on a global scale.
Another line of work has focused on the sea-level-dependentconcentration effect on d18O in evaporative marginal seas withlimited connection to the open ocean. A key study along theselines concerns the Red Sea, a highly evaporative basin with a very
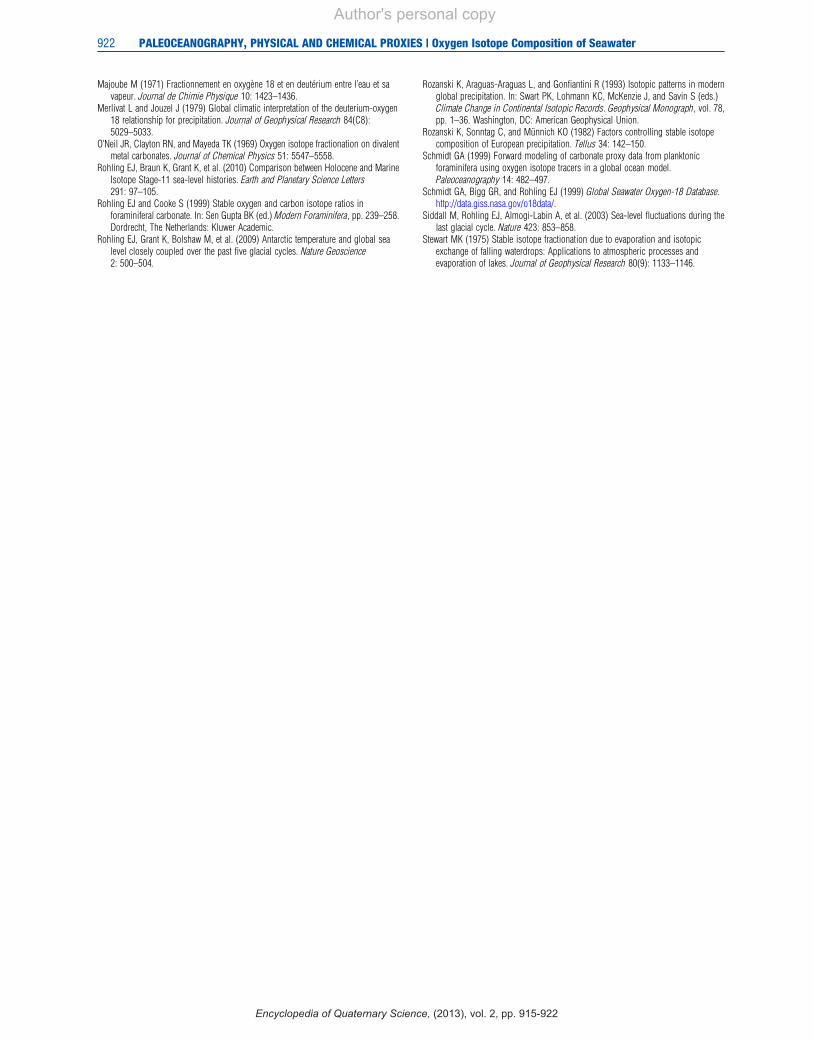
shallow (137 m) connection to the open ocean. As sea levelvaried on glacial–interglacial timescales between about 130 mbelow the present and about 5 m above the present, the broadlytriangular strait profile imposed very serious limitations on theamount of water exchange between the Red Sea and the openocean. With lowering sea level, the exchange is progressivelyinhibited, which increases the residence time of waters insidethe highly evaporative Red Sea. As a consequence of this sea leveleffect, the glacial–interglacial d18O contrast in the Red Sea isamplified about five times relative to the open ocean. By quan-tifying the relationship between sea level and Red Sea d18Ochange, Siddall et al. (2003) developed a new technique forreconstruction of global sea level variability, using foraminiferald18O records from central Red Sea sediment cores. Recordsemploying this method have been further developed in detailthrough the last 520000 years (Rohling et al., 2009, 2010;Figure 5). This technique relies on a physically defined
Time (ka)
36003.8
3.6
3.4
3.2
3
2.8
2.6
4.5
4
3.5
3
3800
d18O
(‰)
d18O
(‰)
d18O
(‰)
Gilbert Cochiti Nunivak Sidufjall Thvera
Gi10Gi12
Gi20Gi22 Gi26
Gi27Gi25
Gi23
Gi21Gi19
Gi17Gi15Gi9
Olduvai
Brunhes Matuyama Jaramillo
7078
80 94 102
104G10
Gauss Kaena Mammoth
7981
8385
8789
9193 95
97 99 101 G1G3
G5
G7 G11G15
G17G19
G20
G22
K1
K2
KM3
KM2
KM6
M1
M2
MG1
MG4
MG5
MG6
MG7
MG8
MG11
G8
7775
73
7167
66
Gi7Gi5
Gi3Gi1
Gi13
Co2Co4
Co3
Co1
CN6
CN7CN5CN1
N6 NS6
T2
ST1ST3
Si3Si5Si1
NS1NS3N9
N7
N5N1 T1
TG4
TG1T7T5T3
TG3 TG5
4000 4200 4400 4600 4800 5000 5200
1800
0
5 2
4
6
8
10 12
14
1618 20
28
3941
3735
33
31
2927
2519171513
1197
5
3
1 21
23
43 4547 49
51 5355
57
56
59 6163
4.5
4
3.5
3
200 400 600 800 1000 1200 1400 1600 1800
2000 2200 2400 2600 2800 3000 3200 3400
Figure 4 A stacked record of stable oxygen isotope variations for the last 5.3 million years, constructed from 57 globally distributed deep-sea(benthic foraminiferal) records. Numbers indicate glacial (down!heavy d18O values) and interglacial (up! light d18O values) intervals. The dark/lightbar at the bottom of each panel indicates (named) intervals of normal (dark) and reversed (light) geomagnetic polarity. Time is indicated in units of1000 years (ka). Reproduced from Lisiecki LE and Rayme ME (2005) A Pliocene-Pleistocene stack of 57 globally distributed benthic d18O records.Paleoceanography 20: PA1003, http://dx.doi.org/10.1029/2004PA001071.
920 PALEOCEANOGRAPHY, PHYSICAL AND CHEMICAL PROXIES | Oxygen Isotope Composition of Seawater
Author's personal copy
Encyclopedia of Quaternary Science, (2013), vol. 2, pp. 915-922

relationship between Red Sea d18O and sea level in the strait andis therefore fundamentally different in approach and sensitivityto the global deep-sea d18O records shown in Figure 4.
‘Direct’ Measurement of Past Seawater
Recent work has introduced significant new insight into thehistory of seawater d18O. Adkins et al. (2002) measured d18Oprofiles for pore waters extracted from marine sediment cores.The pore water profile reflects the past bottom water d18Oconditions, subject to advective and diffusive processes withinthe sediment, and the Last Glacial Maximum (*20000 yearsago) stands out as the interval with highest d18O values (i.e.,maximum ice volume). Hence the actual Last GlacialMaximumbottom water d18O was determined from sediment cores for avariety of sites around the world, from a range of different waterdepths. The sea level difference between the Last Glacial Maxi-mum and the present was taken from other analyses, andoverall, this study suggests that the actual relationship betweensea level lowering and mean oceanic d18O enrichment is closerto 0.010(0.001%m"1. This indicates that the steeper relation-ship previously derived from carbonate-based d18O changeslikely contained some residual temperature effects (i.e., glacialdeep-water temperatures were colder than was assumed).
See also: K/Ar and 40Ar/39Ar Dating. Paleoceanography, Physicaland Chemical Proxies: Oxygen-Isotope Stratigraphy of the Oceans.Quaternary Stratigraphy: Overview.
References
Adkins JF, McIntyre K, and Schrag DP (2002) The salinity, temperature and d18O of theglacial deep ocean. Science 298: 1769–1773.
Bigg GR and Rohling EJ (2000) An oxygen isotope data set for marine water. Journal ofGeophysical Research 105: 8527–8535.
Billups K and Schrag DP (2000) Surface ocean density gradients during the last glacialmaximum. Paleoceanography 15: 110–123.
Craig H and Gordon LI (1965) Isotope oceanography: Deuterium and oxygen 18variations in the ocean and the marine atmosphere. Symposium onMarine Geochemistry, pp. 277–374. University of Rhode Island OccasionalPublications 3.
Dansgaard W (1964) Stable isotopes in precipitation. Tellus 16: 436–468.Garlick GD (1974) The stable isotopes of oxygen, carbon, hydrogen in the marine
environment. In: Goldberg ED (ed.) The Sea, vol. 5, pp. 393–425. New York: Wiley.Gonfiantini R (1986) Environmental isotopes in lake studies. In: Fritz P and Fontes JC
(eds.) Handbook of Environmental Isotope Geochemistry, vol. 2, pp. 113–168.Amsterdam: Elsevier.
Hoefs J (1997) Stable Isotope Geochemistry, 4th edn. Berlin: Springer-Verlag.Hoffmann G and Heimann M (1997) Water isotope modeling in the Asian monsoon
region. Quaternary International 37: 115–128.Joussaume S and Jouzel J (1993) Paleoclimatic tracers: An investigation using an
atmospheric general circulation model under ice age conditions, 2. Water isotopes.Journal of Geophysical Research 98(D2): 2807–2830.
Jouzel J, Masson-Delmotte V, Cattani O, et al. (2007) Orbital and millennial Antarcticclimate variability over the past 800,000 years. Science 317: 793–796.
Jouzel J, Merlivat L, and Roth E (1975) Isotopic study of hail. Journal of GeophysicalResearch 80: 5015–5030.
Kim ST and O’Neil JR (1997) Equilibrium and nonequilibrium oxygen isotope effects insynthetic calcites. Geochimica et Cosmochimica Acta 61: 3461–3475.
Lisiecki LE and Rayme ME (2005) A Pliocene-Pleistocene stack of 57 globallydistributed benthic d18O records. Paleoceanography 20: PA1003. http://dx.doi.org/10.1029/2004PA001071.
Lynch-Stieglitz J, Curry BC, and Slowey N (1999) A geostrophic transport estimate forthe Florida Current from the oxygen isotope composition of benthic foraminifera.Paleoceanography 14: 360–373.
Age (a)(b)
(a)
0 50 000
RS
L (m
)
100 000 150 000 200 000 250 000 300 000 350 000 400 000 450 000 500 000 550 000
0
40
0
-120
-80
-40
RS
L (m
)
40
0
-120
-80
-40
50 000 100 000 150 000 200 000 250 000 300 000 350 000 400 000 450 000 500 000 550 000
Figure 5 Sea level reconstruction from the Red Sea method (Rohling et al., 2009). Gray dots are individual values; blue line is a smoothing function sothat individual data are spread around it a normal distribution with 1s!6 m, which is the method’s realistic uncertainty (Siddall et al., 2003). Greensymbols denote benchmark data from U–Th dated corals and submerged speleothems. Panel (a) shows the record on its initial chronology, based ongraphical correlation with the Antarctic EPICA Dome C temperature anomaly record (Jouzel et al., 2007). Panel (b) shows the record after a systematicadjustment of"4 ka, based on the offset seen in (a) between the Red Sea sea level record and the radiometrically dated points during the last deglaciation(19–8 ka) (Rohling et al., 2010). This brought midpoint ages for interglacials in the Red Sea record within 1.5% of the midpoint ages from radiometricdatings (Rohling et al., 2010). Although a good match was obtained on glacial–interglacial timescales, further improvements to the chronology remainneeded on shorter timescales. Data available from the DATA link with Rohling et al. (2010) at http://www.highstand.org/erohling/ejrhome.htm.
PALEOCEANOGRAPHY, PHYSICAL AND CHEMICAL PROXIES | Oxygen Isotope Composition of Seawater 921
Author's personal copy
Encyclopedia of Quaternary Science, (2013), vol. 2, pp. 915-922
Majoube M (1971) Fractionnement en oxygene 18 et en deuterium entre l’eau et savapeur. Journal de Chimie Physique 10: 1423–1436.
Merlivat L and Jouzel J (1979) Global climatic interpretation of the deuterium-oxygen18 relationship for precipitation. Journal of Geophysical Research 84(C8):5029–5033.
O’Neil JR, Clayton RN, and Mayeda TK (1969) Oxygen isotope fractionation on divalentmetal carbonates. Journal of Chemical Physics 51: 5547–5558.
Rohling EJ, Braun K, Grant K, et al. (2010) Comparison between Holocene and MarineIsotope Stage-11 sea-level histories. Earth and Planetary Science Letters291: 97–105.
Rohling EJ and Cooke S (1999) Stable oxygen and carbon isotope ratios inforaminiferal carbonate. In: Sen Gupta BK (ed.) Modern Foraminifera, pp. 239–258.Dordrecht, The Netherlands: Kluwer Academic.
Rohling EJ, Grant K, Bolshaw M, et al. (2009) Antarctic temperature and global sealevel closely coupled over the past five glacial cycles. Nature Geoscience2: 500–504.
Rozanski K, Araguas-Araguas L, and Gonfiantini R (1993) Isotopic patterns in modernglobal precipitation. In: Swart PK, Lohmann KC, McKenzie J, and Savin S (eds.)Climate Change in Continental Isotopic Records. Geophysical Monograph, vol. 78,pp. 1–36. Washington, DC: American Geophysical Union.
Rozanski K, Sonntag C, and Munnich KO (1982) Factors controlling stable isotopecomposition of European precipitation. Tellus 34: 142–150.
Schmidt GA (1999) Forward modeling of carbonate proxy data from planktonicforaminifera using oxygen isotope tracers in a global ocean model.Paleoceanography 14: 482–497.
Schmidt GA, Bigg GR, and Rohling EJ (1999) Global Seawater Oxygen-18 Database.http://data.giss.nasa.gov/o18data/.
Siddall M, Rohling EJ, Almogi-Labin A, et al. (2003) Sea-level fluctuations during thelast glacial cycle. Nature 423: 853–858.
Stewart MK (1975) Stable isotope fractionation due to evaporation and isotopicexchange of falling waterdrops: Applications to atmospheric processes andevaporation of lakes. Journal of Geophysical Research 80(9): 1133–1146.
922 PALEOCEANOGRAPHY, PHYSICAL AND CHEMICAL PROXIES | Oxygen Isotope Composition of Seawater
Author's personal copy
Encyclopedia of Quaternary Science, (2013), vol. 2, pp. 915-922