Oxygen Isotope Analysis Sampling and Pretreatment of Tooth ...
15
Journal of Visualized Experiments www.jove.com Copyright © 2018 Journal of Visualized Experiments August 2018 | 138 | e58002 | Page 1 of 15 Video Article Sampling and Pretreatment of Tooth Enamel Carbonate for Stable Carbon and Oxygen Isotope Analysis Alicia Ventresca Miller 1 , Ricardo Fernandes 1,2 , Anneke Janzen 1 , Ayushi Nayak 1 , Jillian Swift 1 , Jana Zech 1 , Nicole Boivin 1 , Patrick Roberts 1 1 Max Planck Institute for the Science of Human History 2 School of Archaeology, University of Oxford Correspondence to: Alicia Ventresca Miller at [email protected] URL: https://www.jove.com/video/58002 DOI: doi:10.3791/58002 Keywords: Biochemistry, Issue 138, Stable isotope analysis, archaeological science, paleoenvironment, paleodiet, prehistory, enamel carbonate Date Published: 8/15/2018 Citation: Ventresca Miller, A., Fernandes, R., Janzen, A., Nayak, A., Swift, J., Zech, J., Boivin, N., Roberts, P. Sampling and Pretreatment of Tooth Enamel Carbonate for Stable Carbon and Oxygen Isotope Analysis. J. Vis. Exp. (138), e58002, doi:10.3791/58002 (2018). Abstract Stable carbon and oxygen isotope analysis of human and animal tooth enamel carbonate has been applied in paleodietary, paleoecological, and paleoenvironmental research from recent historical periods back to over 10 million years ago. Bulk approaches provide a representative sample for the period of enamel mineralization, while sequential samples within a tooth can track dietary and environmental changes during this period. While these methodologies have been widely applied and described in archaeology, ecology, and paleontology, there have been no explicit guidelines to aid in the selection of necessary lab equipment and to thoroughly describe detailed laboratory sampling and protocols. In this article, we document textually and visually, the entire process from sampling through pretreatment and diagenetic screening to make the methodology more widely available to researchers considering its application in a variety of laboratory settings. Video Link The video component of this article can be found at https://www.jove.com/video/58002/ Introduction Stable carbon and oxygen isotope analyses of tooth enamel carbonate has been used to study past human dietary intake, weaning, and mobility, as well as faunal reliance on vegetation, the movement of animals, and livestock foddering. These applications have been comprehensively discussed and reviewed for a variety of environmental conditions indicating the effects of local aridity, temperature, water sources, and vegetation compositions 1,2,3,4,5,6 . The diversity of potential applications in archaeology and paleontology, as well as the good preservation of tooth enamel carbonate, has made it an attractive material for stable isotope work 3 . Methods of sampling, pretreatment, and diagenesis screening are briefly described in a number of previous publications 1,7 . However, thorough verbal and visual demonstrations remain largely unavailable, particularly to people outside of archaeological science laboratories and among laboratory groups with limited funding where the interest in the use of this technique is increasing 5 . Tooth enamel is primarily made up of hydroxyapatite (bioapatite) crystallites 8 larger than those in bone, making it more resistant to post-mortem diagenetic ionic substitutions and contamination 3 . Modern studies have demonstrated that stable carbon isotope (δ 13 C) measurements of faunal tooth enamel reliably record animal diet and behavior 9,10 . The stable oxygen isotope (δ 18 O) value of tooth enamel is determined by the oxygen isotopic composition of ingested water, which includes water in plant and animal foods, drinking water, respiration, as well as various environmental impacts on the water which can lead to further isotopic fractionation (e.g., aridity, temperature, altitude, rainfall amount, continental location) 11 . This has made it a popular method for dietary and environmental reconstruction in archeological, paleoecological, and paleontological research. The period of tooth enamel formation is relatively short (years) and differs depending on the tooth being sampled. For humans, first molar enamel mineralizes between birth and 3 years of age, premolars mineralize between 1.5 and 7 years of age, second molars mineralize between 2.5 and 8 years of age, and third molars mineralize during adolescence, between 7 and 16 years 12 . Given that tooth enamel forms incrementally over its period of formation, it can be sampled in bulk along the entire growth axis or sampled sequentially in order to investigate the changes in diet and environment that have occurred during the formation period 13 . Chronologically-ordered dietary change within a given tooth is observable for humans and other animals 1,14 , providing information regarding inter-annual seasonal and dietary variation. While enamel is usually resistant to diagenesis, isotopic modifications resulting from the burial environment are possible and have been observed 15,16 , making experimental checks and pretreatment choices useful. While it is not the only available method, Fourier transform infrared spectroscopy (FTIR), particularly in Attenuated Transmission Mode, has emerged as a quick, inexpensive, and relatively accessible method for assessing taphonomic alteration in tooth enamel, particularly in paleontological contexts 17,18,19,20 . However, detailed protocols and recording standards remain relatively inaccessible to many people outside the fields of geochemistry or material science.
Transcript of Oxygen Isotope Analysis Sampling and Pretreatment of Tooth ...

Journal of Visualized Experiments www.jove.com
Copyright © 2018 Journal of Visualized Experiments August 2018 | 138 | e58002 | Page 1 of 15
Video Article
Sampling and Pretreatment of Tooth Enamel Carbonate for Stable Carbon andOxygen Isotope AnalysisAlicia Ventresca Miller1, Ricardo Fernandes1,2, Anneke Janzen1, Ayushi Nayak1, Jillian Swift1, Jana Zech1, Nicole Boivin1, Patrick Roberts1
1Max Planck Institute for the Science of Human History2School of Archaeology, University of Oxford
Correspondence to: Alicia Ventresca Miller at [email protected]
URL: https://www.jove.com/video/58002DOI: doi:10.3791/58002
Keywords: Biochemistry, Issue 138, Stable isotope analysis, archaeological science, paleoenvironment, paleodiet, prehistory, enamel carbonate
Date Published: 8/15/2018
Citation: Ventresca Miller, A., Fernandes, R., Janzen, A., Nayak, A., Swift, J., Zech, J., Boivin, N., Roberts, P. Sampling and Pretreatment of ToothEnamel Carbonate for Stable Carbon and Oxygen Isotope Analysis. J. Vis. Exp. (138), e58002, doi:10.3791/58002 (2018).
Abstract
Stable carbon and oxygen isotope analysis of human and animal tooth enamel carbonate has been applied in paleodietary, paleoecological,and paleoenvironmental research from recent historical periods back to over 10 million years ago. Bulk approaches provide a representativesample for the period of enamel mineralization, while sequential samples within a tooth can track dietary and environmental changes duringthis period. While these methodologies have been widely applied and described in archaeology, ecology, and paleontology, there have been noexplicit guidelines to aid in the selection of necessary lab equipment and to thoroughly describe detailed laboratory sampling and protocols. Inthis article, we document textually and visually, the entire process from sampling through pretreatment and diagenetic screening to make themethodology more widely available to researchers considering its application in a variety of laboratory settings.
Video Link
The video component of this article can be found at https://www.jove.com/video/58002/
Introduction
Stable carbon and oxygen isotope analyses of tooth enamel carbonate has been used to study past human dietary intake, weaning, and mobility,as well as faunal reliance on vegetation, the movement of animals, and livestock foddering. These applications have been comprehensivelydiscussed and reviewed for a variety of environmental conditions indicating the effects of local aridity, temperature, water sources, andvegetation compositions1,2,3,4,5,6. The diversity of potential applications in archaeology and paleontology, as well as the good preservation of toothenamel carbonate, has made it an attractive material for stable isotope work3. Methods of sampling, pretreatment, and diagenesis screeningare briefly described in a number of previous publications1,7. However, thorough verbal and visual demonstrations remain largely unavailable,particularly to people outside of archaeological science laboratories and among laboratory groups with limited funding where the interest in theuse of this technique is increasing5.
Tooth enamel is primarily made up of hydroxyapatite (bioapatite) crystallites8 larger than those in bone, making it more resistant to post-mortemdiagenetic ionic substitutions and contamination3. Modern studies have demonstrated that stable carbon isotope (δ13C) measurements offaunal tooth enamel reliably record animal diet and behavior9,10. The stable oxygen isotope (δ18O) value of tooth enamel is determined bythe oxygen isotopic composition of ingested water, which includes water in plant and animal foods, drinking water, respiration, as well asvarious environmental impacts on the water which can lead to further isotopic fractionation (e.g., aridity, temperature, altitude, rainfall amount,continental location)11. This has made it a popular method for dietary and environmental reconstruction in archeological, paleoecological, andpaleontological research.
The period of tooth enamel formation is relatively short (years) and differs depending on the tooth being sampled. For humans, first molar enamelmineralizes between birth and 3 years of age, premolars mineralize between 1.5 and 7 years of age, second molars mineralize between 2.5 and8 years of age, and third molars mineralize during adolescence, between 7 and 16 years12. Given that tooth enamel forms incrementally overits period of formation, it can be sampled in bulk along the entire growth axis or sampled sequentially in order to investigate the changes in dietand environment that have occurred during the formation period13. Chronologically-ordered dietary change within a given tooth is observable forhumans and other animals1,14, providing information regarding inter-annual seasonal and dietary variation.
While enamel is usually resistant to diagenesis, isotopic modifications resulting from the burial environment are possible and have beenobserved15,16, making experimental checks and pretreatment choices useful. While it is not the only available method, Fourier transform infraredspectroscopy (FTIR), particularly in Attenuated Transmission Mode, has emerged as a quick, inexpensive, and relatively accessible method forassessing taphonomic alteration in tooth enamel, particularly in paleontological contexts17,18,19,20. However, detailed protocols and recordingstandards remain relatively inaccessible to many people outside the fields of geochemistry or material science.

Journal of Visualized Experiments www.jove.com
Copyright © 2018 Journal of Visualized Experiments August 2018 | 138 | e58002 | Page 2 of 15
Reaction times and the chemicals employed by researchers in the pretreatment of tooth enamel also vary considerably in the literature, oftenwith limited consideration as to what this variability may do to stable carbon and oxygen isotope values of the sample21,22. Here, we report anapproach that uses dilute acetic acid (0.1 M) for the pretreatment of enamel powder samples. However, given that the differences in isotopicmeasurements resulting from pretreatment are relatively minor for tooth enamel, it is best for the researchers to follow the protocols for datasetswith which they wish to compare their data to11. Furthermore, where small sequential samples are taken, particularly on Holocene samples, nopretreatment may be chosen (following pilot diagenetic tests) to avoid sample wastage.
Although the methods we report here are by no means new, to our knowledge, this is the first time that a thorough written and visualdocumentation of bulk and sequential sampling, pretreatment choices, and diagenetic check methods (in the form of FTIR) for tooth enamelhave been made widely available to a varied academic audience. While we hope our efforts will make this approach more easily accessible toa wider number of individuals and laboratories, researchers who want to apply and publish this technique must be aware of minimum reportingstandards, diagenetic considerations, and presentation requirements overviewed elsewhere20, as well as potential interpretive complexities thatwill be unique to their study region, taxa analyzed, and time period5.
Protocol
The following protocol follows the guidelines of the Light Isotope Mass Spectrometry Laboratory at the Max Planck Institute for the Science ofHuman History. Appropriate ethics permissions from national and international committees should be sought for analyses involving endangeredmodern or historical faunal specimens, and for the use of archaeological and faunal material of interest to contemporary stakeholders. In thispaper, the samples used were archaeological and fossil specimens. No living humans were used in this study and full ethical, institutional, andgovernmental permissions have been gained for any destructive analysis.
1. Bulk Sampling
Note: For humans and animals, the basic method of bulk tooth enamel sampling is the application of a drill to the buccal edge of the tooth.
1. Clean the outer surface of the tooth (~0.1 mm) using an aluminum shot blaster or by gentle abrasion using the drill set-up. Use a hand-helddrill with a clean diamond-tipped drill bit (see below), of even shape, attached via a chuck to the drill set-up. Ensure that gentle and evenabrasion is performed as a groove parallel to the entire growth axis (Figure 1 and Figure 2).
2. Attempt, where possible, to apply the method to the same tooth portion for each human or animal sampled.
Note: In human paleodietary research, third molars are generally favored as representative of late juvenile/adult diet while first molars areavoided due to weaning effects23. The preferred tooth for each taxon, and the period of life represented, will vary with the available samplesand question under study.
3. Drill in a well-ventilated room while wearing a mask to avoid the inhalation of tooth enamel powder. Wear goggles to protect eyes. Be awarethat the amount of sample powder drilled will vary depending on the equipment used for analysis, pretreatment protocol, and size of the tooth.Drill at low speed in order to prevent heating the sample.
Note: Approximately, 4-8 mg of sample powder is an appropriate goal for multiple analyses using an online gas preparation and introductionsystem for isotope ratio mass spectrometry and diagenetic testing. Be aware that the chosen drill speed will depend on the fragility of thesample and will require some level of trial and error. In general, on a hand-held drill, two out of five bars of strength are sufficient. Drill thetooth powder over a piece of clean aluminum foil or weighing paper.
4. Collect the resulting enamel powder and transfer it into a 1.5 mL micro-centrifuge tube that has been tared on an appropriately accuratebalance prior to drilling. Label each tube with the sample designation (Figure 3). Record the sample numbers and enamel weight in alaboratory notebook as well as an electronic database.
5. Before drilling each new tooth, clean the utilized drill bits first using 0.5 M HCl on a robust tissue. Then wash the drill bit with an organicsolvent (such as acetone, methanol, or ethanol) using a robust tissue.
6. Following a drilling sitting, clean the workspace thoroughly using a dedicated vacuum cleaner, or a dustpan and brush. Wipe the samplingspace with methanol. Vacuum or lightly spray the drill with compressed air to remove dust and sample powder between samples.
2. Sequential Sampling
Note: Sequential sampling can be approached in a variety of forms and will depend on the taxon being sampled, the size of the tooth, as well asthe desired temporal resolution.
1. Clean the surface of the tooth being sampled by removing a very thin (~0.1 mm) layer of outer tooth enamel.2. Drill the samples along the buccal surface perpendicular to the growth axis of the tooth, running from the enamel root junction to the top of the
crown. Drill horizontal bands perpendicular to the growth axis, with each sample resulting in a 1-2 mm wide groove across the enamel layer(Figure 1 and Figure 4). Take care to avoid drilling through the enamel into the dentine as it would contaminate the sample and the resultingmeasurement.
Note: The number of samples taken will vary depending on the resolution desired but c. 10 represents an appropriate goal to study seasonalchanges in δ13C and δ18O values for a hypsodont the size of domesticated cattle.
3. Choose the appropriate drill bit for each sample, as the width of the sampling line is determined by the diameter of the drill bit.4. Use a rig set-up for more delicate teeth requiring a greater number of incremental samples (Figure 2) (e.g., human teeth), as well as for more
stable drilling. Set up the rig stand that holds the drill securely, with the drill bit pointing downwards.
Note: While four samples can easily be obtained from a permanent human molar using a hand-held approach24, more refined samplingrequires a rig or CO2 laser ablation approach that will not be discussed here14. Another common approach is to use a semi-automatedmicrosampling25.
5. Hold the tooth or attach to a clamp. Press the tooth enamel against the drill bit and apply pressure. Samples are drilled incrementally alongthe buccal surface from the apex (occlusal surface) to the base of the crown at the location of the enamel-root junction (ERJ). Replicate the

Journal of Visualized Experiments www.jove.com
Copyright © 2018 Journal of Visualized Experiments August 2018 | 138 | e58002 | Page 3 of 15
same sample drilling strategy multiple times drilling each consecutive line parallel to the previous sample line. Use a small cylindrical diamonddrill bit for delicate teeth, such as sheep molars, with a diameter of 1 mm (Figure 1C).
6. Measure the distance of each sampling line from the ERJ using calipers and record this distance for comparison.7. Follow steps 1.3-1.6 above.
Note: If small, delicate teeth are being analyzed and pretreatment and diagenetic check methods are not applied, samples as small as 1-4mg will produce reliable results on an on-line gas preparation and introduction set-up for carbonate analysis. Modified automated-peripheralsystems can facilitate the use of even lower sample weights, but are inevitably limited by the proportion of carbonate in the studied enamel (4to 5 wt%)26,27. Researchers should consult with the laboratory where samples are going to be measured to determine the amount of samplerequired.
3. Fourier Transform Infrared Spectrometry/Attenuated Total Reflectance method
1. For the Attenuated Total Reflectance method, establish a sample chamber background, either under vacuum or in normal atmosphericconditions.
2. Place approximately 1 mg of tooth enamel over the diamond crystal in the sample chamber using a spatula. Lower and secure the samplepost until there is a firm connection between the post, the sample, and the diamond plate. Close the sample chamber, with or without avacuum being established, depending on the set-up or availability.
3. Measure the FTIR spectra of the sample 64 times for the wavenumber ranging between 400 and 4,000 cm-1. The desired number ofreplicates will vary based on the goals of the study, though the analysis of three replicates, ideally with different aliquots being taken and thenreturned to the microcentrifuge tube housing the sample, will ensure robust results.
4. Clean the spatula with methanol between each aliquot and between each sample.5. Perform a baseline correction using the available software. The software automatically subtracts the sample chamber background from the
resulting FTIR profile. To ensure better reproducibility, only enamel spectra with a minimum absorbance of 0.06 for the highest phosphateband at ~1035 cm-1 should be taken into account.
6. Monitor the presence of the common secondary contaminant carbonate calcite in all samples by checking for a peak at 711 cm-1.7. Following the analysis, carefully return the samples to their microcentrifuge tubes using a spatula or suction device and take onto the next
stage of pretreatment or analysis.8. Export the raw wavelength and intensity data as a .csv file (or similar) and use to calculate the indices of interest (commonly used indices
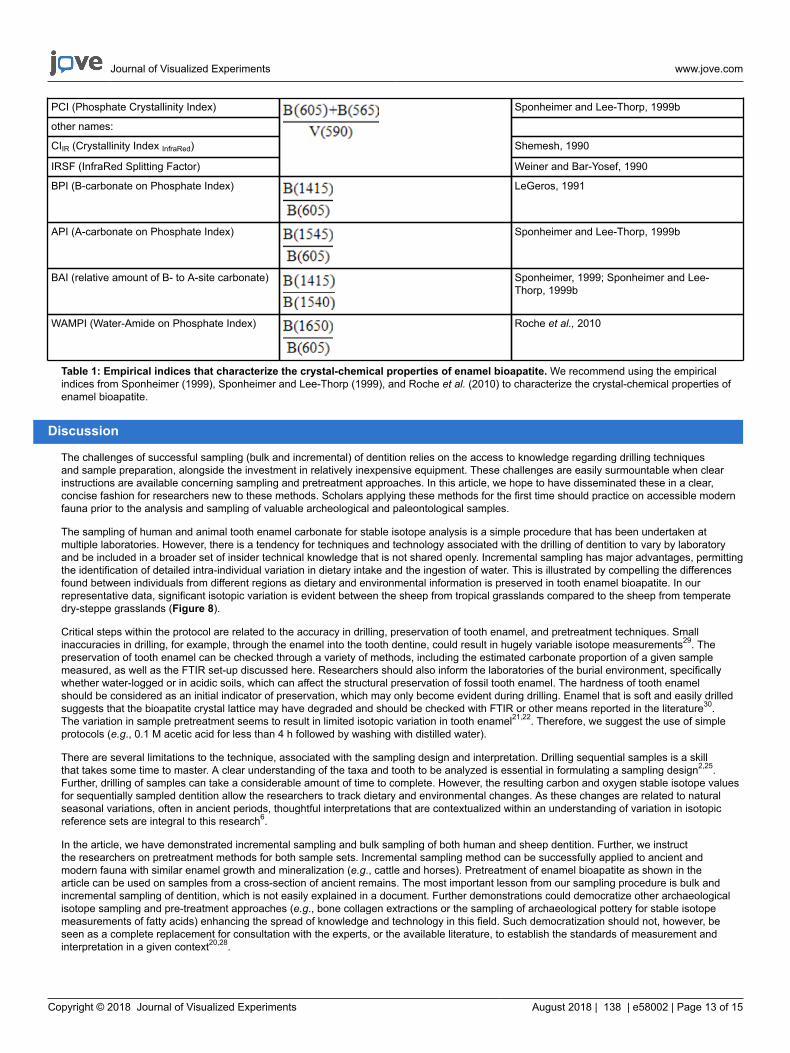
include A-site Phosphate Index, B-site Phosphate Index, Phosphate Crystallinity Index, Water-Amide on Phosphate Index, and CO3/PO4index17,18,19) (Table 1).
9. Compare the FTIR results from the fossil or archaeological samples to growing datasets of modern faunal tooth enamel now available in theliterature19,20 to determine the nature and extent of diagenetic alteration to the enamel sampled.
4. Simple Acetic Acid (0.1 M) Pretreatment
1. Weigh the enamel powder for each sample in a microcentrifuge tube using a balance as appropriate. Label the tube accordingly. Enamelpowder must be ground to the same degree, with particles of a similar size.
Note: Many researchers utilize an oxidizing agent, such as dilute bleach (NaClO) or 30% hydrogen peroxide (H2O2) to remove organics froma sample and this should be added at this point. However, not only may these reagents alter the stable carbon and oxygen isotope values ofa sample, but spectra of bone collagen samples in an on-line gas preparation and introduction system demonstrate that the 100% phosphoricacid utilized in carbonate measurement does not react with organic samples (Figure 5), suggesting that this step is unnecessary.
2. Add 0.1 mL of 0.1 M acetic acid (per 1 mg of enamel) to each sample using a pipette. Avoid touching the samples with the pipette. If thesample and pipette come into contact, use a new pipette for the next sample to avoid cross contamination.
3. Agitate, either through shaking or an electronic agitator (Figure 3) and then leave the samples to sit for 10 min. Enamel powder should not beleft in acetic acid for an extended period of time (>4 h).
4. Place the samples in a microcentrifuge for 2 min at 13,700 x g.
Note: A low-cost alternative is the use of a mini-centrifuge for 4 min at 3,500 x g, which holds fewer samples but is less time consuming whendealing with large sample sets.
5. When the microcentrifuge program stops, replace the acetic acid with 2 mL of ultrapure water using a clean pipette, then microcentrifuge thesamples for 2 min at 13,700 x g.
6. Change the ultrapure water two more times, as before, and test for neutrality. Remove the remaining fluid using a pipette (without disturbingthe supernatant).
Note: A total of three washes with ultrapure water is the standard procedure to get to neutrality. The sample should be washed until neutralityis reached.
7. Cut sheets of Parafilm (1 cm × 1 cm) and place over each microcentrifuge tube. Make a small hole in the center using a sharp object so thatthe sample dries appropriately.
8. Place the tubes in a freeze drier to remove any remaining fluid.
Note: If a freeze drier is not available, gentle oven drying (40 °C) is also a possibility and should not have any adverse effects on the stablecarbon and oxygen isotope data.
9. Once dry, remove the Parafilm and close the microcentrifuge lids. Make sure that the tube labeling is correct and re-write if necessary.
Note: This is the final stage prior to storage for weighing out, which in labs with limited funds may be the final stage prior to the distribution ofthe samples for analysis elsewhere.
5. Weighing and Measuring Samples and Standards
1. Using a spatula, weigh out approximately 2 mg of enamel powder onto a tin disc on a balance sensitive to 0.001 mg (Figure 6). Thencarefully transfer the sample into a phosphoric acid-resistant borosilicate glass vial. This amount of enamel is required to yield reliable resultsdue to the relatively small proportion of carbonate in tooth enamel.

Journal of Visualized Experiments www.jove.com
Copyright © 2018 Journal of Visualized Experiments August 2018 | 138 | e58002 | Page 4 of 15
2. Clean the spatula between samples using methanol and use a fresh, clean disc or weighing vessel for each sample.3. Weigh out 0.2 mg of an international standard such as IAEA NBS18, IAEA 603, IAEA CO8, or Merck CaCO3. An in-house standard made
from the homogenized enamel of a large tooth can be used as well20. For a full run of 76 samples and standards, use 61 samples and 15standards, which should be evenly distributed over the whole run. Several studies have reported appropriate numbers of standards anddetails in archaeological research20,28.
Note: The repeated pretreatment and analysis of an enamel in house standard, across a number of runs of archaeological samples, is alsolikely to provide an appropriate measure of accuracy for the samples being studied20.
4. Tighten the specially-designed lids, accessible to the needle until the septum is tight but not sucked into the vial. Do not over tighten the lidas the pressure on the septum will get too strong and can ultimately result in a broken needle during analysis. Place the vials in a listed orderwithin a heating block at 70 °C. The order and weights of samples must be reliably recorded for entry into the computer software.
5. Measure the samples by following three steps: 1) flush fill the samples with pure Helium, 2) add phosphoric acid, 3) measure the sample.1. Flush the samples with pure helium (grade 5.0) with a flow of 100 mL/min for 5 min to flush out ambient air.2. Add 4-5 drops of phosphoric acid (99%, density 1.85 g/mL) to the carbonate-containing sample. Reaction between the sample and
H3PO4 begins. During the reaction, CO2 is released which carries the isotopic value of the carbonate ion CO32- of the sample.
3. Wait 1 h per sample until the equilibration of CO2 is reached. After 1 h, the samples should be measured to obtain reliable results.During the acquisition, a mixture of sample gas and He passes to the device. A drying stage removes water from the sample gasmixture.
4. Measure the sample by starting with three peaks of CO2 reference gas with a known isotopic composition. Peak intensity should be4000 mV to match the intensity of the sample peaks (between 4000 to 8000 mV). The three reference gas peaks should be 20 s longand 30 s apart. Follow with defining the measurement interval of the sample. Measure the sample 10 times for 5 s each and 55 s apart.Ensure that peak height decreases over time indicating proper transport of the sample/helium mixture (Figure 5).
Note: During measurement, the software calculates the isotopic composition of the sample by comparing the known isotopic value, thepeak height, and area of the peak of the reference gas with the peak height and area of the peaks of the samples. The raw 13C/12C and18O/16O composition of the sample is calculated.
6. Normalize the samples after measurement.
Note: This is important because the reference gas does not undergo the same chemical and physical path as the sample gas whenintroduced into the mass spectrometer. Therefore, it is essential that the samples are additionally calibrated to international standards (step5.3) that undergo the same physical and chemical treatment within a run as the sample itself20. These international carbonate standardsenable the two-point calibration of samples onto the international delta measurement scale and the assessment of precision and repeatabilitythroughout a given run.
Representative Results
Using the sampling procedure presented above, incremental enamel bioapatite samples were prepared. The analysis of bioapatite in enameldepends on the accuracy of sampling, whether bulk or incremental. In this case, we have chosen to present the results of archaeologicalsamples (two sheep) from different climatic zones. Incremental samples were analyzed from sheep second molars and labelled starting at theERJ (Figure 4). Incremental sample locations were numbered, and each location was measured as its distance in mm from the ERJ (Figure 7).
Diverse carbon and oxygen stable isotope results from the two sheep confirm that they lived in different environments, in this case a tropicalgrassland (A) and a temperate dry-steppe grassland (B), respectively. Incremental δ18O values for sheep A show a narrow range between3.3 to 5.1‰, suggesting the ingestion of water sources with similar isotopic values and a lack of strong seasonal shifts in precipitation (Figure8). In contrast, δ18O values for sheep B have a high amplitude of variation, ranging from ─5.2 to ─13.1‰, indicating strong seasonal variationin precipitation. Stable carbon isotope values suggest strong differences in ingested vegetation between samples, with sheep A having adiet consisting mainly of C4 plants, while sheep B ingested primarily C3 vegetation. These sheep were specifically chosen to demonstrateenvironmental variation evident in incremental oxygen and carbon stable isotope results.
Human teeth are similarly sampled from the ERJ to the crown along the growth axis. Incremental δ18O and δ13C values for a human tooth froma rainforest environment are highly constrained, within a 2‰ range. This suggests a lack of variation in foraging strategies over the period ofenamel mineralization (Figure 9).

Journal of Visualized Experiments www.jove.com
Copyright © 2018 Journal of Visualized Experiments August 2018 | 138 | e58002 | Page 5 of 15
Figure 1: Drilling a Tooth. (A) Photo of a tooth being drilled on a rig set up. (B) Photo of enamel powder being collected in tin foil and placedinto a 1.5 mL micro-centrifuge tube (with proper label). (C) Photo of different drill bits available for incremental sampling. Please click here to viewa larger version of this figure.

Journal of Visualized Experiments www.jove.com
Copyright © 2018 Journal of Visualized Experiments August 2018 | 138 | e58002 | Page 6 of 15
Figure 2: Rig set up. Photo of rig set up with the drill in place. Please click here to view a larger version of this figure.

Journal of Visualized Experiments www.jove.com
Copyright © 2018 Journal of Visualized Experiments August 2018 | 138 | e58002 | Page 7 of 15
Figure 3: Sample preparation. Sample being placed into a micro-centrifuge tube and agitated on a vortex after chemicals were added. Pleaseclick here to view a larger version of this figure.
Figure 4: Incrementally sampled sheep teeth. Sheep teeth (A and B) that were incrementally sampled. Please click here to view a largerversion of this figure.

Journal of Visualized Experiments www.jove.com
Copyright © 2018 Journal of Visualized Experiments August 2018 | 138 | e58002 | Page 8 of 15
Figure 5: Chromatogram of gasbench run. Photo of a chromatogram of one sample displaying intensity of reference gas peaks and samplepeaks over time. Detected masses are 44, 45 and 46. The first three peaks are CO2 reference gas peaks with a known isotopic composition.Ten peaks that follow are sample peaks decreasing in intensity. Peaks should always be separated by several seconds to ensure a strictdiscrimination between the peaks and hence a clean peak integration. Numbers on top of each peak state the time (s) of peak detection. Pleaseclick here to view a larger version of this figure.

Journal of Visualized Experiments www.jove.com
Copyright © 2018 Journal of Visualized Experiments August 2018 | 138 | e58002 | Page 9 of 15
Figure 6: Weighing carbonate sample. Photo of sample being weighted into glass vials using a spatula. Please click here to view a largerversion of this figure.

Journal of Visualized Experiments www.jove.com
Copyright © 2018 Journal of Visualized Experiments August 2018 | 138 | e58002 | Page 10 of 15
Figure 7: Incremental samples on a sheep tooth. Incremental samples along the growth axis of the tooth from the ERJ to the top of the crownplotted alongside carbon and oxygen stable isotope values. Please click here to view a larger version of this figure.

Journal of Visualized Experiments www.jove.com
Copyright © 2018 Journal of Visualized Experiments August 2018 | 138 | e58002 | Page 11 of 15
Figure 8: Sheep enamel carbonate isotope results. Stable oxygen and carbon isotope values for two incrementally sampled sheep teeth.Please click here to view a larger version of this figure.

Journal of Visualized Experiments www.jove.com
Copyright © 2018 Journal of Visualized Experiments August 2018 | 138 | e58002 | Page 12 of 15
Figure 9: Human enamel carbonate isotope results. Stable oxygen and carbon isotope values for an incrementally sampled human tooth.Please click here to view a larger version of this figure.
Journal of Visualized Experiments www.jove.com
Copyright © 2018 Journal of Visualized Experiments August 2018 | 138 | e58002 | Page 13 of 15
PCI (Phosphate Crystallinity Index) Sponheimer and Lee-Thorp, 1999b
other names:
CIIR (Crystallinity Index InfraRed) Shemesh, 1990
IRSF (InfraRed Splitting Factor) Weiner and Bar-Yosef, 1990
BPI (B-carbonate on Phosphate Index) LeGeros, 1991
API (A-carbonate on Phosphate Index) Sponheimer and Lee-Thorp, 1999b
BAI (relative amount of B- to A-site carbonate) Sponheimer, 1999; Sponheimer and Lee-Thorp, 1999b
WAMPI (Water-Amide on Phosphate Index) Roche et al., 2010
Table 1: Empirical indices that characterize the crystal-chemical properties of enamel bioapatite. We recommend using the empiricalindices from Sponheimer (1999), Sponheimer and Lee-Thorp (1999), and Roche et al. (2010) to characterize the crystal-chemical properties ofenamel bioapatite.
Discussion
The challenges of successful sampling (bulk and incremental) of dentition relies on the access to knowledge regarding drilling techniquesand sample preparation, alongside the investment in relatively inexpensive equipment. These challenges are easily surmountable when clearinstructions are available concerning sampling and pretreatment approaches. In this article, we hope to have disseminated these in a clear,concise fashion for researchers new to these methods. Scholars applying these methods for the first time should practice on accessible modernfauna prior to the analysis and sampling of valuable archeological and paleontological samples.
The sampling of human and animal tooth enamel carbonate for stable isotope analysis is a simple procedure that has been undertaken atmultiple laboratories. However, there is a tendency for techniques and technology associated with the drilling of dentition to vary by laboratoryand be included in a broader set of insider technical knowledge that is not shared openly. Incremental sampling has major advantages, permittingthe identification of detailed intra-individual variation in dietary intake and the ingestion of water. This is illustrated by compelling the differencesfound between individuals from different regions as dietary and environmental information is preserved in tooth enamel bioapatite. In ourrepresentative data, significant isotopic variation is evident between the sheep from tropical grasslands compared to the sheep from temperatedry-steppe grasslands (Figure 8).
Critical steps within the protocol are related to the accuracy in drilling, preservation of tooth enamel, and pretreatment techniques. Smallinaccuracies in drilling, for example, through the enamel into the tooth dentine, could result in hugely variable isotope measurements29. Thepreservation of tooth enamel can be checked through a variety of methods, including the estimated carbonate proportion of a given samplemeasured, as well as the FTIR set-up discussed here. Researchers should also inform the laboratories of the burial environment, specificallywhether water-logged or in acidic soils, which can affect the structural preservation of fossil tooth enamel. The hardness of tooth enamelshould be considered as an initial indicator of preservation, which may only become evident during drilling. Enamel that is soft and easily drilledsuggests that the bioapatite crystal lattice may have degraded and should be checked with FTIR or other means reported in the literature30.The variation in sample pretreatment seems to result in limited isotopic variation in tooth enamel21,22. Therefore, we suggest the use of simpleprotocols (e.g., 0.1 M acetic acid for less than 4 h followed by washing with distilled water).
There are several limitations to the technique, associated with the sampling design and interpretation. Drilling sequential samples is a skillthat takes some time to master. A clear understanding of the taxa and tooth to be analyzed is essential in formulating a sampling design2,25.Further, drilling of samples can take a considerable amount of time to complete. However, the resulting carbon and oxygen stable isotope valuesfor sequentially sampled dentition allow the researchers to track dietary and environmental changes. As these changes are related to naturalseasonal variations, often in ancient periods, thoughtful interpretations that are contextualized within an understanding of variation in isotopicreference sets are integral to this research6.
In the article, we have demonstrated incremental sampling and bulk sampling of both human and sheep dentition. Further, we instructthe researchers on pretreatment methods for both sample sets. Incremental sampling method can be successfully applied to ancient andmodern fauna with similar enamel growth and mineralization (e.g., cattle and horses). Pretreatment of enamel bioapatite as shown in thearticle can be used on samples from a cross-section of ancient remains. The most important lesson from our sampling procedure is bulk andincremental sampling of dentition, which is not easily explained in a document. Further demonstrations could democratize other archaeologicalisotope sampling and pre-treatment approaches (e.g., bone collagen extractions or the sampling of archaeological pottery for stable isotopemeasurements of fatty acids) enhancing the spread of knowledge and technology in this field. Such democratization should not, however, beseen as a complete replacement for consultation with the experts, or the available literature, to establish the standards of measurement andinterpretation in a given context20,28.

Journal of Visualized Experiments www.jove.com
Copyright © 2018 Journal of Visualized Experiments August 2018 | 138 | e58002 | Page 14 of 15
Disclosures
The authors declare no conflict of interest.
Acknowledgements
We would like to thank the Max Planck Society for funding this research as well as the recent setting up of a Stable Isotope laboratory at theDepartment Archaeology, Max Planck Institute for the Science of Human History.
References
1. Balasse, M. Reconstructing dietary and environmental history from enamel isotopic analysis: time resolution of intra-tooth sequentialsampling. International Journal of Osteoarchaeology. 12 (3), 155-165 (2002).
2. Balasse, M. Potential biases in sampling design and interpretation of intra-tooth isotope analysis. International Journal of Osteoarchaeology.13 (1-2), 3-10 (2003).
3. Lee-Thorp, J.A. On isotopes and old bones. Archaeometry. 50 (6), 925-950 (2008).4. Clementz, M.T. New insight from old bones: stable isotope analysis of fossil mammals. Journal of Mammalogy. 93 (2), 368-380 (2012).5. Loftus, E., Roberts, P., Lee-Thorp, J.A. An isotopic generation: four decades of stable isotope analysis in African archaeology. Azania:
Archaeological Research in Africa. 51 (1), 88-114 (2016).6. Ventresca Miller, A.R., Makarewicz, C. Isotopic approaches to pastoralism in prehistory: Diet, mobility, and isotopic reference sets. Isotopic
Investigations of Pastoralism in Prehistory. 1-14 (2018).7. Hollund, H.I., Ariese, F., Fernandes, R., Jans, M.M.E., Kars, H.. Testing an alternative high-throughput tool for investigating bone diagenesis:
FTIR in attenuated total reflection (ATR) mode. Archaeometry., 55 (3), 507-532 (2013).8. LeGeros, R.Z. Calcium phosphates in oral biology and medicine. Monographs in oral sciences. 15, 109-111 (1991).9. Lee-Thorp, J.L., Van Der Merwe, N.J. Carbon isotope analysis of fossil bone apatite. South African Journal of Science. 83 (11), 712-715
(1987).10. Cerling, T.E., Harris, J.M. Carbon isotope fractionation between diet and bioapatite in ungulate mammals and implications for ecological and
paleoecological studies. Oecologia. 120 (3), 347-363 (1999).11. Koch, P.L. Isotopic study of the biology of modern and fossil vertebrates. Stable Isotopes in Ecology and Environmental Science. 99-154
(2007).12. Nelson, S.J. Wheeler's Dental Anatomy, Physiology and Occlusion-E-Book. Elsevier Health Sciences. (2014).13. Tsutaya, T. et al. From cradle to grave: multi-isotopic investigations on the life history of a higher-status female from Edo-period Japan.
Anthropological Science. 124 (3), 185-197 (2016).14. Sponheimer, M., Passey, B.H., De Ruiter, D.J., Guatelli-Steinberg, D., Cerling, T.E., Lee-Thorp, J.A. Isotopic evidence for dietary variability in
the early hominin Paranthropus robustus. Science. 314 (5801), 980-982 (2006).15. Lee-Thorp, J., Sponheimer, M. Three case studies used to reassess the reliability of fossil bone and enamel isotope signals for paleodietary
studies. Journal of Anthropological Archaeology. 22 (3), 208-216 (2003).16. Zazzo, A., 2014. Bone and enamel carbonate diagenesis: a radiocarbon prospective. Palaeogeography, Palaeoclimatology, Palaeoecology.,
416, 168-178 (2014).17. Sponheimer, M. Isotopic paleoecology of the Makapansgat Limeworks fauna (Australopithecus africanus, South Africa). (1999).18. Sponheimer, M., Lee-Thorp, J.A. Alteration of enamel carbonate environments during fossilization. Journal of Archaeological Science. 26 (2),
143-150 (1999).19. Roche, D., Ségalen, L., Balan, E., Delattre, S. Preservation assessment of Miocene-Pliocene tooth enamel from Tugen Hills (Kenyan Rift
Valley) through FTIR, chemical and stable-isotope analyses. Journal of Archaeological Science. 37 (7), 1690-1699 (2010).20. Roberts, P. et al. Calling all archaeologists: guidelines for terminology, methodology, data handling, and reporting when undertaking and
reviewing stable isotope applications in archaeology. Rapid Communications in Mass Spectrometry. (2018).21. Snoeck, C., Pellegrini, M. Comparing bioapatite carbonate pre-treatments for isotopic measurements: Part 1-Impact on structure and
chemical composition. Chemical Geology. 417, 394-403 (2015).22. Pellegrini, M., Snoeck, C. Comparing bioapatite carbonate pre-treatments for isotopic measurements: Part 2-Impact on carbon and oxygen
isotope compositions. Chemical Geology. 420, 88-96 (2016).23. Wright, L.E., Schwarcz, H.P. Stable carbon and oxygen isotopes in human tooth enamel: identifying breastfeeding and weaning in prehistory.
American Journal of physical anthropology. 106 (1), 1-18 (1998).24. Roberts, P. et al. Fruits of the forest: Human stable isotope ecology and rainforest adaptations in Late Pleistocene and Holocene (~ 36 to 3
ka) Sri Lanka. Journal of human evolution. 106, 102-118 (2017).25. Zazzo, A., Balasse, M., Patterson, W.P. High-resolution δ13C intratooth profiles in bovine enamel: Implications for mineralization pattern and
isotopic attenuation. Geochimica et Cosmochimica Acta. 69 (14), 3631-3642 (2005).26. Sydney-Zax, M., Mayer, I. and Deutsch, D.. Carbonate content in developing human and bovine enamel. Journal of dental research. 70 (5),
913-916 (1991).27. Rink, W.J. and Schwarcz, H.P.. Tests for diagenesis in tooth enamel: ESR dating signals and carbonate contents. Journal of Archaeological
Science. 22 (2), 251-255 (1995).28. Szpak, P., Metcalfe, J.Z., Macdonald, R.A. Best practices for calibrating and reporting stable isotope measurements in archaeology. Journal
of Archaeological Science: Reports. 13, 609-616 (2017).29. Wright, L.E., Schwarcz, H.P. Correspondence between stable carbon, oxygen and nitrogen isotopes in human tooth enamel and dentine:
infant diets at Kaminaljuyu. Journal of Archaeological Science. 26 (9), 1159-1170 (1999).

Journal of Visualized Experiments www.jove.com
Copyright © 2018 Journal of Visualized Experiments August 2018 | 138 | e58002 | Page 15 of 15
30. Schoeninger, M.J., Hallin, K., Reeser, H., Valley, J.W., Fournelle, J. Isotopic alteration of mammalian tooth enamel. International Journal ofOsteoarchaeology. 13 (1-2), 11-19 (2003).