Ovveerrvviieeww ooff WWaatteerrsshheedd … data are used to identify sources and types of pollution...
33
WATERSHED ACADEMY WEB Overview of Watershed Monitoring http://www.epa.gov/watertrain 1 NOTICE: This PDF file was adapted from an on-line training module of the EPA’s Watershed Academy Web, found at http://www.epa.gov/watertrain . To the extent possible, it contains the same material as the on-line version. Some interactive parts of the module had to be reformatted for this noninteractive text presentation. A self-test is included at the end of the file. Underlined terms throughout this module appear in the glossary at the end of the file. This document does not constitute EPA policy. Mention of trade names or commercial products does not constitute endorsement or recommendation for use. Links to non-EPA web sites do not imply any official EPA endorsement of or responsibility for the opinions, ideas, data, or products presented at those locations or guarantee the validity of the information provided. Links to non-EPA servers are provided solely as a pointer to information that might be useful to EPA staff and the public. O O v v e e r r v v i i e e w w o o f f W W a a t t e e r r s s h h e e d d M M o o n n i i t t o o r r i i n n g g E E P P A A W W a a t t e e r r s s h h e e d d A A c c a a d d e e m m y y T T r r a a i i n n i i n n g g M M o o d d u u l l e e
Transcript of Ovveerrvviieeww ooff WWaatteerrsshheedd … data are used to identify sources and types of pollution...
WATERSHED ACADEMY WEB Overview of Watershed Monitoring http://www.epa.gov/watertrain
1
NOTICE: This PDF file was adapted from an on-line training module of the EPA’s Watershed Academy Web, found at http://www.epa.gov/watertrain. To the extent possible, it contains the same material as the on-line version. Some interactive parts of the module had to be reformatted for this noninteractive text presentation. A self-test is included at the end of the file.Underlined terms throughout this module appear in the glossary at the end of the file.
This document does not constitute EPA policy. Mention of trade names or commercial productsdoes not constitute endorsement or recommendation for use.
Links to non-EPA web sites do not imply any official EPA endorsement of or responsibility for the opinions, ideas, data, or products presented at those locations or guarantee the validity of the information provided. Links to non-EPA servers are provided solely as a pointer to information that might be useful to EPA staff and the public.
OOOvvveeerrrvvviiieeewww ooofff
WWWaaattteeerrrssshhheeeddd MMMooonnniiitttooorrriiinnnggg EEEPPPAAA WWWaaattteeerrrssshhheeeddd AAAcccaaadddeeemmmyyy TTTrrraaaiiinnniiinnnggg MMMoooddduuullleee

WATERSHED ACADEMY WEB Overview of Watershed Monitoring http://www.epa.gov/watertrain
2
Introduction How do we assess the condition of our Nation’s streams, rivers, lakes, estuaries, and coastal waters? How do we collect information to determine if these water resources are safe enough to drink, swim in, eat fish from, or use to irrigate our food crops? Further, how do we tell whether a water body supports a healthy aquatic ecosystem? How do we tell if conditions are worsening, or if our management efforts are making a difference? Watershed monitoring provides this information. Monitoring also has many other valuable uses to government agencies, water quality practitioners, drinking water utilities, industrial dischargers, environmental groups, and ordinary citizens concerned about improving or preserving our water resources.
Welcome to the watershed monitoring module. The information provided in this module serves as a general introduction to monitoring - what it is, why it is needed, and how it can be used to help achieve watershed management objectives. Specifically, the goals of this training module are to:
• Describe monitoring’s many roles • Introduce watershed monitoring • Highlight water quality monitoring • Outline monitoring program and sampling design development
Watershed Monitoring Basics In general terms, monitoring is the periodic or continuous collection of data (measured parameters) using consistent methods. The types of monitoring and the reasons for collecting data vary tremendously. Water quality monitoring is commonly defined as the sampling and analysis of water (lake, stream, river, estuary, or ocean) and conditions of the waterbody. Water quality monitoring can evaluate the physical, chemical, and biological characteristics of a water body in relation to human health, ecological conditions, and designated water uses. Watershed monitoring is a more comprehensive approach to data collection that incorporates water quality as well as watershed conditions. For example, water quality monitoring conducted on a watershed basis would include monitoring physical, chemical, and/or biological condition of the waterbody (Figure 1) as well as specific watershed characteristics (e.g. stream corridor traits, wetlands, and watershed land use/land cover patterns) that may be related to observed water quality. Watershed monitoring therefore evaluates the condition of the water resource while also
Figure 1: Biological monitoring can be one component of a watershed monitoring program. Information collected on algae, aquatic plants, aquatic insects, and/or fish can be used to assess ecological conditions. The above photo illustrates the use of a kicknet to collect small insects living on the stream bottom. Information such as the types of insects collected, their abundance, and/or the diversity of species provides valuable clues of the health of the stream system.

WATERSHED ACADEMY WEB Overview of Watershed Monitoring http://www.epa.gov/watertrain
3
providing valuable watershed information to help establish cause-and-effect relationships. Although this module introduces the principles of watershed monitoring, it emphasizes water quality monitoring as the major part of watershed monitoring and focuses on key points to consider when designing a sampling program.
Watershed monitoring data can be used for many purposes, such as to determine source(s) of impairment, to provide input for management tools such as models, and to support scientifically-based decisions for preserving or improving the quality of a water resource (Figure 2). Local watershed monitoring efforts may be done for locality-specific purposes (e.g. improved fisheries or recreation), but many are also designed to be compatible with state-level monitoring and have their data make a difference at higher levels. The way to accomplish this is to measure parameters the states focus on and use good methods for sample design, collection, and analysis.
The steps to watershed monitoring typically start with delineating the watersheds of interest. Once the geographic scope is delineated, the next steps are to define valued attributes, choose indicators of quality, establish monitoring protocols, generate data, perform QA/QC procedures, conduct the assessment, report findings, and influence policies and take actions.
This module focuses on water quality as an example valued attribute, and details the steps to consider when designing a watershed monitoring program. Keep in mind, however, that monitoring may target very specific valued attributes (such as water clarity) or in other instances may be very comprehensive in scope (such as the health of the entire water body).
Common Objectives To properly manage a water resource, you need to know all about the water body and the watershed it drains. Watershed monitoring is a major part of the process for collecting this information and is therefore an essential component to water quality assessment and to watershed management. The information collected can support sound decision-making by identifying high quality waters and tracking their condition over time, by providing clues to the sources and levels of pollution for waters that are impaired or threatened, by helping managers understand the impacts of human activities within the watershed, and by providing input data used in water quality models. So without crucial monitoring data, we might not know exactly where a pollution problem exists, where we need to focus our watershed management energies, or where we may have made progress. Water quality monitoring programs are designed to serve
Figure 2: Watershed monitoring data can be used to determine source(s) of impairment, to provide input for management tools such as models, and to support scientifically based decisions for preserving or improving the quality of a water resource.

WATERSHED ACADEMY WEB Overview of Watershed Monitoring http://www.epa.gov/watertrain
4
Figure 3: Common Water Quality Monitoring Objectives.
many purposes (Figure 3). Following is more information about what roles water quality monitoring often plays in watershed management.
Characterizing water quality conditions and analyzing trends
Monitoring data collected on a regular basis can be used to determine water quality and how it is changing over time. Baseline characterization can be used to quantify water quality and describe ecological characteristics or processes within the water body or watershed. Trend analysis involves longer-term, repeated sampling to evaluate changing conditions, which helps to evaluate past and present protection measures and target areas for improvement. For example, when Georgia began prohibiting the use of phosphate in detergents, phosphorus levels started to decline dramatically (Figure 4), especially in water bodies that received waste water discharges. Additional declines were achieved by upgrading the treatment efficiency of waste water treatment plants.
Figure 4: Historic Trend Monitoring Data: Chattahoochee River
WATERSHED ACADEMY WEB Overview of Watershed Monitoring http://www.epa.gov/watertrain
5
Figure 5: Beach closures advise the public of hazardous conditions.
Figure 6: This picture shows a stream segment identified as impacted through a watershed monitoring program, and before best management practices were implemented.
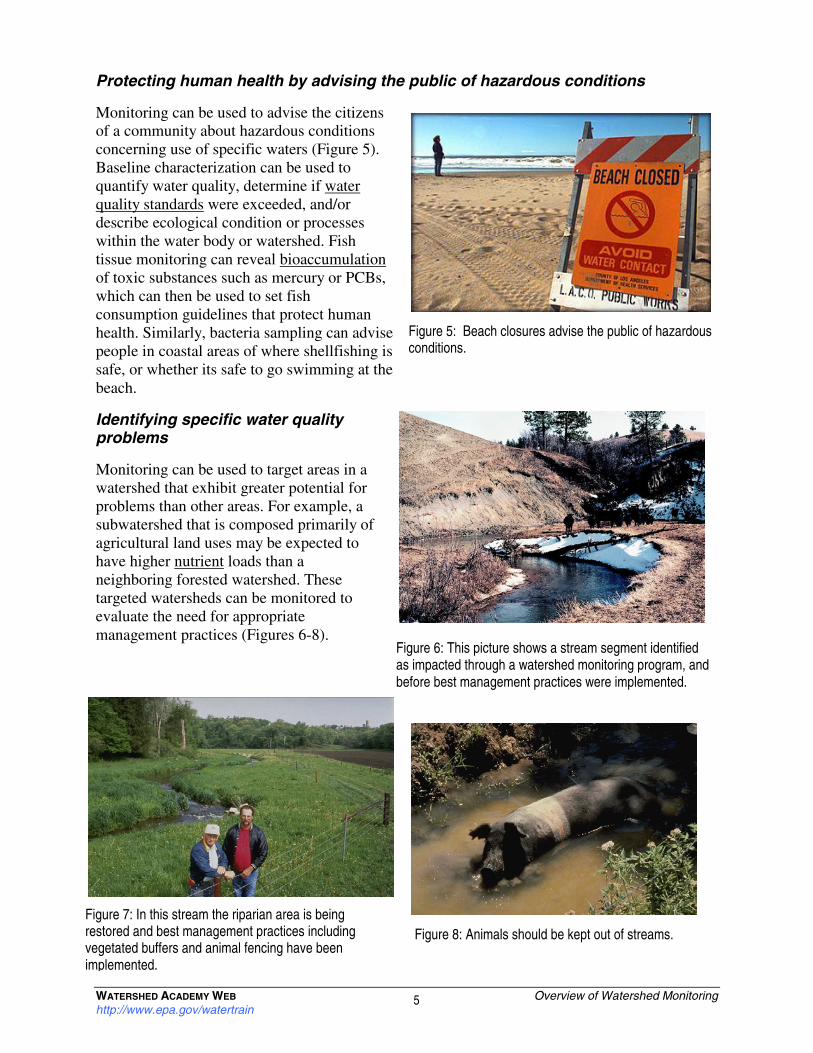
Protecting human health by advising the public of hazardous conditions
Monitoring can be used to advise the citizens of a community about hazardous conditions concerning use of specific waters (Figure 5). Baseline characterization can be used to quantify water quality, determine if water quality standards were exceeded, and/or describe ecological condition or processes within the water body or watershed. Fish tissue monitoring can reveal bioaccumulation of toxic substances such as mercury or PCBs, which can then be used to set fish consumption guidelines that protect human health. Similarly, bacteria sampling can advise people in coastal areas of where shellfishing is safe, or whether its safe to go swimming at the beach.
Identifying specific water quality problems
Monitoring can be used to target areas in a watershed that exhibit greater potential for problems than other areas. For example, a subwatershed that is composed primarily of agricultural land uses may be expected to have higher nutrient loads than a neighboring forested watershed. These targeted watersheds can be monitored to evaluate the need for appropriate management practices (Figures 6-8).
Figure 7: In this stream the riparian area is being restored and best management practices including vegetated buffers and animal fencing have been implemented.
Figure 8: Animals should be kept out of streams.

WATERSHED ACADEMY WEB Overview of Watershed Monitoring http://www.epa.gov/watertrain
6
Figure 12
Designing pollution prevention or remediation programs
Monitoring can be a key element in designing and implementing a pollution prevention or remediation program. This can support a risk assessment where monitoring data are used to identify sources and types of pollution in a watershed and evaluate the likelihood of adverse effects. Monitoring information can also be used to select the best remediation techniques, to prioritize efforts, and to track remedial actions before, during and after their execution (Figures 9 and 10).
Assessing program goals and effectiveness
Monitoring can be used to assess many different program goals. For example, compliance monitoring is required for wastewater treatment plants and industrial dischargers as part of performance evaluations. Water released from these facilities may be sampled for solids, oxygen-demanding wastes, fecal coliform bacteria, metals, nutrients, or other pollutants in order to determine if levels exceed a permit limitation and pose a
threat to public or ecological health. As another example, a watershed association might have a monitoring program to evaluate implementation of its watershed plan and the associated ecological effectiveness. Such a validation monitoring or implementation monitoring program might be set up to answer the question, “Were restoration and/or management measures implemented correctly and achieve desired results?” (Figures 11 and 12).
Figure 11
Figure 10
Figure 9

WATERSHED ACADEMY WEB Overview of Watershed Monitoring http://www.epa.gov/watertrain
7
Figure 13
Figure 14
Responding to emergencies
Monitoring can be used to assess the effects of environmental catastrophes such as spills, floods, or droughts. Data may be required to give adequate definition to the water quality problem and the magnitude of the impacts. For example, monitoring during and after the cleanup of an oil spill can help determine the extent of exposure, when a resource is safe for fishing or drinking, or whether and where cleanup efforts need to continue (Figure 13).
Monitoring Program Development Strategy Water quality monitoring programs are designed for different objectives as well as for different sizes of water bodies and watersheds. Federal programs such as USGS’s National Water Quality Assessment Program (NAWQA) (http://water.usgs.gov/nawqa) and state ambient water quality monitoring programs are generally extensive, long-term efforts. Local governments, industries, universities and schools, watershed associations, environmental groups, and concerned citizens also collect water quality information. Each of these users will have different data requirements, program goals, and available resources. The development strategy for any watershed monitoring program will therefore have to consider many different issues (Figure 14). This module is designed to illustrate the major steps to developing a watershed monitoring program and to provide general guidance on important questions your group should address.
What are the Program Objectives?
Defining program objectives or goals is one of the first steps to developing a monitoring program. Some typical goals include:
• Documenting watershed condition and water quality trends over time
• Screening for potential water quality problems

WATERSHED ACADEMY WEB Overview of Watershed Monitoring http://www.epa.gov/watertrain
8
• Determining whether water bodies meet regulatory standards and/or support designated uses (safe for swimming, drinking, fishing, etc.)
• Providing data for scientifically-based watershed management decisions
• Determining the impacts of discharges (sewage treatment plants or industries) to support appropriate effluent limits
• Determining the impacts of land use activities (farming, forestry, or urban development)
• Supporting management of water quality-limited waters, including assessment of Total Maximum Daily Loads (TMDLS)
• Educating the watershed’s citizens, leaders or users
Once the program objectives are broadly defined, it is essential to establish the scope of study. Monitoring efforts can vary in geographic scale and duration.
The scale can range from a single stream site, discharge point, or watershed to an entire state, region, or nation. Depending on the program goals, sampling duration can include single event screening, short-term intensive studies, or long-term assessments.
Which Evaluation Tools Should be Used?
There are many evaluation tools and indicators used to measure the quality of water within a watershed (Figure 15). Biological parameters, such as fish, benthic macroinvertebrates, algae, aquatic plants, and others can be monitored for general health, abundance, composition, and diversity. These biological indicators have the advantage of naturally integrating water quantity and quality impacts within the watershed. Biological data therefore provides an indication of the cumulative effects of acute and chronic pollution inputs. Chemical analyses of water samples and biota (e.g. fish tissue sampling for toxic substances) can determine the presence and concentration of parameters like nutrients, metals, and pesticides. Physical measurements, including stream flow, temperature, turbidity and color, dissolved oxygen, and pH are collected in the field and can provide additional clues to the quality of a resource and potential problems which may exist. Habitat evaluations can also provide data important to determining the health of aquatic organisms. If chemical and physical measurements don’t indicate man-made disturbances, then habitat structure may provide answers to why aquatic life is degraded. Habitat evaluations can include measurements of the riparian corridor condition, the amount and types of overhanging vegetation, stream bottom substrate, and the amount of hydrologic modification. Toxicity measurements are often required of industrial and wastewater dischargers, such as industry or municipal wastewater treatment plants. These tests try to
Figure 15: Each of these 5 water quality monitoring components represent valuable evaluation tools and pontential indicators of water quality. Together, the indicators from each group can be integrated into a informative and comprehensive assessment.

WATERSHED ACADEMY WEB Overview of Watershed Monitoring http://www.epa.gov/watertrain
9
determine the environmental impacts of the discharge by exposing certain organisms (e.g., daphnia (water flea) and fat-head minnows) over a period of time. Examples of toxicity measurements include whole effluent, ambient water, and sediment tests. By integrating these types of monitoring data, you may learn more about the relationships between sources of stress and their effects on the water body. On this basis you can better determine the appropriate management strategies to improve the quality of a water resource.
Chemical, physical, biological, habitat, and toxicity measurements are all valuable tools to monitor the health of a water resource, but it is important to match these tools with your objectives (Figure 16). For example, supplemental data such as land use/land cover, septic system coverage, and/or implementation rates of urban or agricultural BMPs may be necessary along with monitoring information if the objective is to develop a detailed watershed model.
The person(s) designing the monitoring program must decide which of these parameter types or individual indicators need to be sampled to provide the information to address program objectives. Some programs may require a broad range of parameters (e.g. biological, chemical, physical, habitat, and toxicity measurements), whereas other programs may have a narrower focus and incorporate a limited number of parameter types and response indicators. It’s important to establish the technical approaches (i.e., statistical methods or models) that will be used to analyze and assess the data so that parameter needs for these tools are fully considered.
Figure 16: Effective monitoring programs are designed to collect the most useful data necessary to achieve program objectives. Therefore, careful consideration is essential to match indicators and information needs.

WATERSHED ACADEMY WEB Overview of Watershed Monitoring http://www.epa.gov/watertrain
10
Are Alternative Sources of Data Available?
Data quality objectives comprise very important factors to consider in designing a monitoring program. Certain objectives, such as compliance monitoring, can require high quality data collected by the permitee at regular intervals (hourly, daily, etc.). If available, however, information needs might be satisfied by or supplemented in some cases with existing data from other sampling programs, watershed studies, geographic information system (GIS) databases, and/or maps (Figure 17). One of the largest ambient water quality databases, for example, is USEPA’s STORET system, which stores information collected by local, state, and federal agencies as well as private entities such as universities and volunteer groups. Another valuable source of watershed information is accessible online at USEPA’s Surf Your Watershed (www.epa.gov/surf). Other sources of watershed information include:
• Land use plans from local planning offices, which include information not only for current land uses, but for potential uses for which the area is zoned.
• Conservation district offices or offices of the agricultural extension service or Natural Resources Conservation Service (NRCS). These offices might be able to provide information on agricultural land in rural areas.
• Local offices of the US Geological Survey (USGS), which might provide a variety of publications, special studies, maps, and photos on land uses and landforms in the area.
• Aerial photos, which might provide current and historical views of land uses.
By searching for existing data, identifying information gaps, and establishing priorities for new data collection up front, you can develop a more effective data collection strategy while minimizing program costs.
What Resources are Available?
The costs of monitoring are extremely variable depending on the types and scope of sampling. Expenses are first estimated based on broad program goals and identified data needs. If this
Figure 17: Electronic sources of data can be maintained and analyzed with spreadsheet or database computer software. These data may already be available from a variety of sources, including state and federal agencies, local universities, or municipalities (e.g., engineering, planning, and/or public works departments).

WATERSHED ACADEMY WEB Overview of Watershed Monitoring http://www.epa.gov/watertrain
11
budget exceeds the available sources of funding, the program should be redesigned. Costs can be reduced with some innovative approaches such as partnering or collaboration agreements. These approaches spread cost to two or more data users, such as municipalities, dischargers, or government agencies. Data collection can also be more cost-effective if volunteers are utilized. EPA’s Volunteer Monitoring website (http://www.epa.gov/owow/monitoring/ vol.html) provides useful guidance about developing, training, and utilizing volunteer networks.
What are the Refined Objectives?
Broad goals should be refined to specific objectives once available resources (money and staff), time period, spatial coverage, types of indicators, and priorities are all identified (Figures 18 and 19). These refined objectives represent realistic goals and achievements of the monitoring program. For example, typical broad goals are to improve and protect water quality or restore intended uses. Refined objectives that consider funding and stakeholder’s interests might include the following examples:
• Monitor sedimentation and erosion control practices throughout the watershed to improve water clarity and stream habitat
• Conduct RBP assessments within an impaired mountain creek watershed to restore trout fisheries
• Monitor wastewater discharges and potential contamination at local beaches to restore recreational and swimming uses
• Preserve and monitor local wetlands in order to protect endangered species habitat
• Sample stormwater runoff and ambient water quality in an urban watershed to support planning and growth management
• Sample water quality and shellfish tissue at estuary sites to notify the public of potential shellfish advisories
These examples of refined objectives need to be made still more specific and quantitative to provide a basis for study design and statistical sampling. Refined objectives ideally should include...
• the environmental attribute to be estimated,
Figure 18
Figure 19
WATERSHED ACADEMY WEB Overview of Watershed Monitoring http://www.epa.gov/watertrain
12
• the target population, (i.e., target season, waterbody type, size classification, etc.)
• the desired level of confidence in the estimate,
• the desired level of statistical power to detect a difference or change, and
• an acceptable maximum magnitude of error, or the acceptable minimum detectable magnitude of difference or change in a selected indicator.
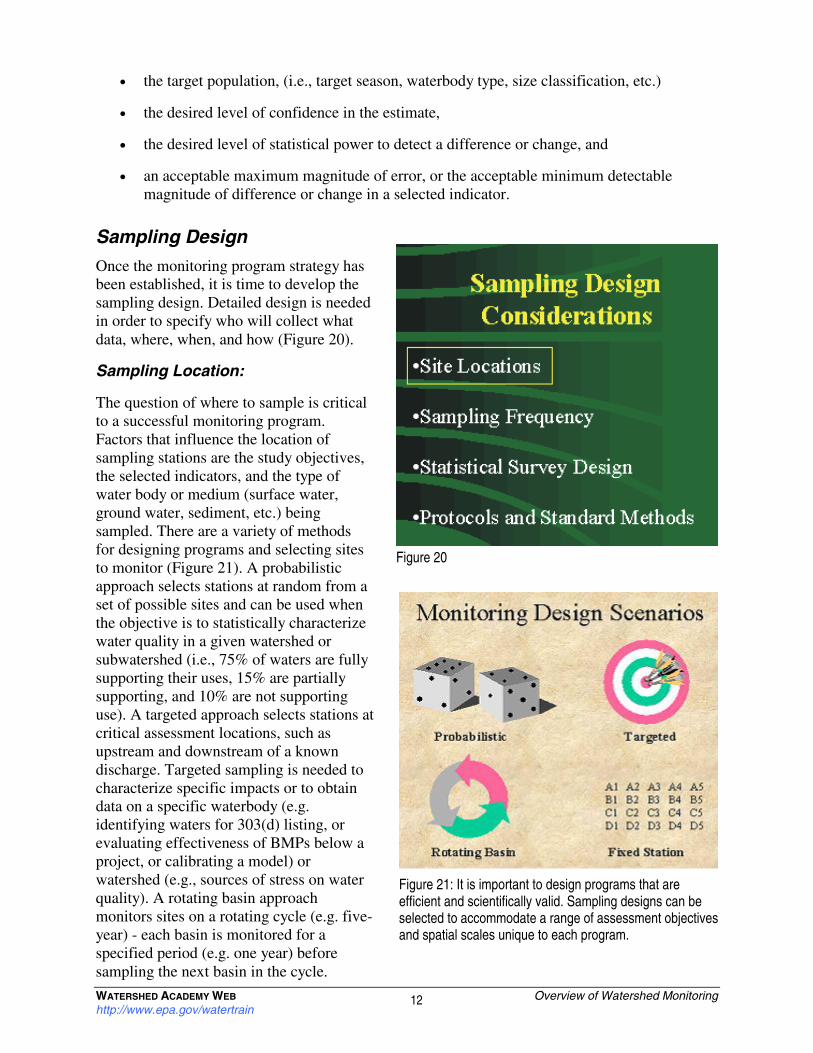
Sampling Design Once the monitoring program strategy has been established, it is time to develop the sampling design. Detailed design is needed in order to specify who will collect what data, where, when, and how (Figure 20).
Sampling Location:
The question of where to sample is critical to a successful monitoring program. Factors that influence the location of sampling stations are the study objectives, the selected indicators, and the type of water body or medium (surface water, ground water, sediment, etc.) being sampled. There are a variety of methods for designing programs and selecting sites to monitor (Figure 21). A probabilistic approach selects stations at random from a set of possible sites and can be used when the objective is to statistically characterize water quality in a given watershed or subwatershed (i.e., 75% of waters are fully supporting their uses, 15% are partially supporting, and 10% are not supporting use). A targeted approach selects stations at critical assessment locations, such as upstream and downstream of a known discharge. Targeted sampling is needed to characterize specific impacts or to obtain data on a specific waterbody (e.g. identifying waters for 303(d) listing, or evaluating effectiveness of BMPs below a project, or calibrating a model) or watershed (e.g., sources of stress on water quality). A rotating basin approach monitors sites on a rotating cycle (e.g. five-year) - each basin is monitored for a specified period (e.g. one year) before sampling the next basin in the cycle.
Figure 21: It is important to design programs that are efficient and scientifically valid. Sampling designs can be selected to accommodate a range of assessment objectives and spatial scales unique to each program.
Figure 20

WATERSHED ACADEMY WEB Overview of Watershed Monitoring http://www.epa.gov/watertrain
13
A fixed station approach is designed to collect samples at regular sites on a continuous basis. This approach is often used for small scale sampling efforts or long-term research studies. Locating appropriate monitoring sites should also take into account factors such as convenience, safe access, and representativeness.
Sampling Frequency:
Determining a sampling frequency depends on similar factors - study objectives, the type of water body or medium, the data variability, the time frame of negative impacts (some sources of impairment may cause considerable damage in brief, hard-to-detect events), and the available resources. Monitoring can be conducted at regular sites on a continuous basis (fixed station monitoring); randomly on a probabilistic basis to establish statistical relationships (e.g., to make inferences on overall water quality characteristics throughout a watershed); at selected sites on an as needed basis or to answer specific questions (intensive surveys); on a temporary or seasonal basis (for example, during the summer at bathing beaches); or infrequently on an emergency basis (such as after a spill or flood).
Statistical Survey Design
Environmental monitoring designs generally fall into three basic types:
• Random sampling • Systematic sampling • Stratified random sampling
Many references are available that provide summaries of various sampling designs and recommendations for the conditions in which a given design is appropriate (e.g., Gilbert, R.O. 1987. Statistical Methods for Environmental Pollution Monitoring. Van Nostrand Reinhold, New York. 320 pp.). Probability-based sampling designs avoid bias in the results of sampling. For example, suppose a water quality agency only sampled those sites for which they had received complaints from residents and users of the waterbodies. This sample would be biased (towards the worst sites), because the only sites sampled were those with known or perceived problems. A probability design requires that all sampling units have a known probability of being selected. In simple random sampling, all sampling units have an equal probability of selection. Systematic sampling occurs when measurements are taken at locations and/or times according to a spatial or temporal pattern, for example, at equal intervals along a line or in a grid pattern. In stratified designs, the selection probabilities may differ among strata (subsets of the population). For example, the target population may be divided into non-overlapping parts or subregions (e.g., ecoregions, watersheds) and then sample sites are randomly selected fro m within each strata.
Statistically related design and data management considerations require an understanding of basic statistical terms and concepts. Statistical analyses are an important part of the assessment process and the evaluation of monitoring data. Spreadsheets and database computer software are tools that can be used to maintain data and calculate statistical relationships in large sets of raw data (e.g., mean, minimum, maximum, standard deviation, etc.). Statistically significant results are also critical in making the raw data interpretable and defensible for regulatory requirements. Detailed statistics training is beyond the scope of this module, but descriptions and example calculations can be found in statistics text books, sampling design literature, and spreadsheet help files.

WATERSHED ACADEMY WEB Overview of Watershed Monitoring http://www.epa.gov/watertrain
14
Sampling Protocols:
Before sampling, it is important to establish sampling protocols and standard methods for field and laboratory analyses. The object being sampled and the methods of sampling may vary widely. Your program may collect water samples, substrate samples, or various types of aquatic plants or animals, all demanding special protocols for collection and storage. Samples may be collected by hand (manual samples), by using an automated sampler, as individual point-in-time samples (grab or discrete samples), or combined with other samples (composite samples). Each of these techniques must follow standard procedures that often vary by parameter analyzed and medium sampled. For example, you need to consider whether a sample requires special handling equipment (such as glass containers required for oil and grease analyses), preservatives (such as nitric acid required for metals), temperature control (most samples need to be stored on ice or refrigerated), or special holding times (fecal coliform bacteria samples must be collected and delivered to the laboratory for analysis within 6 hours).
Quality assurance and quality control (QA/QC) procedures also ensure that monitoring data will be of known quality. Quality assurance focuses on systems, policies, procedures, program structures, and delegation of responsibility that will result in reliable, high-quality data. Quality control is a group of specific procedures, such as sample collection, equipment calibration, and analytical procedures, designed to meet defined data quality objectives. Additionally, using standardized protocols helps to ensure data comparability when more than one agency or organization is collecting the same type of data. Finally, an implementation plan ties the design components all together by documenting who will monitor, how the program will be conducted, and when sampling will take place.
Because of the importance of QA/QC in environmental monitoring, USEPA requires a Quality Assurance Program Plan (QAPP) for all sampling programs receiving federal funding. No matter how small their monitoring effort is, any local, grass-roots monitoring group should follow QA/QC guidelines and any guidance available from their specific state, if they wish to ensure that their data are acceptable to state monitoring programs as well as their own local interests. Sample designs and corresponding implementation plans should be periodically revisited to ensure that objectives are being achieved and to adapt them as needed. Often, experience in the field will help fine-tune designs to optimize the monitoring program.
To better understand monitoring program development strategies, including sampling design considerations, visit the following real-world case study.
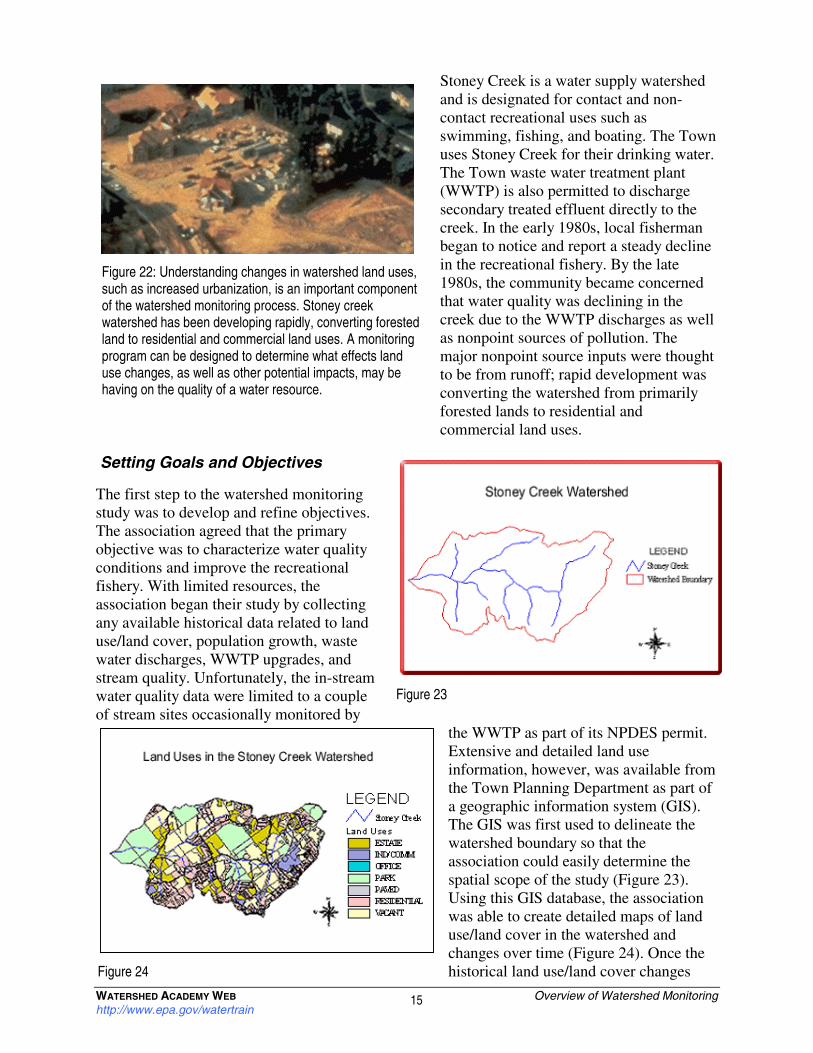
Stoney Creek Watershed Monitoring Case Study (Figure 22)
Getting Organized
The Stoney Creek Watershed Association was formed to address a growing public perception - that water quality was degraded and being reflected in the size and quality of fish caught by local anglers. Based on this concern, the Association was formed in 1990. Concerned citizens along with financial and technical assistance from the Town of Peterson and the local water and sewer authority, developed a list of questions, concerns, and objectives. Eventually, the group decided to initiate a water quality characterization study of Stoney Creek to evaluate the true condition of the resource and ways to improve it.
WATERSHED ACADEMY WEB Overview of Watershed Monitoring http://www.epa.gov/watertrain
15
Stoney Creek is a water supply watershed and is designated for contact and non-contact recreational uses such as swimming, fishing, and boating. The Town uses Stoney Creek for their drinking water. The Town waste water treatment plant (WWTP) is also permitted to discharge secondary treated effluent directly to the creek. In the early 1980s, local fisherman began to notice and report a steady decline in the recreational fishery. By the late 1980s, the community became concerned that water quality was declining in the creek due to the WWTP discharges as well as nonpoint sources of pollution. The major nonpoint source inputs were thought to be from runoff; rapid development was converting the watershed from primarily forested lands to residential and commercial land uses.
Setting Goals and Objectives
The first step to the watershed monitoring study was to develop and refine objectives. The association agreed that the primary objective was to characterize water quality conditions and improve the recreational fishery. With limited resources, the association began their study by collecting any available historical data related to land use/land cover, population growth, waste water discharges, WWTP upgrades, and stream quality. Unfortunately, the in-stream water quality data were limited to a couple of stream sites occasionally monitored by
the WWTP as part of its NPDES permit. Extensive and detailed land use information, however, was available from the Town Planning Department as part of a geographic information system (GIS). The GIS was first used to delineate the watershed boundary so that the association could easily determine the spatial scope of the study (Figure 23). Using this GIS database, the association was able to create detailed maps of land use/land cover in the watershed and changes over time (Figure 24). Once the historical land use/land cover changes
Figure 22: Understanding changes in watershed land uses, such as increased urbanization, is an important component of the watershed monitoring process. Stoney creek watershed has been developing rapidly, converting forested land to residential and commercial land uses. A monitoring program can be designed to determine what effects land use changes, as well as other potential impacts, may be having on the quality of a water resource.
Figure 23
Figure 24

WATERSHED ACADEMY WEB Overview of Watershed Monitoring http://www.epa.gov/watertrain
16
Figure 25
were better understood, the next step was to determine the effects to the creek by designing a water quality monitoring program.
Sampling Design
Based on the potential nonpoint source inputs caused by development throughout the watershed and the WWTP point source input, the Association decided to utilize a stratified random sampling approach. The effect of the WWTP was a special interest of the study, so sample sites were selected immediately upstream and downstream of the facility. These stations also matched the WWTP stream sites previously monitored, allowing for direct comparison of study data and historical data. The remaining sampling stations were selected at random, stratified by the upstream and downstream portions of the watershed. A great advantage of using a random sampling design is that statisticians have developed procedures for calculating confidence intervals for the estimates. For example, we do not know with certainty whether an individual water quality measurement is representative of the creek as a whole. The confidence intervals are affected by sample size and natural variability of the data. For repeated sampling, however, we could calculate a confidence interval (e.g. 90% confidence interval) that any parameter measurement would fall within that percentage of the time, thus illustrating the probable range of water quality conditions. After evaluating the statistical considerations, available funding, and site accessibility and safety issues, a total of six monitoring stations were selected for the study (Figure 25).
Implementing the Monitoring Program
Because the Association lacked the expertise to conduct an extensive sampling effort, they contracted the services of an experienced environmental consulting firm. The consulting team assisted in sample design, parameter selection, equipment procurement, and training in proper QA/QC procedures in accordance with state and federal regulations. Laboratory costs were minimized by establishing an agreement with the local water and sewer authority’s certified laboratory. The consulting firm suggested a monitoring program designed to collect both dry- and wet-weather stream samples. This approach provides a clearer picture of the relative pollutant contributions of continuous point source inputs and episodic nonpoint source impacts. The dry weather samples were collected monthly. Manual grab samples were collected, stored on ice, and sent to the water treatment plant for laboratory analyses. These analyses included nutrients (nitrogen and phosphorus), coliform bacteria, suspended solids, and some metals (lead, zinc, and cadmium). Field measurements of pH, dissolved oxygen, conductivity, and temperature were recorded at each sampling station using a multi-parameter water quality meter. Due to the difficulties of collecting wet-weather samples, composite samples were collected manually only five or six times a year. Flow measurements were also recorded for each sampling event by developing stage discharge relationships (rating curves) at each site and installing stream gauges. The flow data were crucial for calculating the relative loading rates of pollutants during dry weather flows versus runoff events. Because the initial
WATERSHED ACADEMY WEB Overview of Watershed Monitoring http://www.epa.gov/watertrain
17
concern and objective of the program was to evaluate the recreational fishery, the study also collected biological and habitat information.
Benthic macroinvertebrate samples, fish samples, and riparian and stream channel habitat assessments were used to evaluate biological health and habitat quality.
Data Management
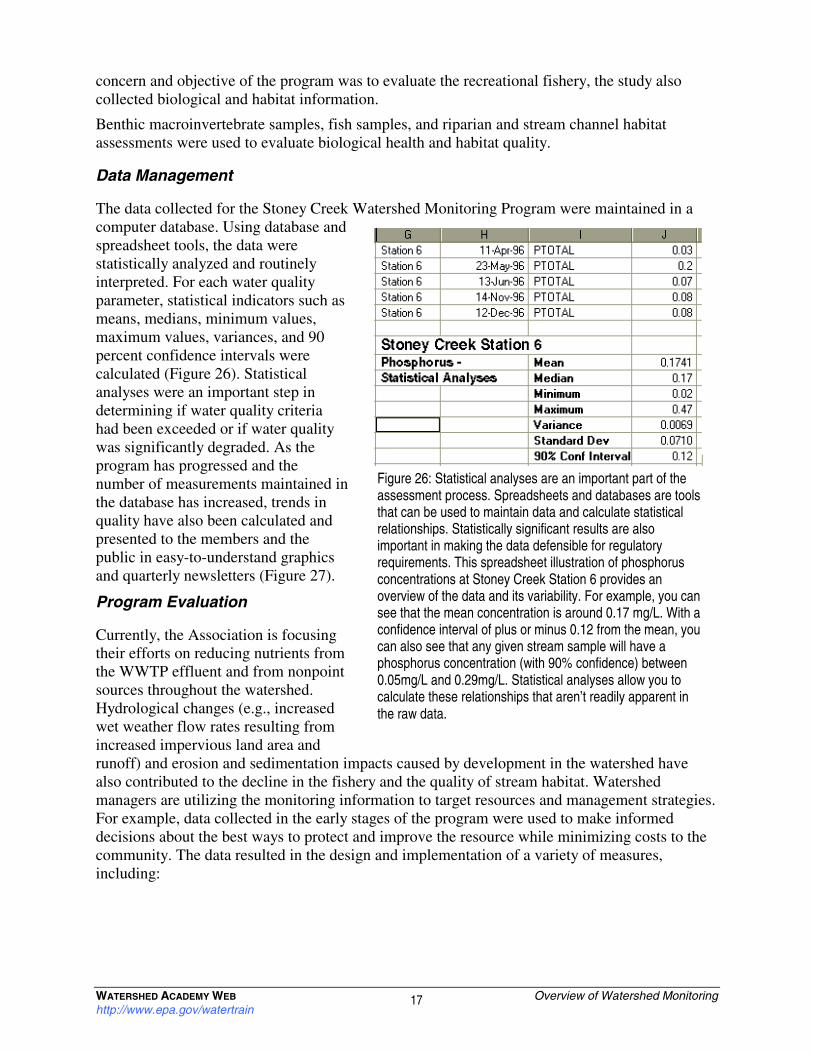
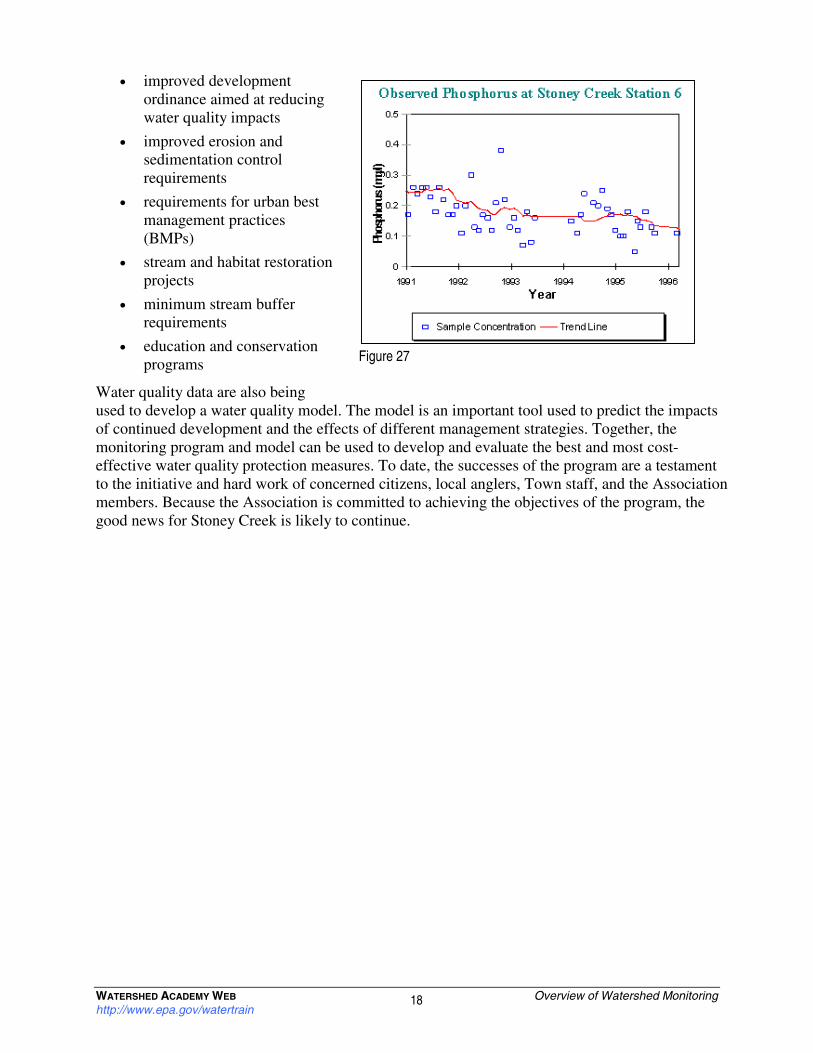
The data collected for the Stoney Creek Watershed Monitoring Program were maintained in a computer database. Using database and spreadsheet tools, the data were statistically analyzed and routinely interpreted. For each water quality parameter, statistical indicators such as means, medians, minimum values, maximum values, variances, and 90 percent confidence intervals were calculated (Figure 26). Statistical analyses were an important step in determining if water quality criteria had been exceeded or if water quality was significantly degraded. As the program has progressed and the number of measurements maintained in the database has increased, trends in quality have also been calculated and presented to the members and the public in easy-to-understand graphics and quarterly newsletters (Figure 27).
Program Evaluation
Currently, the Association is focusing their efforts on reducing nutrients from the WWTP effluent and from nonpoint sources throughout the watershed. Hydrological changes (e.g., increased wet weather flow rates resulting from increased impervious land area and runoff) and erosion and sedimentation impacts caused by development in the watershed have also contributed to the decline in the fishery and the quality of stream habitat. Watershed managers are utilizing the monitoring information to target resources and management strategies. For example, data collected in the early stages of the program were used to make informed decisions about the best ways to protect and improve the resource while minimizing costs to the community. The data resulted in the design and implementation of a variety of measures, including:
Figure 26: Statistical analyses are an important part of the assessment process. Spreadsheets and databases are tools that can be used to maintain data and calculate statistical relationships. Statistically significant results are also important in making the data defensible for regulatory requirements. This spreadsheet illustration of phosphorus concentrations at Stoney Creek Station 6 provides an overview of the data and its variability. For example, you can see that the mean concentration is around 0.17 mg/L. With a confidence interval of plus or minus 0.12 from the mean, you can also see that any given stream sample will have a phosphorus concentration (with 90% confidence) between 0.05mg/L and 0.29mg/L. Statistical analyses allow you to calculate these relationships that aren’t readily apparent in the raw data.
WATERSHED ACADEMY WEB Overview of Watershed Monitoring http://www.epa.gov/watertrain
18
• improved development ordinance aimed at reducing water quality impacts
• improved erosion and sedimentation control requirements
• requirements for urban best management practices (BMPs)
• stream and habitat restoration projects
• minimum stream buffer requirements
• education and conservation programs
Water quality data are also being used to develop a water quality model. The model is an important tool used to predict the impacts of continued development and the effects of different management strategies. Together, the monitoring program and model can be used to develop and evaluate the best and most cost-effective water quality protection measures. To date, the successes of the program are a testament to the initiative and hard work of concerned citizens, local anglers, Town staff, and the Association members. Because the Association is committed to achieving the objectives of the program, the good news for Stoney Creek is likely to continue.
Figure 27

WATERSHED ACADEMY WEB Overview of Watershed Monitoring http://www.epa.gov/watertrain
19
Implement Sampling Program Once the preliminary sampling design steps have been considered, it’s time to implement your monitoring program and begin collecting data (Figure 28).
Procuring Equipment:
In order to implement a sampling program, it is necessary to first obtain proper equipment. The types of equipment depend on the medium sampled, the required precision and accuracy, and available funding. Equipment and laboratory costs are often the most expensive components of a monitoring program, so care should be taken to select the right tools for the job. Examples of equipment commonly used for water quality monitoring studies include (pages 19 and 20 for photos of each of the following):
• Field meters • Test kits • Velocity meters • Automated sampling equipment • Rain gages • Sample collection bottles • Nets and electroshocking devices • Flow measuring devices
Figure 28: After the preliminary planning steps are completed, it’s time to implement the sampling program and begin collecting data.
WATERSHED ACADEMY WEB Overview of Watershed Monitoring http://www.epa.gov/watertrain
20
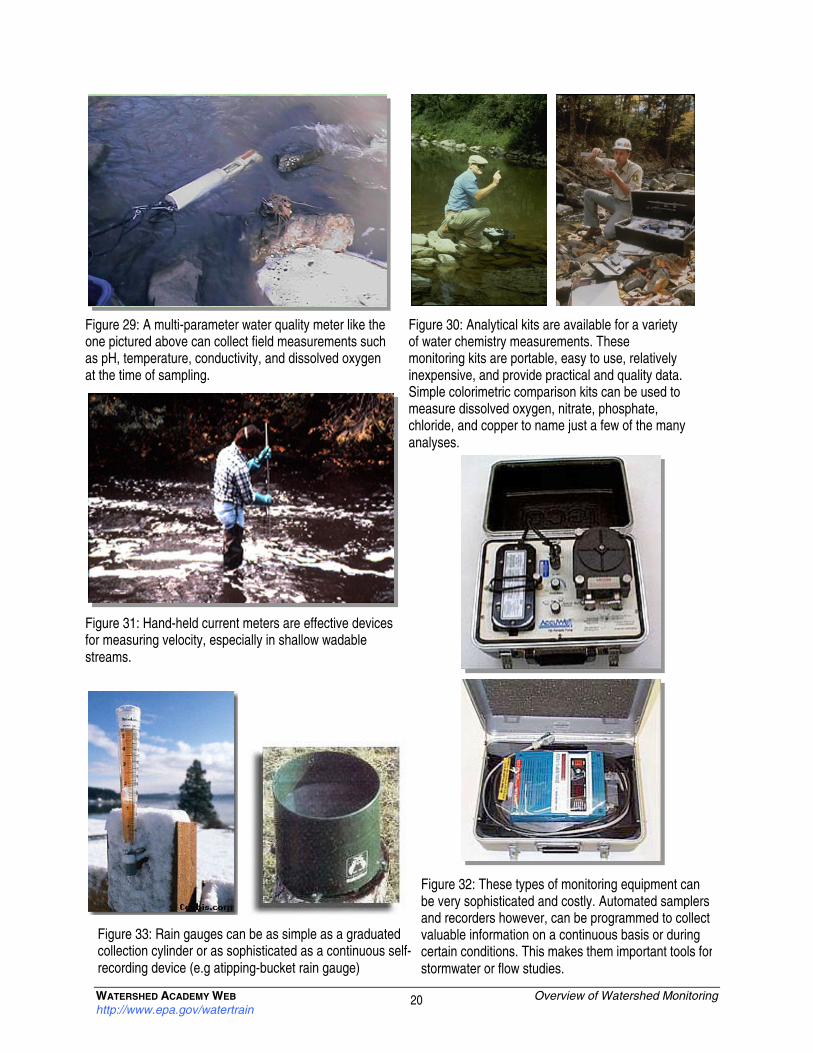
Figure 29: A multi-parameter water quality meter like the one pictured above can collect field measurements such as pH, temperature, conductivity, and dissolved oxygen at the time of sampling.
Figure 30: Analytical kits are available for a variety of water chemistry measurements. These monitoring kits are portable, easy to use, relatively inexpensive, and provide practical and quality data. Simple colorimetric comparison kits can be used to measure dissolved oxygen, nitrate, phosphate, chloride, and copper to name just a few of the many analyses.
Figure 33: Rain gauges can be as simple as a graduated collection cylinder or as sophisticated as a continuous self-recording device (e.g atipping-bucket rain gauge)
Figure 32: These types of monitoring equipment can be very sophisticated and costly. Automated samplers and recorders however, can be programmed to collect valuable information on a continuous basis or during certain conditions. This makes them important tools forstormwater or flow studies.
Figure 31: Hand-held current meters are effective devices for measuring velocity, especially in shallow wadable streams.

WATERSHED ACADEMY WEB Overview of Watershed Monitoring http://www.epa.gov/watertrain
21
Figure 34: Bottles or plastic containers are used to collect and store water samples that must be transported from the field to the laboratory for analysis. For certain parameters of interest (e.g., metals and nutrients) the sample container must contain preservatives to protect the integrity of the water sample. Proper handling protocol also requires that most sample bottles be placed in ice until they are analyzed at the laboratory.
Figure 35: Nets and electroshocking devices are important tools for biological monitoring and fish studies.
Figure 36: Flow measuring include portable instruments and fixed devices such as weirs and flumes. As illustrated in the above photo, a weir and water level recorder can provide measurements for a wide range of flows.

WATERSHED ACADEMY WEB Overview of Watershed Monitoring http://www.epa.gov/watertrain
22
Biological surveys and physical habitat assessments may also require a variety of equipment. For example, Rapid Bioassessment Protocols (RBPs) are techniques for collecting biological and habitat information at stream sites. RBPs have an extensive equipment list that can include cameras, waders, nets, electro-shocking devices, taxonomic field guides, collection and sorting containers, and other measurement devices. If you are interested in learning more about RBPs, including the necessary equipment, field techniques, and environmental assessment methods, you can visit the the Academy 2000 Rapid Bioassessment Protocols Module.
Providing Training:
Training is necessary to properly use sampling equipment and obtain accurate results. Training may be required for:
• Equipment calibration and maintenance
• Proper sampling, handling, and preservation techniques
• Proper documentation and record keeping
• Proper chain-of-custody and transporting procedures
Determine who needs to be trained, who can do the training, and how to best use available time and funds to complete the training (Figure 37).
Field Preparation:
Now its time to prepare for the sampling day—some of the preparation duties are making sure equipment is available and working properly, calibrating instruments, preparing sample bottles, labeling station maps, preparing observation sheets and chain-of-custody forms, and making arrangements with the laboratory. Having the sampling design documented in a QA/QC implementation plan helps guide this preparation process. It is important to remember that the better the preparation, the smoother the day of sampling will be. Once everything is in order, you’re finally ready to get your feet wet and begin monitoring!
Data and Information Management Observations and measurements collected in the field and analyzed at the laboratory are all valuable sources of data. Monitoring data, however, has little value if not recorded and managed properly. Data management begins with proper collection and record-keeping in the field (Figure 38). Data quality can be assured by properly following all quality assurance and quality control (QA/QC) procedures established during the design stage. Its also important to look for inconsistencies and problems with the data
Figure 37: Training and proper QA/QC procedures are essential components to a successful monitoring effort. Training is necessary to properly use sampling equipment, obtain acurate results, and ensure the quality of data.
Figure 38

WATERSHED ACADEMY WEB Overview of Watershed Monitoring http://www.epa.gov/watertrain
23
collected. For example, you should:
• Review findings against previous years’ data. • Look for outliers on graphs and maps. • Investigate findings that are unusual or can’t be explained.
A field log entry and/or observation sheet should be completed at each sampling site. Once the data is recorded, it can be transferred to (or directly downloaded to) an electronic management system. Today’s computer software includes a variety of spreadsheet and database pakages that allow you to sort, manipulate, and perform statistical analyses on the data. For ost applications, spreadsheets are adequate and have the advantage of being relatively simple to use. Most spreadsheet pakages have graphic capabilities that will allow you to plot your data onto a graph of your choice (e.g. bar, line, or pie chart).
An effective way to display your data is on a map of the waterbody or watershed. This illustrates the relationship between land use and the quality of water, habitat, and biological communities. This type of graphic display can be used to effectively show the correlation between specific activities or land uses and the impacts they have on the ecosystem. Systems that allow you to map this information (e.g. land use, soils, waterbodies, industrial discharge sites, etc.) with spatial references (latitude and longitude) are known as Geographic Information Systems (GIS).
Data management systems include technical and managerial components. The technical components involve selecting appropriate computer equipment and software and designing the database, including data definition, data standardization, and a data dictionary. The managerial components include data entry, data validation and verification, and data access. As a data system is designed, it should incorporate the ability to transfer information among organizations, allow easy access for users, utilize common data descriptors, and provide metadata summaries.
Assessment and Reporting Collecting and storing data is not sufficient to meet program objectives—data should be routinely interpreted, assessed and reported (Figure 39). A successful watershed monitoring program should produce
Figure 39: Progress reports, such as the Newsletter of the Chesapeake Bay Foundation, keep the public informed of program goals, progress and achievements, upcoming events, and ways to assist or become actively involved in the cause.

WATERSHED ACADEMY WEB Overview of Watershed Monitoring http://www.epa.gov/watertrain
24
reports that summarize key findings to volunteers, state water quality agencies, local planning boards, the media, and/or the general public.
State water quality agencies will require detailed reports, while shorter and less technical summaries may be more appropriate for other groups. Simple charts, summary tables, and maps with accompanying explanations can be especially useful. The reports should include a brief description of the program, the purpose of the monitoring, an explanation of the parameters that were monitored, the location of sample sites, a summary of the results, and any recommendations that may have been made. Summarizing and displaying data in reports is more informative than raw data and allows interested individuals to understand what the data really indicate about the watershed and its water quality condition. The indicators selected for reporting should be linked to monitoring objectives so that goals and progress can be compared. Also, routine interpretation helps to reveal potential problems in the monitoring program design or implementation so that effective adjustments can be made as needed.
Providing public access and educational opportunities are important components to a successful watershed monitoring program. If citizens and stakeholders aren’t adequately informed and educated, progress can be limited. Reporting progress in brochures, reports, presentations, community meetings, and on websites can increase interest in a watershed protection or restoration effort.
Other innovative approaches to public education and water resource protection can keep your watershed group’s objectives in the public eye (Figure 40). Examples include stormdrain stenciling programs, stream clean-up events, volunteer adopt-a-stream projects, and waterbody appreciation days (e.g. riverside cookouts, rafting trips, canoe races, fishing derby, park dedications, etc.). These events are excellent opportunities to involve the entire community and the local media (newspapers, local radio, and television) and help get your message out—it also allows your monitoring group to celebrate successes, be recognized, and feel a sense of accomplishment for their hard work.
Now that you have successfully completed the Overview of Watershed Monitoring module, you can evaluate your understanding by taking the module test on page 30.
Figure 40: Finding fun and interesting ways to draw the public out into the watershed can raise awareness of conditions and help you to get your message out.

WATERSHED ACADEMY WEB Overview of Watershed Monitoring http://www.epa.gov/watertrain
25
Acknowledgments Helpful technical reviews were provided by Mark Barath, Susan Holdsworth, Charlie Howell,Doug Norton, Dann Sklarew, Robert Steiert, Tim Sweeney, and Tom Weber.
For Further Information on State Water Quality Monitoring, visit http://www.epa.gov/owow/monitoring/vol.html or www.epa.gov/owow/monitoring/calm.html.
Glossary Abundance. As a watershed monitoring measure, the number of organisms present.
Acute (pollution inputs). Episodic or randomly occurring inputs of pollution to a water body. Examples include stormwater runoff that only enters a receiving water during storm events, but may have long-lasting impacts to the system.
Ambient monitoring. All forms of monitoring conducted beyond the immediate influence of a discharge pipe or injection well and may include sampling of sediments and living resources.
Assessment. The translation of scientific data into policy-relevant information that is suitable for supporting decision-making and action.
Benthic macroinvertebrates or benthos. Organisms attached to or resting on the bottom or living in the bottom sediments of a water body.
Bioaccumulation. The net uptake of a material by an organism from food, water, and/or respiration that results in elevated internal concentrations and the progressive increase of the bodily content of a toxic compound. This occurs as organisms feed on each other and concentrate the toxic compound as it moves up the food chain.
Biological monitoring (or biomonitoring). The use of a biological entity as a detector and its response as a measure to determine environmental conditions. Toxicity tests and biological surveys are common biomonitoring methods
Biological parameters. Include measures related to the plant and animal life of the water body, such as fish species diversity and abundance, or the presence or absence of indicator fishes, aquatic invertebrates, or aquatic plants.
Calibration. To adjust a measuring instrument so that it correctly reads a known standard.
Chain-of-custody. A method of tracking collection and analysis procedures, including each person who handles a sample.
Chemical parameters. Include contaminants such as metals, dissolved nutrients, oils, and pesticides, and also include chemical properties of the aquatic system such as dissolved oxygen, chemical oxygen demand, and acid neutralizing capacity.
Chronic (pollution inputs). Pollution inputs marked by long durations and frequent recurrence. Examples include continuous municipal or industrial wastewater discharges.

WATERSHED ACADEMY WEB Overview of Watershed Monitoring http://www.epa.gov/watertrain
26
Compliance monitoring. A type of monitoring done to ensure the meeting of immediate statutory requirements, the control of long-term water quality, the quality of receiving waters as determined by testing effluents, or the maintenance of standards during and after construction of a project (modified from Resh, D. M., and Rosenberg, V.H., eds., 1993, Freshwater Biomonitoring and Benthic Macroinvertebrates: New York, Chapman and Hall, 488 p).
Composition. In watershed monitoring, the types of organisms collected.
Data Quality Objectives (DQOs). In the context of water quality monitoring, the characteristics or goals that are determined by a monitoring or interpretive program to be essential to the usefulness of the data. They would include, but not be limited to, the specification of delineation of the limits of precision and bias of measurements, the completeness of sampling and measurements, the representativeness of sites relative to program objectives, the validity of data, and so forth.
Designated Use. Water use taking place within a waterbody and/or protected for continued future utilization; e.g., hydro-electric power generation, navigation, drinking water supply, fish propagation, recreation (swimming, boating, fishing, etc.).
Diversity (of aquatic species). The variety of different species detected through monitoring in a given area. Other types of diversity sometimes addressed by monitoring include genetic and habitat diversity.
Ecological conditions. The degree of functionality or health of an ecosystem, measured by a broad array of indicators of condition that include biotic characteristics (e.g., native plant communities, fish or invertebrate populations, species and habitat biodiversity) and abiotic characteristics (e.g., streambank stability and erosion, assimilation and cycling of nutrients, maintenance of sufficient flow and water temperature).
Effectiveness monitoring. Documents how well the management practices meet intended objectives. Monitoring evaluates the cause and effect relations between management activities and conditions of the riparian dependent resources. Terrestrial and instream methods constitute monitoring that evaluates and documents the total effectiveness of site-specific actions.
Environmental indicator. A measurable feature or features that provide managerially and scientifically useful evidence of environmental and ecosystem quality or reliable evidence of trends in quality.
Fixed-station monitoring. The repeated long-term sampling or measurement of parameters at representative points for the purpose of determining environmental quality characteristics and trends.
Hydrology. Dealing with the properties, distribution, and circulation of water on or below the earth’s surface and in the atmosphere.
Implementation monitoring. Documents whether or not management practices were applied as designed. Project and contract administration is a part of implementation monitoring.
Meta-data summaries. Information that describes the content, quality, condition, and other characteristics of data.
Monitoring. Periodic or continuous collection of data (measured parameters) using consistent methods to determine the status (the condition of the ecological resources) of a water body and watershed and the changes in those measurements over time.

WATERSHED ACADEMY WEB Overview of Watershed Monitoring http://www.epa.gov/watertrain
27
Nutrients. Elements like nitrogen and phosphorus that are essential to healthy plant life, but in excess are detrimental to water quality.
Physical parameters. Include general conditions such as temperature, flow, sediment characteristics, water color, and within-channel habitat structure.
Preservation (of field samples). Using chemicals to “fix” samples in the field so that parameter concentrations don’t change en route to the lab.
Quality assurance/quality control (QA/QC). A system of procedures, checks, audits, and corrective actions to ensure that all EPA research design and performance, environmental monitoring and sampling, and other technical and reporting activities are of the highest achievable quality.
Remediation. Action taken to correct or treat a pollution problem.
Representativeness. A desirable quality for a monitoring sample site or station, which exhibits physical, chemical, and biological characteristics typical of the water body or medium being sampled.
Response indicator. An environmental indicator measured to provide evidence of the biological condition of a resource at the organism, population, community, or ecosystem level of organization.
Risk Assessment. A method for evaluating the likelihood of occurrence of an adverse effect as a result of exposure to one or more stressors.
Stage-discharge relationship. A comparison of depth of water vs. flow rate in a stream or river.
Total Maximum Daily Load (TMDL). A calculation of the maximum amount of a pollutant that a waterbody can receive and still meet water quality standards, and an allocation of that amount to the pollutant’s sources. Water quality standards are set by States, Territories, and Tribes. They identify the uses for each waterbody, for example, drinking water supply, contact recreation (swimming), and aquatic life support (fishing), and the scientific criteria to support that use. A TMDL is the sum of the allowable loads of a single pollutant from all contributing point and nonpoint sources. The calculation must include a margin of safety to ensure that the waterbody can be used for the purposes the State has designated. The calculation must also account for seasonal variation in water quality. (From federal Clean Water Act)
Turbidity. A measure of water clarity. Turbidity, or cloudiness, can be caused by different sources of suspended particles in the water (e.g., suspended sediment or algae).
Validation monitoring. Determines if predictive model coefficients are adequately protecting the targeted resources. A long-term commitment to data collection is often required to establish an adequate data base. If the standard, which requires use of 50 percent or less of streamside herbaceous forage, for example, fails to achieve the desired instream habitat condition, then the standard would have to be modified for less forage consumption in the riparian complex(es).
Water quality assessment. The determination whether a water body is attaining its designated uses for such purposes as drinking, contact recreation, fisheries, and irrigation, based on state Water Quality Standards as provided for in the Clean Water Act of 1987.

WATERSHED ACADEMY WEB Overview of Watershed Monitoring http://www.epa.gov/watertrain
28
Water quality monitoring. An integrated activity for evaluating the physical, chemical, and biological characteristics of water in relation to human health, ecological conditions, and designated water uses.
Water quality standards. State-adopted and EPA-approved ambient standards for water bodies, that prescribe the use of the water body and establish the water quality criteria that must be met to protect these uses. The three components of water quality standards include the beneficial designated use or uses of a water body (for example, drinking water supply, contact recreation (swimming), and aquatic life support), the numerical and narrative water-quality criteria that are necessary to protect the use or uses of that particular water body, and an antidegradation statement. (From federal Clean Water Act)
Water resource quality. The condition of water or some water-related resource as measured by biological surveys, habitat-quality assessments, chemical-specific analyses of pollutants in water bodies, and toxicity tests; or, the condition of water or some water-related resource as measured by the following: habitat quality, energy dynamics, chemical quality, hydrological regime, and biotic factors.
Watershed monitoring. Monitoring primarily designed to sample and assess the characteristics and/or condition of a watershed or watersheds, or to sample and assess specific entities on a watershed basis (i.e. as a geographic unit for sampling). For example, water quality monitoring conducted on a watershed basis would include monitoring physical, chemical, and biological condition of the water body as well as specific watershed characteristics (e.g., stream corridor traits, wetlands, and watershed land use/land cover patterns) that may be related to observed water quality.
Statistical Sampling Terms
Accuracy. (Statistical sampling meaning) The closeness of a measurement to the true value of the parameter measured.
Bias. (Statistical sampling meaning) A type of survey sampling error resulting from the sample not perfectly representing the population it is drawn from.
Estimation. (Statistical sampling meaning) The description of certain numerical characteristics of a population; the main method of inference used in sample surveys.
Precision. (Statistical sampling meaning) The repeatability of a measurement.
Probability-based sampling. (Statistical sampling meaning) A sampling method in which randomness is built into the design so that properties of the sampled population can be assessed in terms of their likelihood of ocurrence or existence.
Random sampling. (Statistical sampling meaning) A sampling method in which every possible sample has the same chance of being selected.
Sample. (Statistical sampling meaning) A collection of sampling units drawn from a sampling frame.
Sampling design. (Statistical sampling meaning) All of the details concerning sampling units, sample selection, timing, spatial distribution and other issues involved in gaining sufficient sampling data for a monitoring and assessment program.
Sampling frame. (Statistical sampling meaning) A list of sampling units from which a subset (sample) can be drawn.

WATERSHED ACADEMY WEB Overview of Watershed Monitoring http://www.epa.gov/watertrain
29
Sampling frequency. (Statistical sampling meaning) The interval, as measured in space or in time, between sampling events; often this refers to temporal frequency of repeating the same monitoring procedure.
Sampling population. (Statistical sampling meaning) A set of measurements, about which inferences are made.
Sampling units. (Statistical sampling meaning) A non-overlapping set of measurements that covers an entire sampling population.
Statistically significant results. (Statistical sampling meaning) Sampling data that collectively meet or exceed data quality objectives or pass a statistical testing method, and therefore can support or disprove a hypothesis or other inference.
Stratified random sampling. (Statistical sampling meaning) A sampling method in which the population is separated into groups (strata) usually based on some internal similarities, then selecting a random sample within each stratum.
Systematic sampling. (Statistical sampling meaning) A sampling method in which sample selection begins at a random starting point but subsequently selects additional sampling units at equal intervals along a stated gradient or numbered list; for example, sampling a river channel’s width and depth at 1-kilometer intervals along its full length.
Trends and changes. (Statistical sampling meaning) A trend is the consistent directional change in a population’s characteristics documented by a minimum of three sampling events over a period of time (or sometimes distance); a change is a difference in a characteristic between just two sampling events.

WATERSHED ACADEMY WEB Overview of Watershed Monitoring http://www.epa.gov/watertrain
30
Self Test for Overview of Watershed Monitoring Module
After you’ve completed the quiz, check your answers with the ones provided on page 33 of this document. A passing grade is 7 of 10 correct or 70%. 1. The difference between water quality monitoring and watershed monitoring is:
A. Watershed monitoring is less expensive to conduct
B. Watershed monitoring is a more comprehensive approach to data collection that incorporates water quality as well as watershed conditions
C. There is no difference
D. None of the above 2. Watershed monitoring can be used to:
A. Identify probable source(s) of water quality impairment
B. Provide input for management tools such as models
C. Support scientifically-based management decisions
D. All the above 3. Which of the following is not a common objective of water quality monitoring programs:
A. Characterize conditions and trends
B. Respond to emergencies
C. Preserve popular camping areas
D. Assess program goals and progress 4. Aquatic plants are examples from which category of water quality indicators:
A. Physical parameters
B. Chemical parameters
C. Biological parameters
D. Habitat
E. A and C
F. C and D
G. A, B, C, and D
WATERSHED ACADEMY WEB Overview of Watershed Monitoring http://www.epa.gov/watertrain
31
5. Which of the following may be a good source of watershed information:
A. EPA’s STORET database
B. Local planning offices
C. Cooperative extension offices
D. All the above 6. Which of the following is not an example of a refined program objective:
A. Preserve and monitor local wetlands in order to protect endangered species habitat
B. Restore multiple river uses
C. Sample water quality and shellfish tissue to notify public of potential shellfish advisories
D. Monitor sedimentation and erosion control practices to improve and protect stream habitat. 7. An example(s) of monitoring design scenarios include:
A. Targeted sampling to characterize specific impacts
B. Probabilistic approach of selecting stations at random
C. A rotating basin cycle
D. All the above 8. Training is necessary to ensure the quality of data. Training may be required for:
A. Equipment calibration and maintenance
B. Proper sampling, handling, and preservation techniques
C. Proper documentation and record keeping
D. All the above 9. Which of the following types of equipment is not commonly used for water quality monitoring studies:
A. Weather vanes
B. Field meters
C. Analytical test kits
D. Flow meters
WATERSHED ACADEMY WEB Overview of Watershed Monitoring http://www.epa.gov/watertrain
32
10. Most monitoring programs require funding sources, but financial needs can be minimized through innovative approaches, including:
A. Partnering or collaboration agreements
B. Use of existing data
C. Volunteer groups
D. All the above

WATERSHED ACADEMY WEB Overview of Watershed Monitoring http://www.epa.gov/watertrain
33
Answers for Overview of Watershed Monitoring Module Self Test Q1: B Q2: D Q3: C Q4: F Q5: D Q6: B Q7: D Q8: D Q9: A Q10: D