Overview of the Talk - Higher School of Economics tightness... · Development of the concept of...
28
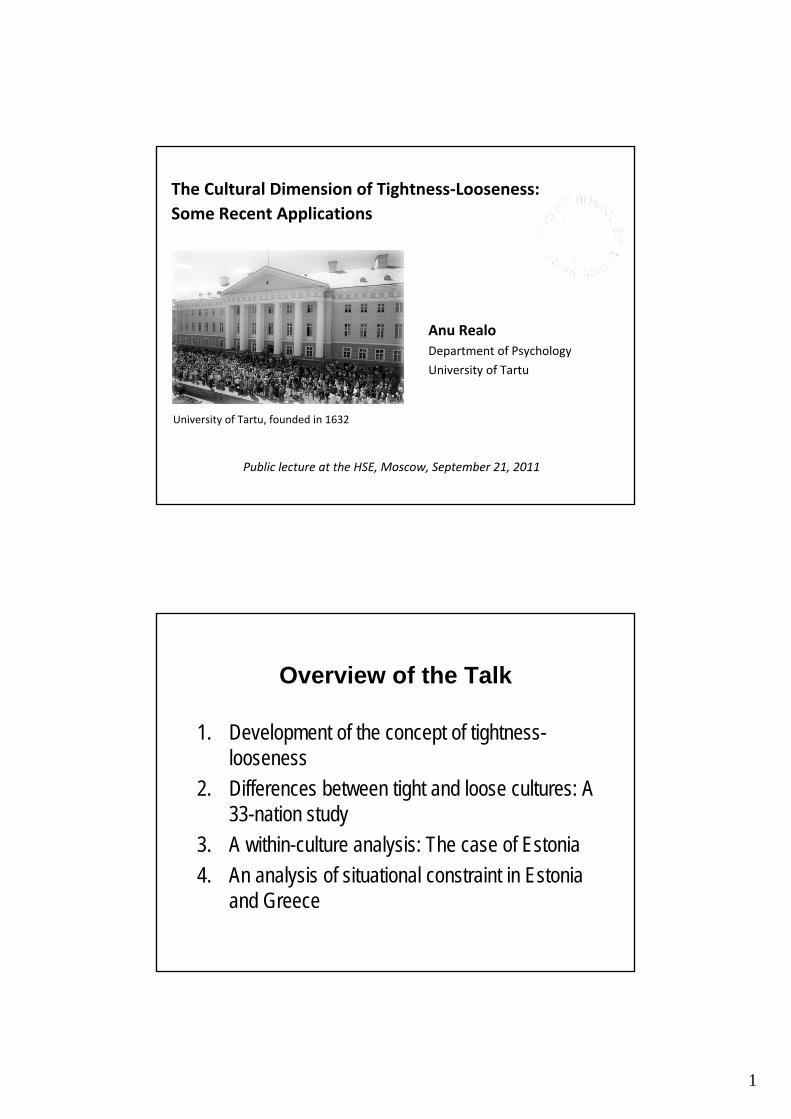
1 The Cultural Dimension of Tightness‐Looseness: Some Recent Applications Anu Realo Department of Psychology University of Tartu University of Tartu, founded in 1632 Public lecture at the HSE, Moscow, September 21, 2011 Overview of the Talk 1. Development of the concept of tightness- looseness 2. Differences between tight and loose cultures: A 33-nation study 3. A within-culture analysis: The case of Estonia 4. An analysis of situational constraint in Estonia and Greece
Transcript of Overview of the Talk - Higher School of Economics tightness... · Development of the concept of...
1
The Cultural Dimension of Tightness‐Looseness:Some Recent Applications
Anu RealoDepartment of Psychology
University of Tartu
University of Tartu, founded in 1632
Public lecture at the HSE, Moscow, September 21, 2011
Overview of the Talk
1. Development of the concept of tightness-looseness
2. Differences between tight and loose cultures: A 33-nation study
3. A within-culture analysis: The case of Estonia4. An analysis of situational constraint in Estonia
and Greece
2
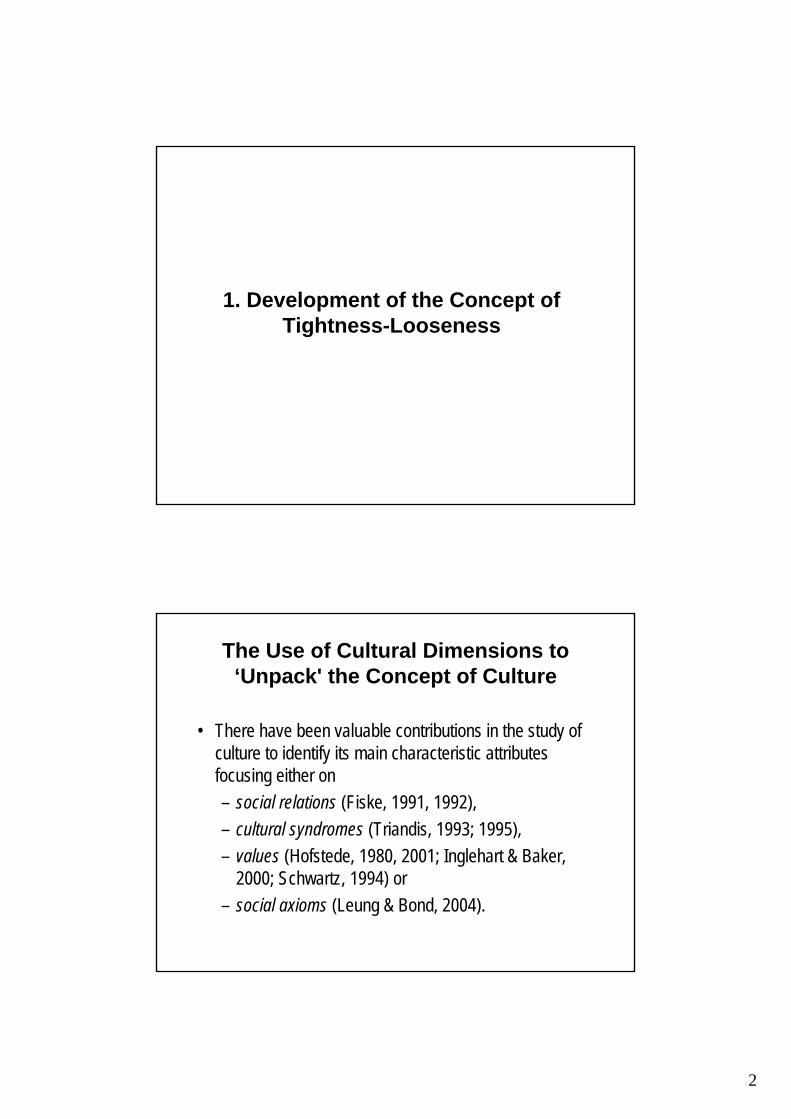
1. Development of the Concept of Tightness-Looseness
The Use of Cultural Dimensions to ‘Unpack' the Concept of Culture
• There have been valuable contributions in the study of culture to identify its main characteristic attributes focusing either on– social relations (Fiske, 1991, 1992), – cultural syndromes (Triandis, 1993; 1995), – values (Hofstede, 1980, 2001; Inglehart & Baker,
2000; Schwartz, 1994) or – social axioms (Leung & Bond, 2004).
3
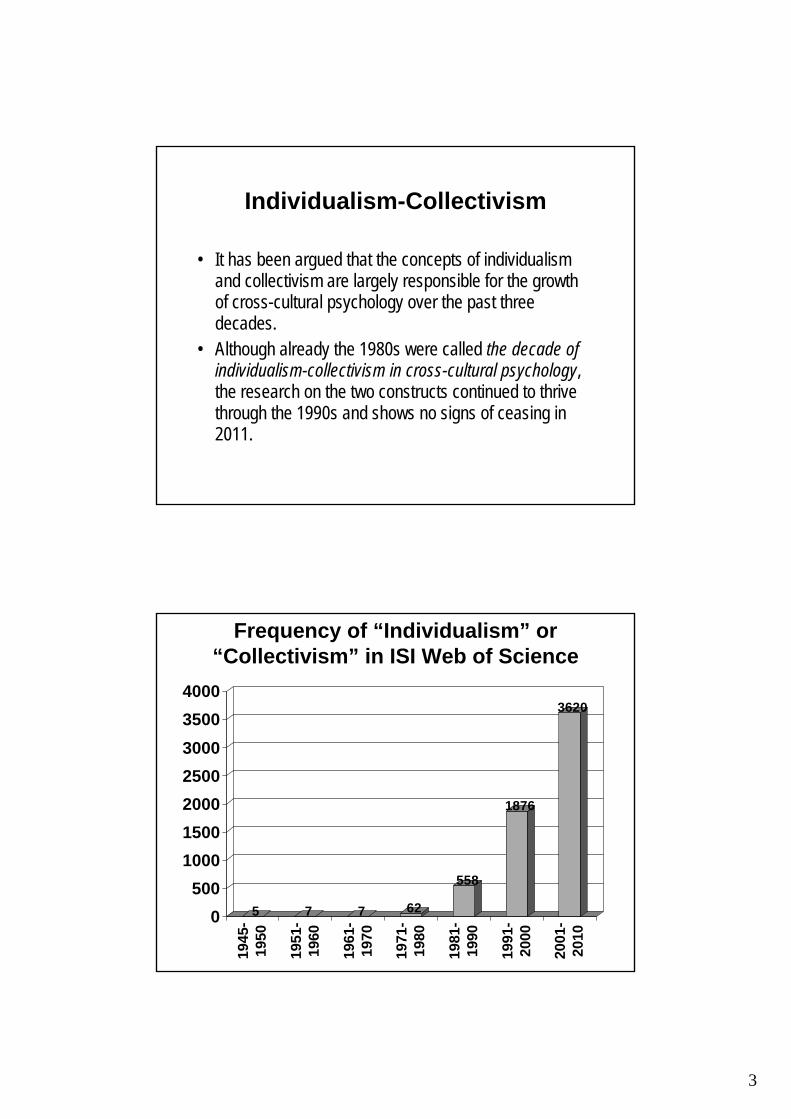
Individualism-Collectivism
• It has been argued that the concepts of individualism and collectivism are largely responsible for the growth of cross-cultural psychology over the past three decades.
• Although already the 1980s were called the decade of individualism-collectivism in cross-cultural psychology, the research on the two constructs continued to thrive through the 1990s and shows no signs of ceasing in 2011.
Frequency of “Individualism” or “Collectivism” in ISI Web of Science
5 7 7 62
558
1876
3620
0500
1000150020002500300035004000
1945
-19
50
1951
-19
60
1961
-19
70
1971
-19
80
1981
-19
90
1991
-20
00
2001
-20
10

4
Individualism-Collectivism …
• … perhaps the most important dimension of cultural differences in social behavior(Triandis, 1988, p. 60)
• … one of the most useful and actively researched constructsto emerge from cultural social psychology … (Vandello & Cohen, 1999, p. 279).Harry C. Triandis
Problems with Individualism-Collectivism• Despite the huge popularity of the constructs in psychology, cross-cultural
researchers have not been able to agree upon the nature or number of attributes that are essential for defining and measuring individualism and collectivism (see Realo, 2003; Realo & Allik, 2009).
• Besides the differences in definitions of individualism and collectivism, a conceptual leap exists between the theoretical descriptions of the concepts and the specific empirical indicators that are used to measure them.
• Different conceptualizations and research programs often rely on non-identical sets of measures and indicators, whose congruence with each other has not always been established. To paraphrase what a well-known personality psychologist Oliver John once said about personality research, cross-cultural psychologists never reached a consensus on the best model of individualism-collectivism which would have transformed the present Babel of concepts and measurement scales into a community that speaks a common language (John, 1990).
5
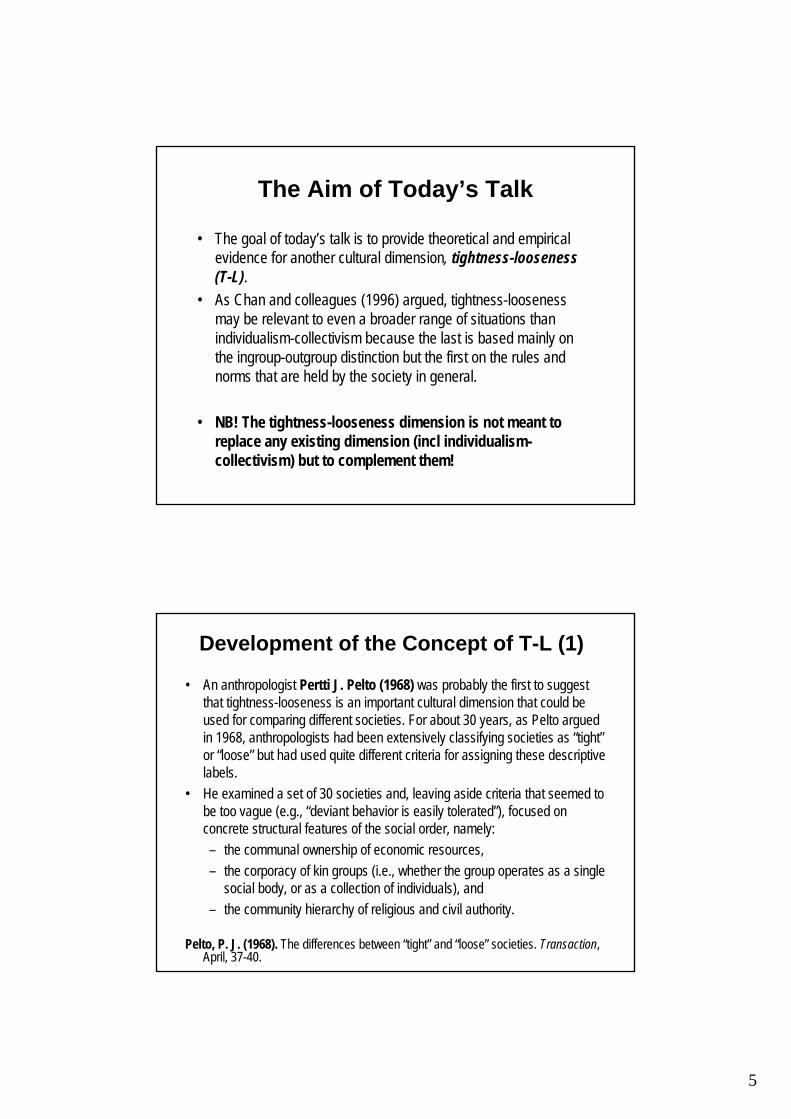
The Aim of Today’s Talk
• The goal of today’s talk is to provide theoretical and empirical evidence for another cultural dimension, tightness-looseness(T-L).
• As Chan and colleagues (1996) argued, tightness-looseness may be relevant to even a broader range of situations than individualism-collectivism because the last is based mainly on the ingroup-outgroup distinction but the first on the rules and norms that are held by the society in general.
• NB! The tightness-looseness dimension is not meant to replace any existing dimension (incl individualism-collectivism) but to complement them!
Development of the Concept of T-L (1)
• An anthropologist Pertti J. Pelto (1968) was probably the first to suggest that tightness-looseness is an important cultural dimension that could be used for comparing different societies. For about 30 years, as Pelto argued in 1968, anthropologists had been extensively classifying societies as “tight”or “loose” but had used quite different criteria for assigning these descriptive labels.
• He examined a set of 30 societies and, leaving aside criteria that seemed to be too vague (e.g., “deviant behavior is easily tolerated”), focused on concrete structural features of the social order, namely:– the communal ownership of economic resources,– the corporacy of kin groups (i.e., whether the group operates as a single
social body, or as a collection of individuals), and– the community hierarchy of religious and civil authority.
Pelto, P. J. (1968). The differences between “tight” and “loose” societies. Transaction, April, 37-40.
6
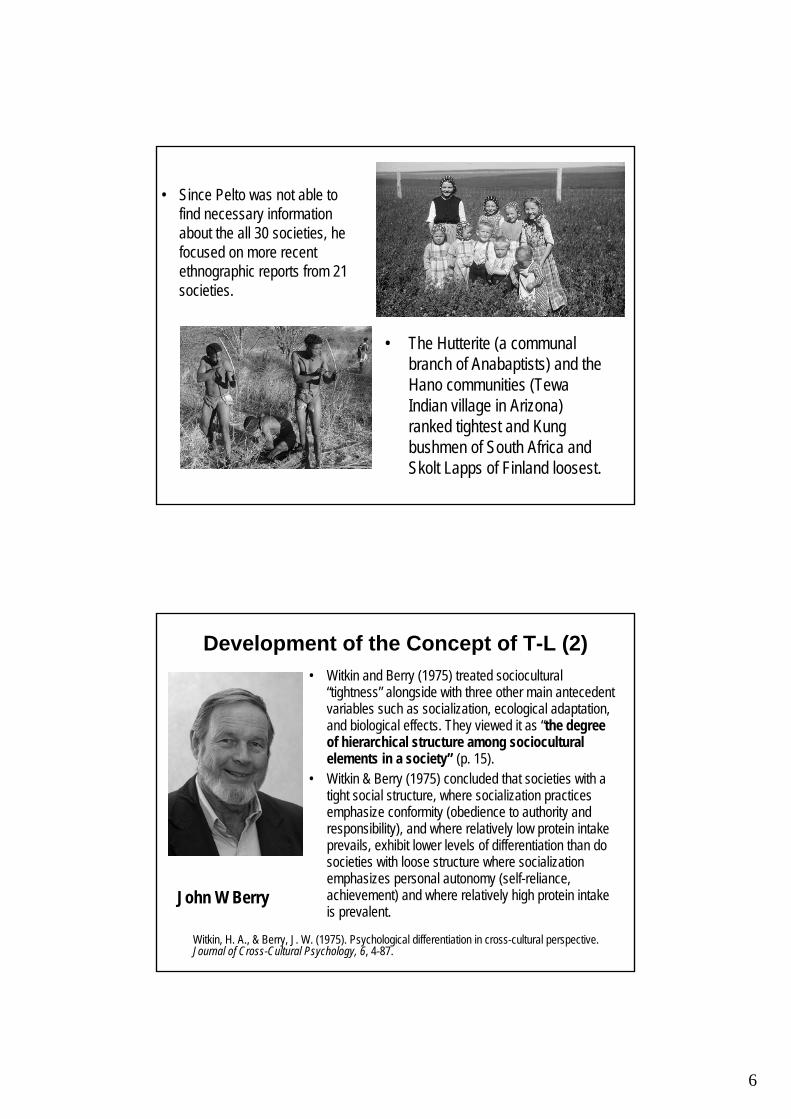
• Since Pelto was not able to find necessary information about the all 30 societies, he focused on more recent ethnographic reports from 21 societies.
• The Hutterite (a communal branch of Anabaptists) and the Hano communities (Tewa Indian village in Arizona) ranked tightest and Kung bushmen of South Africa and Skolt Lapps of Finland loosest.
Development of the Concept of T-L (2)• Witkin and Berry (1975) treated sociocultural
“tightness” alongside with three other main antecedent variables such as socialization, ecological adaptation, and biological effects. They viewed it as “the degree of hierarchical structure among sociocultural elements in a society” (p. 15).
• Witkin & Berry (1975) concluded that societies with a tight social structure, where socialization practices emphasize conformity (obedience to authority and responsibility), and where relatively low protein intake prevails, exhibit lower levels of differentiation than do societies with loose structure where socialization emphasizes personal autonomy (self-reliance, achievement) and where relatively high protein intake is prevalent.
John W Berry
Witkin, H. A., & Berry, J. W. (1975). Psychological differentiation in cross-cultural perspective. Journal of Cross-Cultural Psychology, 6, 4-87.

7
Development of the Concept of T-L (3)• T-L is one of the three cultural syndromes (the
other two being individualism-collectivism and complexity, respectively), that is, is a pattern of shared attitudes, beliefs, categorizations, self-definitions, norms, role definitions, and values that are organized around a theme that can be identified among those who speak a particular language and live together in a given historical period in a given geographical region (Triandis, 1993, 1995).
• By "tight" Triandis and colleagues (1993, 1995; Chan et al., 1996) refered to cultures in which norms are clearly defined and where is little tolerance for deviance from norms. By contrast, "loose" cultures are those in which norms are not clearly defined, and where is tolerance for deviance from norms. 1994
2. Differences between tight and loose cultures: A 33-nation study
8
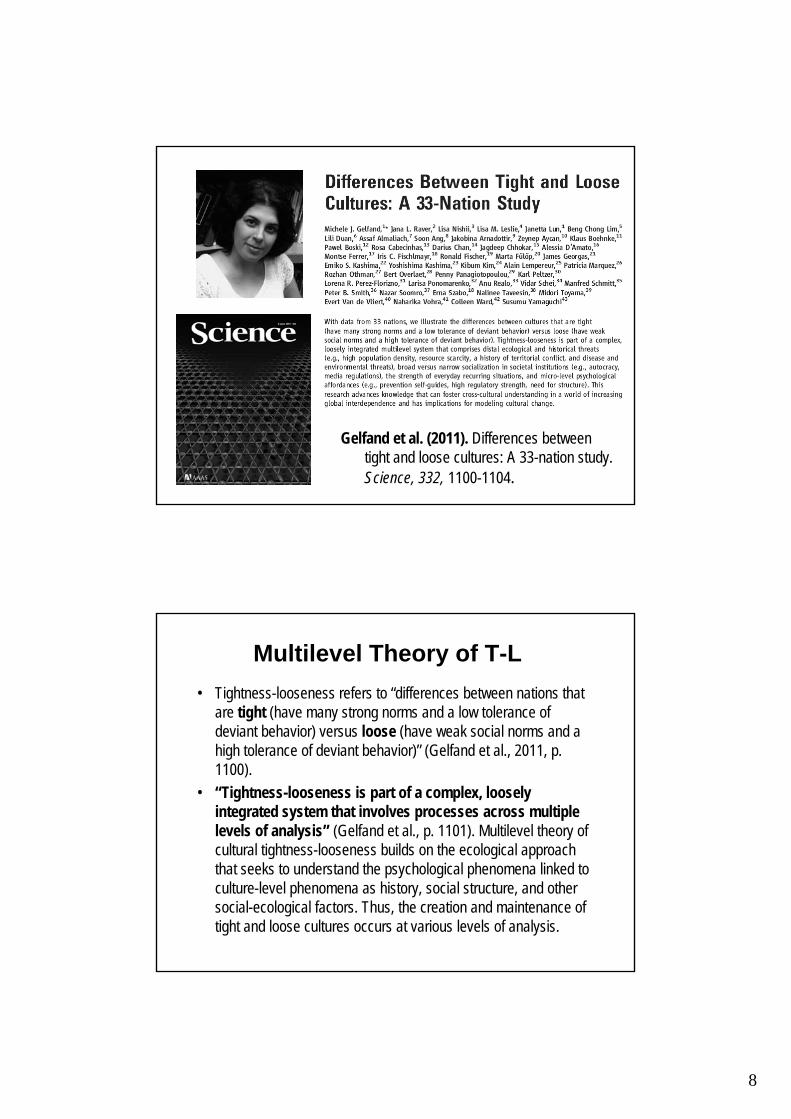
Gelfand et al. (2011). Differences between tight and loose cultures: A 33-nation study. Science, 332, 1100-1104.
Multilevel Theory of T-L• Tightness-looseness refers to “differences between nations that
are tight (have many strong norms and a low tolerance of deviant behavior) versus loose (have weak social norms and a high tolerance of deviant behavior)” (Gelfand et al., 2011, p.1100).
• “Tightness-looseness is part of a complex, loosely integrated system that involves processes across multiple levels of analysis” (Gelfand et al., p. 1101). Multilevel theory of cultural tightness-looseness builds on the ecological approach that seeks to understand the psychological phenomena linked to culture-level phenomena as history, social structure, and other social-ecological factors. Thus, the creation and maintenance of tight and loose cultures occurs at various levels of analysis.

9
Gelfand et al. (2011). Differences between tight and loose cultures: A 33-nation study. Science, 332, 1100-1104.
Gelfand et al.’s (2011) Study• To assess tightness-looseness, Gelfand et al. (2011) used
– a scale of generalized tightness-looseness which measured the strength of social norms and sanctions for deviance in nations and
– a measure of the strength/weakness of everyday situations.• To support their theory, Gelfand and colleagues (2011) also
examined a number of psychological constructs such as self-regulation strength, prevention focus, and self-monitoring ability.
• Finally, data on historical and ecological threats and societal institutions were collected from different databases in order to examine the external valididy of the cultural scores of tightness-looseness.
10
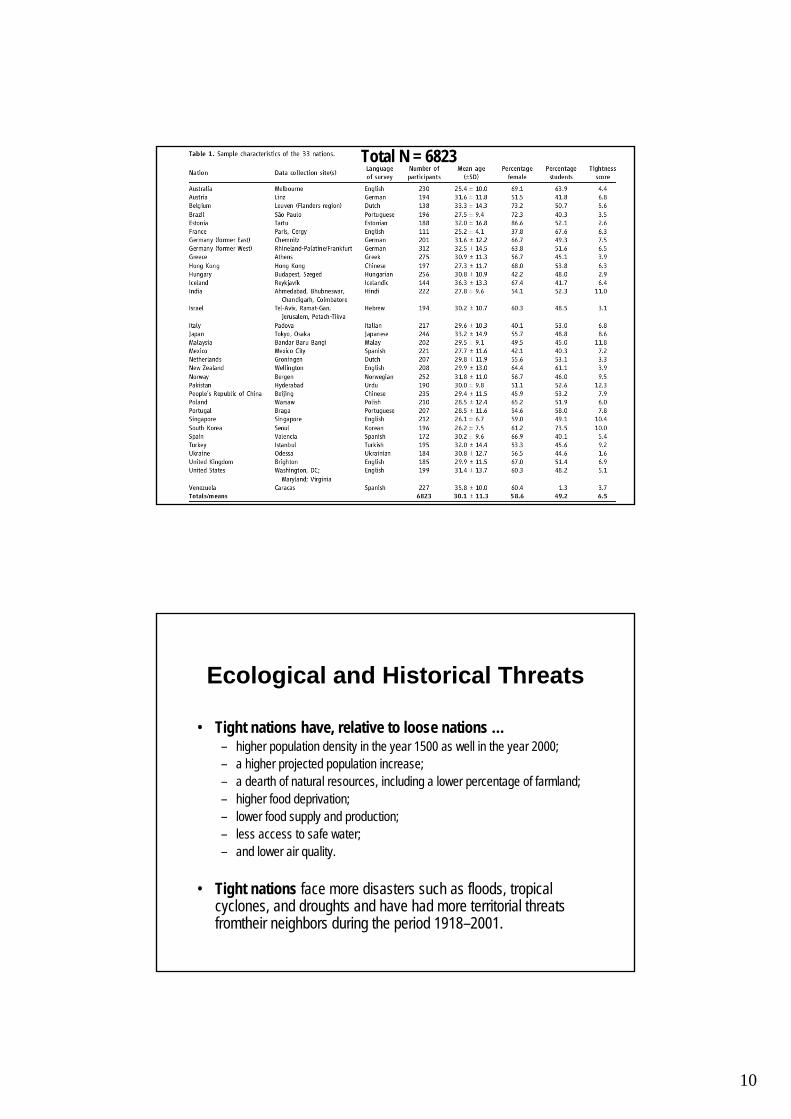
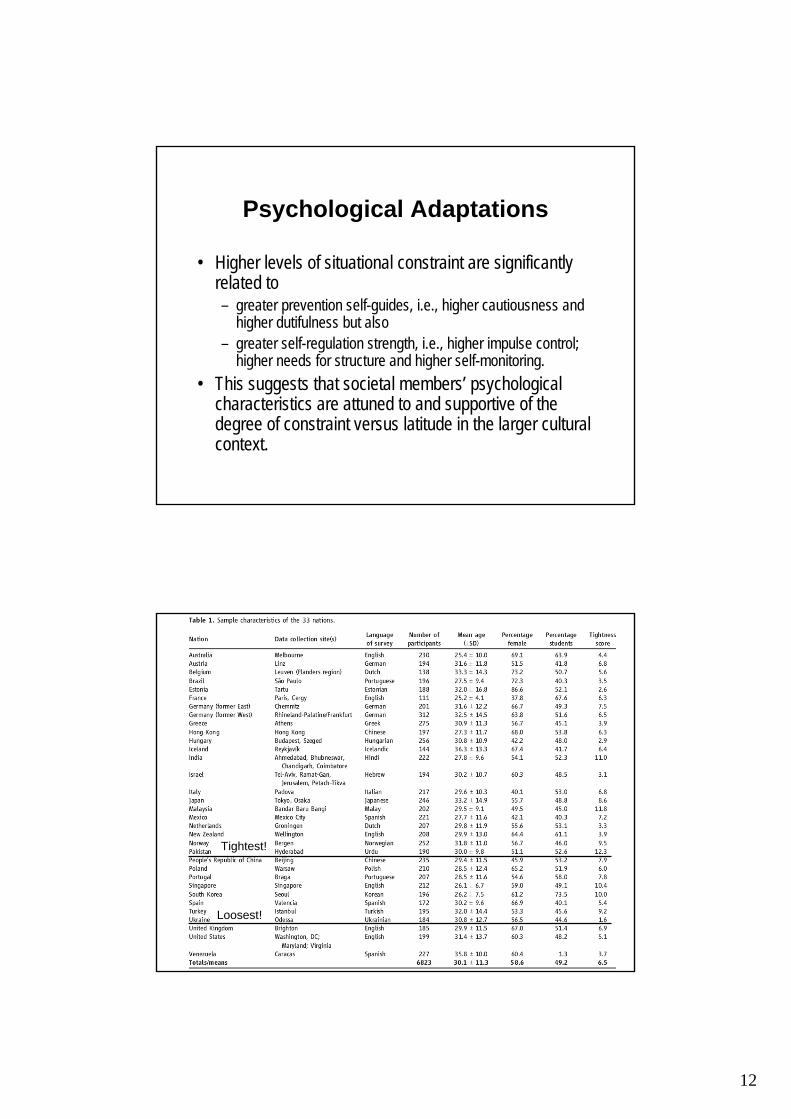
Total N = 6823
Ecological and Historical Threats
• Tight nations have, relative to loose nations …– higher population density in the year 1500 as well in the year 2000;– a higher projected population increase;– a dearth of natural resources, including a lower percentage of farmland;– higher food deprivation;– lower food supply and production;– less access to safe water; – and lower air quality.
• Tight nations face more disasters such as floods, tropical cyclones, and droughts and have had more territorial threats fromtheir neighbors during the period 1918–2001.
11
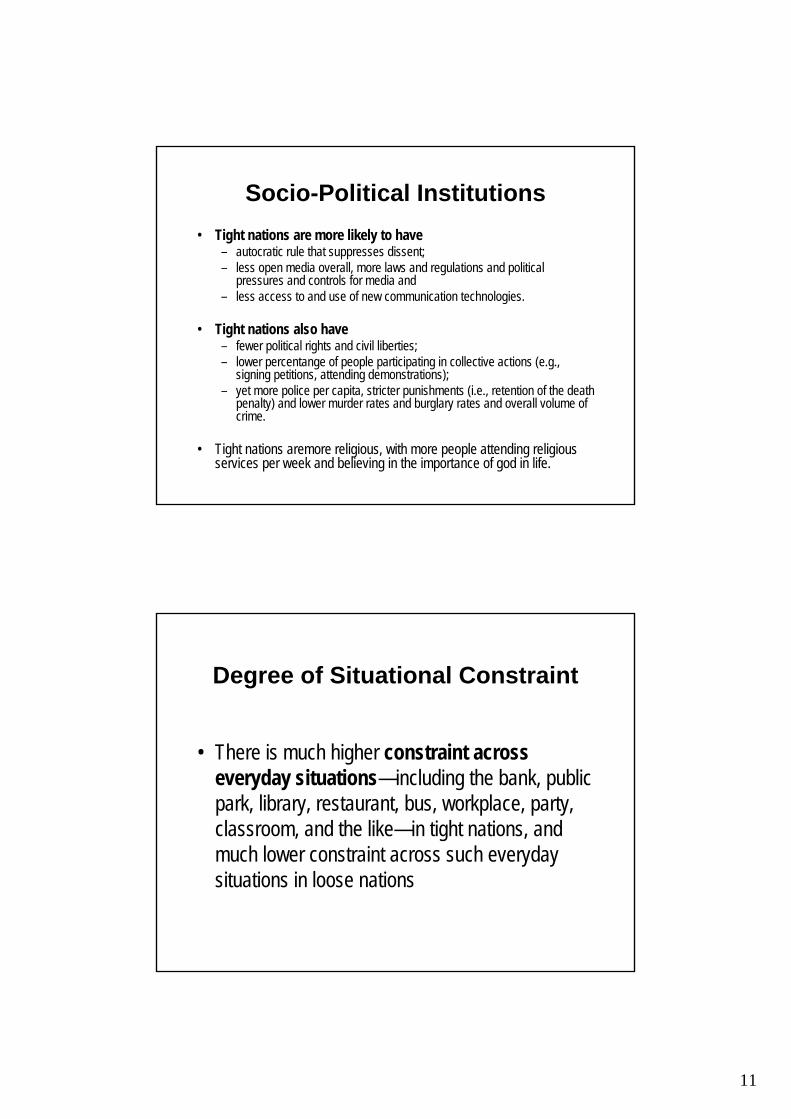
Socio-Political Institutions• Tight nations are more likely to have
– autocratic rule that suppresses dissent;– less open media overall, more laws and regulations and political
pressures and controls for media and– less access to and use of new communication technologies.
• Tight nations also have– fewer political rights and civil liberties;– lower percentange of people participating in collective actions (e.g.,
signing petitions, attending demonstrations);– yet more police per capita, stricter punishments (i.e., retention of the death
penalty) and lower murder rates and burglary rates and overall volume of crime.
• Tight nations aremore religious, with more people attending religious services per week and believing in the importance of god in life.
Degree of Situational Constraint
• There is much higher constraint across everyday situations—including the bank, public park, library, restaurant, bus, workplace, party, classroom, and the like—in tight nations, and much lower constraint across such everyday situations in loose nations
12
Psychological Adaptations
• Higher levels of situational constraint are significantly related to– greater prevention self-guides, i.e., higher cautiousness and
higher dutifulness but also– greater self-regulation strength, i.e., higher impulse control;
higher needs for structure and higher self-monitoring.• This suggests that societal members’ psychological
characteristics are attuned to and supportive of the degree of constraint versus latitude in the larger cultural context.
Tightest!
Loosest!

13
Further Research Questions
• How representative of the general population are the samples used in the Gelfand et al’s (2011) study?
• How does tightness-looseness vary within nations?
3. A Within-Culture Analysis:The Case of Estonia
14
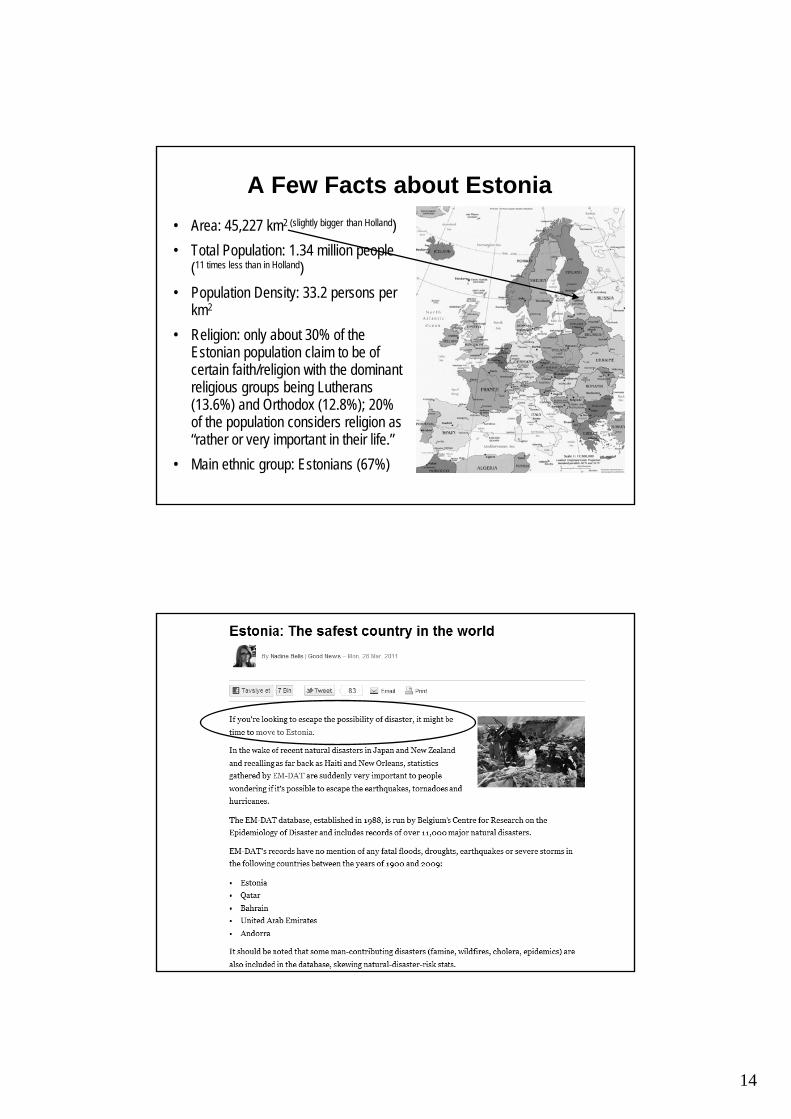
A Few Facts about Estonia• Area: 45,227 km2 (slightly bigger than Holland)• Total Population: 1.34 million people
(11 times less than in Holland)• Population Density: 33.2 persons per
km2
• Religion: only about 30% of the Estonian population claim to be of certain faith/religion with the dominant religious groups being Lutherans (13.6%) and Orthodox (12.8%); 20% of the population considers religion as “rather or very important in their life.”
• Main ethnic group: Estonians (67%)

15
Estonia: The Safest and the Loosest Country in the World?
0
2
4
6
8
10
12
14
Ukr
aine
Esto
nia
Hun
gary
Isra
elH
olla
ndB
razi
lV
enez
uela
Gre
ece
New
Zea
land
Aust
ralia US
Spa
inB
elgi
umP
olan
dFr
ance
Hon
gKon
gIc
elan
dW
-Ger
man
yA
ustri
aIta
lyU
KM
exic
oE
-Ger
man
yP
ortu
gal
Chi
naJa
pan
Turk
eyN
orw
ayS
outh
Kor
eaS
inga
pore
Indi
aM
alay
sia
Pak
ista
n
Sample• The Estonian Survey of Culture and Personality. The
data set included 1753 Estonian respondents (993females and 760 males), with a mean age of 43.8 years (SD= 17.5), ranging from 15 to 74 years. 83% of the respondents completed the questionnaire in Estonian.
• The sample was randomly selected from the National Census and was representative of the Estonian population in terms of ethnicity, place of residence, age, gender, and educational level. The survey was carried out in 2002 by TNS Emor, the leading marketing research and consulting company in Estonia.
Realo, A. (2011). The cultural dimension of tightness-looseness: A within-nation study. Manuscript in preparation.

16
Method
Gelfand et al (2011) vs Current Study(Uncorrected Means)
3.86
3.75
3.5
3.6
3.7
3.8
3.9
4
N = 188(Gelfand et al.,
Science)
N = 1604 (This study)
Tightness
p = .03

17
1
1.5
2
2.5
3
3.5
4
4.5
5
Ukr
aine
Vene
zuel
aB
razi
lH
unga
ryIs
rael
Gre
ece
Esto
nia-
2H
olla
ndEs
toni
a-1
New
_Zea
lSp
ain
Fran
ceB
elgi
umA
ustr
alia
Hon
gKon
gU
SC
hina
Icel
and
Pola
ndPo
rtug
alM
exic
oIta
lyJa
pan
UK
Turk
eyW
_Ger
man
Aus
tria
Mal
aysi
aPa
kist
anIn
dia
Kor
eaN
orw
ayE-
Ger
man
ySi
ngap
ore
Uncorrected Scores of Tightness (Gelfand et al., 2011)This study! Gelfand et al (2011)
Method
Alpha = .47 !!!

18
Method
Alpha = .61
Gelfand et al (2011) vs Current Study(Uncorrected Means)
3.86 3.86
3.5
3.6
3.7
3.8
3.9
4
N = 188 (Gelfand etal., Science)
N = 1604 (Thisstudy, 5 items)
Tightness
19
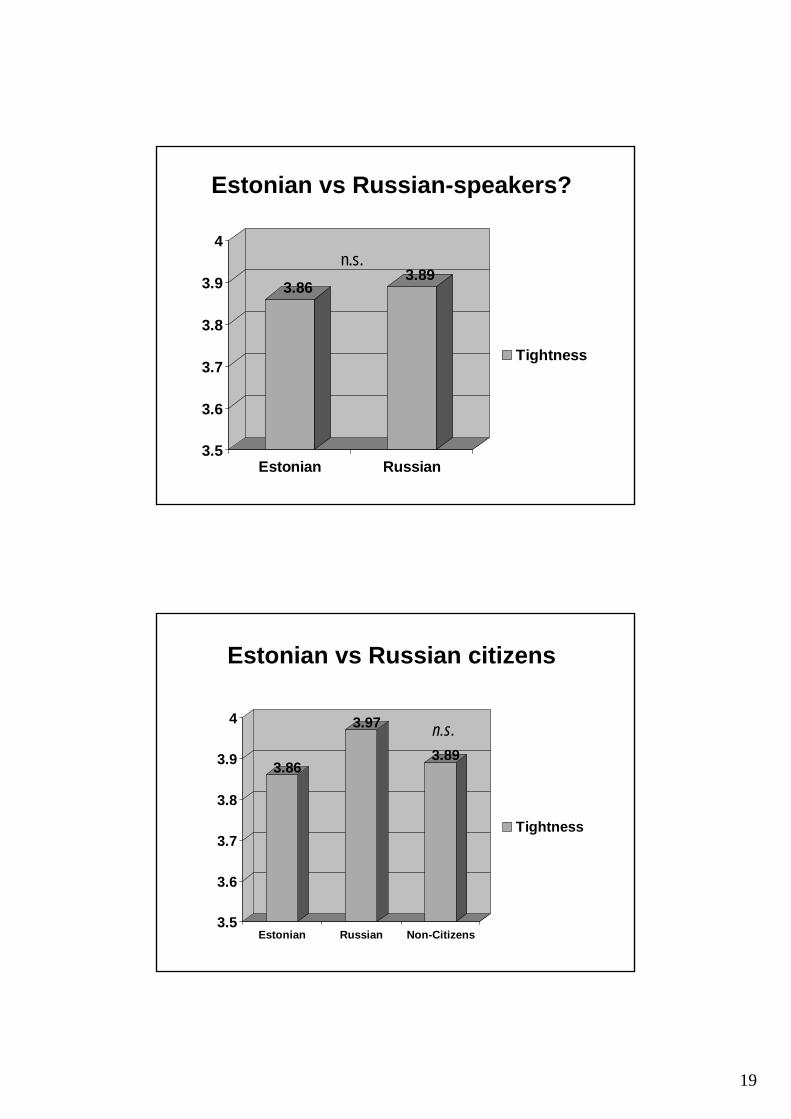
Estonian vs Russian-speakers?
3.863.89
3.5
3.6
3.7
3.8
3.9
4
Estonian Russian
Tightness
n.s.
Estonian vs Russian citizens
3.86
3.97
3.89
3.5
3.6
3.7
3.8
3.9
4
Estonian Russian Non-Citizens
Tightness
n.s.
20
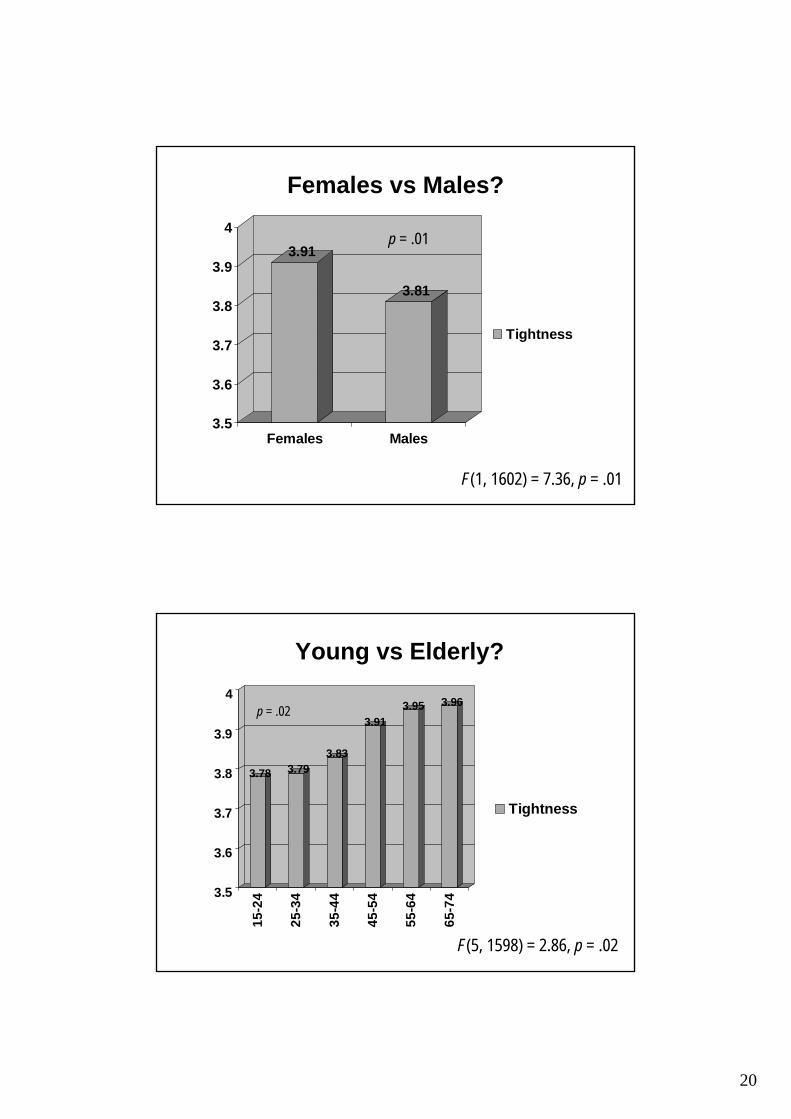
Females vs Males?
3.91
3.81
3.5
3.6
3.7
3.8
3.9
4
Females Males
Tightness
F(1, 1602) = 7.36, p = .01
p = .01
Young vs Elderly?
3.78 3.793.83
3.913.95 3.96
3.5
3.6
3.7
3.8
3.9
4
15-2
4
25-3
4
35-4
4
45-5
4
55-6
4
65-7
4
Tightness
F(5, 1598) = 2.86, p = .02
p = .02

21
Urban vs Rural Areas?
3.83 3.84 3.833.87
3.89
3.5
3.6
3.7
3.8
3.9
4
Talli
nn
"Lar
ge"
Citi
es
Reg
iona
lC
entr
es
Smal
l tow
ns
Cou
ntry
side
Tightness
n.s.
More Educated vs Less Educated?4.03
3.83
3.9
3.7
3.5
3.6
3.7
3.8
3.9
4
Less
than
Bas
ic
Bas
ic
Seco
ndar
y
Hig
her
Tightness
F(3,1584) = 6.20, p = .001
p = .001

22
Tightness vsIndividualism-Collectivism?
.00Uniqueness.27***Patriotism
-.03Mature self-Responsibility
.14***Companionship
.21***Autonomy.23***Familism
rIndividualism2rCollectivism1
1 Realo, Allik, & Vadi (1997)2 Realo, Koido, Allik, & Ceulemans (2002)
4. An Analysis of Situational Constraint in Estonia and Greece

23
Degree of Situational Constraint
• There is much higher constraint across everyday situations—including the bank, public park, library, restaurant, bus, workplace, party, classroom, and the like—in tight nations, and much lower constraint across such everyday situations in loose nations.
• While discussing the situation-specific nature of the dimension, Triandis (1996) has proposed that there are certain domains within all cultures which are tight, and other domains which areloose. For example, the United States is rather loose in marital arrangements but tight in banking. Across different domains and situations, however, there exist general tendencies towards one or another pole of the dimension in each culture.
Aim of the Current Study
• The main aim of the study was to examine the situational constraint in Greece and Estonia, that is how the cultural dimension of tightness-looseness is manifested in a variety of everyday behaviors and situations.
• Are behavioral constraints stronger in certain situations in Greece but in other situations in Estonia? Are there certain domains or situations that are tight or loose in both Estonia and Greece?
Realo, A., Linnamägi, K., & Gelfand, M. (2011). The Cultural Dimension of Tightness-Looseness: An Analysis of Situational Constraint in Greece and Estonia. Manuscript submitted for publication.

24
A Few Facts about Greece• Area: 131,940 km2
• Total Population: 11.3 million people (10 times more than in Estonia)
• Population Density: 82.9 persons per km2
• Religion: 97% of the population belongs to the Greek Orthodox Church; 69% of the population considers religion as “rather or very important in their life.”
• Main ethnic group: Greeks (94%)
Estonia vs Greece
0
2
4
6
8
10
12
14
Ukr
aine
Esto
nia
Hun
gary
Isra
elH
olla
ndB
razi
lV
enez
uela
Gre
ece
New
Zea
land
Aust
ralia US
Spa
inB
elgi
umP
olan
dFr
ance
Hon
gKon
gIc
elan
dW
-Ger
man
yA
ustri
aIta
lyU
KM
exic
oE
-Ger
man
yP
ortu
gal
Chi
naJa
pan
Turk
eyN
orw
ayS
outh
Kor
eaS
inga
pore
Indi
aM
alay
sia
Pak
ista
n

25
The Situational Constraint Measure• The measure is adapted from Price and Bouffard (1974) (see
also Gelfand et al., 2011) and developed to assess cross-cultural differences in T-L operationalized as a “situational constraint.”
• Respondents were engaged in a paired comparison task, wherein they judged the appropriateness of 15 different everydaybehaviors in 15 specific behavior settings (situations). – Behaviors: argue, bargain (exchange goods, services, or privileges),
blow nose, burp/belch, cry (shed tears), curse/swear (use a foul language), eat, flirt, kiss (on the mouth), laugh out loud, listen to the music on headphones, read a newspaper, sing, sleep and talk (have a conversation).
– Situations: bank, bus, classroom, doctor’s office, elevator, funeral ceremony, job interview, library, movies, one’s bedroom, party, public park, restaurant, sidewalk and workplace.
Mean Scores of the Constrainedness of 15 Situations across 15 Behaviors
1
2
3
4
5
6
Ban
k
Bus
City
sid
ewal
kC
lass
room
Doc
tor’s
offi
ce
Elev
ator
Fune
ral c
erem
ony
Job
inte
rvie
w
Libr
ary
Mov
ies
One
’s b
edro
om
Part
yPu
blic
par
k
Res
taur
ant
Wor
kpla
ce
EstoniaGreece
Higher scores indicate less behavioral constraints in a certain setting!The scores have been corrected for sample differences in scale use.
**
***
******
**
***
*
***
***
The tightest!The loosest!

26
The Strongest and Weakest Situations
• Among both cultural groups, job interview and funeral ceremonywere considered the tightest or strongest situations having more limited number of behaviors acceptable and appropriate and one’s bedroomand public park as the loosest behavior settings or weakest situations with a less behavioral constraints.
• Job interview appeared to be the tightest situation among others as could be expected in numerous reasons. Besides being formal, it is also the situation which result is personally important and depends on impression one makes of himself/herself.
• Funeral ceremony is also special event that requires reserved behavior. Besides that, it carries in itself core cultural values via long traditions demanding clear rules and rituals to be implemented.
Formal vs Informal Settings• Relatively formal settings such as classroom, funeral ceremony, library and
workplace, appear to include stricter social norms in Greece than in Estonia, whereas more informal or public settings such as city sidewalk, party and public park, for example, allow less behavioral freedom in Estonia than in Greece.
• Greece scores higher than Estonia on the cultural dimensions of Uncertainty Avoidance and Mastery (Hofstede, 2001; Schwartz, 1994). As people in high uncertainty avoidance cultures look for order and structure in their organizations and institutions, one could expect that they also regard formal settings with more constraints for behavior.
• It seems that Greeks counterbalance their more restricted behavior in formal settings with more freedom in public and looser settings (e.g. sidewalk, public park) compared to Estonians for whom these behavior settings are not distinguished so clearly.
27
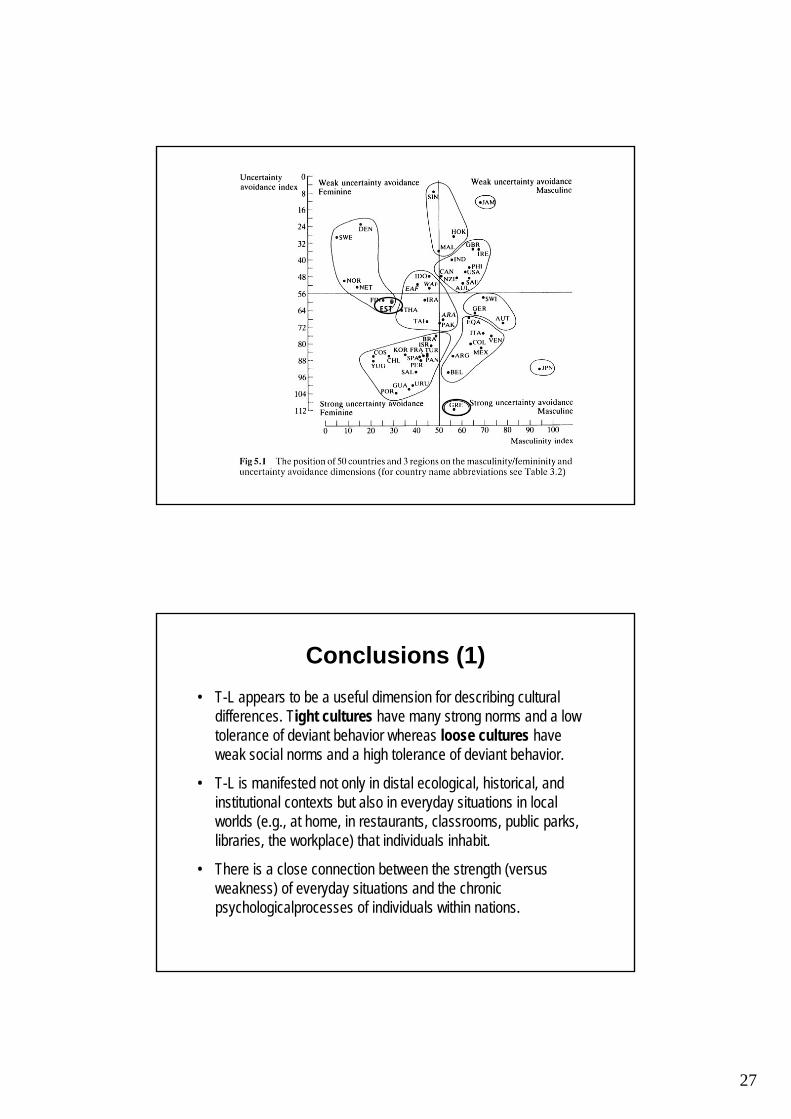
EST
Conclusions (1)• T-L appears to be a useful dimension for describing cultural
differences. Tight cultures have many strong norms and a low tolerance of deviant behavior whereas loose cultures have weak social norms and a high tolerance of deviant behavior.
• T-L is manifested not only in distal ecological, historical, and institutional contexts but also in everyday situations in local worlds (e.g., at home, in restaurants, classrooms, public parks,libraries, the workplace) that individuals inhabit.
• There is a close connection between the strength (versus weakness) of everyday situations and the chronic psychologicalprocesses of individuals within nations.

28
Conclusions (2)
• The Estonian sample used in the Gelfand et al’s (2011) study represents well the general Estonian population.
• Within-country variation in tightness-looseness is relatively small in terms of regional and ethnic differences--the strength of social norms and tolerance of deviance seems to be a shared collective construct.
• However, females, elderly, and less educated peopleperceive their nation as having slightly stronger norms and lower tolerance of deviant behavior than do males, younger, and more educated people.
Conclusions (3)• There are certain domains within cultures which are tight, and
other domains which are loose. For instance, job interview and funeral ceremony were considered the tightest or strongest situations having more limited number of behaviors acceptable and appropriate and one’s bedroom and public park as the loosest behavior settings or weakest situations with a less behavioral constraints both in Estonia and in Greece.
• In relatively formal situations (e.g., classroom, workplace etc.), there appear to be more rigid social norms in Greece than in Estonia. In more informal and looser settings (e.g., city sidewalk, party, public park), however, there are less behavioral constraints in Greece than in Estonia.
• All in all, T-L appears to be a useful dimension for describing and explaining cultural differences!