Overview of the Caribbean Tourism Sector: Managing Tourism Resources Mercedes Silva Sustainable...
27
Overview of the Caribbean Overview of the Caribbean Tourism Sector: Tourism Sector: Managing Tourism Resources Managing Tourism Resources Mercedes Silva Sustainable Tourism Specialist Adaptation to Climate Change in the Caribbean Tourism Sector Workshop Grenada, May 27 th , 2002
-
Upload
wesley-jenkins -
Category
Documents
-
view
219 -
download
1
Transcript of Overview of the Caribbean Tourism Sector: Managing Tourism Resources Mercedes Silva Sustainable...
Overview of the Caribbean Overview of the Caribbean Tourism Sector:Tourism Sector:Managing Tourism ResourcesManaging Tourism Resources
Mercedes SilvaSustainable Tourism Specialist
Adaptation to Climate Change in the CaribbeanTourism Sector WorkshopGrenada, May 27th, 2002
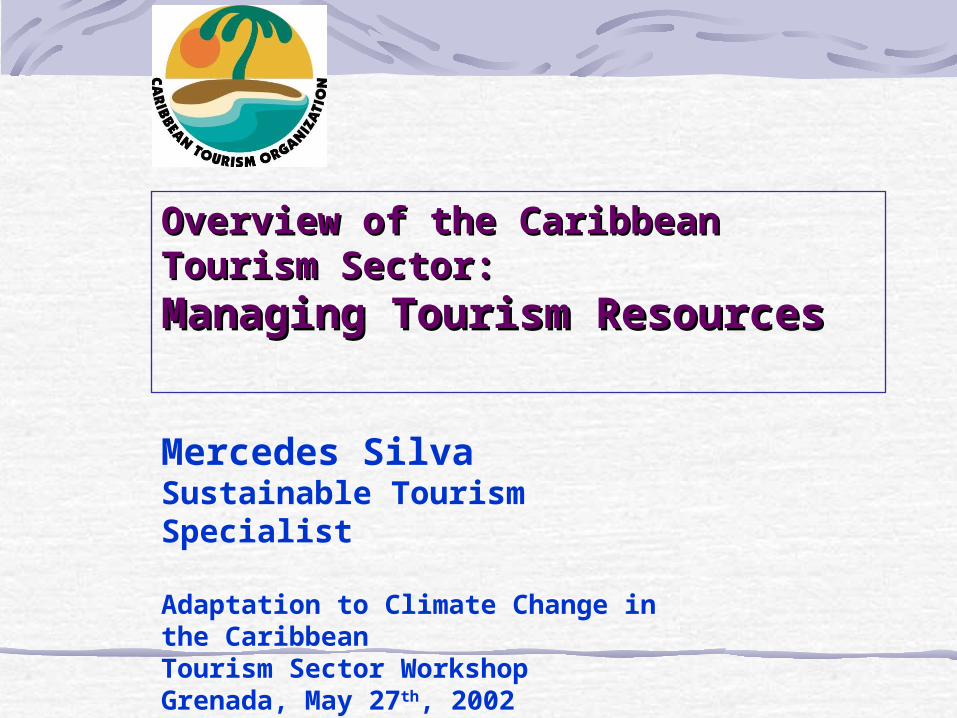
CTO MembershipCTO Membership
Caribbean Map

OECS Countries Dutch West IndiesAnguilla ArubaAntigua & Barbuda* BonaireBritish Virgin Islands CuracaoDominica* SabaGrenada * St EustatiusMontserrat* St MarteenSt Kitts and Nevis*St. Lucia * French West IndiesSt Vincent and the Grenadines* Guadeloupe
Martinique
Other CARICOM Hispanic CaribbeanThe Bahamas CubaBarbados Dominican RepublicBelize Mexico: Cancun / CozumelGuyana VenezuelaJamaicaTrinidad and Tobago US Caribbean
Haiti Puerto Rico Suriname US Virgin Islands
Other Commonwealth Bermuda Cayman IslandsTurks and Caicos Islands * CARICOM
CTO Caribbean Sub-RegionsCTO Caribbean Sub-Regions
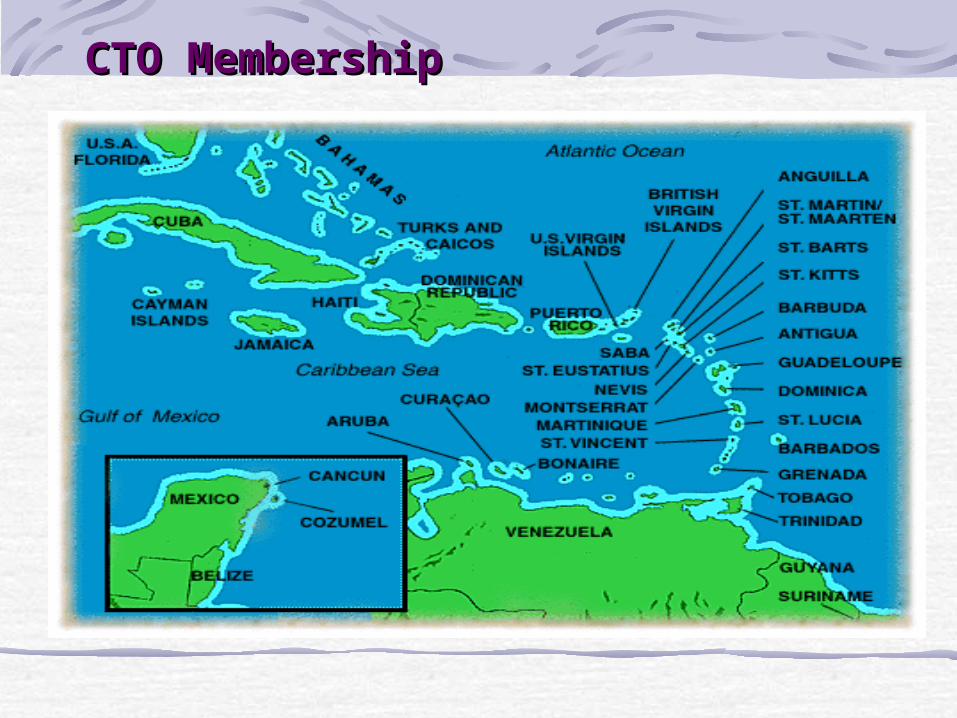
Benefits of TourismBenefits of Tourism
Foreign Exchange
Government Revenue
Investment
• Job Creation
• Linkages to Other Sectors
• Socio-Cultural Development
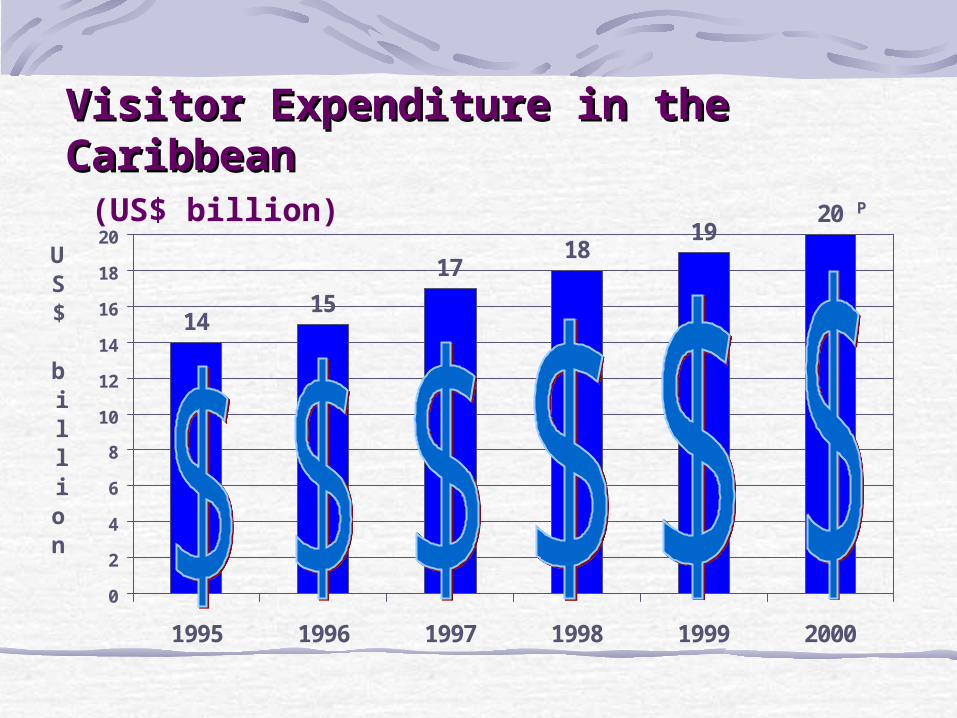
1415
1718
1920
0
2
4
6
8
10
12
14
16
18
20
1995 1996 1997 1998 1999 2000
US$ billion
P
Visitor Expenditure in the Visitor Expenditure in the CaribbeanCaribbean (US$ billion)

Employment in Tourism Employment in Tourism IndustryIndustry
CTO conservatively estimates that more than 900 thousand persons are directly or indirectly employed in the tourism industry (300 thousand in the accommodation sector)

Importance of Tourism to Importance of Tourism to Caribbean EconomiesCaribbean Economies
Visitor Expenditure as a Percentage of GDPAnguilla - 75%Cayman Islands - 60%St. Lucia - 55%Antigua & Barbuda - 49%Aruba - 41%Barbados - 36%St. Kitts & Nevis - 31%Grenada - 28%St. Vincent & G’dines - 28%Jamaica - 25%
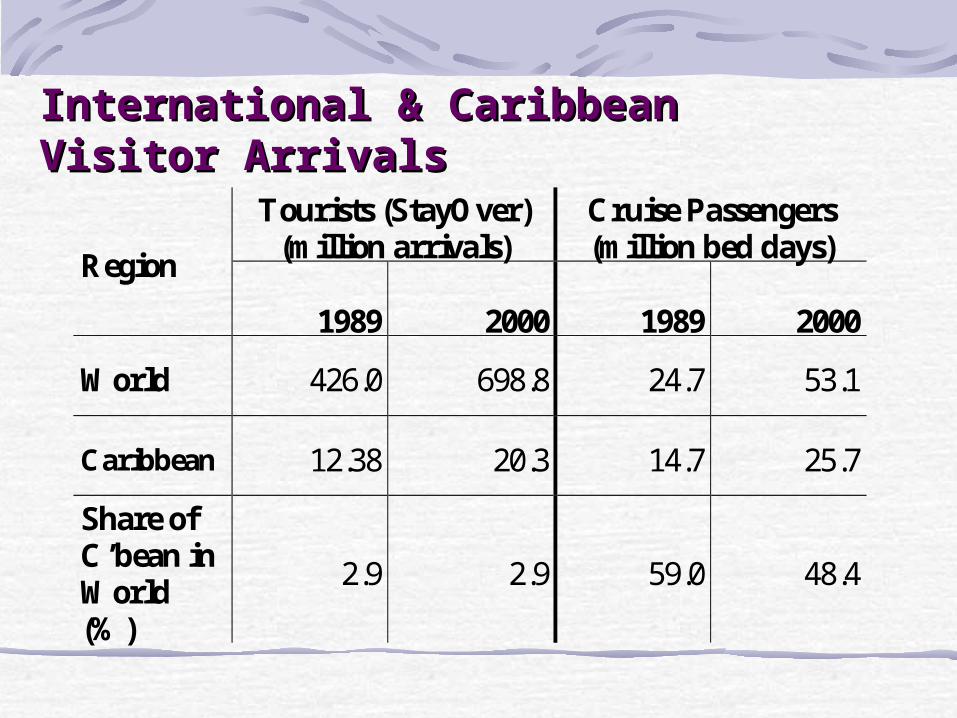
International & Caribbean International & Caribbean Visitor ArrivalsVisitor Arrivals
Tourists (StayOver) (million arrivals)
Cruise Passengers (million bed days)
Region
1989
2000
1989
2000
World 426.0 698.8 24.7 53.1
Caribbean 12.38 20.3 14.7 25.7
Share of C’bean in World (%)
2.9 2.9 59.0 48.4
0
20
40
60
80
100
120
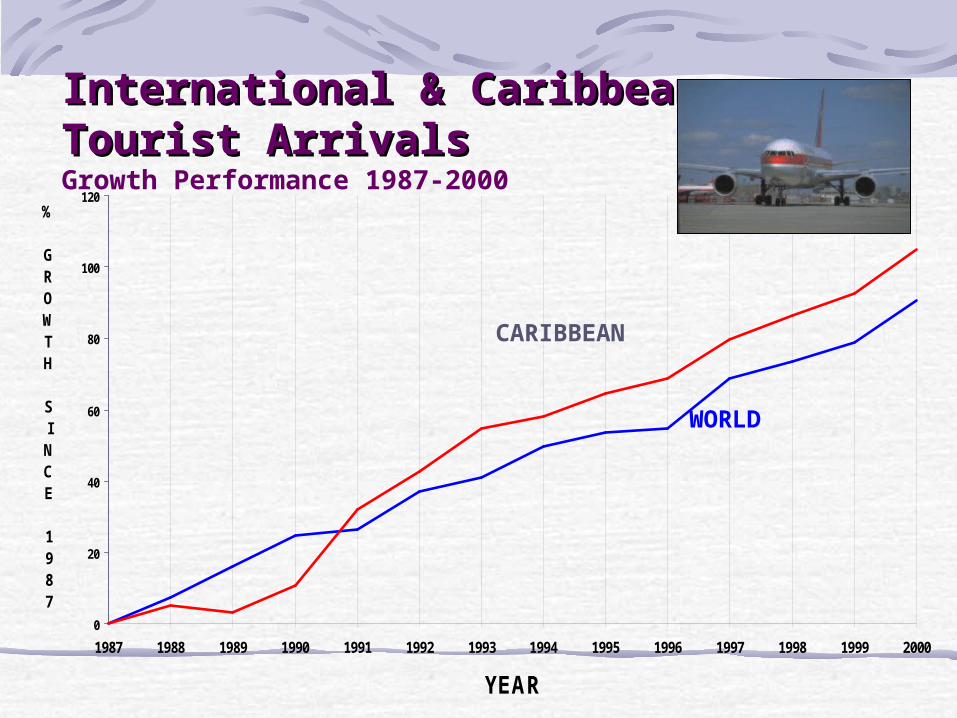
1987 1988 1989 1990 1991 1992 1993 1994 1995 1996 1997 1998 1999 2000
YEAR
% GROWTH SINCE 1987
International & Caribbean International & Caribbean Tourist ArrivalsTourist ArrivalsGrowth Performance 1987-2000
CARIBBEAN
WORLD

0
50
100
150
200
250
300
350
1991 1993 1995 1996 1997 1998 1999 2000 2001
YEAR
% GROWTH SINCE 1989
International & Caribbean International & Caribbean Cruise Bed DaysCruise Bed DaysGrowth Performance 1991-2000
CARIBBEAN
WORLD
MEDITERRANEAN

-20
0
20
40
60
80
100
120
140
Year
% G
row
th
All Caribbean
Hisp. Caribbean
Fr. Caribbean
CARICOM
US Caribbean
Dutch Caribbean
Source : Caribbean Tourism Organization
Fr. Caribbean
Hisp. Caribbean
All Caribbean
US. Caribbean
Dutch Caribbean
CARICOM
1990 2000199919981997199619951994199319921991
Growth in Tourist Arrivals to the Caribbean and Growth in Tourist Arrivals to the Caribbean and Selected Sub-regions since 1991Selected Sub-regions since 1991
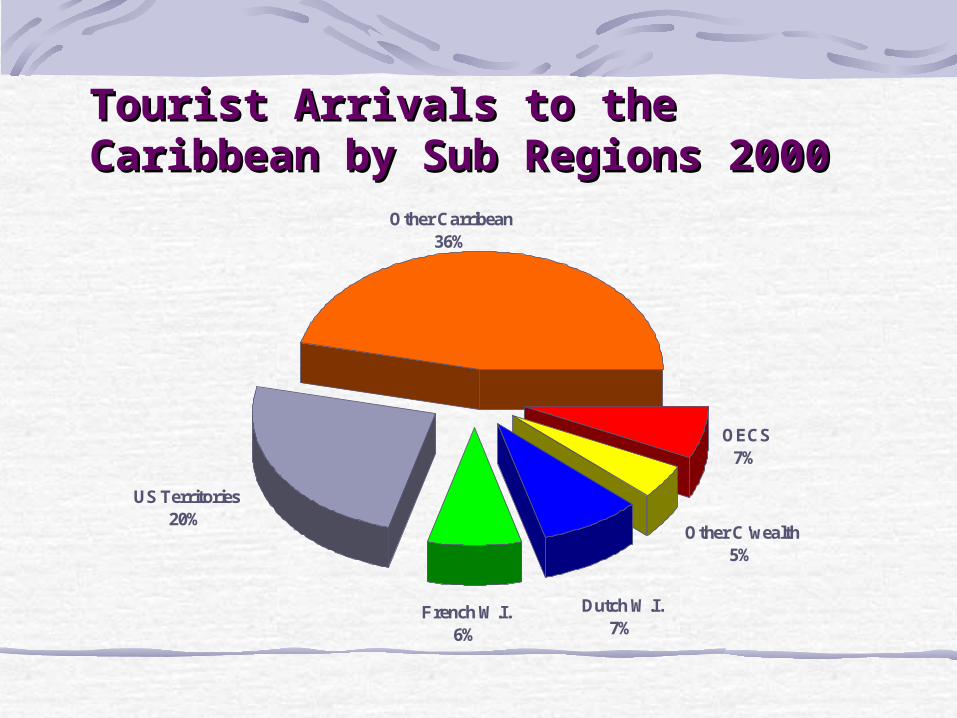
Tourist Arrivals to the Tourist Arrivals to the Caribbean by Sub Regions Caribbean by Sub Regions 20002000 Other Carribean
36%
US Territories20%
Other C'wealth5%
French W.I.6%
OECS7%
Dutch W.I.7%

Other11%
Europe26%
Canada6%
United States50%
Caribbean7%
Tourist Arrivals to the Tourist Arrivals to the Caribbean by Major Markets Caribbean by Major Markets 20002000pp

US Travel to Overseas US Travel to Overseas DestinationsDestinationsComparative Performance 1990 - 2000Comparative Performance 1990 - 2000
-15
-5
5
15
25
35
45
55
65
75
85
95
1990 1991 1992 1993 1994 1995 1996 1997 1998 1999 2000
Y E A R
All Overseas
Caribbean
Gulf War
Competition
Source USTIA

C A R I C OM
32%
HI SP A NI C
C A R I B B E A N*
57%
DU T C H C A R I B B E A N
4%
U S T E R I T OR I E S
5%
FR E NC H
C A R I B B E A N
1 %
OT HE R C A R I B B E A N
1 %
* Excludes Puerto Rico
C an adian T our is t A r r ivals t o
T he H ispan ic C ar ibbean - 2 0 0 0
p
Cuba
48%Dom
Rep
38%
Cancun
1 4%
Arrivals from Canada to the Arrivals from Canada to the Caribbean by Sub-region 2000pCaribbean by Sub-region 2000p
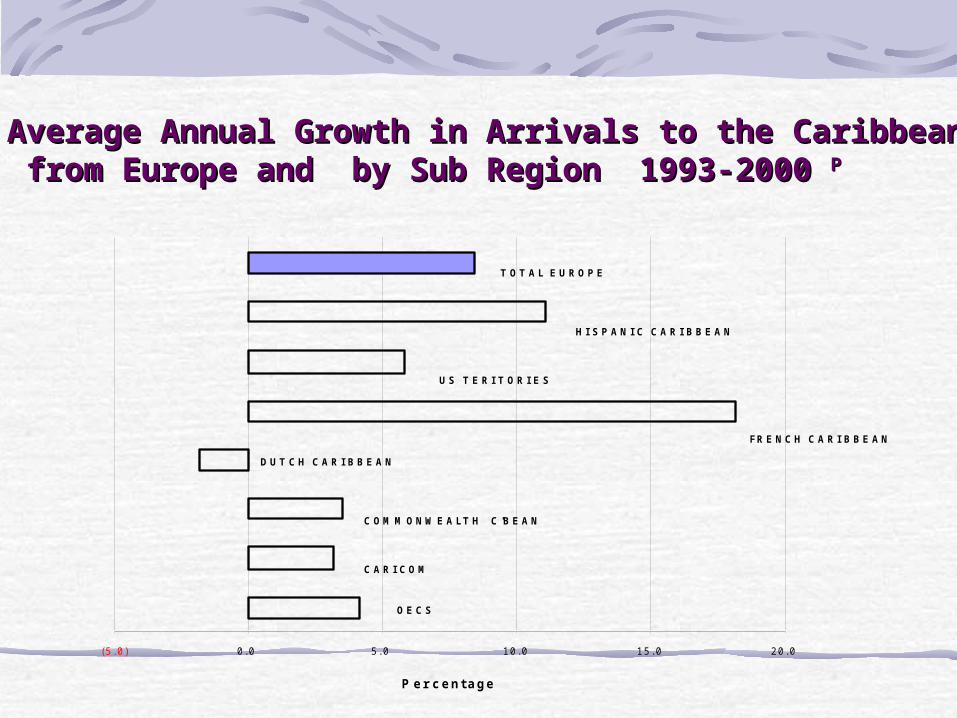
(5. 0) 0. 0 5. 0 10. 0 15. 0 20. 0
P er c entage
OE C S
C A R I C OM
C OM M ONWE A LT H C 'B E A N
FR E NC H C A R I B B E A N
DU T C H C A R I B B E A N
U S T E R I T OR I E S
HI S P A NI C C A R I B B E A N
T OT A L E U R OP E
Average Annual Growth in Arrivals to the CaribbeanAverage Annual Growth in Arrivals to the Caribbean from Europe and by Sub Region 1993-2000 from Europe and by Sub Region 1993-2000 PP

83.8
198.6 209.6 219.4232.6
244.1 251.3
0
50
100
150
200
250
300
Rooms (000)
1980 1995 1996 1997 1998 1999 2000
P
Room Capacity in the Room Capacity in the CaribbeanCaribbean
OECS1%
Other C'wealth
27%
Other52%
US Terr.7%
Dutch6%
French7%

60
61
62
63
64
65
66
67
Rate in %
1993 1994 1995 1996 1997 1998 1999
Occupancy Rates in the Occupancy Rates in the Caribbean Caribbean (percent)(percent)

Challenges to Caribbean Challenges to Caribbean TourismTourism
Diminished economic growth in many of our source marketReduced profitability of airlinesMore countries seriously adopting tourism as a viable development optionIncreased leisure travel options within our major marketsChanging Consumer PatternsChanging distribution systems
Challenges to Caribbean TourismChallenges to Caribbean TourismClimate Change IssuesClimate Change Issues
Sea Level Rise: most tourism facilities are located in coastal areasGlobal Temperature: warmer winters in northern markets / changes in tourism seasons.warmer summers in the region / less attractive for tourists.Precipitation PatternsHurricaneslost of infrastructureaffect region image as a safe destination
Today’s Changing ConsumerToday’s Changing ConsumerNew Standards of Expectation
less likely to be satisfied with sun, sea & sand alone
more knowledgeable & independent
more environmentally conscious
more security-concerned
more likely to travel in family/groups

Challenges After September 11thChallenges After September 11th
Safety and security the primary concern of travelers both in terms of Air travel and safety at the destination
Shorter booking window, reduced from three months to as much as four weeks
Economic downturn..increased un-employment

Growing Competition - ProductGrowing Competition - Product
higher levels of service outside Caribbean
freer cross-border travel (notably Europe)
huge growth in cruise ship inventory and cruising
destination
better scheduled airlift to other regions
Lack of investment and innovation in product
development in the region
Towards the FutureTowards the Future
The Caribbean is perceived as a safe destination
in comparison to its major competitors in the
middle east and Asia.
Declines in September estimated at 19% are
leveling off and showing positive signals of
recovery.
Preliminary estimates suggest that arrivals to
the region in 2001, declined by 2% compared to
2000
Greater effort in marketing & research

Towards the FutureTowards the FutureSustainable Tourism Sustainable Tourism ApproachApproachEfforts being made towards Sustainable
tourism initiatives inclusive of improved
product & human resource development
Natural Resource Protection
Carrying Capacity Assessments
Environmental and Financial Feasibility
Disaster Mitigation
Research and Education

Projected Growth in World & Projected Growth in World & Caribbean TourismCaribbean Tourism
ave.
annual 1995 2000 2010 %
ch.
Caribbean 14.7 20.3 28.4 4.6
World 567.0 698.8 937.0 3.6
% share 2.6% 2.9% 3.0%
millions
Mercedes SilvaSustainable Tourism Specialistmsilva@caribtourism.comwww.onecaribbean.orgwww.doitcaribbean.com
Adaptation to Climate Change in the CaribbeanTourism Sector WorkshopGrenada, May 27th, 2002