Overview of the 2017 Crash Investigation Sampling System
7
NHTSA’s National Center for Statistics and Analysis 1200 New Jersey Avenue SE, Washington, DC 20590 T RAFFIC S AFETY F ACTS Research Note DOT HS 812 787 September 2019 Overview of the 2017 Crash Investigation Sampling System Summary In 2017, there were an estimated 2,775,608 police- reported motor vehicle crashes in which at least one passenger vehicle (i.e., a passenger car or a light truck) was towed from the crash scene in the United States, which resulted in an estimated 1,686,240 known passen- ger vehicle occupant injuries. Among these crashes, 2.9 percent (81,443) resulted in crashes with serious injury levels or above, 35.9 percent (995,898) resulted in crashes with moderate or minor injury levels, and 45.1 percent (1,252,388) resulted in crashes with no injury level. Introduction The National Highway Traffic Safety Administration is releasing data from the newly modernized Crash Investigation Sampling System (CISS) – a replace- ment of the National Automotive Sampling System Crashworthiness Data System (NASS CDS). NHTSA designed CISS to select a more efficient and flexible sample using updated traffic and demographic infor- mation and optimizing the sample to better meet data users’ needs. (For more information, see the Technical Report, Crash Investigation Sampling System: Sample Design and Weighting .) In 2017, motor vehicle traffic crashes that each involved at least one passenger vehicle towed from the scene of the crash were sampled, inves- tigated, and coded at 24 newly selected sites across the nation. Weighting procedures were applied to gener- ate nationally representative estimates of such crashes. This Research Note presents an overall summary of key estimates of crashes in 2017 and provides back- ground on CISS. (For a more detailed explanation of the sample design, estimation protocols, and guidance on how to analyze the new data, please refer to the Crash Investigation Sampling System: Design Overview, Analytic Guidance and FAQs .) In addition to sample design and weighting enhancements, several improvements were made to the information technology infrastructure and operational protocols of CISS to gather more relevant, accurate, and nationally representative data. Some of these improvements are detailed in the Improvements section of this Note. Results Crashes As shown in Table 1 and Figure 1, there were an esti- mated 2,775,608 police-reported crashes in 2017 where at least one passenger vehicle in each was towed from the scene. The maximum Crash Abbreviated Injury Scale (CAIS) severity is the basis of Table 1 and Figure 1. The maximum CAIS severity is the most severe injury level among the occupants of a CISS applicable vehicle involved in a crash. There were an estimated 81,443 [55,575+17,952+4,316+3,600] crashes with injury levels of serious or above. Of the estimated 81,443 crashes, 3,600 were maximum (untreatable) injury level crashes. An estimated 995,898 [887,016+108,882] crashes were moderate or minor injury level crashes, and 1.252 mil- lion estimated crashes were no injury level crashes.
Transcript of Overview of the 2017 Crash Investigation Sampling System

NHTSA’s National Center for Statistics and Analysis 1200 New Jersey Avenue SE, Washington, DC 20590
TRAFFIC SAFETY FACTSResearch Note
DOT HS 812 787 September 2019
Overview of the 2017 Crash Investigation Sampling SystemSummaryIn 2017, there were an estimated 2,775,608 police-reported motor vehicle crashes in which at least one passenger vehicle (i.e., a passenger car or a light truck) was towed from the crash scene in the United States, which resulted in an estimated 1,686,240 known passen-ger vehicle occupant injuries. Among these crashes, 2.9 percent (81,443) resulted in crashes with serious injury levels or above, 35.9 percent (995,898) resulted in crashes with moderate or minor injury levels, and 45.1 percent (1,252,388) resulted in crashes with no injury level.
IntroductionThe National Highway Traffic Safety Administration is releasing data from the newly modernized Crash Investigation Sampling System (CISS) – a replace-ment of the National Automotive Sampling System Crashworthiness Data System (NASS CDS). NHTSA designed CISS to select a more efficient and flexible sample using updated traffic and demographic infor-mation and optimizing the sample to better meet data users’ needs. (For more information, see the Technical Report, Crash Investigation Sampling System: Sample Design and Weighting.) In 2017, motor vehicle traffic crashes that each involved at least one passenger vehicle towed from the scene of the crash were sampled, inves-tigated, and coded at 24 newly selected sites across the nation. Weighting procedures were applied to gener-ate nationally representative estimates of such crashes. This Research Note presents an overall summary of
key estimates of crashes in 2017 and provides back-ground on CISS. (For a more detailed explanation of the sample design, estimation protocols, and guidance on how to analyze the new data, please refer to the Crash Investigation Sampling System: Design Overview, Analytic Guidance and FAQs.) In addition to sample design and weighting enhancements, several improvements were made to the information technology infrastructure and operational protocols of CISS to gather more relevant, accurate, and nationally representative data. Some of these improvements are detailed in the Improvements section of this Note.
Results
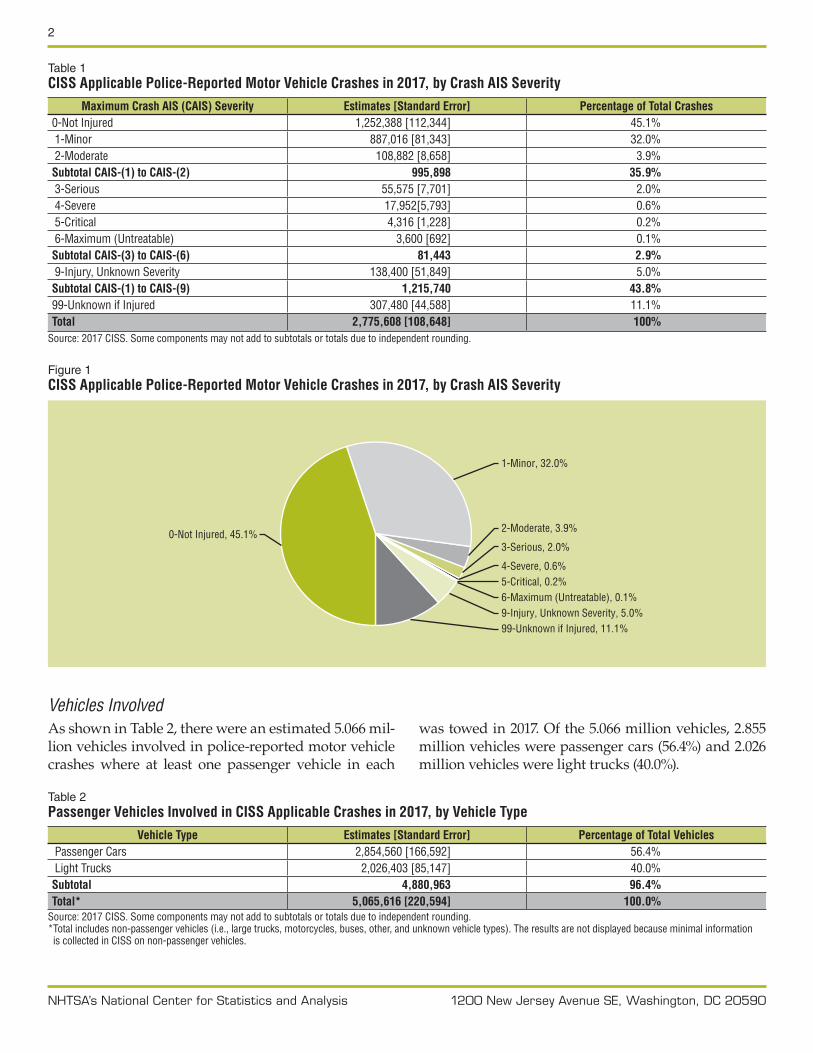
CrashesAs shown in Table 1 and Figure 1, there were an esti-mated 2,775,608 police-reported crashes in 2017 where at least one passenger vehicle in each was towed from the scene. The maximum Crash Abbreviated Injury Scale (CAIS) severity is the basis of Table 1 and Figure 1. The maximum CAIS severity is the most severe injury level among the occupants of a CISS applicable vehicle involved in a crash. There were an estimated 81,443 [55,575+17,952+4,316+3,600] crashes with injury levels of serious or above. Of the estimated 81,443 crashes, 3,600 were maximum (untreatable) injury level crashes. An estimated 995,898 [887,016+108,882] crashes were moderate or minor injury level crashes, and 1.252 mil-lion estimated crashes were no injury level crashes.
2
NHTSA’s National Center for Statistics and Analysis 1200 New Jersey Avenue SE, Washington, DC 20590
Table 1CISS Applicable Police-Reported Motor Vehicle Crashes in 2017, by Crash AIS Severity
Maximum Crash AIS (CAIS) Severity Estimates [Standard Error] Percentage of Total Crashes0-Not Injured 1,252,388 [112,344] 45.1% 1-Minor 887,016 [81,343] 32.0% 2-Moderate 108,882 [8,658] 3.9%Subtotal CAIS-(1) to CAIS-(2) 995,898 35.9% 3-Serious 55,575 [7,701] 2.0% 4-Severe 17,952[5,793] 0.6% 5-Critical 4,316 [1,228] 0.2% 6-Maximum (Untreatable) 3,600 [692] 0.1%Subtotal CAIS-(3) to CAIS-(6) 81,443 2.9% 9-Injury, Unknown Severity 138,400 [51,849] 5.0%Subtotal CAIS-(1) to CAIS-(9) 1,215,740 43.8%99-Unknown if Injured 307,480 [44,588] 11.1%Total 2,775,608 [108,648] 100%
Source: 2017 CISS. Some components may not add to subtotals or totals due to independent rounding.
Figure 1CISS Applicable Police-Reported Motor Vehicle Crashes in 2017, by Crash AIS Severity
1-Minor, 32.0%
2-Moderate, 3.9%
3-Serious, 2.0%
4-Severe, 0.6%5-Critical, 0.2%6-Maximum (Untreatable), 0.1%9-Injury, Unknown Severity, 5.0%99-Unknown if Injured, 11.1%
0-Not Injured, 45.1%
Vehicles InvolvedAs shown in Table 2, there were an estimated 5.066 mil-lion vehicles involved in police-reported motor vehicle crashes where at least one passenger vehicle in each
was towed in 2017. Of the 5.066 million vehicles, 2.855 million vehicles were passenger cars (56.4%) and 2.026 million vehicles were light trucks (40.0%).
Table 2Passenger Vehicles Involved in CISS Applicable Crashes in 2017, by Vehicle Type
Vehicle Type Estimates [Standard Error] Percentage of Total Vehicles Passenger Cars 2,854,560 [166,592] 56.4% Light Trucks 2,026,403 [85,147] 40.0%Subtotal 4,880,963 96.4%Total* 5,065,616 [220,594] 100.0%
Source: 2017 CISS. Some components may not add to subtotals or totals due to independent rounding. * Total includes non-passenger vehicles (i.e., large trucks, motorcycles, buses, other, and unknown vehicle types). The results are not displayed because minimal information is collected in CISS on non-passenger vehicles.

3
NHTSA’s National Center for Statistics and Analysis 1200 New Jersey Avenue SE, Washington, DC 20590
Occupants InvolvedTable 3 shows the maximum AIS (MAIS) severity of vehicle occupants involved in crashes where at least one passenger vehicle in each crash was towed. In 2017, an estimated 4,987,669 passenger vehicle occupants were involved in CISS crashes. Of the 4,987,669 occupants, 4,665 (0.1%) had maximum (untreatable) injuries, 5,056
(0.1%) had critical injuries, 18,534 (0.4%) had severe inju-ries, 64,000 (1.3%) had serious injuries, 152,853 (3.1%) had moderate injuries, 1,246,238 (25.0%) had minor injuries, and 2,834,298 (56.8%) had no injury.
Table 3Occupants Involved in CISS Crashes in 2017, by Maximum AIS
Maximum AIS (MAIS) Severity Estimates [Standard Error] Percentage of Total Occupants0-Not Injured 2,834,298 [165,527] 56.8% 1-Minor 1,246,238 [128,554] 25.0% 2-Moderate 152,853 [13,151] 3.1%Subtotal MAIS- (1) to MAIS-(2) 1,399,091 28.1% 3-Serious 64,000 [7,877] 1.3% 4-Severe 18,534 [5,730] 0.4% 5-Critical 5,056 [1,033] 0.1% 6-Maximum (Untreatable) 4,665 [982] 0.1%Subtotal MAIS-(3) to MAIS-(6) 92,255 1.9% 9-Injury, Unknown Severity 194,894 [75,382] 3.9%Subtotal MAIS-(1) to MAIS-(9) 1,686,240 33.8%99-Unknown if Injured 467,131 [82,880] 9.4%Total 4,987,669 [193,195] 100.0%
Source: 2017 CISS. Some components may not add to subtotals or totals due to independent rounding.
Improvements in CISSSeveral modernizations were undertaken in the areas of sample design/estimation, IT infrastructure, and operational protocols/technology to better align sites and data with emerging data needs. This resulted in an up-to-date, relevant sample that is scalable and flexible. It was built upon a modern IT infrastructure and uses state-of-the art data collection technology.
Sample Design ImprovementsThe CISS sites were selected to provide optimal data collection sites with data needs, statistical precision, and budget in mind. One of the key sampling enhance-ments in CISS was the incorporation of a framework to provide a replacement sample in situations where the vehicle or vehicles in the original sampled case were not available. This resulted in significant improvements in vehicle acquisition rates, i.e., information collected on vehicles and occupants. Towed vehicle inspection acquisition rates in 2017 were 88 percent, about 15 per-cent more than historical NASS CDS rates. Another sample design enhancement includes the scalabil-ity and flexibility of the sample for the CISS sites and police jurisdictions. The scalable and flexible samples allow NHTSA to adjust the sample size to accommo-
date potential budget fluctuations with minimal opera-tional effects. Also, CISS is independent of any other NHTSA survey. More information on sample design enhancements can be found in the technical report Crash Investigation Sampling System: Sample Design and Weighting.
Information Technology EnhancementsThe CISS program consists of an operational compo-nent as well as a robust information technology plat-form. A new platform was completely rebuilt, including consolidation of all system resources into a central-ized web-based system to simplify management and improve overall change control. The coding interface was also fully consolidated from a distributed server model that was previously spread across multiple data centers throughout the country.
The most significant change within the CISS IT is the consolidation of all supporting records for initiating a case to create a set of tools that act as an authorita-tive library for all teams to base their operations on. Included in the library of tools is a platform where source crash reports could be uploaded and used within multiple studies at the same time, which fully replaced a manual decentralized paper-based process. This pro-

4
NHTSA’s National Center for Statistics and Analysis 1200 New Jersey Avenue SE, Washington, DC 20590
cess is further supported by a consolidated application platform that allows for listing, selection, and quality control checks. Following selection and initiation of a case, a baseline shell is created in the coding platform automatically to initiate work on the coding interface. This significant improvement led to a reduction in labor as well as improvements in addressing quality and per-formance concerns quickly.
Additional improvements include supporting the field data collection that uses modern technologies to prevent unintentional damage and data loss, modern-izing the public platform to support current browser and internet requirements, delivering data in a variety of formats such as common delimited text format, and developing a set of data marts to separate the produc-tion data from the final data to eliminate impact on the following year’s production needs.
Data Collection Protocols and Technology ImprovementsTo address the users’ needs for more precise scene and vehicle data, NHTSA made three significant improve-ments in the CISS program: (1) provide more com-prehensive crash scene documentation and scaled diagrams; (2) increase the number and precision of vehicle crush measurements; and (3) make the raw mea-surements collected at the scene available to the public in a format that can be used in most reconstruction and mapping software.
In CISS, scene and vehicle measurements are collected electronically with Nikon Total Stations replacing the manual measurement techniques used in its predeces-sor, NASS CDS. The scene measurements are processed using FARO Blitz diagramming software and scaled diagrams are produced. Scene files are made available to the public in common file formats that can be used in most computer-aided design or mapping software.
Another improvement was to generate vehicle crush by changing the method of measuring crush points from a manual measurement method to an electronic mea-surement method using the total station. Principles for obtaining crush points are similar to the previous man-ual measurement method, in that the damaged vehicle is compared to its undeformed state. However, the effi-ciency and accuracy by which this is done now is a con-siderable upgrade from the earlier systems. Additional detail describing scene and vehicle documentation in
CISS is described in ESV paper 17-0174, Improved Field Measurements in NHTSA’s CISS Program.
To provide more detailed injury information, NHTSA improved the level of injury detail available in CISS by: (1) adding ten data elements to describe injury cau-sation scenarios for seriously injured occupants; (2) using Visual Anatomical Injury Descriptor (VisualAid) software developed by the Department of Defense Army Research Laboratory to enter and present injury data; and (3) adopting the most recent version of the Abbreviated Injury Scale, AIS 2015, produced by the Association for the Advancement of Automotive Medicine. Additional detail is described in ESV paper 17-0173, Documenting Injuries in NHTSA’s CISS Program.
Comparisons of 2017 CISS with CDS, FARS, and CRSSComparisons of 2017 CISS estimates with CDS esti-mates should be performed with caution because they are two completely independent sample surveys designed more than 30 years apart. CISS and CDS have different target populations. CISS targets crashes where at least one passenger vehicle is towed from the scene (for any reason), whereas CDS targets crashes where at least one passenger vehicle is towed due to damage. Since CDS is a subpopulation of CISS, it is possible to combine both data systems. For more information on combining CDS and CISS, refer to the Crash Investigation Sampling System: Design Overview, Analytic Guidance and FAQs.
Additionally, CISS target population is a sub-popula-tion of the Crash Report Sampling System (CRSS) tar-get population. CRSS targets police-reported crashes on a traffic way in the United States. Estimates of total crashes from CISS are similar to the estimates of total crashes from the corresponding CRSS sub-population.
Fatality Analysis Report System (FARS) is a national census of fatal crashes. CISS in-scope fatal crashes are also a sub-population of FARS. However, CISS data are normally collected within one or two weeks after the crash while FARS has much longer time to identify and collect fatal crash data. Due to the nature of serious crashes and injury outcomes, CISS fatal crash counts and FARS may not be comparable.

5
NHTSA’s National Center for Statistics and Analysis 1200 New Jersey Avenue SE, Washington, DC 20590
The 2017 CISS SampleThe map below shows the 24 data collection sites selected for CISS. For 2018 and subsequent data collection years, 32 data collection sites were selected.
Figure 2CISS Data Collection Sites
Crash Investigation Sampling System24 Phase I Data Collection Sites
14419 (11350b)
AlabamaETOWAH
ArizonaMARICOPA
CaliforniaMONTEREY
CaliforniaSACRAMENTO
CaliforniaSAN BERNARDINO
CaliforniaBUTTE
IllinoisGALLATIN, HARDIN, WHITE
IllinoisHENRY, ROCK ISLAND
Maine CUMBERLAND
New JerseyATLANTIC
New YorkNASSAU
MassachusettsBRISTOLRhode IslandNEWPORT
OhioHAMILTON
Ohio DELAWARE, MORROW
Ohio MONTGOMERY, PREBLE
PennsylvaniaCAMERON, POTTER, TIOGA
TexasCOMAL
TexasTARRANT
TexasDALLAS
VirginiaCHESTERFIELD, HOPEWELL CITY
WashingtonASOTIN, WHITMANIdahoLATAH, NEZ PERCE
MassachusettsBERKSHIRE
Wisconsin CHIPPEWA, EAU CLAIRE
OklahomaCARTER
In 2017, CISS selected 2,331 police-reported crashes from 169 police jurisdictions in 24 sites across the coun-try. Each police-reported crash is categorized into 10 analysis domains that were created based on inter-nal and external data needs. Table 4 shows the target sample allocation for each analysis domain compared
to the actual sampled cases for 2017 CISS. The distribu-tion of the 2017 sampled CISS cases is consistent with target sample allocation distribution. Among the 2,331 crashes, 2,035 crashes were eligible to be investigated and included in the final analytic files for estimation.

6
NHTSA’s National Center for Statistics and Analysis 1200 New Jersey Avenue SE, Washington, DC 20590
Table 4CISS Sample Allocation Versus 2017 CISS Sampled Cases
CISS Analysis Domains Description Target Percentage of
Sample Allocation2017 Sampled
Cases1 At least one occupant of towed passenger vehicle is killed 5% 4.2%
2 Crashes not in Stratum 1 involving:• A recent model year passenger vehicle in which at least one occupant is incapacitated. 10% 10.3%
3Crashes not in Stratum 1 or 2 involving:• A recent model year passenger vehicle in which at least one occupant is non-incapacitated,
possibly injured, or injured but severity is unknown.20% 23.0%
4 Crashes not in Stratum 1-3 involving:• A recent model year passenger vehicle in which all occupants are not injured. 15% 15.0%
5 Crashes not in Stratum 1-4 involving:• A mid-model year passenger vehicle in which at least one occupant is incapacitated. 6% 5.5%
6Crashes not in Stratum 1-5 involving:• A mid-model year passenger vehicle in which at least one occupant is non-incapacitated,
possibly injured, or injured but severity is unknown.12% 11.6%
7 Crashes not in Stratum 1-6 involving:• A mid-model year passenger vehicle in which all occupants are not injured. 10% 10.6%
8 Crashes not in Stratum 1-7 involving:• An older model year passenger vehicle in which at least one occupant is incapacitated. 6% 4.7%
9Crashes not in Stratum 1-8 involving: • An older model year passenger vehicle in which at least one occupant is non-incapacitated,
possibly injured, or injured but severity is unknown.10% 9.6%
10 Crashes not in Stratum 1-9 involving: • An older model year passenger vehicle in which all occupants are not injured. 6% 5.6%
Total 100% 100%Source: 2017 CISS. Components may not add to 100 percent due to independent rounding.
Downloading and Analyzing 2017 CISS DataThe 2017 CISS can be downloaded at: ftp://ftp.nhtsa.dot.gov/ciss/2017
The analytic user’s manual can be found at: https://crashstats.nhtsa.dot.gov/Api/Public/ViewPublication/812803
Crash Investigation Sampling System: Design Overview, Analytic Guidance, and FAQs can be found at: https://crashstats.nhtsa.dot.gov/Api/Public/ViewPublication/812801
Crash Investigation Sampling System: Sample Design and Weighting can be found at: https://crashstats.nhtsa.dot.gov/Api/Public/ViewPublication/812804
A databook providing weighted and unweighted uni-variate distributions of the variables in CISS can be found at: https://crashstats.nhtsa.dot.gov/Api/Public/ViewPublication/812802
ReferencesMynatt, M., Rudd, R., Alpert, N., Loftis, K., & Kulaga,
A. (2017). Documenting Injuries in NHTSA’s CISSProgram. Paper presented at 25th EnhancedVehicle Safety Conference, June 5-8, 2017, Detroit,MI. Available at www-esv.nhtsa.dot.gov/Proceedings/25/25ESV-000173.pdf.
Mynatt, M., & Brophy, J. (2017). Improved Field Measurements in NHTSA’s CISS Program. Paper pre-sented at 25th Enhanced Vehicle Safety Conference, June 5-8, 2017, Detroit, MI. Available at www-esv.nhtsa.dot.gov/Proceedings/25/25ESV-000174.pdf.
Zhang, F., Subramanian, R., Chen, C.-L., & Noh, E. Y. (2019, September). Crash Investigation Sampling System: Design overview, analytic guidance, and FAQs. Washington, DC: National Highway Traffic Safety Administration. Available at https://crashstats. nhtsa.dot.gov/Api/Public/ViewPublication/812801
Zhang, F., Noh, E. Y., Subramanian, R., Chen, C.-L. (2019, September). Crash Investigation Sampling System: Sample design and weighting. Washington, DC: National Highway Traffic Safety Administration. Available at https://crashstats.nhtsa.dot.gov/Api/Public/ViewPublication/812804

7
NHTSA’s National Center for Statistics and Analysis 1200 New Jersey Avenue SE, Washington, DC 20590
For questions regarding the information presented in this report, please contact [email protected]. Access this Crash•Stats and other general information on traffic safety at https://crashstats.nhtsa.dot.gov/.
14419-082619-v5
Suggested APA Format Citation for this document:
National Center for Statistics and Analysis. (2019, September). Overview of the 2017 Crash Investigation Sampling System. (Traffic Safety Facts Research Note. Report No. DOT HS 812 787). Washington, DC: National Highway Traffic Safety Administration.