Overview of Research Related to Wisconsin Works (W-2), An
74
An Overview of Research Related to Wisconsin Works (W-2) Demetra Smith Nightingale Kelly S. Mikelson The Urban Institute 2100 M Street, NW Washington, DC 20037 March 2000 This paper was prepared at the Urban Institute for the Wisconsin Works Management and Evaluation Project (MEP) and the Wisconsin Department of Workforce Development (DWD). The Urban Institute is a private, nonprofit, nonpartisan research organization. The Hudson Institute, under contract from DWD, commissioned this paper. Opinions expressed are those of the authors and do not represent official positions of the MEP, DWD, or the Hudson Institute, nor should they be attributed to the Urban Institute, its trustees, or its sponsors.
Transcript of Overview of Research Related to Wisconsin Works (W-2), An

An Overview of Research Related toWisconsin Works (W-2)
Demetra Smith NightingaleKelly S. Mikelson
The Urban Institute2100 M Street, NW
Washington, DC 20037
March 2000
This paper was prepared at the Urban Institute for the Wisconsin Works Management andEvaluation Project (MEP) and the Wisconsin Department of Workforce Development (DWD).The Urban Institute is a private, nonprofit, nonpartisan research organization. The HudsonInstitute, under contract from DWD, commissioned this paper. Opinions expressed are those ofthe authors and do not represent official positions of the MEP, DWD, or the Hudson Institute,nor should they be attributed to the Urban Institute, its trustees, or its sponsors.

Acknowledgements
A draft version of this paper was presented on December 10, 1999, at the “W-2 Research
Assessment and Direction” conference at Wingspread, The Johnson Foundation, in Racine,
Wisconsin. In revising the paper, the authors benefited greatly from comments by conference
participants, researchers who conducted the studies reviewed, and colleagues at the Urban
Institute.
i
EXECUTIVE SUMMARY
With its Wisconsin Works (W-2) program, Wisconsin’s welfare reform is one of the most studied in thenation. This paper summarizes 53 ongoing and recently completed research studies on W-2. Generalfindings from the growing body of research are synthesized and suggestions for future research arepresented to the Wisconsin Department of Workforce Development (DWD) and the W-2 Managementand Evaluation Project (MEP).
Categorization of Studies
The 53 studies were grouped into seven categories which reflect the focus of the studies that have beenundertaken in the two years since W-2 was implemented; many studies fit into multiple categories:
1. Tracking and Follow-Up Studies: Projects that collect and analyze information on individuals atmore than one point in time (e.g., at the time one leaves the caseload and then at one or more futurepoints) to describe or explain changes in income, benefits, services, program participation, andemployment and earnings.
2. Caseload Analysis: Studies of aggregate-level data on caseload decline and composition at the statelevel and/or county level, particularly trends over time.
3. Implementation, Program Development, and Management Analysis: Studies that describe howprograms are structured, are managed, and operate; management information systems; programdesign and planning; program performance; and service delivery.
4. Evaluations of Related Programs or Components: Formal evaluations of W-2, or precursors to W-2,that measure the (net) impact on individuals, families, or children using either experimental randomassignment or quasi-experimental designs.
5. Research on Services and Needs of the Target Population: Studies of different populations orsubgroups, particular services or needs for services, or benefits and services other than cash.
6. Job Demand and Employment Research: Studies of employer demand for workers, labor markettrends, and employment outcomes.
7. Research on Child Support and Fathers: Studies and evaluations of child support enforcementissues, programs, and components, as well as studies of services and programs for noncustodialparents.
General Findings
The review of existing research suggests a number of general observations about W-2 and the focus ofcurrent research:
• Caseload decline. It is a well-documented fact that the cash assistance caseload in Wisconsin hasdeclined substantially, by over 80 percent, in the past decade. The caseload decline is among thehighest of all states. Over 85 percent of the remaining cases are in Milwaukee. There is lessconsensus, though, about the role that W-2 and its antecedents per se have had in the caseloaddecline, and the contribution of particular aspects of Wisconsin’s reforms to the reduction in thecaseload.

ii
• Former recipients’ employment and wages. As in other states, early evidence from several studiesshows that most of those leaving the assistance rolls in Wisconsin are working. At least 75 percent offormer recipients work some in each year after they leave the rolls, and the earnings of those whowork appear to increase in subsequent years. Earnings for those who work are $7.00 to $8.00 perhour, even three years after leaving the rolls. Less than half of former recipients, though, arecontinuously employed.
• Poverty. There is some evidence that the poverty rate among former cash recipients in Wisconsinwho work is declining over time, and that the combination of work plus other benefits (e.g., EarnedIncome Credits (EIC) and food stamps) helps reduce their poverty rate. While the trend is promising,the poverty rate could be reduced further since more than half of all former welfare recipients remainin poverty. There is little information about, and little consensus on, whether W-2 and related policychanges are moving families out of poverty.
• Well-being and self-sufficiency. There is currently little empirical analysis on the effect of W-2 on theself-sufficiency of families and children, ongoing hardships, or the extent of unmet need for servicesand assistance. However, there is descriptive and community-based information that suggests someamount of ongoing need for services.
• Program implementation. Thus far, there is mainly anecdotal (but still useful) information about theimplementation, management, and operations of W-2. Key reports are expected soon from studies onthe program in Milwaukee, but there is little systematic research on the management andimplementation of the program statewide or in the other 71 counties.
Implications and Future Directions
Based on the review and general findings, suggestions in six areas are offered to DWD and the MEP forconsideration as the W-2 research agenda is refined.
• Continue to encourage a range of research. The MEP should continue to encourage a broad rangeof studies by a variety of analysts. The more empirical academic studies (e.g., of caseload trends, andlong-term employment and income) should continue, to refine the precision of findings. But otherless academic projects, including those by advocacy groups, should also be encouraged, to continue tomonitor the experiences of individuals and families, since that perspective might otherwise not beavailable to policy makers.
• Focus more policy and research attention on supports for working poor. Wisconsin’s reputationfor accomplishing its welfare reform goals is well deserved. The research suggests that the challengenow is perhaps more related to increasing incomes for those who are working than to reducingwelfare recipiency (which has basically been achieved for many). Many positive developments havecome about during the W-2 era. Welfare has been eliminated and replaced with work-basedassistance. Now Wisconsin can also take the lead in addressing the needs of working poor families inthe post-welfare policy world.
• Focus more research on former welfare recipients who are not working. State policy makersshould continue to focus on understanding and meeting the challenges of the poor in Wisconsin whohave left the cash assistance caseload but are not currently working. While over 80 percent of formerrecipients work in at least one quarter in the following year, nearly 20 percent do not have earnings

iii
from work after leaving W-2. It is important to determine how these people are supportingthemselves and what services are needed to help them obtain and retain employment. Very little isknown about how those who are not working are managing to support themselves.
• Conduct more analysis on the changing characteristics of the caseload. While the caseload hasdeclined, those left on cash assistance are probably less employable than those who left earlier. Thisis true not only in Wisconsin, but nationwide. There is less information from the existing research,though, about those who are still left in the W-2 caseload than there is about those who left the rolls.More analysis on the characteristics of families receiving other related services and benefits, such asfood stamps, Badger Care, and Kinship Care, is also warranted. Over time, as state policy questionsshift from the very small W-2 caseload to the larger poverty population, it will be important to havemore information on the broader population and its needs.
• Sponsor targeted demonstrations and evaluations. While it may not be possible to mount a majorexperimental design evaluation of the impact of W-2 on families and individuals, there are manyissues on which targeted demonstrations with experimental design evaluations would prove valuableand which could be conducted within the current parameters of W-2. For example, W-2 includesseveral innovative features on which there is currently little research (e.g., community service jobs,W-2 transitional work activity). Evaluations of planned variation demonstrations could provideuseful information, if they are carefully designed, and need not alter the main features of W-2.
• Encourage studies of implementation and management. The state should encouragecomprehensive studies of the implementation of W-2. While many of the 53 studies reviewedaddress aspects of program operations and management, none of the reports yet available focus on theoverall implementation of W-2, which incorporates a number of innovative organizational,management, and service delivery strategies. There is much interest in other states about not only thefamily and caseload outcomes of W-2, but how Wisconsin is reforming welfare.
W-2 and related policy changes reflect the high priority Wisconsin officials continue to place on welfarereform and family and child well-being. In addition, the strategies being adopted and the experiencesWisconsin has in implementing its reforms are of high interest to the national policy community. Bycontinuing to support research and encourage open and unfiltered dialogue about findings from variousstudies, state officials and the MEP can both continue to refine policies and improve programs withinWisconsin and also contribute much to other states attempting to reform welfare.

Table of Contents
I. Introduction ............................................................................................................................. 1A. The W-2 Program.............................................................................................................................2
B. The MEP ...........................................................................................................................................6
C. Overview of the Paper......................................................................................................................8
II. Inventory of Studies ........................................................................................................... 10A. Tracking and Follow-up Studies ...................................................................................................11
B. Caseload and Aggregate Analysis .................................................................................................18
C. Implementation and Management Studies ..................................................................................18
D. Program Evaluations .....................................................................................................................19
E. Studies of Individual Services and Needs.....................................................................................20
F. Labor Market and Employment Studies......................................................................................20
G. Studies on Child Support and Fathers .........................................................................................21
III. Findings and Implications ................................................................................................. 22A. The Cash Assistance Caseload Is Declining .................................................................................23
B. Most Former Recipients Work but at Low Wages......................................................................27
C. Poverty Rates Are Falling but Remain High ...............................................................................30
D. There Is Still Some Unmet Need ...................................................................................................33
E. Future Directions............................................................................................................................37
References..................................................................................................................................... 43
Appendix A: W-2 Reports and Documents
Appendix B: Summary of Research Studies

1
I. Introduction
In September 1997, Wisconsin Works (W-2) replaced the Aid to Families with
Dependent Children (AFDC) system of cash assistance. This paper summarizes ongoing and
recently completed research being conducted about the W-2 program. Much of the welfare
reform research agenda in Wisconsin is directed by the Wisconsin Works Management and
Evaluation Project (MEP). Established in August 1996, the MEP is an umbrella group that
manages and coordinates the state-funded research relating to W-2 with the work of outside
researchers. In this paper, the MEP’s current research agenda is reviewed and a general
summary of the research to date is provided, based on an examination of 53 studies.1
This overview categorizes the types of studies that have been (or are being) conducted,
identifies general findings on which there seems to be consensus, and identifies gaps in current
knowledge about key aspects of W-2 that warrant future research. Where relevant, the W-2
studies and findings are placed into a broader national context. The intent is not to review in
detail nor critique the methodologies or analyses of every study. Rather, the intent is to
synthesize information and findings emerging from this ever expanding body of research and to
provide Wisconsin’s policy makers and administrators an objective “outsider’s” perspective on
the research. That is, this is a preliminary synthesis of findings from a number of studies, but it
is not a definitive review of all literature related to W-2 nor of all the studies included in this
overview.
1 National welfare reform legislation was enacted by Congress under the Personal Responsibility and WorkOpportunity Reconciliation Act (PRWORA) of 1996 and all states replaced the former AFDC system withTemporary Assistance for Needy Families (TANF). Wisconsin implemented three programs between 1990 and1996 before TANF, including Work Not Welfare (WNW), Self-Sufficiency First (SSF), and Pay for Performance(PFP). W-2 is the latest program in Wisconsin’s welfare reform and builds on these prior programs.

2
A. The W-2 Program
W-2 is based on work participation and personal responsibility. There is no entitlement
to cash assistance. Rather, W-2 incorporates strict requirements to work and provides a broad
array of services, as needed, to help eligible Wisconsin residents obtain self-sustaining
employment. Cash is given only in return for demonstrated work effort, not on the basis of need
alone. W-2 is guided by the following eight principles (Wisconsin Department of Workforce
Development (DWD) 1999a):
1. Work Not Welfare. “For those who can work, only work should pay.”
2. Personal Responsibility. “W-2 assumes everybody is able to work, or, if not, atleast capable of making a contribution to society through work activity withintheir abilities.”
3. Strong Families. “Families are society’s way of nurturing and protectingchildren, and all policies must be judged in light of how well these policiesstrengthen the responsibility of both parents to care for their children.”
4. Value of Work. “The benchmark for determining the new system’s fairness is bycomparison with low-income families who work for a living, not by comparisonwith those receiving various government benefit packages.”
5. Independence and Self-Sufficiency. “There is no entitlement. The W-2 rewardsystem is designed to reinforce behavior that leads to independence and self-sufficiency.”
6. Community Support. “Individuals are part of various communities of people andplaces. W-2 operates to enhance the way communities support individual effortsto achieve self-sufficiency.”
7. Minimal Necessary Services. “The W-2 system provides only as much serviceas an eligible individual asks for or needs. Many individuals will do much betterwith just a light touch.”
8. Managed Competition for Delivering Services. “W-2’s objectives are bestachieved by working with the most effective providers and by relying on marketand performance mechanisms.”

3
Thus, W-2 eliminated the entitlement to cash welfare and replaced it with a system of
work-based supports. W-2 services are intended to help workers maintain economic self-
sufficiency and independence. But an additional objective of W-2 is to improve the efficiency
with which public services are provided when they are needed to achieve economic self-
sufficiency.
Along with introducing changes in the entire system of public assistance benefits, the
state also restructured the organizational system for administering programs and delivering
services at the state and local levels. At the state level, most public assistance functions (W-2,
food stamps, and Wisconsin Shares child care) are now integrated within the restructured
Department of Workforce Development (DWD). DWD is also responsible for child support
enforcement and the state’s workforce preparation policies, including one-stop career centers,
job training, and general employment services. Some other key public assistance and social
services functions important to W-2 are separately administered by the Department of Health and
Family Services (DHFS), including the policy development and payment aspects of health care
(including Medicaid and BadgerCare), some child care, child welfare (including Kinship Care),
the caretaker supplement for SSI parents, and some services for special populations such as those
with mental and physical disabilities, substance abuse problems, and victims of domestic
violence.
At the local level, program administration has been restructured as well, based on
principles of privatization and managed competition, whereby public, nonprofit, and for-profit
entities compete to operate various components of W-2 at the local level. Historically, each of
the 72 counties in Wisconsin administered AFDC and related services. Under W-2, a market-
based service delivery system was created to encourage improved performance through market
4
competition. Counties were given first option to become the designated W-2 agency. One of the
criteria for a county human services agency being designated was its success at reducing the cash
welfare caseload. Most counties met the caseload reduction challenge, and county human
services agencies are, therefore, administering W-2 in most localities. In Milwaukee County and
eight other counties, private agencies were selected through a competitive process to receive
contracts to administer W-2. In Milwaukee County, DWD involved the Private Industry Council
(PIC) of Milwaukee County in the panel that reviewed proposals from private agencies for the
Milwaukee W-2 contracts. DWD also contracts with the PIC to assist with some aspects of
oversight administration of the Milwaukee W-2 contracts.
The restructured system is responsible for administering the various W-2 components, all
of which are premised on employment—assisting, encouraging, and requiring individuals to
work. Like AFDC before it, W-2 is available to low-income parents who also have low assets.
But unlike AFDC, W-2 emphasizes immediate work or work activities, not necessarily providing
cash assistance. In a local W-2 agency/job center, each eligible participant meets with a
Financial and Employment Planner, who helps the person develop a self-sufficiency plan and
places him or her in one of the four W-2 employment or work training levels (Wisconsin DWD
1999c):
• Unsubsidized employment (for those who are “job ready”)
• Trial jobs (subsidized employment for individuals unable to locate unsubsidizedwork)
• Community service jobs (for those who need to practice the work habits and skillsnecessary to be hired by a regular employer)
• W-2 transition (for those who, because of severe barriers, are unable to performindependent, self-sustaining work)

5
A participant enters the highest possible employment or work training level according to
his or her ability and is expected to move up to the next appropriate level at the earliest
opportunity. Table 1 summarizes the four work tiers and the main features of each.
Table 1: The Four Tiers of Wisconsin Works
Work Tier Income/Payments Work Requirement Time Limit
UnsubsidizedEmployment
Market wage Unspecified None
Trial Jobs(Employersreceive up to$300 per month)
At leastminimum wage
Unspecified 3 months per placementwith an option for one3-month extension; 24months (extensionsgranted on a case-by-case basis)
CommunityService Jobs
$673 per month Up to 30 hours per weekand up to 10 hours perweek in education andtraining
6 months per placementwith an option for one3-month extension; 24months (extensionsgranted on a case-by-case basis)
W-2 Transition $628 per month 28 hours per week ofwork activities plus upto 12 hours per week ineducation and training
24 months (extensionsgranted on a case-by-case basis)
Sources: Meyer and Cancian 1999; Wisconsin DWD 1998.
Wisconsin is unique among states both in terms of the scope of its welfare reform and in
terms of its simultaneous efforts to restructure program administration and implement
management efficiency practices. While many states have designed their welfare reform policies
to be work-centered, Wisconsin is the only state that has enacted legislation to end traditional
welfare. Wisconsin is also one of a few states that are consciously complementing welfare
reform with other services and supports to comprehensively achieve the goals of economic self-
sufficiency through employment and child and family well-being. The state Earned Income

6
Credit (EIC), Wisconsin Shares Child Care, the SSI Caretaker Supplement, Child Support
Enforcement Initiatives, and BadgerCare (medical coverage) are considered integral to welfare
reform. In addition, the W-2 administrative and management reforms were instituted to
maximize service delivery efficiency and incorporate continuous performance improvement into
overall management.
B. The MEP
One dimension of W-2’s management reforms involves improving the administrative use
of information, analysis, and research. The state expects W-2 to both improve economic
outcomes and well-being of families and children and improve the administration of public
programs and the delivery of public services. The Wisconsin Works Management and
Evaluation Project (MEP) was established by Governor Thompson and the Department of
Workforce Development (DWD) in August 1996 to pursue key aspects of the administrative goal
and, in doing so, also improve outcomes for families and children. Here again, Wisconsin is
unique among states in the priority placed on institutionalizing the use of research and analysis
into ongoing management.
The MEP serves as an umbrella group to manage and coordinate the state’s evaluation
program. It also aims to improve the state’s ability to use the work of outside specialists both to
improve program management and administration and to conduct research on the effectiveness
of W-2.
Five goals have been drafted for the MEP, and approval by its Steering Committee is
pending (Wiseman 2000):
1. “Facilitate statewide implementation of W-2.”

7
2. “Contribute to the development and implementation of a managementinformation system (MIS) appropriate to the needs of W-2 operators at boththe local and state levels.”
3. “Design and implement an effective and credible program of evaluation ofW-2 components in light of program goals.”
4. “Assist the Department [of Workforce Development] in finding ways tomaximize discretion provided W-2 providers in program operation whilecreating incentives for attaining W-2 goals.”
5. “Assist the Department in complying with all federal and state requirementsapplicable to W-2 operation and in obtaining federal, state, and privatesupport for the W-2 implementation and evaluation effort.”
Thus, consistent with the mandate of W-2, the MEP is concerned with both management/
implementation and outcomes/effectiveness (implied within goal 3). In developing the plan for
the MEP agenda, the Steering Committee also restated key outcomes goals of W-2, since it is
these program goals on which the MEP is to focus some of its efforts (under MEP goal 3 above):
1. “Reduce the number of Wisconsin families that need public assistance.”
2. “Increase family and children’s well being.”
3. “Improve labor market functioning.”
4. “Increase the efficiency (cost effectiveness) of public assistance delivery.”
5. “Improve public assessment of state and local public assistance operations.”
To address its objectives, the MEP developed a framework that divides its research and
analysis activities into six categories:
1. W-2 Concept and Politics. This area covers the basic ideology, politicalmotivation, and architecture of the initiative.
2. W-2 Operations. This area covers issues related to general programimplementation and operations matters, including administrative capacity,management information systems, performance measures, personnel systems,provider contracts, site management, and system management.
8
3. W-2 Building Blocks. This area is further subdivided into what the MEPconsiders the “building blocks” of the W-2 program as encountered byparticipants: case management, participant activities, component services,and related programs.
4. W-2 and People. This area concerns the W-2 approach to and effects uponWisconsin’s adults, their families, and their children.
5. W-2 and the Labor Market. This area focuses on the role of W-2 inWisconsin’s labor market and the consequences for labor supply, laborquality, and business productivity.
6. W-2 and Public Opinion. Here the MEP addresses the effects of W-2 ontaxpayer, provider, and participant attitudes toward public assistance ingeneral and the W-2 system.
Thus, the underlying objectives of the MEP are to both (a) learn about the effects and
outcomes of W-2 and (b) institute continuous performance improvement in management and
operations. This is no simple endeavor. But the experiences, challenges, difficulties, and
innovations that the MEP and DWD encounter in this process will be of great interest to policy
makers at the national level and officials and administrators in other states. The state has an
exciting opportunity to serve as a model for how other states might consider a similarly
integrated analysis and management strategy that is dynamic enough to serve state officials’
needs and rigorous enough to meet academic standards of good research.
C. Overview of the Paper
In the next section, an inventory of MEP-linked studies as well as other studies not linked
to the MEP is presented. Currently, there are 20 MEP-linked studies, 9 of which have been
completed, with the remaining 11 still in progress. In addition, 33 studies about W-2 or related
issues but that are not linked to the MEP are also reviewed; only one of these is still in progress.

9
A complete list of all the studies and reports reviewed, their purpose, outcomes analyzed, major
findings, and other brief comments can be found in Appendices A and B.
While there are certainly more than 33 studies about welfare reform in Wisconsin that
are not linked to the MEP, most of the major studies relating to W-2 are included in this review.
In addition, the review is limited to studies that are specifically focused on W-2 or programs that
preceded W-2. Many other research projects include Wisconsin among their study states (e.g.,
U.S. General Accounting Office reports, multi-site program or demonstration evaluations, multi-
site implementation studies). Findings from other such studies are incorporated where relevant
into this report.
Section III summarizes areas of emerging consensus about the W-2 program and its
implementation over the past two years based on both MEP-linked and nonlinked studies in
Wisconsin. Finally, implications related to the MEP agenda and to W-2 that warrant future
research are discussed in the final section.
10
II. Inventory of Studies
There is some appeal to reviewing the various studies according to one or all of the goals
and objectives for W-2 and/or the MEP noted above. That is, one might want to review the
research findings related to the stated goals of W-2 and consider the extent to which W-2 is
having the desired results on individuals, families, children, the public, and the labor market.
Similarly, there would also be value to reviewing studies according to the objectives that the
MEP established for itself or by the framework established for its research agenda. Once the
MEP has finalized its agenda and framework, it will be useful to examine these studies in light of
the MEP agenda and framework. To date, though, the studies that have been conducted cluster
around a number of key—and current—issues related to the actual evolution of W-2, particularly
the transition from AFDC to W-2, caseload trends, and the economic status of individuals who
have left cash assistance.
Therefore, rather than group the various studies according to the various lists of W-2 or
MEP objectives, in this report the studies are grouped according to categories which reflect the
focus of the studies that have been undertaken in the two years since W-2 was implemented:
1. Tracking and Follow-Up Studies: Projects that collect and analyze informationon individuals at more than one point in time (e.g., at the time one leaves thecaseload and then at one or more future points) to describe or explain changes inprogram participation, employment and earnings, income, benefits, and servicereceipt.
2. Caseload Analysis: Studies of aggregate-level data on caseload decline andcomposition at the state level and/or county level, particularly trends over time.
3. Implementation, Program Development, and Management Analysis: Studiesthat describe how programs are structured, are managed, and operate;management information systems; program design and planning; programperformance; and service delivery.

11
4. Evaluations of Related Programs or Components: Formal evaluations of W-2,or precursors to W-2, where the objective is to measure the (net) impact onindividuals, families, or children using either random assignment experimental orquasi-experimental designs.
5. Research on Services and Needs of the Target Population: Studies ofparticular populations or subgroups, particular services or needs for services, orbenefits and services other than cash.
6. Job Demand and Employment Research: Studies of employer demand forworkers, labor market trends, and employment outcomes.
7. Research on Child Support and Fathers: Studies and evaluations of childsupport enforcement issues, programs, and components, as well as studies ofservices and programs for noncustodial parents.
Although many other categories could have been chosen, this grouping was developed
because it reflects the actual studies themselves, facilitates a discussion of the findings, and helps
frame suggestions for future research. Not surprisingly, most studies do not fit neatly into any
one category. The inventory in Table 2 lists each study under one of the seven categories that
best represents its primary focus and cross-references other categories that are also addressed in
the study. The types of studies in each category are briefly described in this section, followed by
a discussion of the general findings suggested by the entire body of research.
A. Tracking and Follow-Up Studies
There is great interest in Wisconsin and nationwide in understanding the characteristics
of those individuals and families still on welfare and what is happening to individuals who leave
welfare. In Wisconsin, as in a number of other states, several studies are tracking current and
former public assistance recipients. Sixteen of the 53 studies on W-2 analyze information on
individuals, families, or cases at more than one point in time, using surveys or administrative
data. Three of these studies track individuals statewide. One of the more important ongoing

Table 2: Inventory of MEP-Linked and Non-MEP Studies in Wisconsin
* In some cases a report was unavailable for review. In these cases, documents that were reviewed (e.g., Time 1 summary,project proposal, draft report, etc.) are identified in brackets.
12
Date of Report*
MEP
Non-M
EP
Title of Study
Tracking and Follow-U
p
Caseload and A
ggregateA
nalysis
Implem
entation,Program
Developm
ent,&
Managem
ent
Evaluation of Related
Programs
Population Services,N
eeds, and Benefits
Job Dem
and andEm
ployment
Child Support and
Fathers
Tracking and Follow-Up StudiesForthcoming Summer
2000[Time 1 summary]
X La Crosse County W-2 Research Consortium.Forthcoming Summer 2000. La Crosse CountyW-2 Research Summary. La Crosse, WI: TheResearch Consortium.
X
Forthcoming March2000
[project proposal]
X Institute for Research on Poverty. Forthcomingin March 2000. What Happens to FamiliesUnder Wisconsin Works in Milwaukee?Madison, WI: The Institute.
X
Forthcoming Fall 1999[draft report]
X Cancian, Maria, et al. 1999b. Before and AfterTANF: The Economic Well-Being of WomenLeaving Welfare. Madison, WI: The Institutefor Research on Poverty.
X X
Forthcoming Fall 1999[Wave 1 summary]
X Institute for Research on Poverty. ForthcomingFall 1999. Experience of Dane County W-2Participants 1997-1998. Madison, WI: TheInstitute.
X X
1999 X Center for Self-Sufficiency. 1999. HomelessFamilies in Milwaukee After Welfare Reform:A Longitudinal Look at the Causes and Effectsof Homelessness. Milwaukee, WI: The Center.
X
1999 X St. Norbert College Survey Center. 1999. W-2Welfare Reform Survey. De Pere, WI: TheSurvey Center.
X X
1999 X Swartz, Rebecca, et al. 1999. Converting toWisconsin Works: Where Did Families GoWhen AFDC Ended in Milwaukee? Madison,WI: The Hudson Institute and Washington,DC: Mathematica Policy Research.
X X X
1999 X Wisconsin Department of WorkforceDevelopment. 1999. Wisconsin Works:Survey of Those Leaving AFDC or W-2 Januaryto March 1998 Preliminary Report. Madison,WI: The Department.
X X
1999 X Wiseman, Michael. 1999a. In Midst ofReform. Assessing the New FederalismDiscussion Paper 99-03. Washington, DC: TheUrban Institute.
X X
1998 X Cancian, Maria, et al. 1998. Post-ExitEarnings and Benefit Receipt Among ThoseWho Left AFDC in Wisconsin. Madison, WI:The Institute for Research on Poverty.
X X
1998[summary/presentation]
X Putz, Marilyn. 1998. Walworth County W-2Program: W-2 Follow-Up Study. Elkhorn, WI:Walworth County Job Center.
X

Table 2: Inventory of MEP-Linked and Non-MEP Studies in Wisconsin
* In some cases a report was unavailable for review. In these cases, documents that were reviewed (e.g., Time 1 summary,project proposal, draft report, etc.) are identified in brackets.
13
Date of Report*
MEP
Non-M
EP
Title of Study
Tracking and Follow-U
p
Caseload and A
ggregateA
nalysis
Implem
entation,Program
Developm
ent,&
Managem
ent
Evaluation of Related
Programs
Population Services,N
eeds, and Benefits
Job Dem
and andEm
ployment
Child Support and
Fathers
1997 X Pawasarat, John. 1997a. The EmployerPerspective: Jobs Held by the MilwaukeeCounty AFDC Single-Parent Population(January 1996-March 1997). Milwaukee, WI:The Employment and Training Institute.
X X
1997 X Pawasarat, John. 1997b. Employment andEarnings of Milwaukee County Single-ParentAFDC Families: Establishing Benchmarks forMeasuring Employment Outcomes Under W-2.Milwaukee, WI: The Employment andTraining Institute.
X X
Caseload and Aggregate Analysis1999 X Brookings Institution. 1999. The State of
Welfare Caseloads in America's Cities: 1999.Washington, DC: The BrookingsInstitution/Center on Urban & MetropolitanPolicy.
X
1999 X Mead, Lawrence M. 1999b. “The Decline ofWelfare in Wisconsin.” Journal of PublicAdministration Research and Theory, Vol. 9,No. 4: 597-622.
X X
1999 X Moore, Thomas S., and Vicky Selkowe. 1999.The Growing Crisis Among Wisconsin'sPoorest Families: A Comparison of WelfareCaseload Declines and Trends in the State'sPoverty Population, 1986-1997. Milwaukee,WI: The Institute for Wisconsin's Future.
X
1998 X Employment and Training Institute. 1998.Employment and Economic Well-Being ofFamilies in Central City MilwaukeeNeighborhoods. Milwaukee, WI: The Institute.
X X X
1996 X Wiseman, Michael. 1996. State Strategies forWelfare Reform: The Wisconsin Story. IRPReprint Series. Madison, WI: Institute forResearch on Poverty.
X
Implementation, Program Development, and Management AnalysisForthcoming January
2000[project proposal]
X Manpower Demonstration ResearchCorporation. Forthcoming January 2000.Study of W-2 Implementation in Milwaukee.New York, NY: MDRC.
X X
Forthcoming[project summary]
X Wisconsin Department of WorkforceDevelopment. Forthcoming. Wisconsin Policyand Administrative Database (WisPAD).Madison, WI: The Department.
X
1999 X Courtney, Mark, et al. 1999. WisconsinAdministrative Link Between CARES andHSRS. Madison, WI: The Institute forResearch on Poverty.
X

Table 2: Inventory of MEP-Linked and Non-MEP Studies in Wisconsin
* In some cases a report was unavailable for review. In these cases, documents that were reviewed (e.g., Time 1 summary,project proposal, draft report, etc.) are identified in brackets.
14
Date of Report*
MEP
Non-M
EP
Title of Study
Tracking and Follow-U
p
Caseload and A
ggregateA
nalysis
Implem
entation,Program
Developm
ent,&
Managem
ent
Evaluation of Related
Programs
Population Services,N
eeds, and Benefits
Job Dem
and andEm
ployment
Child Support and
Fathers
1999 X Kaplan, Thomas, and Ingrid Rothe. 1999. NewHope and W-2: Common Challenges, DifferentResponses. Madison: WI: The Institute forResearch on Poverty.
X
1999 X Mead, Lawrence M. 1999a. Statecraft: ThePolitics of Welfare Reform in Wisconsin.Madison, WI: Institute for Research onPoverty.
X
1999 X Wiseman, Michael. 1999b. A ManagementInformation Model for New-Style PublicAssistance. Assessing the New FederalismDiscussion Paper 99-10. Washington, DC: TheUrban Institute.
X
1998 X Hoffman, Caroline, and Amy Fisher. 1998.Families in Poverty: Parents with Disabilitiesand Their Children. Madison, WI: WisconsinCouncil on Developmental Disabilities.
X X
1998 X Institute for Wisconsin's Future. 1998a.Transitions to W-2: The First Six Months ofWelfare Replacement. Milwaukee, WI: TheInstitute.
X X X
1998 X Itzkowitz & Associates. 1998. Portage CountyHealth and Human Services Family Survey.Stevens Point, WI: Itzkowitz & Associates.
X X
1998 X Kaplan, Thomas. 1998. Wisconsin's W-2Program: Welfare as We Might Come to KnowIt. IRP Discussion Paper 1173-98. Madison,WI: The Institute for Research on Poverty.
X
1998 X Milwaukee Women and Poverty PublicEducation Initiative. 1998. W-2 CommunityImpact Study. Milwaukee, WI: The Initiative.
X X
1998[abstract]
X Wulff, Damian. 1998. W-2 ImplementationImpact in Marathon County Wisconsin:Welfare Roll Reductions: Where Did All theFamilies Go? Senior thesis submitted toThomas J. Kaplan, LaFollete Institute of PublicAffairs.
X
1995 X Corbett, Thomas J. 1995. Welfare Reform inWisconsin: The Rhetoric and the Reality. IRPReprint Series. Madison, WI: Institute forResearch on Poverty.
X
Evaluation of Related Programs1999 X Bos, Johannes M., et al. 1999. New Hope for
People with Low Incomes: Two-Year Results ofa Program to Reduce Poverty and ReformWelfare. New York, NY: ManpowerDemonstration Research Corporation.
X X

Table 2: Inventory of MEP-Linked and Non-MEP Studies in Wisconsin
* In some cases a report was unavailable for review. In these cases, documents that were reviewed (e.g., Time 1 summary,project proposal, draft report, etc.) are identified in brackets.
15
Date of Report*
MEP
Non-M
EP
Title of Study
Tracking and Follow-U
p
Caseload and A
ggregateA
nalysis
Implem
entation,Program
Developm
ent,&
Managem
ent
Evaluation of Related
Programs
Population Services,N
eeds, and Benefits
Job Dem
and andEm
ployment
Child Support and
Fathers
1999 X Cancian, Maria, Thomas Kaplan, et al. 1999.Wisconsin's Self-Sufficiency First/Pay forPerformance Program: Results and Lessonsfrom a Social Experiment. Madison, WI: TheInstitute for Research on Poverty.
X
Population Services, Needs, and Benefits ResearchForthcoming Winter
1999[draft report]
X Mathematica Policy Research. ForthcomingWinter 1999. A Study of Infant Care UnderWelfare Reform. Washington, DC: MPR.
X X
1999 X Employment and Training Institute. 1999.State of Milwaukee's Children: Family Incomeand Economic Support. Milwaukee, WI: TheInstitute.
X X
1999 X University of Wisconsin Milwaukee Center forEconomic Development. 1999. SupportService Utilization Among Head Start Parentsin Wisconsin. Milwaukee, WI: The Center.
X X
1998 X Catholic Charities of the Archdiocese ofMilwaukee, Inc., and Wisconsin CatholicConference. 1998. Raising Children in aWorld of Work Not Welfare. Milwaukee, WI:Catholic Charities.
X
1998[project summary]
X Ebert, Rose, et al. 1998. W-2 Follow-UpSurvey. Manitowoc, WI: Forward ServiceCorporation, Manitowoc Job Center.
X X
1998 X Hunger Task Force of Milwaukee and HungerAction Team. 1998. Initial Findings on theImpact of Wisconsin Works on Food Securityand Employment. Milwaukee, WI: The TaskForce.
X
1998 X Magill, Robert S. 1998. Food Programs andWelfare Reform in Milwaukee. Milwaukee,WI: School of Social Welfare.
X
1998 X Michaliski Turner, Diane. 1998. Stated andUnstated Needs: Low-Income Parents andChild Care. Madison, WI: University ofWisconsin-Madison, Women's StudiesResearch Center.
X
1998 X Pawasarat, John, and Frank Stetzer. 1998.Removing Transportation Barriers toEmployment: Assessing Driver's License andVehicle Ownership Patterns of Low-IncomePopulations. Milwaukee, WI: TheEmployment and Training Institute.
X X
1998 X Pawasarat, John, and Lois M. Quinn. 1998.Removing Barriers to Employment: The ChildCare-Jobs Equation. Milwaukee, WI: TheEmployment and Training Institute.
X X

Table 2: Inventory of MEP-Linked and Non-MEP Studies in Wisconsin
* In some cases a report was unavailable for review. In these cases, documents that were reviewed (e.g., Time 1 summary,project proposal, draft report, etc.) are identified in brackets.
16
Date of Report*
MEP
Non-M
EP
Title of Study
Tracking and Follow-U
p
Caseload and A
ggregateA
nalysis
Implem
entation,Program
Developm
ent,&
Managem
ent
Evaluation of Related
Programs
Population Services,N
eeds, and Benefits
Job Dem
and andEm
ployment
Child Support and
Fathers
1997 X Koehn, Susan, and Jane Ahlstrom. 1997.Kenosha County W-2 Child CareImplementation and Design Evaluation.Kenosha, WI: Kenosha County EvaluationPlanning Group.
X X
Job Demand and Employment ResearchForthcoming Spring
2000[project summary]
X Holzer, Harry J. Forthcoming Spring 2000.Milwaukee Employer Survey: Will EmployersHire Welfare Recipients?
X
1999 X Pawasarat, John, and Lois M. Quinn. 1999.Survey of Job Openings in the MilwaukeeMetropolitan Area: Week of May 17, 1999.Milwaukee, WI: The Employment andTraining Institute.
X
1998 X Institute for Wisconsin's Future. 1998b. TheW-2 Job Path: An Assessment of theEmployment Trajectory of W-2 Participants inMilwaukee. Milwaukee, WI: The Institute.
X X
1997 X Kleppner, Paul, and Nikolas Theodore. 1997.Work After Welfare: Is Wisconsin's BoomingEconomy Creating Enough Jobs? Published byThe Midwest Job Gap Project.
X
Project on holdindefinitely
X Manpower Demonstration ResearchCorporation. Wisconsin EmploymentRetention/Career Advancement. Project onhold indefinitely.
X
Child Support and Fathers ResearchForthcoming 2000[project summary]
X Wisconsin Department of WorkforceDevelopment. Forthcoming 2000. TeamParenting Demonstration Project. Madison,WI: The Department. (HHS ResponsibleFatherhood; Ford Foundation Fragile Families).
X X X
Forthcoming[project summary]
X Mathematica Policy Research. Forthcoming.Nontraditional Opportunities for Work (NOW).Princeton, NJ: MPR. (Welfare-to-Work GrantsProgram Evaluation.)
X X X
Forthcoming Winter2000
[project summary]
X Wisconsin Department of WorkforceDevelopment. Forthcoming Winter 2000.Children First. Madison, WI: TheDepartment.
X X
1999 X Meyer, Daniel R., and Maria Cancian. 1999.Initial Findings from the W-2 Child SupportDemonstration Evaluation. Madison, WI:Institute for Research on Poverty.
X X
Total 19 34 53 16 5 22 6 21 13 4

17
statewide W-2 studies is the DWD leavers survey being administered routinely to a random
sample of persons who leave the caseload each quarter. The DWD survey data are combined
with administrative data about benefit receipt and quarterly wages. A second major statewide
tracking study is part of an ongoing project by Maria Cancian and her colleagues at the
University of Wisconsin’s Institute for Research on Poverty (IRP). The latest (forthcoming) IRP
report provides important new information about two cohorts of former cash assistance
recipients—an early group who left welfare (AFDC) in the fourth quarter of 1995, when pre-W-2
reforms were beginning, and a later group who left W-2 in the fourth quarter of 1997. The third
statewide tracking project uses the Urban Institute’s National Survey of America’s Families
(NSAF), which is being administered to an expanded sample of all households in Wisconsin,
including those who receive public assistance.
In addition to these statewide projects, a number of studies are following individuals,
recipients, or families in Milwaukee or in other selected counties. These studies range from
special interviews with persons in a homeless shelter in Milwaukee to three separate studies by
the Employment and Training Institute (ETI) that track large samples of individuals to analyze
specific issues, such as occupations and earnings. A key W-2 tracking study was conducted by
the Hudson Institute and Mathematica Policy Research, Inc. (MPR). This study follows
individuals in Milwaukee County who were on AFDC at the time when the state transitioned to
W-2 (August 1997) for 12 to 18 months. Two studies not yet completed are expected to
contribute to the growing information about persons in Milwaukee—the tracking and
participation component of Manpower Demonstration Research Corporation’s (MDRC)
implementation study, and IRP’s special study of families in Milwaukee. Reports are expected
from both of these studies in early 2000. Four non–Milwaukee County tracking studies—La

18
Crosse, Dane, Brown, and Walworth Counties—provide insight and operational guidance to
county program administrators by following active and/or former recipients.
B. Caseload and Aggregate Analysis
A second issue of particular import to welfare reform nationally concerns understanding
the trends over time in the welfare caseload and other aggregate indicators of economic status
and well-being. Wisconsin has experienced one of the largest reductions in welfare caseloads in
the nation, and analysis of that trend is of interest at the national level and in other states. The
DWD and the Wisconsin MEP are in the process of conducting a caseload analysis, and five
non-MEP studies are available to help understand the caseload decline in the state. Studies by
Mead and by Wiseman analyze the recent historic trends in the caseload statewide. A study of
caseload trends in large cities by the Brookings Institution includes Milwaukee, and ETI has
examined trends in aggregate indicators of well-being at the neighborhood level in Milwaukee.
C. Implementation and Management Studies
The largest category of studies reviewed addresses a range of implementation,
management, and operational issues, statewide and in Milwaukee County and other counties.
Several reports document how W-2 was developed and details about key policies and strategies
incorporated into W-2 (separate studies by Wiseman, Mead, Kaplan, and Corbett). Two DWD-
initiated studies address specific management and administrative functions related to
management information systems. And the very large study of the implementation of W-2 in
Milwaukee that is under way by MDRC is expected to provide extensive information on local
program operations as well as longitudinal data on participation and services.

19
The rest of the completed studies in this category are relatively small-scale (in terms of
scope and resources devoted to data collection and analysis). They document, usually from a
client or community-based perspective, how W-2 services are being delivered, including the
experiences of particular types of individuals and families (e.g., families with children who have
disabilities), and individuals’ experiences in specific counties (e.g., Milwaukee, Portage, and
Marathon).
D. Program Evaluations
It is not possible to conduct a traditional experimental design evaluation of the overall
impact of W-2 on individuals for several reasons, including that the program involves a full-scale
systemic change statewide. Finding individuals who have not been affected by the change to
include in a control group would not be feasible. However, the knowledge obtained from
ongoing experimental design evaluations of different components of W-2 (e.g., child support
provisions) or of special target groups (e.g., teen parents) will be very useful in assessing policies
and refining service strategies in the future.
While there are no formal rigorous evaluations of the impact of W-2 overall, several
highly relevant evaluations are being conducted. These include evaluations of programs that
immediately preceded W-2 (e.g., Self-Sufficiency First (SSF) and Pay for Performance (PFP)),
or of particular components of W-2 (e.g., the 100 percent child support payment pass-through,
Children First demonstration), or of other related or relevant programs (e.g., Milwaukee New
Hope). Of particular interest are the four evaluations of W-2 programs and demonstrations
involving fathers and/or child support, all of which are still in progress. The evaluation of the
100 percent child support payment pass-through to the custodial parent has released an initial
report that presents preliminary information about this initiative and the target populations.

20
E. Studies of Individual Services and Needs
Like many of the implementation studies, there are also 21 studies being conducted about
particular populations and their special needs in relation to the overall objectives and
components of W-2. Most of these studies are not formally part of the MEP agenda. Nearly all
of these studies focus on local communities, and the majority have been conducted by
community organizations or academics. While several of the studies by community
organizations are very small and typically do not reflect the analytic sophistication of studies in
some of the other categories, they nonetheless provide important community-based insights and
perspectives on many issues highly relevant to the MEP agenda and the goals of W-2.
Of the 21 studies of services, benefits, and needs, most address issues of child well-being
and child care. Two ETI studies of Milwaukee County present extensive data on what are
generally considered to be the most serious barriers individuals face as they attempt to transition
from welfare to work—transportation and child care.
F. Labor Market and Employment Studies
The labor market is a central factor in W-2 and all work-based efforts to reform welfare.
Thirteen studies address labor market trends and various employment and economic self-
sufficiency issues. Employment and earnings outcomes are a major focus of many of the
tracking studies, including DWD’s leavers survey and IRP’s projects. Five studies, though,
focus on labor market issues, mainly in Milwaukee. Among the other projects in this category is
a study by Holzer that will be released in early 2000 based on a survey of Milwaukee employers,
which is expected to help better understand the perspectives of employers in terms of W-2. In
21
addition, all the studies by ETI examine various aspects of employment in Milwaukee, including
an analysis of job openings.
G. Studies on Child Support and Fathers
Fathers, especially noncustodial fathers, are an increasingly important focus of welfare
reform nationally, not just in terms of attempting to increase their financial support of children
but also in terms of enhancing their role as parents. Four significant studies are being conducted
on fathers and child support in relation to W-2. Three are still in progress: the DWD evaluation
of the Team Parenting Demonstration, which is part of the U.S. Department of Health and
Human Services’ Responsible Fatherhood initiative and the Ford Foundation’s Fragile Families
project; the DWD evaluation of the Children First project that expands child support entitlement
and employment services for noncustodial parents; and the Mathematica Policy Research/ Urban
Institute evaluation of the Department of Corrections Nontraditional Opportunities for Work
(NOW) program for noncustodial parents, which is part of the national evaluation of the
Welfare-to-Work Grants Program. The fourth is the DWD/IRP child support pass-through
demonstration noted above, which will continue to release reports over the next two years. The
findings from all of these studies will be of high interest nationally.
Information and findings about each of the 53 studies reviewed are included in Appendix
B. A synthesis of the findings across studies and areas of consensus that appear to be emerging
from this large body of accumulating research are discussed in the following section. The
synthesis addresses two questions: (1) To what extent are W-2 and the MEP achieving their
stated goals? (2) What issues require further research?
22
III. Findings and Implications
Cumulatively, the 53 studies represent a rich base of knowledge about W-2—how the
new system is operating, experiences individuals have with the system, changes over time in the
cash assistance caseload, and changes in the low-income population, including current and
former recipients of assistance. The studies vary considerably in terms of their research designs,
analytic methods, sample sizes and target groups, geographic scope, time periods studied, and
analytic sophistication. Nonetheless, by synthesizing the information and findings across the
various studies, even recognizing the important nuances that exist in each study, five general
observations can be made:
• Caseload decline. It is a well-documented fact that the cash assistance caseloadin Wisconsin has declined substantially, by over 80 percent, in the past decade.The caseload decline is among the highest of all states. Over 85 percent of theremaining cases are in Milwaukee. There is less consensus, though, about the rolethat W-2 and its antecedents per se have had in the caseload decline and thecontribution of particular aspects of Wisconsin’s reforms to the reduction in thecaseload.
• Former recipients’ employment and wages. As in other states, early evidencefrom several studies shows that most of those leaving the assistance rolls inWisconsin are working. At least 75 percent of former recipients work some ineach year after they leave the rolls, and the earnings of those who work appear toincrease in subsequent years. Earnings for those who work are $7.00 to $8.00 perhour, even three years after leaving the rolls. Less than half of former recipients,though, are continuously employed.
• Poverty. There is some evidence that the poverty rate among former cashrecipients in Wisconsin who work is declining over time and that the combinationof work plus other benefits (e.g., Earned Income Credit (EIC) and food stamps)helps reduce their poverty rate. While the trend is promising, the poverty ratecould be reduced further since more than half of all former welfare recipientsremain in poverty. There is little information about, and little consensus on,whether W-2 and related policy changes are moving families out of poverty.
• Well-being and self-sufficiency. There is currently little empirical analysis on theeffect of W-2 on the self-sufficiency of families and children, ongoing hardships,

23
or the extent of unmet need for services and assistance. However, there isdescriptive and community-based information that suggests there is some amountof ongoing need for services.
• Program implementation. Thus far, there is mainly anecdotal (but still useful)information about the implementation, management, and operations of W-2. Keyreports are expected soon from studies on W-2 in Milwaukee, but there is littlesystematic research on the management and implementation of the programstatewide or in the other 71 counties.
A. The Cash Assistance Caseload Is Declining
Many studies confirm the fact that Wisconsin’s public assistance caseload has declined
substantially. DWD statistics, MEP studies, non-MEP studies, and research nationally are all in
agreement. Wisconsin’s reduction is among the highest in the nation, and it is the sheer size of
the decline in caseload that was unexpected. The AFDC and TANF caseload declined by 42
percent nationwide between 1993 and 1998, compared with 87 percent in Wisconsin2 (Wiseman
1999a). Of course, given the features of W-2, this decline should come as no surprise. W-2 was
designed to intervene before a family receives cash, divert individuals to work rather than cash
assistance, and provide services and mandates to work even if they do end up receiving cash.
Naturally, the caseload of families receiving cash assistance should have declined.
The caseload decline in Wisconsin, though, began well before W-2 was implemented.
There is no doubt that Wisconsin’s cash caseload is considerably smaller than before W-2.
However, it is not clear how much of that decline can be attributed to the message or the
services/benefits offered through W-2, to the improved economic conditions, to precursor
2 From September 1997 to March 1998, the period of W-2 implementation, the TANF caseload in Wisconsindropped from 31,476 to 13,342 (Source: Unpublished Caseload Data, Wisconsin DWD). Part of this decline isattributable to movement of child-only cases to a separate program, Kinship Care, and to movement of disabledparents on SSI to a new program, Caretakers Supplement (Institute for Wisconsin’s Future 1998a).

24
programs (particularly, Pay for Performance [PFP]), or to other factors. According to Mead, the
decline in Wisconsin’s caseload was sharper than state officials had expected it would be, and
some of that decline probably occurred because of new policies. But since most other states
have also had dramatic caseload declines—even some states with very minimal policy and
program changes—factors other than policies and new program procedures played a role.
Wiseman suggests, in fact, that it may be impossible to isolate the contribution of
separate factors to the caseload decline, even factors that can be measured. Aside from the
obvious economic conditions—very low unemployment and a historically long period of
prosperity—that have contributed to the caseload decline nationally, and presumably in
Wisconsin, contextual factors that are difficult to measure also undoubtedly have had an effect.
For example, anecdotal evidence from other states suggests that there is an initial behavioral
effect on the caseload in anticipation of welfare reform. A heavily publicized reform such as W-
2 may have also had a strong anticipatory effect. Persons who have other sources of support or
who are employable may leave the rolls voluntarily. This may have happened in Wisconsin as
well, based on insights from a few of the studies that take a client perspective. The Hudson
Institute/MPR survey found that over 80 percent of recipients reported knowing that W-2
required work activity. The “work message” of W-2 was and is clearly understood.
Some studies also suggest that certain aspects of W-2 operations may have caused the
caseload to decrease. For example, several studies by community groups indicate there was
some amount of confusion during the early months of W-2, which may have contributed to
caseload decline. Some persons who might have otherwise applied for welfare may have chosen
not to do so, thinking that assistance was no longer available. The Hudson/MPR survey
indicates

25
that while recipients understood the “work message” of W-2, there was less consistent
knowledge about the benefit and eligibility provisions.
The role of work requirements or improved management in the caseload decline is also
not clear. The Mead study concludes that the state’s strong emphasis on work requirements and
child support enforcement has had a substantial effect on the state’s caseload. But that study did
not consider any other services or procedures that might have also been important (such as
client-focused assessment and services in combination with work requirements), and no other
analyses of Wisconsin’s caseload have incorporated program management or procedure
variables.
However, there is a consensus that the steepest declines in caseload occurred in the years
immediately preceding the implementation of W-2. Even the Mead study, which implies that W-
2’s increased emphasis on work and responsibility should result in more pronounced caseload
declines, found that the trend started well before W-2 was implemented. Mead attributes this to
the aggressive emphasis on work in pre-W-2 programs in the state, including the Job
Opportunities and Basic Skills program under AFDC in the early 1990s. Without going that far
back in history, IRP’s work suggests that the work-first orientation of PFP, SSF, and Work Not
Welfare—the first time-limited welfare demonstration in the country—which operated just
before W-2, had an effect on individual behavior. Many policies that eventually were
incorporated into W-2 were developed in PFP and SSF. IRP found, for example, that those pre-
W-2 initiatives, which had a very strong work message, diverted many from the assistance rolls
and began to institutionalize the program expectations for both recipients and service providers.
Among their PFP/SSF applicant sample, 35 percent became actual cash recipients, compared
with 45 percent of the control group of applicants not exposed to PFP/SSF.
26
It is not necessarily worth trying to precisely isolate the effect of W-2 versus other factors
on caseload decline. But it is important not to overstate the contribution of specific features of
W-2 per se—especially not the work requirement policies or the employment-related services—
until more data are available on other aspects of W-2 and on other factors.
A related issue of interest nationally concerns whether reductions in cash assistance
caseloads are accompanied by similar reductions in caseloads in related programs or whether the
cash assistance reductions are offset by increases in participation in other programs. It might be
useful to examine the combined and interactive trends in the caseloads for W-2 cash assistance,
food stamps, Kinship Care, Supplemental Benefits, child care, health care, Head Start, and the
like.
In addition, it is also very clear that the rate of caseload decline has been slower in
Milwaukee than in the rest of the state, and that a very large proportion of the remaining cash
assistance cases are located in Milwaukee. Specifically, Milwaukee County had 57 percent of
the state’s caseload in 1994, but, by 1998, Milwaukee’s share of the state caseload had increased
to 86 percent (Brookings 1999). While the state’s caseload decreased by 87 percent between
1993 and 1998, Milwaukee County’s caseload dropped by 76 percent (Wiseman 1999a).
Milwaukee’s share of the state caseload continued to increase through July 1998 but has been
gradually declining since then. Despite the fact that the Brookings Institution study found that
the caseload reduction in Milwaukee was higher than in any other big city, the statewide
reduction has made cash assistance much more of a central-city phenomenon in Wisconsin, as in
other states.

27
B. Most Former Recipients Work but at Low Wages
A consensus is beginning to emerge from numerous studies nationwide that most former
welfare recipients do work at some point in the months after they leave the rolls, even though the
causes of this trend are still being debated. The estimates generally suggest that between half
and two-thirds of former recipients work in the first year after welfare, with estimates varying
depending on the sample, follow-up period, state, and source of information about employment.
The general finding of increased employment is confirmed in Wisconsin, with the rate of
employment, according to the U.S. Department of Health and Human Services, even higher than
the national average.
Recognizing again that one cannot attribute the trends in employment outcomes to W-2
since there are no empirical evaluations of individual impacts, there is no doubt that the labor
force activity of former recipients in Wisconsin is very high. Perhaps the best estimates of
employment are from IRP’s tracking studies. These studies indicate that 60 to 66 percent of
former recipients who left the rolls in the fourth quarter of 1995 and those who left in the fourth
quarter of 1997 were employed continuously (meaning they had some employment in each
quarter) in the year after they left the rolls. Over 80 percent had some employment in at least
one quarter. These findings are consistent with the results from DWD’s survey of persons who
left W-2 between January and March 1998. Even among those former recipients who were in a
homeless shelter in late 1998, about half were in the labor force—either working or looking for
work.
IRP further reports that employment among former recipients is maintained over time.
The recent IRP study found that 81 percent of welfare leavers in the fourth quarter of 1995 had
some earnings in the following year and that the rate declined only slightly in the subsequent two

28
years; 79 percent had earnings sometime in the second year after leaving the rolls and 77 percent
had earnings sometime in the third year. Fewer former welfare recipients were employed
continuously over all three years. While 88 percent of former recipients had some earnings over
the course of the three years after exit, only 42 percent were employed continuously over the
course of all three years (meaning they had some employment in each quarter), according to the
IRP study.
While employment rates are quite high, there are conflicting indications as to whether
W-2 raised work levels. On the one hand, the new system’s strong emphasis on diversion from
welfare (which began in 1994 with SSF and then PFP) might mean that some people were
diverted from going onto welfare. Presumably some of those who were diverted went to work
instead. But others who did not enter the welfare system may not have increased their work
effort either. Mead suggests that employment rates for some of those diverted might have
increased if they had been enrolled into one of the strong work-oriented programs. The Urban
Institute NSAF shows higher employment rates among low-income single parents in Wisconsin
than in the nation as a whole, suggesting perhaps that something other than the strong
economy—perhaps the policy messages about work—may be causing the increased labor force
activity. Thus, while there is strong evidence that employment is high in Wisconsin, even among
low-income parents, it is still not clear what role W-2 has had in these trends.
In addition to finding high rates of employment over time, IRP also finds that wages of
former recipients (those who left in the last quarter of 1995) who did work increased each year
over the three years after leaving welfare. Mean earnings (in 1998 dollars) of those who worked
sometime in the first year after leaving cash assistance was about $9,100, and it increased to
$10,300 in the second year and $11,500 in the third year.

29
Despite the high rate of employment and the positive upward trend in earnings, the
research also raises a few areas of concern regarding earnings potential. First, many former
recipients in Wisconsin are working for fairly low wages, with most studies estimating average
hourly wages in the range of $7.00 to $8.00. This is slightly higher than the national average of
$6.50 to $7.00 an hour (Loprest 1999). The low hourly earnings, not surprisingly, translate into
similarly low annual earnings. IRP estimated average annual earnings of former recipients
during the first year after leaving welfare at $7,700 to $9,100 (in 1998 dollars) for those who left
during the fourth quarter of 1997 and 1995, respectively.
Second, annual earnings are low despite the fact that many former recipients are working
full-time or close to full-time. DWD found that 57 percent of welfare leavers who work are
employed 40 hours or more per week while only 19 percent work less than 29 hours per week.
The Hudson Institute/MPR survey also found that over half of former recipients who are
employed work 40 hours or more a week. On average, former recipients who are working work
between 34 and 36 hours a week (e.g., DWD Leavers’ survey, IRP study in Dane County,
Walworth County).
Third, former recipients are concentrated in jobs in low-skilled and low-wage sectors.
ETI indicates that nearly one-third of former recipients in Milwaukee work in temporary
agencies. And, according to the DWD leavers survey, about half of all former recipients were
employed in the services or retail trade sectors, which pay relatively low wages. Even if persons
were to work full-time year-round in these low-wage sectors, the wages do not translate into high
annual earnings.
Finally, the recent IRP study of two cohorts of former recipients suggests that over time
the persons remaining on W-2 may have less positive employment outcomes than those who left

30
welfare in the earlier phase, presumably because they are less skilled or have more barriers to
employment. The IRP findings suggest that both the early and later cohorts have relatively high
rates of employment, but the rates for the later cohort are somewhat lower. Sixty-six percent of
people who left welfare in the last quarter of 1995 were employed for some time in each of the
next four quarters. In comparison, only 60 percent of those who left in the last quarter of 1997
were employed in each of the subsequent four quarters. That study also reports that the later
cohort is even more likely than the 1995 “leavers” to work in low-wage sectors of the labor
market (restaurants, hotels, and retail). The question of whether the remaining welfare caseload
is relatively more disadvantaged than those who have already left the rolls is one on which
national policy makers and researchers have begun to focus. The findings from the IRP study
and W-2’s program response to serving this harder-to-employ population will be of high interest.
C. Poverty Rates Are Falling but Remain High
One objective of W-2 as stated in the MEP documents is to increase economic self-
sufficiency and well-being among Wisconsin families. To the extent that poverty is one measure
of well-being, reducing the poverty rate in Wisconsin is, indirectly, an objective of W-2. While
the body of evidence is still somewhat less developed for this issue than for employment or
wages, there is some evidence that W-2 and related policies are associated with an increase in
household income. Despite these increases in income, though, many families still remain in
poverty. In attempting to analyze the anti-poverty effect of W-2, several of the W-2 studies also
offer very useful guidelines and cautions about measuring changes in income and poverty.
The recent IRP study and the earlier Hudson/MPR study both attempted to measure
income and not just earnings. This involves estimating earnings for all members of the family or
31
household and considering unearned income (e.g., child support, EIC, food stamps) as well as
earnings from employment. Both studies also indicate the importance of supplementing earnings
with government benefits to raise incomes above poverty.
The Hudson/MPR study used a composite measure of household income that includes
earnings of all household members, cash assistance, SSI, unemployment insurance, emergency
assistance, social security, food stamps, and formal and informal child support payments (but not
EIC). Hudson/MPR reports that 71 percent of those on AFDC in Milwaukee in August 1997
reported incomes below the poverty line; 43 percent of the Hudson/MPR sample was still on
assistance at that time. Hudson/MPR estimated the average annual household income for all
former AFDC recipients (some converted to W-2 and some did not) in Milwaukee at about
$14,000 per year (in the year after August 1997). Of this amount, just over half—$7,200—is
earnings from work by household members.
The IRP study, which analyzed recipients statewide, provides estimates using three
different measures of income: 1) income from earnings alone; 2) after-tax earnings; and 3) after-
tax earnings, cash assistance, and the value of food stamps benefits. Using the broadest
computation, they estimated average annual income for persons in the year after they left cash
assistance was about $12,700 per year for the 1997 cohort and $12,500 per year for the 1995
cohort. The IRP study may underestimate household income since analysts acknowledge that
they do not include income from a spouse or partner. This study also found that mean earnings
for those former recipients who were working increased each year for the 1995 cohort over the
subsequent three years analyzed (Cancian, Haverman, et al. 1999). This three-year upward trend
is quite promising.

32
The IRP study indicates that, when food stamps and other government benefits
supplement earnings, about one-third of former welfare recipients in the 1995 cohort are better
off financially than just before leaving welfare and are above the poverty line. The 1997 cohort
also shows one-third are better off than just before leaving welfare; however, only one-quarter
are above poverty. For both cohorts, only a small percentage—4 to 6 percent—of former
recipients have incomes greater than 150 percent of the poverty line.
Even under their broadest definitions of income, the poverty rates are still relatively high.
For example, IRP estimates that, on average, 60 percent of former cash recipients in the state still
had incomes at poverty or below three years after leaving welfare—showing very little change
over the three years. The Hudson/MPR study similarly estimated that household incomes of
former Milwaukee recipients working at regular unsubsidized jobs and receiving government
benefits averaged about $18,000 per year (in the year after August 1997), and that 29 percent
were above the poverty threshold for their family size. However, that study also found that for
those former recipients who had household incomes above the poverty level, their average
incomes were relatively low—just 146 percent of the poverty threshold.
These research studies suggest that many former recipients in Wisconsin are still poor—
perhaps more than half of those who have left the caseload. In comparison, in Wisconsin’s entire
population (without regard to welfare status) about 9 percent of nonelderly adults and children
are in poverty, compared with 15 percent nationally (Wiseman 1999a). In comparing former
recipients’ income before and after leaving welfare, however, IRP finds that over 35 percent
have higher incomes during the first year after leaving welfare. The trend appears to be going in
the desired direction. IRP’s three-year follow-up of former W-2 recipients shows a very
promising pattern and suggests that the combined effects of earnings from work, EIC, and other

33
assistance benefits are important. However, those researchers also raise a cautionary concern
that the early trends observed for the first cohort that left welfare in 1995 may not hold up for
later cohorts.
D. There Is Still Some Unmet Need
It seems safe to assume that at least some part of the high employment rates and low
benefit receipt are due to W-2, although the empirical analysis will have to continue to
conclusively make such a claim. Researchers undoubtedly will (and should) continue to refine
the estimates of employment, earnings, and income of former recipients in Wisconsin, and to
examine whether or not W-2 can be credited with the high rates of employment.
While employment is of the highest priority, W-2 and MEP statements clearly indicate
that W-2 is also concerned with the well-being and long-term economic self-sufficiency of
Wisconsin’s families. In addition to supporting empirical studies about employment and to tease
out causality, it is therefore also important to continue to encourage studies about family and
child well-being and qualitative studies of individual experiences with W-2 and related
programs. Findings from a number of studies reviewed suggest that a portion of the target
population is facing various hardships, whether they are working or not, and that to some extent
certain needs continue to exist.
This does not mean that W-2 is failing, as suggested by some of the more advocacy-
oriented studies. On the contrary, some surveys by advocacy groups seeking to restore welfare
benefits report that many individuals feel that W-2 has helped them get a job or improve their
work skills. However, the convergence of evidence about unmet need and hardship is consistent
enough that it should not be ignored. Several studies—MEP-linked and non-MEP, large scale

34
and small, academic and advocacy reports—indicate that there is an ongoing need for assistance
among those still in W-2 and, more importantly, for those no longer receiving cash aid.
Health care problems. The studies suggest a number of what the La Crosse County
W-2 Research Consortium categorizes as “quality-of-life problems.” In surveys conducted in La
Crosse, Brown, Manitowoc, Portage, and Walworth Counties, health care was identified as the
greatest problem. Depending on the study, the sample, and the time period of the surveys,
between 40 and 70 percent of current and former recipients and 20 to 30 percent of their children
had no insurance or medical assistance. Thirty percent or more report that they and their
children do not always see a doctor or dentist when necessary. While health insurance coverage
is a serious problem, it is likely that coverage is increasing in Wisconsin, since the recent
implementation of BadgerCare.3
Still, though, many of the W-2 studies report ongoing health problems, ranging from
depression and mental illnesses to physical illnesses that limit work. Catholic Charities found
that over half of the low-income mothers they interviewed were depressed and that 30 percent
were not getting health care for their children. DWD found that 27 percent of former welfare
recipients who were not working had physical or mental illness.
The health care problems thus clearly go beyond just having medical assistance or
insurance available, although that is obviously important. Although there is little information
about whether and how health problems, including difficulty accessing health care services,
affect work, they do constitute a level of family hardship.
Child care problems. As in other states, there continue to be reports of inadequate child
care, with problems generally related to costs, continuity, and flexibility. The DWD leavers
3 BadgerCare is a Medicaid buy-in program for low-income families in Wisconsin.

35
survey found that of those not working, 20 percent reported that it was because of child care
problems. Although other studies nationally have found that such self-reported reasons for not
working are often unreliable, such responses may indicate a problem with child care. ETI
identified costs of child care and consistency of child care as ongoing problems for low-income
working parents in Milwaukee. The Mathematica Policy Research focus groups in the Infant
Care Study reported that parents were concerned about a number of issues that limited their child
care options, including finding quality care for the hours they needed, in proximity to work and
home and with providers who can care for multiple siblings. Catholic Charities also found that
over half the parents they surveyed who were using relatives to care for their children “worried a
lot” about their children.
General economic insecurity. While most persons leaving W-2 are employed, several
studies report fairly high levels of economic anxiety and worry, some related to difficulties
individuals have in finding a job and some related to low earnings and income. The DWD
survey, for example, found that 48 percent of former recipients said they were better off than
they had been on welfare. Seventy percent of former recipients in the Hudson Institute/MPR
survey said their standard of living was the same or better than when they were on welfare.
However, in the DWD survey of leavers, 68 percent reported that they were “just barely making
it.” Although a general response such as this probably is not an accurate gauge of well-being,
other studies also suggest the presence of economic difficulties. Several studies found that
many—perhaps 25 percent or more—former recipients report that they do not have enough food,
or have other economic hardships such as difficulty paying rent or mortgage or finding adequate
housing. This rate of food insecurity is similar to national estimates reported by Loprest (1999).

36
Many studies nationwide also confirm that transportation is a major barrier to
employment, and Wisconsin is no exception. The ETI study which matched welfare records
with Department of Transportation records reports that fewer than one-quarter of former welfare
recipients in Milwaukee County have valid drivers’ licenses, and another 22 percent have
suspended licenses. ETI suggests that the majority of suspensions are in fact a result of failure to
pay fines for civil and minor violations, not a result of traffic, drug, or driving-while-intoxicated
violations. The license problem may be very serious. ETI finds that twice as many men between
the ages of 18 and 55 in Milwaukee County have suspended drivers’ licenses as have current
licenses. The majority of the suspensions result ultimately from initially failing to pay fines for
minor violations. These data suggest that financial problems may cause minor violations to
escalate into suspensions that are more difficult to rectify, although many individuals may simply
be unaware of the importance of complying with minor tickets and citations. In either case, the
lack of valid licenses is a hardship that can impede transportation to gainful employment.
One way to address economic insecurity is by making available other nonwelfare
benefits. W-2’s emphasis on the EIC, child support enforcement, and the SSI Caretaker
Supplement are examples of other benefits that are intended to contribute to economic security.
Many studies report that there is fairly high use of other benefits and services once individuals
leave W-2, although some studies do identify concerns. Most studies found that over three-
quarters of former W-2 recipients continue to receive food stamps. But the University of
Wisconsin-Milwaukee study of Head Start families found an underutilization of W-2 cash, food
stamps, and child care and attributes this to confusion and misinformation on the part of both
parents and staff during the early phase of W-2. Despite the recent increased emphasis on child
support enforcement, many studies also report that only a small portion of current and former

37
W-2 recipients receive child support payments. Catholic Charities found between 75 and 90
percent of the mothers they interviewed were not getting their full child support, and the DWD
child support pass-through demonstration found that just 25 percent of recipients received child
support payments. The Hudson Institute/MPR survey found that only 5 percent of average
family income of former recipients came from formal and informal child support payments.
E. Future Directions
The findings from the various studies about Wisconsin and W-2 suggest several areas on
which the MEP might wish to consider focusing in the future. A number of the studies are
limited in terms of either methodology, sample size, or analysis, and several of the more
sophisticated projects have thus far released only preliminary data. It is, therefore, very difficult
to draw many conclusions from the current research on W-2. Nonetheless, in a number of areas,
there is enough consensus in the general findings, or evidence of gaps in knowledge, to provide a
few suggestions to the MEP as it proceeds with its research agenda.
Continue to encourage a range of research. First, the MEP would do well to continue
to encourage a broad range of studies by a variety of analysts. While it might be tempting to
decide to collaborate only with studies that meet the high empirical standards of academic
research, that would not be wise. Granted that several of the studies conducted thus far on W-2
are limited in scope or obviously guided by advocacy interests, all of the reports reviewed have a
contribution to make to the evolving development of policy in Wisconsin. On some topics,
several different types of studies come to similar conclusions. For example, while former
recipients are moving into the labor force at very high rates, the wages they earn are relatively
low, and many are still in poverty and need additional economic supplements and/or social

38
services. The more empirical academic studies should continue to refine the precision of their
measurements and analysis. But others should also continue to monitor the experiences of
individuals and families, since that perspective might otherwise not be available to policy
makers.
Focus more policy and research attention on supports for the working poor.
Second, Wisconsin’s reputation for accomplishing much in terms of its welfare reform goals is
well deserved. The research suggests that the challenge now is perhaps more related to
increasing incomes for those who are working than to reducing welfare recipiency—which has
basically been achieved for many. Many positive developments have come about during the
W-2 era. A high proportion of former recipients are working, and many report that W-2 helped
them find jobs and training. Income from earnings, supplemented with EIC, food stamps, and
child support, means that many former recipients are above poverty.
However, under their optimistic assumptions, studies by IRP and the Hudson
Institute/MPR suggest that perhaps half of former recipients in Wisconsin have incomes below
poverty, even if earnings are supplemented with EIC, food stamps, and other benefits. Recent
aggressive efforts to provide health assistance through BadgerCare, efforts to strengthen the
enforcement of child support, and programs to improve the earnings potential of noncustodial
fathers are expected to further improve the well-being of families with children. However, many
custodial and noncustodial parents alike tend to work in low-wage occupations because their
skills are limited. More research is needed to identify the paths to success that some former W-2
participants have achieved, and more consideration could focus on how W-2 incorporates
training, education, and work-based skills into the W-2 program. The next policy step related to

39
the working poor is to ensure that services that improve job retention continue to be provided,
such as child care, health insurance, and transportation.
In addition to assuring that eligible families receive benefits for which they qualify,
another way to address economic insecurity is to attempt to increase the wage-earning potential
of working parents. On average, former cash assistance recipients in Wisconsin (and elsewhere)
are apparently able to work only at fairly low wages in occupations that typically offer little
prospect for upward mobility. The current W-2 research provides little guidance about how
individuals are moving up in the labor market, although presumably some are doing so. More
information on those who have managed to improve their employment situations (e.g., career
ladders, skills training, higher education) would be very useful to program administrators and
staff in Wisconsin and elsewhere.
Wisconsin has led the nation in many aspects of welfare reform. It now can also take the
lead in addressing the needs of working poor families in the post-welfare policy world, in
Milwaukee as well as in the state as a whole.
Focus more research on former welfare recipients who are not working. Third, state
policy makers should continue to focus on understanding and meeting the challenges of the poor
in Wisconsin who have left the cash caseload but are not currently working. If over 80 percent
of former recipients work in at in at least one quarter, as IRP reported, then nearly 20 percent do
not have earnings from work after leaving W-2. It is important to determine how these people
are supporting themselves and what services should be provided to help them obtain and retain
employment. Very little is known about how those who are not working are managing to
support themselves. Research that attempts to measure income from all sources, including
informal and spousal earnings, would be useful.
40
Since much research confirms that both the remaining cash assistance caseload and the
majority of poor families are located in the city, it is plausible to continue to focus research
efforts in Milwaukee. However, more research is also needed on the status of former recipients
unable to find work in other localities, especially rural areas. There is currently little research
about what services in particular best help former recipients obtain and retain employment and
whether these services differ for urban versus rural families.
Consider the changing characteristics of the caseload. Fourth, while the caseload has
declined, those left on cash assistance are, according to the latest IRP study, probably less
employable than those who left earlier. This, again, is true not only in Wisconsin but also
nationwide. There is little information from the existing research, though, about those who are
still left in W-2, except that they are primarily concentrated in Milwaukee. As local W-2
agencies, in Milwaukee and other counties, are increasingly devoting their primary attention to
hard-to-serve populations, their experiences would be very useful to other states. More research
is needed to understand the characteristics of the caseload statewide, for example by conducting
further analysis using DWD’s management and client databases. Research examining promising
operational approaches that local agencies are now using to assist families with multiple
problems and barriers to employment would also be valuable.
It would also be useful to conduct more analysis on the characteristics of families
receiving other related services and benefits, such as food stamps, BadgerCare, and Kinship
Care. Over time, as state policy questions shift from the very small W-2 caseload to the larger
poverty population, it will be important to have more information on the broader population and
its needs.

41
Sponsor targeted demonstrations and evaluations. Fifth, while it may not be possible
to mount a major experimental design evaluation of the impact of W-2 on individuals, there are
many issues on which targeted demonstrations with experimental design evaluations would
prove valuable and could be conducted within the current policy parameters. The W-2 program
includes several innovative and unique features on which there is currently little research. A
high proportion of the current cash caseload, for example, is assigned to community service jobs
(CSJs). A carefully designed demonstration could contribute to the existing knowledge about
how CSJs can be integrated with cash assistance and the impact various types of CSJ models
have on individuals’ subsequent earnings and economic self-sufficiency. Planned variation
demonstrations might also be designed to focus on the impacts of different strategies. For
instance, W-2 recipients in the transition category could be randomly assigned to different CSJ
model programs. One model might pay a monthly grant (the current system) and the other could
pay an hourly wage. Other variations that could be tested include varying the number of hours
required or the kind of employer sponsoring the CSJs. Similarly, planned variation
demonstrations could be designed to further explore services to particular target groups on which
there is currently little information—such as persons with very limited education or limited
English proficiency. W-2 represents a bold new attempt to address the problems of poverty, and
there are many aspects of it that warrant rigorous demonstration research.
Encourage studies of implementation and management. Finally, the state should
encourage comprehensive studies of the implementation of W-2. While many of the 53 studies
reviewed address aspects of program operations and management, none of the reports focus on
the overall implementation of W-2. The approaches being taken to restructure the organizational
delivery of services, for example, are of interest to policy makers in many other jurisdictions
42
who are considering various types of managed competition. Similarly, the manners in which W-
2 benefits and services are coordinated with other benefits and supports, especially noncash
transfers, EIC, BadgerCare, child care, Kinship Care, and the SSI Caretaker Supplement, are
important to document and assess, since it is likely that in combination they may help alleviate
poverty. And there is much interest in other states about how the integration of public assistance
and workforce development was accomplished in Wisconsin and the benefits and challenges of
that restructuring. Well-designed implementation studies that integrate statistical program data
with program observations, administrative/staff interviews, and participant surveys can be useful
complements to ongoing longitudinal tracking analyses and DWD’s leavers surveys.
W-2 and related policy changes reflect the high priority Wisconsin officials continue to
place on welfare reform and on family and child well-being. In addition, the strategies being
adopted and the experiences Wisconsin has in implementing its reforms are of very high interest
to the national policy community. By continuing to support research and encourage open and
unfiltered dialogue on findings from various studies, state officials and the MEP can contribute
much to other states as they move forward in reforming welfare while they continue to refine
policies and improve programs within Wisconsin.

43
References
Loprest, Pamela. 1999. Families Who Left Welfare: Who Are They and How Are They Doing?Assessing the New Federalism Discussion Paper 99-02. Washington, DC: The Urban Institute.
Wisconsin Department of Workforce Development. 1999a. Wisconsin Works: Philosophy andGoals. http://www.dwd.state.wi.us/desw2/philosop.htm.
Wisconsin Department of Workforce Development. 1999c. Wisconsin Works Overview.http://www.dwd.state.wi.us/desw2/wisworks.htm.
Wisconsin Department of Workforce Development. 1998. Wisconsin Works: W-2 Overview.http://www.dwd.state.wi.us/desw2/wisworks.htm.
Wiseman, Michael. 2000. Making Research Work: The Other Wisconsin Welfare Innovation.Washington, DC: The Urban Institute.

Appendix A: W-2 Reports and Documents
44
Bos, Johannes M., Aletha C. Huston, Robert C. Granger, Greg J. Duncan, Thomas W. Brock, andVonnie C. McLoyd. 1999. New Hope for People with Low Incomes: Two-Year Results of aProgram to Reduce Poverty and Reform Welfare. New York, NY: Manpower DemonstrationResearch Corporation.
Brookings Institution. 1999. The State of Welfare Caseloads in America's Cities: 1999.Washington, DC: The Brookings Institution/Center on Urban & Metropolitan Policy.
Cancian, Maria, Robert Haverman, Daniel R. Meyer, and Barbara Wolfe. 1999. Before and AfterTANF: The Economic Well-Being of Women Leaving Welfare. Madison, WI: The Institute forResearch on Poverty.
Cancian, Maria, Thomas Kaplan, and Ingrid Rothe. 1999. Wisconsin's Self-Sufficiency First/Payfor Performance Program: Results and Lessons from a Social Experiment. Madison, WI: TheInstitute for Research on Poverty.
Cancian, Maria, Robert Haverman, Thomas Kaplan, and Barbara Wolfe. 1998. Post-ExitEarnings and Benefit Receipt Among Those Who Left AFDC in Wisconsin. Madison, WI: TheInstitute for Research on Poverty.
Catholic Charities of the Archdiocese of Milwaukee, Inc., and Wisconsin Catholic Conference.1998. Raising Children in a World of Work Not Welfare. Milwaukee, WI: Catholic Charities.
Center for Self-Sufficiency. 1999. Homeless Families in Milwaukee After Welfare Reform: ALongitudinal Look at the Causes and Effects of Homelessness. Milwaukee, WI: The Center.
Corbett, Thomas J. 1995. Welfare Reform in Wisconsin: The Rhetoric and the Reality. IRPReprint Series. Madison, WI: Institute for Research on Poverty.
Courtney, Mark, Stephanie Fassnacht, and Ingrid Rothe. 1999. Wisconsin Administrative LinkBetween CARES and HSRS. Madison, WI: The Institute for Research on Poverty.
Ebert, Rose, Ann Krueger, Vicki Perron, Ena Raggio, and Nyialong Yang. 1998. W-2 Follow UpSurvey. Manitowoc, WI: Forward Service Corporation, Manitowoc Job Center.
Employment and Training Institute. 1999. State of Milwaukee's Children: Family Income andEconomic Support. Milwaukee, WI: The Institute.
Employment and Training Institute. 1998. Employment and Economic Well-Being of Families inCentral City Milwaukee Neighborhoods. Milwaukee, WI: The Institute.
Hoffman, Caroline, and Amy Fisher. 1998. Families in Poverty: Parents with Disabilities andTheir Children. Madison, WI: Wisconsin Council on Developmental Disabilities.
Appendix A: W-2 Reports and Documents
45
Holzer, Harry J. Forthcoming Spring 2000. Milwaukee Employer Survey: Will Employers HireWelfare Recipients?
Hunger Task Force of Milwaukee and Hunger Action Team. 1998. Initial Findings on the Impactof Wisconsin Works on Food Security and Employment. Milwaukee, WI: The Task Force.
Institute for Research on Poverty. Forthcoming March 2000. What Happens to Families UnderWisconsin Works in Milwaukee? Madison, WI: The Institute.
Institute for Research on Poverty. Forthcoming Fall 1999. Experience of Dane County W-2Participants 1997-1998. Madison, WI: The Institute.
Institute for Wisconsin's Future. 1998a. Transitions to W-2: The First Six Months of WelfareReplacement. Milwaukee, WI: The Institute.
Institute for Wisconsin's Future. 1998b. The W-2 Job Path: An Assessment of the EmploymentTrajectory of W-2 Participants in Milwaukee. Milwaukee, WI: The Institute.
Itzkowitz & Associates. 1999. Portage County Health and Human Services Family Survey.Stevens Point, WI: Itzkowitz & Associates.
Kaplan, Thomas, and Ingrid Rothe. 1999. New Hope and W-2: Common Challenges, DifferentResponses. Madison: WI: The Institute for Research on Poverty.
Kaplan, Thomas. 1998. Wisconsin's W-2 Program: Welfare as We Might Come to Know It. IRPDiscussion Paper 1173-98. Madison, WI: The Institute for Research on Poverty.
Kleppner, Paul, and Nikolas Theodore. 1997. Work After Welfare: Is Wisconsin's BoomingEconomy Creating Enough Jobs? Published by The Midwest Job Gap Project.
Koehn, Susan, and Jane Ahlstrom. 1997. Kenosha County W-2 Child Care Implementation andDesign Evaluation. Kenosha, WI: Kenosha County Evaluation Planning Group.
La Crosse County W-2 Research Consortium. Forthcoming Summer 2000. La Crosse County W-2 Research Summary. La Crosse, WI: The Research Consortium.
Magill, Robert S. 1998. Food Programs and Welfare Reform in Milwaukee. Milwaukee, WI:School of Social Welfare.
Manpower Demonstration Research Corporation. Forthcoming January 2000. Study of W-2Implementation in Milwaukee. New York, NY: MDRC.
Manpower Demonstration Research Corporation. Wisconsin Employment Retention/CareerAdvancement. (Project on hold indefinitely.)
Appendix A: W-2 Reports and Documents
46
Mathematica Policy Research. Forthcoming Winter 1999. A Study of Infant Care Under WelfareReform. Washington, DC: MPR.
Mathematica Policy Research. Forthcoming. Nontraditional Opportunities for Work (NOW).Princeton, NJ: MPR.
Mead, Lawrence M. 1999a. Statecraft: The Politics of Welfare Reform in Wisconsin. Madison,WI: Institute for Research on Poverty.
Mead, Lawrence M. 1999b. “The Decline of Welfare in Wisconsin.” Journal of PublicAdministration Research and Theory, 9 (4): 597–622.
Meyer, Daniel R. and Maria Cancian. 1999. Initial Findings from the W-2 Child SupportDemonstration Evaluation. Madison, WI: Institute for Research on Poverty.
Michaliski Turner, Diane. 1998. Stated and Unstated Needs: Low-Income Parents and ChildCare. Madison, WI: University of Wisconsin-Madison, Women's Studies Research Center.
Milwaukee Women and Poverty Public Education Initiative. 1998. W-2 Community ImpactStudy. Milwaukee, WI: The Initiative.
Moore, Thomas S., and Vicky Selkowe. 1999. The Growing Crisis Among Wisconsin's PoorestFamilies: A Comparison of Welfare Caseload Declines and Trends in the State's PovertyPopulation, 1986-1997. Milwaukee, WI: The Institute for Wisconsin's Future.
Pawasarat, John, and Lois M. Quinn. 1999. Survey of Job Openings in the MilwaukeeMetropolitan Area: Week of May 17, 1999. Milwaukee, WI: The Employment and TrainingInstitute.
Pawasarat, John, and Lois M. Quinn. 1998. Removing Barriers to Employment: The Child Care-Jobs Equation. Milwaukee, WI: The Employment and Training Institute.
Pawasarat, John, and Frank Stetzer. 1998. Removing Transportation Barriers to Employment:Assessing Driver's License and Vehicle Ownership Patterns of Low-Income Populations.Milwaukee, WI: The Employment and Training Institute.
Pawasarat, John. 1997a. The Employer Perspective: Jobs Held by the Milwaukee County AFDCSingle-Parent Population (January 1996-March 1997). Milwaukee, WI: The Employment andTraining Institute.
Pawasarat, John. 1997b. Employment and Earnings of Milwaukee County Single-Parent AFDCFamilies: Establishing Benchmarks for Measuring Employment Outcomes Under W-2.Milwaukee, WI: The Employment and Training Institute.

Appendix A: W-2 Reports and Documents
47
Putz, Marilyn. 1999. Walworth County W-2 Program: W-2 Follow-up Study. Elkhorn, WI:Walworth County Job Center.
St. Norbert College Survey Center. 1999. W-2 Welfare Reform Survey. De Pere, WI: TheSurvey Center.
Swartz, Rebecca, Jacqueline Kauff, Lucia Nixon, Tom Fraker, Jay Hein, and Susan Mitchell.1999. Converting to Wisconsin Works: Where Did Families Go When AFDC Ended inMilwaukee? Madison, WI: The Hudson Institute, and Washington, DC: Mathematica PolicyResearch.
University of Wisconsin Milwaukee Center for Economic Development. 1999. Support ServiceUtilization Among Head Start Parents in Wisconsin. Milwaukee, WI: The Center.
Wisconsin Department of Workforce Development. Forthcoming. Wisconsin Policy andAdministrative Database (WisPAD). Madison, WI: The Department.
Wisconsin Department of Workforce Development. Forthcoming 2000. Team ParentingDemonstration Project. Madison, WI: The Department.
Wisconsin Department of Workforce Development. Forthcoming Winter 2000. Children First.Madison, WI: The Department.
Wisconsin Department of Workforce Development. 1999b. Wisconsin Works: Survey of ThoseLeaving AFDC or W-2 January to March 1998 Preliminary Report. Madison, WI: TheDepartment.
Wiseman, Michael. 1999a. In Midst of Reform. Assessing the New Federalism Discussion Paper99-03. Washington, DC: The Urban Institute.
Wiseman, Michael. 1999b. A Management Information Model for New-Style Public Assistance.Assessing the New Federalism Discussion Paper 99-10. Washington, DC: The Urban Institute.
Wiseman, Michael. 1996. State Strategies for Welfare Reform: The Wisconsin Story. IRPReprint Series. Madison, WI: Institute for Research on Poverty.
Wulff, Damian. 1998. W-2 Implementation Impact in Marathon County Wisconsin: Welfare RollReductions: Where Did All the Families Go? Senior thesis submitted to Thomas J. Kaplan,LaFollete Institute of Public Affairs.

Appendix B: Summary of Research Studies
48
MEP Non-MEP
Title of Study Purpose Outcomes/Issues Analyzed Findings
Tracking and Follow-Up Studies
X La Crosse County W-2Research Consortium.Forthcoming Summer 2000.La Crosse County W-2Research Summary. LaCrosse, WI: The ResearchConsortium.
A longitudinal study exploring howindividuals and families in La CrosseCounty are faring since the onset ofW-2.Sample: 63 people taken from the LaCrosse County Human ServicesDepartment; may include formerAFDC recipients, current W-2participants, or persons who appliedfor W-2 but did not qualify, weresanctioned out, or chose not toparticipate.2 Surveys:Time 1: Spring-Fall 1998 andTime 2: Spring-Fall 1999
employment, attitudes towardwork, employment skills, jobtraining goals & activities,economic well-being,transportation, child carearrangements, health care andinsurance, parenting, child well-being
Results from Time 1 survey: (results from Time 2 available in Summer 2000)1) 24% receiving W-2 cash benefits; 93.7% are prior recipients of public assistance;63.5% are prior JOBS participants;2) 3/4 white, 1/4 Asian; 1/3 never married; 48% are high school graduates; 17% havesome college; 71% renters;3) 19% have no phone; 29% not seeing a doctor when needed; 29% child not covered byinsurance; 38% not covered themselves;4) 40% report that sometimes or often there is not enough food in the house;5) Services received: 92% on medical assistance; 61% school lunches; 56% foodstamps; 40% subsidized housing; 38% energy assistance; 37% child support; 30% childcare assistance; 30% WIC; 24% SSI; 16% receive money from family or friends.
X Institute for Research onPoverty. Forthcoming inMarch 2000. WhatHappens to Families UnderWisconsin Works inMilwaukee? Madison, WI:The Institute.
To evaluate the experience of newapplicants to W-2 in MilwaukeeCounty. Fall 1998-Spring 2000.
Sample: household heads from 800W-2 families in four Milwaukee W-2service areas; includes 600 familiesnewly entering W-2 and 200 familieswho have been continuously receivingcash assistance for more than one year.
2 Surveys: Fall '98 and Fall '99
employment, welfare,employment aspirations,education, job training, child carearrangements, and living situation
No findings yet.Provides cohort/panel analysis.

Appendix B: Summary of Research Studies
49
MEP Non-MEP
Title of Study Purpose Outcomes/Issues Analyzed Findings
X Cancian, Maria, et al.1999b. Before and AfterTANF: The EconomicWell-Being of WomenLeaving Welfare. Madison,WI: The Institute forResearch on Poverty.
To compare two cohorts in the yearafter they left welfare (1996 & 1998)and longer-term outcomes for theearlier cohort over the 3 years afterthey first left welfare (from 1996 to1998).Sample: women who left welfare in4th quarter of 1995 and 4th quarter of1997.Review of data: for the year after theyleft welfare (1996 and 1998) andlonger-term outcomes for the earliercohort (from 1996 through 1998).
employment, earnings andincome, benefit receipt
1) high school graduates more likely to leave public assistance (PA) in both cohorts, buteffect is significantly larger in the second period;2) more likely to leave PA in period 1 if: fewer children, older children, more adults inhousehold, more prior work experience, Hispanic or white, lived outside Milwaukee,fewer months of receipt, lived in an area with fewer female-headed households;3) Women on TANF with more children less likely to leave BUT women facing W-2with more children are MORE likely to leave—due to lower cash assistance later;4) 70% in both cohorts have some earnings in each quarter; 81-84% ever have earningsin first year; Annual earnings = $7,700 1st cohort vs. $9,100 for 2nd cohort;5) 37% of 1997 leavers are above poverty including income from all sources, but mostare near poor.
X Institute for Research onPoverty. Forthcoming Fall1999. Experience of DaneCounty W-2 Participants1997-1998. Madison, WI:The Institute.
A longitudinal study on the impact ofwelfare reform on Wisconsin familiesin Dane County—to provide in-depthdata on work and family experiencesconsequent to W-2 participation.Sample: 231 respondents including168 families who were transferred intoDane County's W-2 program from Payfor Performance (PFP) and 68 familieswho, prior to their application to W-2,were not receiving public assistancethrough PFP.2 Surveys: Wave 1: Nov 1997-June1998; Wave 2: Feb 1999-June 1999
employment, welfare,employment aspirations,education, job training, child carearrangements, and living situation
From Wave 1:1) 50% never married, 50% black, 35% no high school diploma/GED, 12% havevocational/technical training2) New W-2 receivers more likely to be employed (60%) than transfers (51%);3) Unemployment recipients have more children—2.7 vs. 2.0; age of youngest child is3.5 years old on average;4) on average recipients are working 34 hours for $7 and 5.5 months at current job; moreformal education leads to higher employment and earnings;5) more than half of recipients enrolled or planning to enroll in W-2—a greaterpercentage are transfers than new recipients; 92% had previously received AFDC;6) 40% received AFDC for 2 years or less, 33% for more than 5 years;7) 84% plan to continue medical assistance; 15% SSI; 61% food stamps; 72% Medicaid;54% WIC.

Appendix B: Summary of Research Studies
50
MEP Non-MEP
Title of Study Purpose Outcomes/Issues Analyzed Findings
X Center for Self-Sufficiency.1999. Homeless Families inMilwaukee After WelfareReform: A LongitudinalLook at the Causes andEffects of Homelessness.Milwaukee, WI: TheCenter.
A longitudinal study of single mothers'experiences of homelessness to assesswhether homelessness is a directproduct of the state's public assistanceprogram requirements.Sample: 62 female shelter residentsbetween Nov 1997-May 1998; samplefell by 40% for Waves 2 & 3.3 Surveys: Wave 1: Nov 1997-May1998; Wave 2: 3 months after Wave 1;Wave 3: 6 months after Wave 1.
employment, homelessness,impact of shelter life, religion,substance abuse, domesticviolence, plans for the future
1) 32% had been sanctioned some time since W-2 introduced, but only 10% blamed thisfor their homelessness;2) 61% of respondents lived somewhere else before coming to the shelter;3) Only 8% said homelessness had not changed their thinking at all;4) 34% looking for work, 11% had found work; 8% already working;5) 20% not looking for housing; 25% had arrangements; 55% actively looking;6) Plans for future: 40% planned to get more education and training; 21% plan toprovide/take care of children; 19% said plan to increase involvement with God andchurch.
X St. Norbert College SurveyCenter. 1999. W-2 WelfareReform Survey. De Pere,WI: The Survey Center.
To evaluate the effects of statewidewelfare reform on local Brown Countyresidents; specifically leavers andunmet needs/gaps in support.
Sample: 142 individuals in BrownCounty who were (sometime in therecent past) requesting services for theAFDC program; includes peoplediverted who never received AFDC,people who had received at one timebut not since the end of 1996, andpeople recently on AFDC who choseto get off in 1998 or were taken off dueto welfare reform.
4 Surveys in 1998: March/April,June/July, Sept/Oct, & Nov/Dec 1998
transportation, hunger, child care,employment, job skills & training,medical care, disabilities, benefits,family history & experiences
1) Fewer people receiving food stamps; decrease in medical assistance;2) About 50% accepted job due to W-2; higher education leads to higher income;diverted welfare respondents had more job experiences and skills, while short-termdiscontinued reported the lowest; over 66% had economic difficulty in 3 of the 4periods;3) most households had informal child care; most liked their current provider; problemswith child care: affordability, safety, location, space, quality, and scheduling;4) health coverage decreased over periods; 33% had someone not covered; 66% citedaffordability as problem; medical/prescriptions a problem more than dental care;5) most are renters; 25% moved every quarter; frequent movers less likely to receivepublic assistance; 33% pay for own rent; rental assistance and then borrowing mostlikely way to pay rent; small percentage are homeless; 10% were threatened witheviction.6) correlation between driver's license and education & income
Agency Representatives: 1) said clients did not have adequate education or skills forhigher-paying jobs; 2) said respondents felt more motivated over time in the job market;3) said feeding families was even harder than families themselves had said.
General Population: better education, married, work more hours, higher wages and moreincome than welfare group; more likely to say low wages not a problem; more computerskills; received full amount of child support all the time; fewer said they moved recentlyto find cheaper housing.

Appendix B: Summary of Research Studies
51
MEP Non-MEP
Title of Study Purpose Outcomes/Issues Analyzed Findings
X Swartz, Rebecca, et al.1999. Converting toWisconsin Works: WhereDid They Go When AFDCEnded in Milwaukee?Madison, WI: The HudsonInstitute, and Washington,DC: Mathematica PolicyResearch.
To evaluate the conversion experienceand current status of former AFDCrecipients in Milwaukee (not a leaversstudy).
Sample: 296 cases on AFDC inMilwaukee County in August 1997;some converted to W-2, some beganworking, some pursued otherstrategies.
1 Survey: took place between Oct1998 through March 1999, but askedquestions about the period of timefrom August 1997 to February 1999.
employment, governmentassistance, earnings, and othermeasures of well-being
1) 44% of former AFDC recipients began W-2 the month after AFDC ended; 72% begansome of the steps to get W-2; 75% received some type of cash grant after AFDC ended.2) Of those who converted to W-2 initially, more were likely to be receiving W-2,Medicaid, food stamps than those who did not convert initially.3) 41% of former AFDC recipients were working in regular, unsubsidized jobs 1 yearafter W-2 began; 28% in W-2 work training placement; Working parents earned abovethe poverty line—others in work training, SSI, or none of these earned below the povertyline.4) 69% of former recipients relied on family and/or community for financial help ortransportation, phone.5) the mean income for former AFDC recipients working in unsubsidized jobs is$18,045; $12,432 for those in W-2 work training placements; $7.45/hour in unsubsidizedjob; nearly 1/2 worked 6 months or less.6) Former AFDC recipients' needs: transportation 41%; money 37%; phone 36%; 33%use food pantries.
X Wisconsin Department ofWorkforce Development.1999. Wisconsin Works:Survey of Those LeavingAFDC or W-2 January toMarch 1998 PreliminaryReport. Madison, WI: TheDepartment.
To assess how families who leftassistance in the 4 quarters of 1998 arefaring.Sample: 375 individuals statewidewho participated in W-2 and/or AFDCfor any duration between January 1,1998, and March 31, 1998, and whoalso left prior to April 1, 1998.4 Surveys: for each quarter of 1998;1st quarter survey complete and thesurvey of the 2nd quarter of 1998began in May 1999. All 4 quarterscomplete by Dec 1999.
employment history, quality oflife, and family dynamics.
1st quarter of 1998 survey results:1) 62% working at time of interview; 17% were never employed since leaving welfare;2) Average wage $7.42 per hour; 58% employed 40 or more hours a week;3) 69% said life is better off welfare, but respondents also expressed difficulties makingends meet;4) Leavers use services/benefits: Medicaid 72%; food stamps 49%; school lunchsubsidy 47%; WIC 38%; child support 27%; rent subsidies 25%.
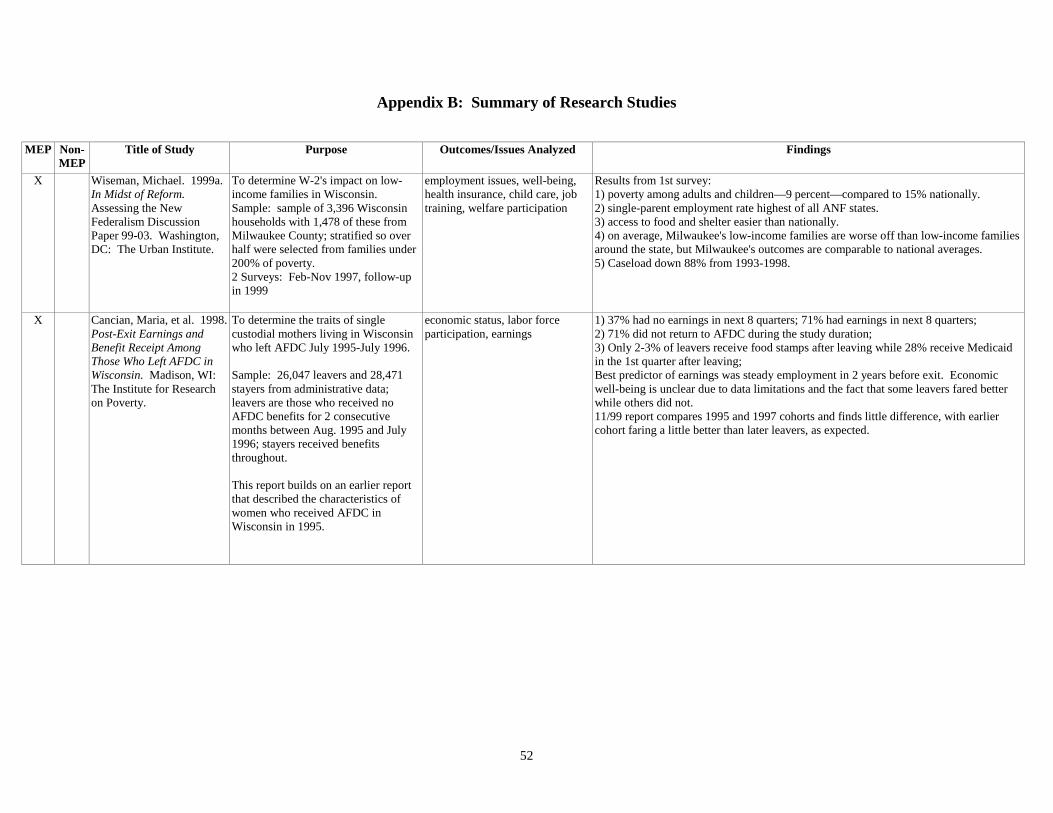
Appendix B: Summary of Research Studies
52
MEP Non-MEP
Title of Study Purpose Outcomes/Issues Analyzed Findings
X Wiseman, Michael. 1999a.In Midst of Reform.Assessing the NewFederalism DiscussionPaper 99-03. Washington,DC: The Urban Institute.
To determine W-2's impact on low-income families in Wisconsin.Sample: sample of 3,396 Wisconsinhouseholds with 1,478 of these fromMilwaukee County; stratified so overhalf were selected from families under200% of poverty.2 Surveys: Feb-Nov 1997, follow-upin 1999
employment issues, well-being,health insurance, child care, jobtraining, welfare participation
Results from 1st survey:1) poverty among adults and children—9 percent—compared to 15% nationally.2) single-parent employment rate highest of all ANF states.3) access to food and shelter easier than nationally.4) on average, Milwaukee's low-income families are worse off than low-income familiesaround the state, but Milwaukee's outcomes are comparable to national averages.5) Caseload down 88% from 1993-1998.
X Cancian, Maria, et al. 1998.Post-Exit Earnings andBenefit Receipt AmongThose Who Left AFDC inWisconsin. Madison, WI:The Institute for Researchon Poverty.
To determine the traits of singlecustodial mothers living in Wisconsinwho left AFDC July 1995-July 1996.
Sample: 26,047 leavers and 28,471stayers from administrative data;leavers are those who received noAFDC benefits for 2 consecutivemonths between Aug. 1995 and July1996; stayers received benefitsthroughout.
This report builds on an earlier reportthat described the characteristics ofwomen who received AFDC inWisconsin in 1995.
economic status, labor forceparticipation, earnings
1) 37% had no earnings in next 8 quarters; 71% had earnings in next 8 quarters;2) 71% did not return to AFDC during the study duration;3) Only 2-3% of leavers receive food stamps after leaving while 28% receive Medicaidin the 1st quarter after leaving;Best predictor of earnings was steady employment in 2 years before exit. Economicwell-being is unclear due to data limitations and the fact that some leavers fared betterwhile others did not.11/99 report compares 1995 and 1997 cohorts and finds little difference, with earliercohort faring a little better than later leavers, as expected.

Appendix B: Summary of Research Studies
53
MEP Non-MEP
Title of Study Purpose Outcomes/Issues Analyzed Findings
X Putz, Marilyn. 1998.Walworth County W-2Program: W-2 Follow-UpStudy. Elkhorn, WI:Walworth County JobCenter.
To assess how families in WalworthCounty who left AFDC or W-2programs (4-6 months out) sinceJanuary 1996 are faring.Sample: All customers who leftAFDC or W-2 programs since Jan1996.5 Surveys 4-6 months after eachquarter: Oct 1997-Dec 1997Jan 1998-March 1998April 1998-June 1998July 1998-Sept 1998Oct 1998-Dec 1998
employment, financial status,family well-being, insurancecoverage, child care, personalfeelings about current status
Walworth County, results aggregated from all 5 quarters:1) 76% working for $7.61/hr 36 hours per week;2) 31 to 48% have some type of health insurance; 27% receiving food stamps; 42% withrent subsidy or public housing;3) 73% better off.
X Pawasarat, John. 1997a.The Employer Perspective:Jobs Held by the MilwaukeeCounty AFDC Single-Parent Population (January1996-March 1997).Milwaukee, WI: TheEmployment and TrainingInstitute.
To examine jobs held by single parentswho were on AFDC in Milwaukee inDecember 1995 and who are expectedto work under W-2.
Sample: single parents who were onAFDC in Milwaukee County inDecember 1995 and who wereexpected to work under W-2. Duringthe 5-quarter study from Jan 1996 toMarch 1997, 4,418 employersemployed 18,126 AFDC recipients in atotal of 29,549 jobs.
Review of 5 quarters: Jan 1996 toMarch 1997
industry of jobs, retention,duration of employment, wages
1) 30% single parents in temporary agencies; 23% retail trade; 13%hotel/auto/business/personal services;2) high turnover; 75% employed in 2nd quarter 1996 not employed for 1st quarter 1997.

Appendix B: Summary of Research Studies
54
MEP Non-MEP
Title of Study Purpose Outcomes/Issues Analyzed Findings
X Pawasarat, John. 1997b.Employment and Earningsof Milwaukee CountySingle-Parent AFDCFamilies: EstablishingBenchmarks for MeasuringEmployment OutcomesUnder W-2. Milwaukee,WI: The Employment andTraining Institute.
To examine earnings and employmentof single parents who were on AFDCin Milwaukee in December 1995 andwho are expected to work under W-2.
Sample: 25,125 single parentsreceiving AFDC in Milwaukee Countyin December 1995 who are expected towork under W-2. During the 5quarters from Jan 1996 to March 1997,DWD employer records showemployment and earnings for 18,126of the 25,125 parents at some point.
Review of 5 quarters: Jan 1996 toMarch 1997
quarterly earnings, employment,industry of jobs, duration ofemployment
Cases leaving AFDC in Sept 1996:1) only 16% showed earnings above poverty; 34% showed no earnings in 4th quarter1996;2) 10% of cases remained off AFDC in December 1996 and had sustained earningsabove poverty in both 4th quarter 1996 and 1st quarter 1997.
Caseload and Aggregate Analysis
X Brookings Institution.1999. The State of WelfareCaseloads in America'sCities: 1999. Washington,DC: The BrookingsInstitution/Center on Urban& Metropolitan Policy.
Examine welfare caseload trends in 29largest U.S. cities, includingMilwaukee.
1990-1997 annual data; 1998 monthlydata for 8 months (counties)
state caseload concentration incities; relative speed of caseloaddecline in cities
Of the 29 counties studied, Milwaukee County had greatest concentration of statecaseload and greatest increase in concentration (from 57% of state caseload in 1990 to86% in 1997). Milwaukee's caseload declined by 72%, but that was slower than for thestate as a whole, which declined by 84%.
X Mead, Lawrence M. 1999b.“The Decline of Welfare inWisconsin.” Journal ofPublic AdministrationResearch and Theory, Vol.9, No. 4: 597-622.
To identify program practices thathave contributed to Wisconsin'swelfare caseload decline("dependency").
1986-1994
Percent change in AFDCaggregate caseloads
The economy plus the enforcement of work requirements and child support enforcement“drove the caseload down.”

Appendix B: Summary of Research Studies
55
MEP Non-MEP
Title of Study Purpose Outcomes/Issues Analyzed Findings
X Moore, Thomas S., andVicky Selkowe. 1999. TheGrowing Crisis AmongWisconsin's PoorestFamilies: A Comparison ofWelfare Caseload Declinesand Trends in the State'sPoverty Population, 1986-1997. Milwaukee, WI: TheInstitute for Wisconsin'sFuture.
Examine the caseload decrease in thestate in relation to decrease in thenumber of poor; examine changes inreal income and economic well-beingof the poor.
1986-1997
change in caseload (1986, 1988,1993, 1995, 1997); change inpoverty population (annual)(1989-1997); change in annualfood stamp cases with childrenand income less that 50% ofpoverty (annual 1989-1997)
Decline in welfare not matched by a decline in number of poor; substantial increase innumber of poor households with children on food stamps. "…Efforts to replace welfarein Wisconsin have resulted in increased deprivation among a large segment of the state'spoverty population."
X Employment and TrainingInstitute. 1998.Employment and EconomicWell-Being of Families inCentral City MilwaukeeNeighborhoods.Milwaukee, WI: TheInstitute.
To develop indices to measureemployment, economic & welfarechanges by Milwaukeeneighborhoods—as benchmarks togauge progress in these areas.
1993 and 1997
mean income of married & singlepeople, total $ in EITC to allfamilies, etc.—very broadvariables
1) most families are working; 2) public assistance only small part of total income; 3)gross income is growing; 4) housing values increasing; 5) violent crime declining; 6)business growth; 7) working poor increased; 8) few job vacancies; 9) driver's licensesuspension has gone up; 10) fewer people receiving child care subsidies; 11) EITCpayments increased but still more awareness needed.
X Wiseman, Michael. 1996.State Strategies for WelfareReform: The WisconsinStory. IRP Reprint Series.Madison, WI: Institute forResearch on Poverty.
Examine Wisconsin's caseload declineand document the evolution of welfarereform policies and strategies inWisconsin.
1986-1995 annual data statewide
Change in caseload and spending;change in benefits/standard ofneed
Caseload decline results from a combination of factors, including reduction inbenefits/standard of need, economy, programs, but not possible to distinguish amongthese. Wisconsin welfare reform has evolved over time; W-2 service-rich andadministratively rich.

Appendix B: Summary of Research Studies
56
MEP Non-MEP
Title of Study Purpose Outcomes/Issues Analyzed Findings
Implementation, Program Development, and Management Analysis
X Manpower DemonstrationResearch Corporation.Forthcoming January 2000.Study of W-2Implementation inMilwaukee. New York,NY: MDRC.
Implementation of W-2 in MilwaukeeCounty: focus on the first 3 years withspecial interest on relations betweengovernment agencies and serviceproviders, assessment of participants,experience of participants, & progressup employment ladder.
Summer 1999 — 100 interviews;CARES data analyzed for thosepersons on AFDC as of Aug 1997 andthrough Feb 1999. 4 reports issuedstarting Jan 2000.
intake, assessment, assignment,community service jobs, W-2transitional placements, discretion
No findings at this time.
X Wisconsin Department ofWorkforce Development.Forthcoming. WisconsinPolicy and AdministrativeDatabase (WisPAD).Madison, WI: TheDepartment.
To develop longitudinal admin data for1988-present using data from Divisionof Economic Support (DES), CARES,CRN, UI.
In progress.
economic and family status ofindividuals and cases over timeand in relationship to their publicprogram usage.
Plans call for this database to link eligibility and program data from AFDC/TANF, theFood Stamp Program, Medical Assistance, UI wage reports, Child Support, child welfareinformation, state tax data and vital statistics, as well as selected survey data whereappropriate.
X Courtney, Mark, et al.1999. WisconsinAdministrative LinkBetween CARES and HSRS.Madison, WI: The Institutefor Research on Poverty.
To evaluate the potential for linkingthe Human Services Reporting System(HSRS) with the Client Assistance andReemployment System (CARES).
Early 1998 to June 1999.
foster care, child abuse andneglect reporting, mental healthprograms, related programs
Analysis of HSRS over the past year points to the need for additional exploration ofalternative and complementary data sources before any strategy for incorporating childwelfare data into WisPAD can be finalized.

Appendix B: Summary of Research Studies
57
MEP Non-MEP
Title of Study Purpose Outcomes/Issues Analyzed Findings
X Kaplan, Thomas, and IngridRothe. 1999. New Hopeand W-2: CommonChallenges, DifferentResponses. Madison: WI:The Institute for Researchon Poverty.
To evaluate the similarities anddifferences between New Hope andW-2.
1998-1999
Program objectives and design. Program similarities: 1) Adhere to "Work First" principle; 2) both offer CommunityService Jobs as last resort; 3) financial help with child care and health insurance.Program differences: 1) New Hope has broader eligibility—all adults over 18 withincome <=150% poverty who were willing to work, need not have children; 2) For singleparents, New Hope was a voluntary option beyond AFDC and, later, W-2 programs; 3)New Hope does not have provisions for people who cannot work due to disability orphysical/mental problems; 4) New Hope actively recruited, W-2 has done this onlyrecently; 5) New Hope emphasized that people should use other federal services for childcare and food stamps, etc.—W-2 did not provide services unless a client asked for it; 6)Goal of New Hope was to get income over poverty level—W-2 compares to otherfamilies that are working to support their families; 7) New Hope saw CommunityService Job participants as workers while W-2 sees them as jobseekers.
X Mead, Lawrence M. 1999a.Statecraft: The Politics ofWelfare Reform inWisconsin. Madison, WI:Institute for Research onPoverty.
A discussion of the politicalenvironment in WI that led to theradical and successful reform of familywelfare.
Published Feb 1999.
Political and policy development. 1) Favorable economic and social conditions alone cannot explain Wisconsin's welfaresuccess;2) Government is more capable in Wisconsin than in most states;3) The progressive heritage of Wisconsin politics in late 1800s and early 1900s;4) Fiscal strain in the state in the 1980s led to reform.
X Wiseman, Michael. 1999b.A Management InformationModel for New-Style PublicAssistance. Assessing theNew Federalism DiscussionPaper 99-10. Washington,DC: The Urban Institute.
Develops a model of the managementinformation required to operate thenew, change-oriented welfare reformschemes developed by states in the1990s.
Published Aug 1999.
Discusses MIS (ManagementInformation System)
1) The MIS outlined in this paper is dependent upon appropriate incentives for datacollection at intake and at each transaction. A step in this direction is to make sure thatthe information is made available promptly to those who need it;2) The MIS developed for TANF is important as an indicator of the nature of theprogram being implemented and as a source of information on operations andconsequences for families.

Appendix B: Summary of Research Studies
58
MEP Non-MEP
Title of Study Purpose Outcomes/Issues Analyzed Findings
X Hoffman, Caroline, andAmy Fisher. 1998.Families in Poverty:Parents with Disabilitiesand Their Children.Madison, WI: WisconsinCouncil on DevelopmentalDisabilities.
To summarize statewide data onfamilies participating in the CaretakerSupplement Program (C-Supp) andparents on SSI.
Dec 1997-Nov 1998
number receiving C-Supp, foodstamp receipt, number of SSIchildren in C-Supp families,disability of the parents
1) 5,941 Wisconsin families, with 11,452 children, are headed by a parent with a severedisability;2) Prior to W-2, low-income parents with disabilities received SSI and a child-only grantfrom AFDC—C-Supp replaces AFDC for families headed by a parent on SSI;3) Total 1998 SSI grant for one person is $578 and SSI is $100/child—this represents a60% reduction in income for those with 1 child; 55% reduction in income for those with2 children; 42% reduction in income for those with 3 children;4) 80% interviewed said they would like to work—barriers include: severity ofdisability, SSI work disincentives, exclusion from W-2 employment services, lack ofaccess to child care assistance, lack of employment opportunities;5) SSI, C-Supp, food stamps, housing aid, child support—an increase in one of theseservices/benefits results in a reduction in another;6) 60% of parents could not afford food; 73% receive food stamps but these were notenough, especially for diapers and other things food stamps cannot buy.
X Institute for Wisconsin'sFuture. 1998a. Transitionsto W-2: The First SixMonths of WelfareReplacement. Milwaukee,WI: The Institute.
To monitor the impact of W-2 onclients, the agencies serving low-income families, and the largercommunities during theimplementation period. Somestatewide information, some forMilwaukee.
Sept 1997 through June 1998
job placement, wages, services,income, barriers to self-sufficiency, disability
1) 53% of AFDC clients entered W-2; 30% are job ready; 60% in community service;10% have severe impediments to employment;2) Statewide in 1997, there are 123,000 low-skill job seekers and 41,000 low-skill jobs—thus 66% with no job available.3) Of women turned away from W-2—80% were unemployed; 43% had grade schooleducation only; 38% were both unemployed and had only a grade school education.4) Not told about other entitlement programs—86% not told about food stamps; 70% nottold about medical assistance; 92% not told about child care help; 97% not told abouttransportation assistance.5) Many W-2 applications turned away inappropriately, mistakenly labeled as job readyand lost all cash income.6) Under W-2, families headed by disabled persons experienced a significant drop inincome, ranging from 55 to 69% of total monthly income.

Appendix B: Summary of Research Studies
59
MEP Non-MEP
Title of Study Purpose Outcomes/Issues Analyzed Findings
X Itzkowitz & Associates.1998. Portage CountyHealth and Human ServicesFamily Survey. StevensPoint, WI: Itzkowitz &Associates.
To determine if families have had areduced connection to one or morePortage County Health and HumanServices (PCHHS) programs duringthe transition to W-2 around Sept1997.
March 1996-June 1999
employment, transportation, childcare use, child support, recentbenefit use, hunger issues, familystress, disability
1) 66% white, 66% single head of household, 33% have 1 child, 25% have 2 children,20% have 3 children; 1/6 of adults have no high school diploma;2) Most parents worked at present jobs more than 1year; earned an average of $6.83, but61% worked less than full-time; 60% earned <$1,000 per month;3) Fewer than 75% had no health insurance; most parents commuted 5 miles or less towork; 33% of parents said child care problems interfered with work last year;4) Most children cared for by licensed providers; 40% use friends/family; 12% at homeunder supervision of another child;5) Most families don't receive full child support payment; 50% of respondents facedhunger last year; 63% said they were not hungry for more than a full day last year; 27%said they were hungry for 8 days or less;6) 50% have trouble paying bills; many report high stress, crying.
X Kaplan, Thomas. 1998.Wisconsin's W-2 Program:Welfare as We Might Cometo Know It. IRP DiscussionPaper 1173-98. Madison,WI: The Institute forResearch on Poverty.
Describes W-2, compares distinctivefeatures of the program to TANFprogram in other states, discussesorigins of W-2, and early trends inimplementation.
Published Sept 1998.
policy and program development 1) Informal limits on the use of unsubsidized placements—Milwaukee agenciesdeveloped informal limits on the length of time participants can be in the job marketwithout a subsidy;2) Heavy use of Community Service Job placement—has become almost defaultassignment with 63% of all W-2 placements in Milwaukee as of April 30, 1998;3) Strong emphasis on time limits—clear from the initial assessment, unlike other states;4) Low use of child care resources—much new monies allocated but have gone largelyunused;5) The important role of Financial and Employment Planners (FEP)—determineindividual employability plans, assign participants to levels of W-2 and motivate andsanction clients;6) Problems: cut families off without notice; denied benefits to eligible families; slowwith child care reimbursements.
X Milwaukee Women andPoverty Public EducationInitiative. 1998. W-2Community Impact Study.Milwaukee, WI: TheInitiative.
To assess how families in Milwaukeereceiving food stamps only, with noreported earned or unearned income,are being affected by the welfarereform changes.
Mid-1998
survival, barriers to employment,family impact and needs
Profile of the average family: living with one or more other families, money fromfamily and friends, single-headed, black, 2 children, some high school education, soleprovider but has <$600/mo, no child support, not in W-2 because they have beendeclared job ready, caseworker error, sanctioned out of the program.1) major barriers to work: transportation; child care; no phone; stress; not fluent inEnglish;2) sanctioned due to caseworker error, no reason given, job ready.

Appendix B: Summary of Research Studies
60
MEP Non-MEP
Title of Study Purpose Outcomes/Issues Analyzed Findings
X Wulff, Damian. 1998. W-2Implementation Impact inMarathon CountyWisconsin: Welfare RollReductions: Where Did Allthe Families Go? Seniorthesis submitted to ThomasJ. Kaplan, LaFolleteInstitute of Public Affairs.
To assess the implementation impactof W-2 on residents of MarathonCounty who did not transition fromAFDC to W-2.
1998
employment status, housing, childcare, transportation, income, W-2eligibility
1) After W-2, the welfare caseload dropped 80%;2) Half currently working at or near full-time, but 60% earn less than $7.50/hr3) Average family size is 5—thus, on average, earning less than poverty;4) Families have child care and transportation, but concerns over housing, food,understanding W-2 benefits and eligibility.
X Corbett, Thomas J. 1995.Welfare Reform inWisconsin: The Rhetoricand the Reality. IRPReprint Series. Madison,WI: Institute for Researchon Poverty.
Discusses WI's policy innovations,political environment, and efforts torespond to society's growingdissatisfaction with AFDC.
Published 1995.
Policy and program development. 1) In the early 70s welfare expenditure expanded greatly and by the mid-80s WI's percapita spending averaged 29% above the US average; with these increases, the caseloadalso increased dramatically;2) As WI came to be seen as a magnet for welfare recipients, the mood started to shift;1986 Republican Tommy Thompson began the change with budget cuts in Jan 1987.3) 4 Cs for welfare reform to succeed in any state: Clarity—clear vision; Consensus—nonpartisan issue; Continuity—continuous attention over many years; Confidence—credible evaluation of success.
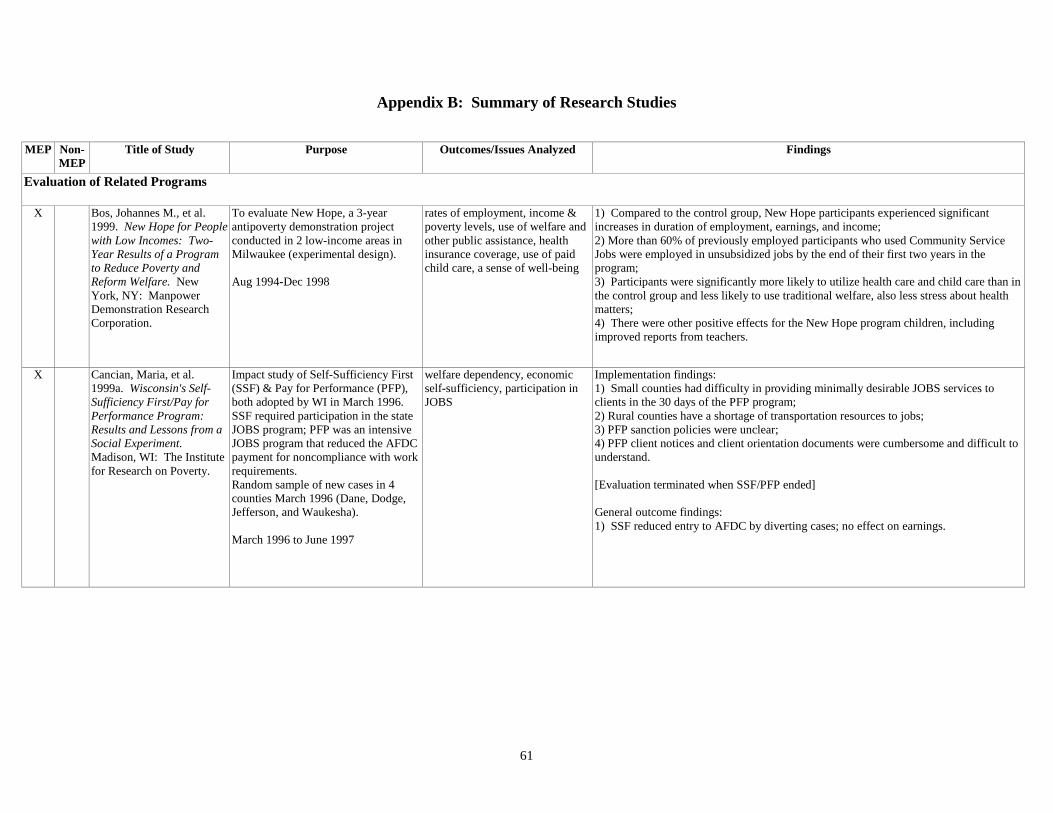
Appendix B: Summary of Research Studies
61
MEP Non-MEP
Title of Study Purpose Outcomes/Issues Analyzed Findings
Evaluation of Related Programs
X Bos, Johannes M., et al.1999. New Hope for Peoplewith Low Incomes: Two-Year Results of a Programto Reduce Poverty andReform Welfare. NewYork, NY: ManpowerDemonstration ResearchCorporation.
To evaluate New Hope, a 3-yearantipoverty demonstration projectconducted in 2 low-income areas inMilwaukee (experimental design).
Aug 1994-Dec 1998
rates of employment, income &poverty levels, use of welfare andother public assistance, healthinsurance coverage, use of paidchild care, a sense of well-being
1) Compared to the control group, New Hope participants experienced significantincreases in duration of employment, earnings, and income;2) More than 60% of previously employed participants who used Community ServiceJobs were employed in unsubsidized jobs by the end of their first two years in theprogram;3) Participants were significantly more likely to utilize health care and child care than inthe control group and less likely to use traditional welfare, also less stress about healthmatters;4) There were other positive effects for the New Hope program children, includingimproved reports from teachers.
X Cancian, Maria, et al.1999a. Wisconsin's Self-Sufficiency First/Pay forPerformance Program:Results and Lessons from aSocial Experiment.Madison, WI: The Institutefor Research on Poverty.
Impact study of Self-Sufficiency First(SSF) & Pay for Performance (PFP),both adopted by WI in March 1996.SSF required participation in the stateJOBS program; PFP was an intensiveJOBS program that reduced the AFDCpayment for noncompliance with workrequirements.Random sample of new cases in 4counties March 1996 (Dane, Dodge,Jefferson, and Waukesha).
March 1996 to June 1997
welfare dependency, economicself-sufficiency, participation inJOBS
Implementation findings:1) Small counties had difficulty in providing minimally desirable JOBS services toclients in the 30 days of the PFP program;2) Rural counties have a shortage of transportation resources to jobs;3) PFP sanction policies were unclear;4) PFP client notices and client orientation documents were cumbersome and difficult tounderstand.
[Evaluation terminated when SSF/PFP ended]
General outcome findings:1) SSF reduced entry to AFDC by diverting cases; no effect on earnings.
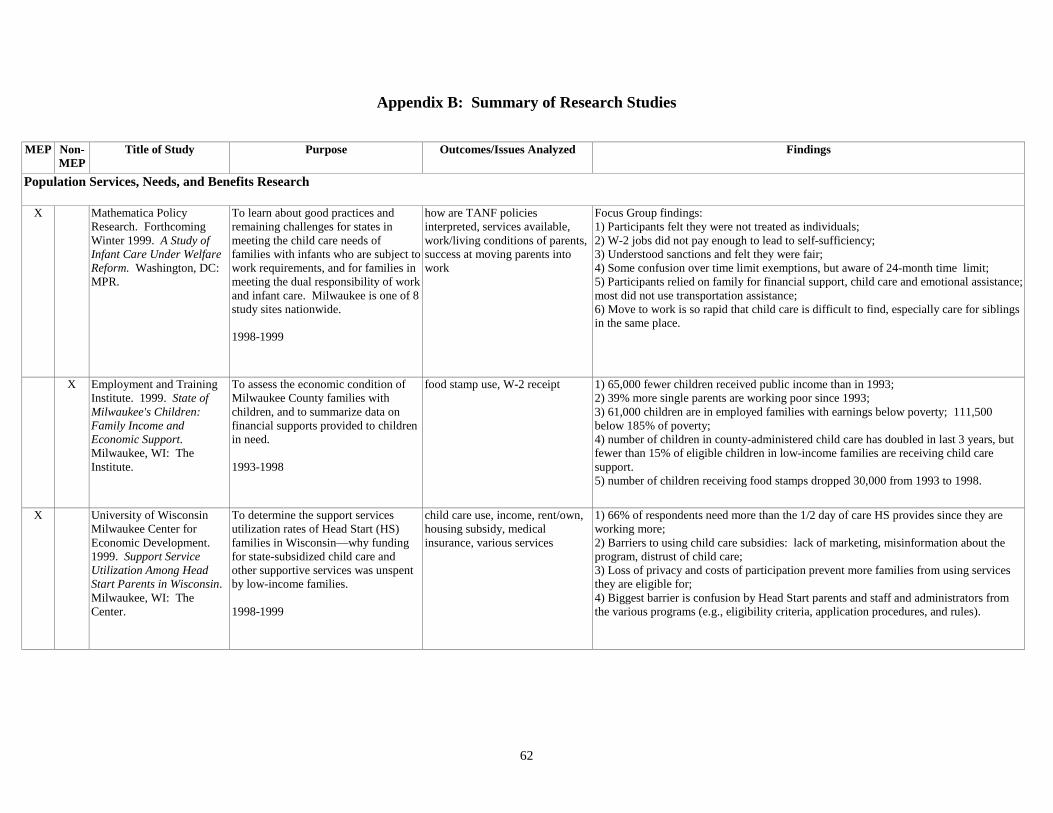
Appendix B: Summary of Research Studies
62
MEP Non-MEP
Title of Study Purpose Outcomes/Issues Analyzed Findings
Population Services, Needs, and Benefits Research
X Mathematica PolicyResearch. ForthcomingWinter 1999. A Study ofInfant Care Under WelfareReform. Washington, DC:MPR.
To learn about good practices andremaining challenges for states inmeeting the child care needs offamilies with infants who are subject towork requirements, and for families inmeeting the dual responsibility of workand infant care. Milwaukee is one of 8study sites nationwide.
1998-1999
how are TANF policiesinterpreted, services available,work/living conditions of parents,success at moving parents intowork
Focus Group findings:1) Participants felt they were not treated as individuals;2) W-2 jobs did not pay enough to lead to self-sufficiency;3) Understood sanctions and felt they were fair;4) Some confusion over time limit exemptions, but aware of 24-month time limit;5) Participants relied on family for financial support, child care and emotional assistance;most did not use transportation assistance;6) Move to work is so rapid that child care is difficult to find, especially care for siblingsin the same place.
X Employment and TrainingInstitute. 1999. State ofMilwaukee's Children:Family Income andEconomic Support.Milwaukee, WI: TheInstitute.
To assess the economic condition ofMilwaukee County families withchildren, and to summarize data onfinancial supports provided to childrenin need.
1993-1998
food stamp use, W-2 receipt 1) 65,000 fewer children received public income than in 1993;2) 39% more single parents are working poor since 1993;3) 61,000 children are in employed families with earnings below poverty; 111,500below 185% of poverty;4) number of children in county-administered child care has doubled in last 3 years, butfewer than 15% of eligible children in low-income families are receiving child caresupport.5) number of children receiving food stamps dropped 30,000 from 1993 to 1998.
X University of WisconsinMilwaukee Center forEconomic Development.1999. Support ServiceUtilization Among HeadStart Parents in Wisconsin.Milwaukee, WI: TheCenter.
To determine the support servicesutilization rates of Head Start (HS)families in Wisconsin—why fundingfor state-subsidized child care andother supportive services was unspentby low-income families.
1998-1999
child care use, income, rent/own,housing subsidy, medicalinsurance, various services
1) 66% of respondents need more than the 1/2 day of care HS provides since they areworking more;2) Barriers to using child care subsidies: lack of marketing, misinformation about theprogram, distrust of child care;3) Loss of privacy and costs of participation prevent more families from using servicesthey are eligible for;4) Biggest barrier is confusion by Head Start parents and staff and administrators fromthe various programs (e.g., eligibility criteria, application procedures, and rules).

Appendix B: Summary of Research Studies
63
MEP Non-MEP
Title of Study Purpose Outcomes/Issues Analyzed Findings
X Catholic Charities of theArchdiocese of Milwaukee,Inc., and WisconsinCatholic Conference. 1998.Raising Children in a Worldof Work Not Welfare.Milwaukee, WI: CatholicCharities.
To examine how mothers of youngchildren in Milwaukee meet theirresponsibilities as parents in a "work,not welfare" society, and womenreporting their opinions of past andcurrent policies.
Published Nov 1998.
eligibility for child support,education, work experience,training, receipt of AFDC
1) more than 2/3 of mothers worry about: paying bills, getting/keeping jobs, medicalcare, food, housing, money for child care;2) average respondent is never married with 2.5 children, no high school diploma, 5.5years on AFDC, most not receiving child support, 1/3 have trouble getting health care;3) 75% happy with child care choice, 52% of mothers using relatives expressed a highlevel of worry about this type of care;4) 57% of mothers rated as depressed.
X Ebert, Rose, et al. 1998.W-2 Follow-Up Survey.Manitowoc, WI: ForwardService Corporation,Manitowoc Job Center.
To determine if follow-up serviceswere needed and to monitor successand hardships relating to employmentfor people who had received AFDCand/or W-2 in Manitowoc County asfar back as January 1997.
Fall 1998
services needed, employmentstatus, wages, health insurance,EITC receipt, child support,public assistance, helpfulagencies, types of assistanceneeded
Manitowoc:1) 84% of respondents employed; of these 78% full-time and 54% employed at the samejob they had when they left the welfare program;2) average wage $6.82; 54% receive health insurance from employer; 63% filed forEITC;3) 4.6 people per household, 76% of those eligible for child support are receiving it;4) 61% still on public assistance, including food stamps, rental/child care/energysubsidy, medical assistance, WIC;5) entertainment: television, movies, parks, reading, board games, church, biking, zoo.
X Hunger Task Force ofMilwaukee and HungerAction Team. 1998. InitialFindings on the Impact ofWisconsin Works on FoodSecurity and Employment.Milwaukee, WI: The TaskForce.
To determine how employment gainedthrough participation in W-2 affectedfamilies' food security in Milwaukee.
employment, hours worked, typeof job, status, barriers to work,food stamp receipt, W-2participation, source of food
1) 57% said at least one person in household is regularly working;2) 24% are factory and/or warehouse workers;3) barriers include transportation, lack of experience/education, no job available;4) 38% received AFDC last year; 19% food stamps; 30% currently enrolled in W-2.
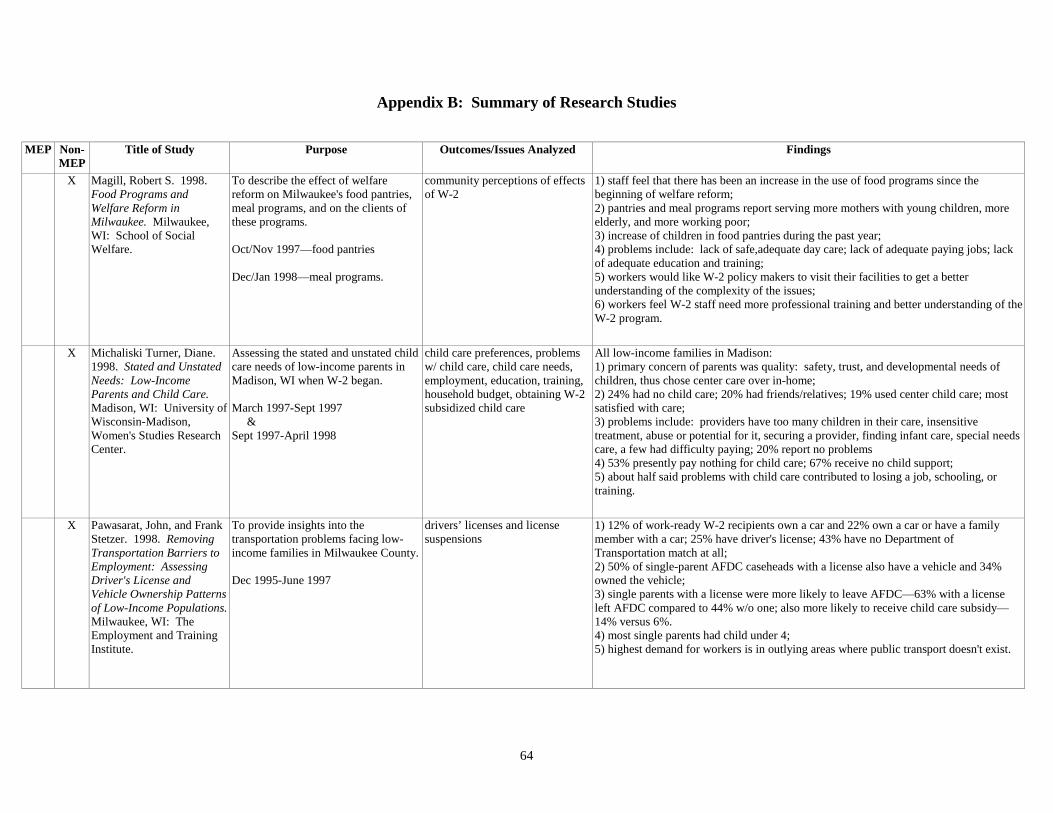
Appendix B: Summary of Research Studies
64
MEP Non-MEP
Title of Study Purpose Outcomes/Issues Analyzed Findings
X Magill, Robert S. 1998.Food Programs andWelfare Reform inMilwaukee. Milwaukee,WI: School of SocialWelfare.
To describe the effect of welfarereform on Milwaukee's food pantries,meal programs, and on the clients ofthese programs.
Oct/Nov 1997—food pantries
Dec/Jan 1998—meal programs.
community perceptions of effectsof W-2
1) staff feel that there has been an increase in the use of food programs since thebeginning of welfare reform;2) pantries and meal programs report serving more mothers with young children, moreelderly, and more working poor;3) increase of children in food pantries during the past year;4) problems include: lack of safe,adequate day care; lack of adequate paying jobs; lackof adequate education and training;5) workers would like W-2 policy makers to visit their facilities to get a betterunderstanding of the complexity of the issues;6) workers feel W-2 staff need more professional training and better understanding of theW-2 program.
X Michaliski Turner, Diane.1998. Stated and UnstatedNeeds: Low-IncomeParents and Child Care.Madison, WI: University ofWisconsin-Madison,Women's Studies ResearchCenter.
Assessing the stated and unstated childcare needs of low-income parents inMadison, WI when W-2 began.
March 1997-Sept 1997 &Sept 1997-April 1998
child care preferences, problemsw/ child care, child care needs,employment, education, training,household budget, obtaining W-2subsidized child care
All low-income families in Madison:1) primary concern of parents was quality: safety, trust, and developmental needs ofchildren, thus chose center care over in-home;2) 24% had no child care; 20% had friends/relatives; 19% used center child care; mostsatisfied with care;3) problems include: providers have too many children in their care, insensitivetreatment, abuse or potential for it, securing a provider, finding infant care, special needscare, a few had difficulty paying; 20% report no problems4) 53% presently pay nothing for child care; 67% receive no child support;5) about half said problems with child care contributed to losing a job, schooling, ortraining.
X Pawasarat, John, and FrankStetzer. 1998. RemovingTransportation Barriers toEmployment: AssessingDriver's License andVehicle Ownership Patternsof Low-Income Populations.Milwaukee, WI: TheEmployment and TrainingInstitute.
To provide insights into thetransportation problems facing low-income families in Milwaukee County.
Dec 1995-June 1997
drivers’ licenses and licensesuspensions
1) 12% of work-ready W-2 recipients own a car and 22% own a car or have a familymember with a car; 25% have driver's license; 43% have no Department ofTransportation match at all;2) 50% of single-parent AFDC caseheads with a license also have a vehicle and 34%owned the vehicle;3) single parents with a license were more likely to leave AFDC—63% with a licenseleft AFDC compared to 44% w/o one; also more likely to receive child care subsidy—14% versus 6%.4) most single parents had child under 4;5) highest demand for workers is in outlying areas where public transport doesn't exist.

Appendix B: Summary of Research Studies
65
MEP Non-MEP
Title of Study Purpose Outcomes/Issues Analyzed Findings
X Pawasarat, John, and LoisM. Quinn. 1998. RemovingBarriers to Employment:The Child Care-JobsEquation. Milwaukee, WI:The Employment andTraining Institute.
To examine the utilization of child caresubsidies by low-income parents inMilwaukee County over a 21-monthperiod from Jan 1996 through Sept1997.
Jan 1996-Sept 1997
food stamp use, medicalassistance records
1) Cost of providing subsidized child care has increased as AFDC families with youngerchildren and more children were required to meet work requirements in 1996 and 1997.Jan 1996=$1.3mil or $513 per family; by July 1997=$2.9 mil or $763 per family.2) The cost of providing child care to large single-headed families may exceed theirincome—some families receive in excess of $20K per year in subsidies.3) High turnover and high-volume patterns of child care mirror the employmentexperience of new entrants to the labor force;4) Those families able to maintain consistent care for their children had thecharacteristics of those most likely to remain off AFDC and hold sustained jobs—bettereducated, drivers’ licenses, older children.
X Koehn, Susan, and JaneAhlstrom. 1997. KenoshaCounty W-2 Child CareImplementation and DesignEvaluation. Kenosha, WI:Kenosha County EvaluationPlanning Group.
A study designed to monitor the effectsof the conversion to W-2 child care inKenosha County.
2 surveys in Oct 1996 andadministrative data for KenoshaCounty in Oct 1995 & 1996
job retention, self-sufficiency,parent's selection of child careproviders, satisfaction with childcare, child care availability,stability of child care, providersatisfaction
As of Oct. 1996:1) recipients earn $6.51/hr and have 2.2 children with youngest age 3.2;2) 50% of parents believe child care center is of highest quality; 21% believe licensed,family provider is best;3) 64% of parents were likely or very likely to change their child care arrangements inresponse to increasing copay;4) 88% of parents very satisfied/fairly satisfied with current arrangement;5) 72% of providers satisfied/very satisfied with current pay;6) 24% of providers have noticed a client turnover since June of 1996.
Job Demand and Employment Research
X Holzer, Harry J.Forthcoming Spring 2000.Milwaukee EmployerSurvey: Will EmployersHire Welfare Recipients?
To determine what factors influencethe hiring decisions of Milwaukeeemployers considering hiring welfarerecipients. Similar studies done inseveral other cities.
Late 1998-Early 1999
skill requirements, job vacancyrates, turnover rates, jobs filled,wages/benefits, performancemeasures, recruitment & training,recent welfare hires, willingnessto hire
No findings yet.

Appendix B: Summary of Research Studies
66
MEP Non-MEP
Title of Study Purpose Outcomes/Issues Analyzed Findings
X Pawasarat, John, and LoisM. Quinn. 1999. Survey ofJob Openings in theMilwaukee MetropolitanArea: Week of May 17,1999. Milwaukee, WI: TheEmployment and TrainingInstitute.
Semi-annual survey of area employersin the Milwaukee metropolitan areaused to improve planning foremployment of Milwaukee residents.
May 1999
industry, location, full/part-timestatus, wage rate, level of fringebenefits
1) 36,653 full/part-time jobs were available in the 4-county Milwaukee area;2) Service industry (30%), Retail/wholesale trade (25%), Manufacturing (15%);3) Employers in the suburbs find it more difficult to fill full-time and part-time openingsthan in the city;4) Virtually all employers paid over minimum wage ($5.15); average wage $7.62 forfull-time, $6.75 for part-time;5) 82% of full-time job openings could support 2 persons above poverty and 74% couldsupport 3 persons; but only 46% offered health insurance and family-supporting wagesfor 3-person families;6) Labor shortages in 3 counties, but job shortages in Milwaukee County; 62% of full-time jobs required education and training;7) jobs with highest demand are: cashiers, nursing aides, orderlies, food preparation,truck drivers, regular nurses.
X Institute for Wisconsin'sFuture. 1998b. The W-2Job Path: An Assessment ofthe Employment Trajectoryof W-2 Participants inMilwaukee. Milwaukee,WI: The Institute.
To examine the kinds of workexperience, skill development, andtraining W-2 participants inMilwaukee are receiving and todetermine what is required by areaemployers and how this is tied to wagelevels.
June/July 1998
work and training opportunities;wages of unskilled, technical,skilled, professional, andmanagement-level jobs; educationand skill levels required for jobs
1) Unsubsidized workers are work ready: 38% have no high school diploma/GED, 50%have only a high school diploma, low-skilled workers with wages at or below poverty,40% not receiving food stamps, 75% not receiving transportation costs;2) Subsidized workers (57% of W-2 pop) face barriers and must prepare for job marketbefore 2-year time limit is up: 66% are doing work experience not training, 16%working toward GED or skill training, 40% doing sorting, packing, cleaning, inspection,and minor repairs, 33% in job search, receives annual grants of $7,500 to $8,000, 40%not receiving food stamps, 75% not receiving child care assistance, 60% not receivingtransportation costs;3) Majority of W-2 workers are not in jobs that lead to self-sufficiency and are notgetting promised support in the transition period from AFDC;4) Employer skill demands are high—reading, math, computer skills necessary; wagesjump with skill level.
X Kleppner, Paul, and NikolasTheodore. 1997. WorkAfter Welfare: IsWisconsin's BoomingEconomy Creating EnoughJobs? Published by TheMidwest Job Gap Project.
To compare the number of low-skilledjob openings in Wisconsin with thenumber of people seeking them.
1996-1997
job demand 1) Despite recent economic prosperity, the Wisconsin economy is not generating enoughjobs to provide work opportunities for welfare recipients and low-skilled unemployedworkers;2) Worker-to-job ratio = 3 to 1 — This is worse in Milwaukee than rural/suburban areas.

Appendix B: Summary of Research Studies
67
MEP Non-MEP
Title of Study Purpose Outcomes/Issues Analyzed Findings
X Manpower DemonstrationResearch Corporation.Wisconsin EmploymentRetention/CareerAdvancement. Project onhold indefinitely.
To evaluate the effectiveness of astrong employment and careeradvancement approach to helpingfamilies achieve long-term financialself-sufficiency by placing CommunityService Job individuals in acontrol/experimental group when theyare assigned to employment search.
To start in Jan. 2000–Dec. 2001
wage, hours worked, benefits, jobadvancement
No findings yet.
Child Support and Fathers Research
X Wisconsin Department ofWorkforce Development.Forthcoming 2000. TeamParenting DemonstrationProject. Madison, WI: TheDepartment. (HHSResponsible Fatherhood;Ford Foundation FragileFamilies.)
To develop and implement a voluntaryprogram that provides employmentservices and parenting skills to unwedparents and to assess whether this canincrease voluntary compliance withchild support.
Sept. 1997-Sept. 2000
outcomes for children and parents,such as noncustodial parentinvolvement
No findings yet.
X Mathematica PolicyResearch. Forthcoming.NontraditionalOpportunities for Work(NOW). Princeton, NJ:MPR. (Welfare-to-WorkGrants ProgramEvaluation.)
To evaluate whether and how muchNOW improves employmentoutcomes, reduces recidivism in thecriminal justice system, increases childsupport payments, and enhancesfamily dynamics.
1999-2001
employment outcomes, recidivismrates in the criminal justicesystem, amount of child supportpayments, and family dynamics.
No findings yet.

Appendix B: Summary of Research Studies
68
MEP Non-MEP
Title of Study Purpose Outcomes/Issues Analyzed Findings
X Wisconsin Department ofWorkforce Development.Forthcoming December1999. Children First.Madison, WI: TheDepartment.
An evaluation of Children First whichrequires noncustodial parents who arein arrears to attend job search activitiesor face legal penalties on earnings,labor force attachment, child supportcollections, and arrearage.
1994-1996Final report not yet available.
employment, other outcomes No findings yet.
X Meyer, Daniel R., andMaria Cancian. 1999.Initial Findings from the W-2 Child SupportDemonstration Evaluation.Madison, WI: Institute forResearch on Poverty.
To evaluate W-2 Child SupportWaiver Demonstration (CSWD): priorto W-2, families received $50/monthof child support and the rest went toreimburse welfare expenditures. Since10/1/97, families retain entire amount.
Sept 1997-Feb 2001
child support collections, childsupport orders, paternity, childwell-being, nonresident parentearnings, formal vs. informalchild support payments
Preliminary findings:1) of those who entered W-2 and received a grant in a lower tier, after one year 16% hadmoved to a higher, nongrant tier, and an additional 44% left the program entirely;2) about half of all cases had recorded earnings in the 2nd quarter after they entered—earnings were low: by the 2nd quarter after entry only 25% earned $2,000 per quarter ormore;3) although only about 25% of W-2 recipients received child support when they enteredW-2, the percentage with receipts increased slowly, and the amounts received, for thosewho received something, are important, around $200 per month;4) total personal income in quarter of entry averaged $742/month, then increased to $881the next quarter, then decreased to $854. Overall trends reflect declines in averagebenefit receipt and smaller increases in average earnings;5) Monthly net governmental costs decreased over the period studies. Costs weremarkedly higher in Milwaukee County.


![[ Works, Documents, Texts and Related Resources ] | [ Ontologies ] for everyone](https://static.fdocuments.in/doc/165x107/568156af550346895dc44bc4/-works-documents-texts-and-related-resources-ontologies-for-everyone.jpg)