OVERVIEW OF PETROL AND DIESEL MARKET IN · PDF fileOVERVIEW OF PETROL AND DIESEL MARKET IN...
41
OVERVIEW OF PETROL AND DIESEL MARKET IN SOUTH AFRICA BETWEEN 2002 AND 2013 DIRECTORATE: ENERGY DATA COLLECTION, MANAGEMENT AND ANALYSIS
Transcript of OVERVIEW OF PETROL AND DIESEL MARKET IN · PDF fileOVERVIEW OF PETROL AND DIESEL MARKET IN...

OVERVIEW OF PETROL AND DIESEL MARKET
IN SOUTH AFRICA BETWEEN 2002 AND 2013
DIRECTORATE: ENERGY DATA COLLECTION, MANAGEMENT AND ANALYSIS

OVERVIEW OF PETROL AND DIESEL MARKET
IN SOUTH AFRICA BETWEEN 2002 AND 2013
DIRECTORATE: ENERGY DATA COLLECTION, MANAGEMENT AND ANALYSIS
Compiled by: Ms Keneilwe Ratshomo
Email: [email protected]
And
Mr Ramaano Nembahe
Email: [email protected]
Published by:
Department of Energy
Private Bag X96
Pretoria
0001
Tel: (012) 406-7819/012 406 7540
192 Visagie Street, C/o Paul Kruger & Visagie Street, Pretoria, 0001
Website: http://www.energy.gov.za
DEPARTMENT OF ENERGY
Acting Director-General Dr. W. Barnard
ENERGY POLICY AND PLANNING BRANCH
Deputy Director-General Mr. O. Aphane
ENERGY PLANNING CHIEF DIRECTORATE
Chief Director: Ms. T. Ramuedzisi
ENERGY DATA COLLECTION, MANAGEME NT AND ANALYSIS DIRECTORATE
Director Ms. V. Olifant
THIS, THE FIRST EDITION, PUBLISHED IN 2015.
ISBN: COPYRIGHT RESERVED

DISCLAIMER
WHEREAS THE GREATEST CARE HAS BEEN TAKEN IN THE COMPILATION OF
THIS PUBLICATION, THE DEPARTMENT OF ENERGY RELIES ON DATA
PROVIDED BY VARIOUS SOURCES AND DOES NOT HOLD ITSELF
RESPONSIBLE FOR ANY ERRORS OR OMISSIONS EMANATING AS A
CONSEQUENCE OF PROVISION OF INACCURATE, INCORRECT OR
INCOMPLETE DATA FROM SUCH SOURCES.
i
FOREWORD
It gives me great pleasure to introduce the report: Overview of petrol and diesel
market in South Africa between 2002 and 2013. This report is based on information
collated from government departments, petroleum industry and research papers.
This publication covers a broad overview and analysis of the South African petrol
and diesel industry and aims to keep stakeholders informed about developments as
well as key issues affecting the industry.
The publication presents the industry in a format which provides an overview of
South Africa’s petrol and diesel market between 2002 and 2013. This includes
sources and the overall petrol and diesel market dynamics as well as the relationship
between the two petroleum products. In order to clearly present and analyse the
consumption trends, this report is further divided into national and provincial market
analysis.
The Department of Energy is working hard to ensure accurate, timely and reliable
provision of data in its publications and hopes that this report will become a source of
reference among energy analysts in South Africa and abroad.
I extend my most sincere thanks and appreciation to the Energy Data Collection,
Management and Analysis Directorate for the hard work that went into the
compilation of this publication. I would also like to record my appreciation to all the
energy data providers who have helped us to accomplish the compilation of this
report. Comments and inputs are welcome and could be addressed to
Dr. W. Barnard
Acting Director General
Department of Energy
ii
TABLE OF CONTENTS
CONTENTS PAGES
FOREWORD ............................................................................................................... i
TABLE OF CONTENTS .............................................................................................. ii
LIST OF FIGURES ..................................................................................................... iii
1. INTRODUCTION .............................................................................................. 1
2. OVERVIEW OF THE FUEL MARKET IN SOUTH AFRICA .............................. 1
3. NATIONAL PETROL AND DIESEL MARKET TRENDS .................................. 5
3.1. Consumption per product type ...................................................................... 5
3.2. Petrol and Diesel consumption per trade sector............................................ 6
3.3. Petrol and diesel consumption per grade ...................................................... 7
4. PROVINCIAL PETROL AND DIESEL MARKET TRENDS ............................... 9
4.1. Petrol consumption per province ................................................................... 9
4.2. Diesel consumption per province ................................................................ 10
4.3. Provincial petrol and diesel consumption per trade sector .......................... 11
4.4. Provincial petrol and diesel consumption per grade .................................... 20
5. LEGISLATION AND REGULATION GOVERNING THE PETROLEUM
INDUSTRY ............................................................................................................... 26
6. OUTLOOK ...................................................................................................... 28
7. CONCLUSION ............................................................................................... 30
8. REFERENCES ............................................................................................... 32
iii
LIST OF FIGURES Figure 1: Supply and demand of petrol and diesel, 2002 - 2003 ................................ 2
Figure 2: Total number of new vehicle sales in South Africa, 2002 - 2013 ................. 3
Figure 3: Petrol and diesel prices, 2002 - 2013 .......................................................... 4
Figure 4: Petrol and diesel consumption, 2002 - 2013 ............................................... 5
Figure 5: Petrol and diesel consumption in the retail sector, 2002 - 2013 .................. 6
Figure 6: Petrol and diesel sales volumes in the commercial sector, 2002- 2013 ...... 7
Figure 7: Consumption per grade of diesel, 2002 - 2013 ........................................... 8
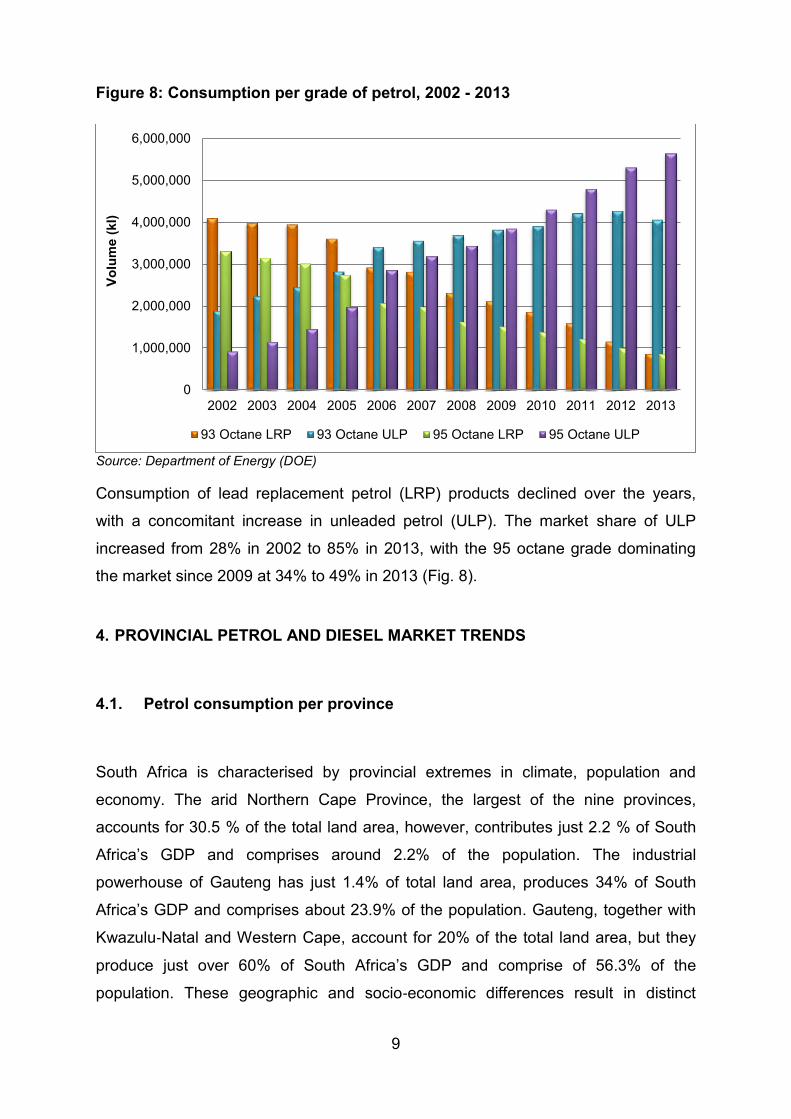
Figure 8: Consumption per grade of petrol, 2002 - 2013 ............................................ 9
Figure 9: Petrol sales volumes per province, 2002 - 2013 ....................................... 10
Figure 10: Diesel sales volumes per province, 2002 - 2013 ..................................... 11
Figure 11: Petrol and diesel consumption per trade sector in Eastern Cape, 2002 -
2013 ......................................................................................................................... 12
Figure 12: Petrol and diesel consumption per trade sector in Free States ............... 13
Figure 13: Petrol and diesel consumption per trade sector in Gauteng, 2002 - 2013
................................................................................................................................. 14
Figure 14: Petrol and diesel consumption per trade sector in Kwa-Zulu Natal, 2002 -
2013 ......................................................................................................................... 15
Figure 15: Petrol and diesel consumption per trade sector in Limpopo, 2002 - 2013
................................................................................................................................. 16
Figure 16: Petrol and diesel consumption per trade sector in Mpumalanga, 2002 -
2013 ......................................................................................................................... 17
Figure 17: Petrol and diesel consumption per trade sector in Northern Cape, 2002 -
2013 ......................................................................................................................... 18
Figure 18: Petrol and diesel consumption per trade sector in North West, 2002 -
2013 ......................................................................................................................... 19
Figure 19: Petrol and diesel consumption per trade sector in Western Cape, 2002 -
2013 ......................................................................................................................... 20
Figure 20: 93 Unleaded Petrol (ULP) consumption per province, 2002 – 2013 ....... 21
Figure 21: 95 Unleaded Petrol (ULP) consumption per province, 2002 - 2013 ........ 22
Figure 22: 93 Lead Replacement Petrol (LRP) consumption per province, 2002 -
2013 ......................................................................................................................... 23
Figure 23: 95 Lead Replacement Petrol (LRP) consumption per province, 2002 -
2013 ......................................................................................................................... 24

iv
Figure 24: 3 000 ppm sulphur diesel consumption per province, 2002 - 2013 ......... 24
Figure 25: 500 ppm sulphur diesel consumption per province, 2002 - 2013 ............ 25
Figure 26: 50 ppm sulphur diesel consumption per province, 2002 - 2013 .............. 26

v
ABBREVIATIONS AND ACRONYMS
BFP – Basic Fuel Price
CIF – Cost, Insurance and Freight
CPI – Consumer Price Index
CTL _ Coal-to-liquid
DME – Department of Minerals and Energy
DoE – Department of Energy
FOB _ Free on Board
FOR _ Free on Road
GDP _ Gross Domestic Product
GTL _ Gas-to-liquid
IBLC – In-Bond-Landed-Cost
IEA – International Energy Agency
LPG – Liquefied Petroleum Gas
LRP – Lead Replacement Petrol
NERSA – National Energy Regulator of South Africa
OECD – The Organisation for Economic Co-operation and Development OPEC – Organization of the Petroleum Exporting Countries
PPM – Parts per million
StatsSA – Statistics South Africa
ULP – Unleaded Petrol
USD – United States Dollar

1
1. INTRODUCTION
Oil is the main resource that fuels the world economy. It provides one third of global
primary energy supply and supplies approximately 95% of the energy powering the
global transport systems in the form of petroleum fuels. Similarly, South Africa‘s
transport system depends on petroleum fuels for almost all of its energy needs, with
more than 80% of the petroleum fuels consumption made up of petrol and diesel.
Over the years, the South African petroleum fuels sector has evolved in line with
global trends. This evolution has been influenced primarily by environmental
challenges and geopolitical uncertainties, status of the socio-economics,
international trade as well as changes in vehicle technology. Accordingly, the
objective of this report is to assess developments in South Africa’s petrol and diesel
industry from 2002 to 2013 and how the industry was affected by these different
factors.
The report starts off by presenting an overview of South Africa’s fuel market, which
includes sources and the overall petrol and diesel market dynamics as well as the
relationship between the two fuel products. Also included in the overview is a brief
discussion on the influence of the transport sector on the fuel market and a
discussion on prices. The report also covers the market analysis on both national
and provincial levels, which include analysis on supply and demand. A summary on
the regulations which have an impact on the sector are included towards the end of
the report, followed by the outlook of the market and a conclusion, which
summarises the findings of the report.
2. OVERVIEW OF THE FUEL MARKET IN SOUTH AFRICA
South Africa has small amounts of proved crude oil reserves, and the country's crude
oil production is very small. As a result, the country relies on imports of crude oil and
refined fuels to meet its liquid fuels needs. In 2013, crude oil imports were mostly
from OPEC countries, with about half imported from Saudi Arabia followed by
Nigeria (24%), Angola (14%), Ghana (5%), and small volumes from various

2
producers (7%). Over 60% of products refined locally are produced from the
imported crude oil and about 36% of the demand is met by coal-to-liquids (CTL)
synthetic fuels as well as gas-to-liquid (GTL) synthetic fuels plus a very small amount
of domestic crude oil. South Africa has the second largest oil refining capacity in
Africa. The current total refining capacity amounts to 703 000 barrels per day, of
which 72% is allocated to crude oil refining, with the balance allocated to synthetic
fuel refining.
Domestic production of petrol and diesel was almost stagnant over the years, from
20.2 billion litres in 2002 to 19.7 billion litres in 2013, due to limited resources and
capacity constraints. However, consumption grew by 3% per year during the same
period and surpassed domestic supply in 2006. The reduction in production could be
attributed to phasing out of leaded petrol in January 2006. The excess demand was
met by imports, which grew by an average annual rate of 24% over the 12 years
period. The increase in demand was in line with growth in the country’s Gross
Domestic Product (GDP) (Fig. 1), and approximately 75% of petrol and diesel was
consumed by the transport sector. Within the transport sector itself, 98% of the
energy consumed is derived from liquid petroleum fuels.
Figure 1: Supply and demand of petrol and diesel, 2002 - 2003
Source: Supply, demand and imports - Department of Energy (DOE), GDP - South African Reserve Bank (SARB)
0
500,000
1,000,000
1,500,000
2,000,000
2,500,000
0
5,000,000
10,000,000
15,000,000
20,000,000
25,000,000
2002
2003
2004
2005
2006
2007
2008
2009
2010
2011
2012
2013
GD
P Va
lue
(R m
illio
n)
Dem
and,
sup
plya
nd im
port
s vo
lum
es
(kl)
Production Consumption Imports GDP

3
South Africa’s transport sector has developed in recent years in line with global
improvement of conventional fuels, the change in vehicle design and technology
development. This is evidenced by a decline in the market share of petrol-fuelled
vehicles sales, from 77% in 2002 to 67% in 2013, while diesel-fuelled vehicle sales
increased by 10 percentage points, reaching 33% in 2013 (Fig. 2).
Figure 2: Total number of new vehicle sales in South Africa, 2002 - 2013
Source: National Association of Automobile Manufacturers of South Africa (NAAMSA),
Consequently, petrol consumption increased steadily during the same period while
diesel consumption grew substantially and over-performed petrol consumption in
2013. These recent developments could be partly attributed to higher fuel efficiency
in diesel vehicles compared to petrol-fuelled vehicles.
0
100,000
200,000
300,000
400,000
500,000
600,000
2002 2003 2004 2005 2006 2007 2008 2009 2010 2011 2012 2013
Nun
ber o
f veh
icle
s so
ld
Petrol-fuelled Diesel-fuelled

4
Figure 3: Petrol and diesel prices, 2002 - 2013
Sources: Petrol and diesel prices - Department of Energy (DOE), Exchange rates - South African Reserve Bank (SARB), Crude oil prices - Energy Information Administration (EIA)
South Africa’s fuel prices are heavily influenced by trends in the global oil market and
are linked to the global market by the Basic Fuel Price (BFP) system which replaced
the In-Bond-Landed-Cost (IBLC) system in 2003. The BFP is determined by taking
into account the movement of international petroleum products prices as well as the
United States (US) Dollar/Rand exchange rate. The largest component of the BFP is
the price that one would be paying on international markets when physically
importing product to South Africa and it includes freight, insurance, ocean loss,
landing, wharfage, coastal storage, the financing of the coastal storage and
demurrage from refining centres in the Mediterranean, Arab Gulf and Singapore. In
turn, the BFP constitutes approximately 55% of the retail fuel price in South Africa.
0
18
36
54
72
90
108
126
0
200
400
600
800
1,000
1,200
1,400
2002
2003
2004
2005
2006
2007
2008
2009
2010
2011
2012
2013
Cru
de o
il pr
ices
(US$
/bbl
)
Petr
ol a
nd d
iese
l pric
es (c
/l) a
nd
exch
ange
rate
(ZAc
ents
/US$
))
Petrol Diesel Exchange rate Crude oil
5
3. NATIONAL PETROL AND DIESEL MARKET TRENDS
3.1. Consumption per product type
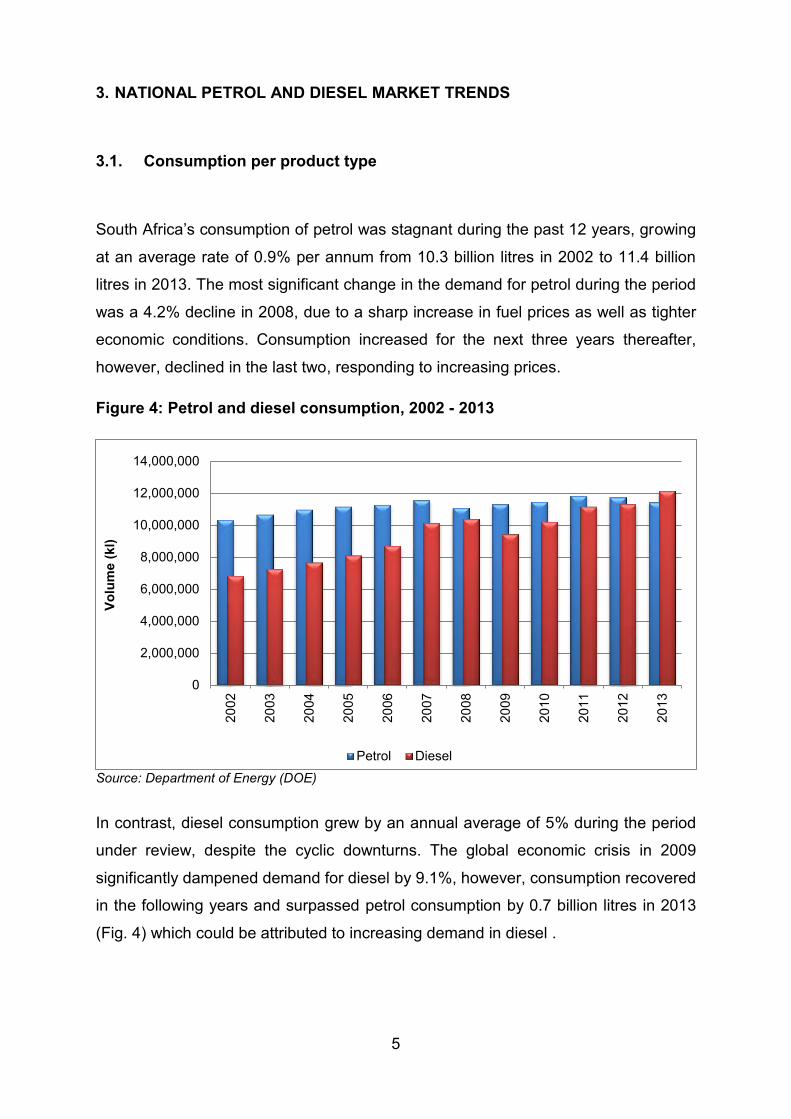
South Africa’s consumption of petrol was stagnant during the past 12 years, growing
at an average rate of 0.9% per annum from 10.3 billion litres in 2002 to 11.4 billion
litres in 2013. The most significant change in the demand for petrol during the period
was a 4.2% decline in 2008, due to a sharp increase in fuel prices as well as tighter
economic conditions. Consumption increased for the next three years thereafter,
however, declined in the last two, responding to increasing prices.
Figure 4: Petrol and diesel consumption, 2002 - 2013
Source: Department of Energy (DOE)
In contrast, diesel consumption grew by an annual average of 5% during the period
under review, despite the cyclic downturns. The global economic crisis in 2009
significantly dampened demand for diesel by 9.1%, however, consumption recovered
in the following years and surpassed petrol consumption by 0.7 billion litres in 2013
(Fig. 4) which could be attributed to increasing demand in diesel .
0
2,000,000
4,000,000
6,000,000
8,000,000
10,000,000
12,000,000
14,000,000
2002
2003
2004
2005
2006
2007
2008
2009
2010
2011
2012
2013
Volu
me
(kl)
Petrol Diesel

6
3.2. Petrol and Diesel consumption per trade sector
3.2.1. Retail
South Africa’s retail fuel industry, which is made up of approximately 5 000 retailers
countrywide, accounted for most of the petrol used. However, the petrol consumption
trend in this sector was stationary and its market share declined from 93% in 2002 to
85% in 2013. Petrol sales volumes peaked at 10.6 billion litres in 2007 due to high
demand, but soon declined by 3.6% in 2008, as a result of an increase in crude oil
prices and the economic crisis. The drop in prices during the economic crisis saw a
recovery in the retail sales volumes during 2009 and 2010; however, consumption
volumes have since declined due to escalating prices (Fig. 5). The increase in the
sale of diesel passenger vehicles resulted in an upward trend in diesel consumption
in the retail sector. Diesel consumption increased at an average of 7% per annum,
from 1.7 billion litres to 3.9 billion litres between 2002 and 2013.
Figure 5: Petrol and diesel consumption in the retail sector, 2002 - 2013
Source: Department of Energy (DOE)
0
2,000,000
4,000,000
6,000,000
8,000,000
10,000,000
12,000,000
2002
2003
2004
2005
2006
2007
2008
2009
2010
2011
2012
2013
Volu
me
(kl)
Petrol Diesel

7
3.2.2. Commercial
Most of the diesel consumed in the country was in the commercial sector, and grew
by an annual average of 4.2%, from 5.1 billion litres in 2002 to 8.2 billion litres in
2013. The commercial operators use their own storage and dispensing facilities for
refuelling vehicles and use diesel for stationary engines, such as small boilers and
generators as well as for heavy machinery for production purposes. Therefore, the
increase in the diesel demand from the commercial sector was mainly driven by
strong economic growth. The average annual consumption of petrol in the
commercial markets grew at an average rate of 7.3% per year, from 681 million litres
in 2002 to 1.7 billion in 2013 (Fig. 6).
Figure 6: Petrol and diesel sales volumes in the commercial sector, 2002- 2013
Source: Department of Energy (DOE)
3.3. Petrol and diesel consumption per grade
Petrol and diesel specifications were first regulated in 2006 in South Africa following
the phase-out of lead, the introduction of benzene and aromatics specifications and
the reduction of sulphur in diesel, to reduce vehicle emissions. Diesel sulphur was
reduced from 3 000 parts per million (ppm) (0.3%) to a standard grade of 500 ppm
(0.05%) maximum sulphur content, and is also available in a lower sulphur grade of
50 ppm (0.005%) maximum sulphur.
0
1,500,000
3,000,000
4,500,000
6,000,000
7,500,000
9,000,000
2002
2003
2004
2005
2006
2007
2008
2009
2010
2011
2012
2013
Volu
me
(kl)
Petrol Diesel

8
Consumption of diesel with a maximum sulphur content of 3 000 ppm, declined
drastically after the promulgation of the regulations in 2006, while the consumption of
the standard grade increased at an average rate of 44.6% per year (Fig. 7).
Figure 7: Consumption per grade of diesel, 2002 - 2013
Source: Department of Energy (DOE)
The 50 ppm maximum sulphur grade was introduced in the market in 2006 and its
consumption has since grown by 45.7% per annum, from 11.6 million litres in 2006
to 2.4 billion litres in 2013. The 50 ppm grade was specifically introduced to
accommodate the increasing number of new technology diesel vehicles entering the
South African market. These vehicles are designed to operate on cleaner diesel fuel
specification, which has a maximum sulphur level of 50 ppm. The lower sulphur
diesel is also produced to accommodate new technology particle filter equipped
vehicles which may only use diesel fuel with a sulphur level not exceeding 50 ppm.
Emission-reduction enabling fuels have been available in South Africa since 1996,
when unleaded petrol was introduced; however, new vehicle emissions have only
been controlled for all new vehicle sales since the beginning of 2008.
0
2,000,000
4,000,000
6,000,000
8,000,000
10,000,000
12,000,000
2002 2003 2004 2005 2006 2007 2008 2009 2010 2011 2012 2013
Volu
me
(kl)
Diesel 0,05% S Diesel 0,005% S Diesel 0,3% S
9
Figure 8: Consumption per grade of petrol, 2002 - 2013
Source: Department of Energy (DOE) Consumption of lead replacement petrol (LRP) products declined over the years,
with a concomitant increase in unleaded petrol (ULP). The market share of ULP
increased from 28% in 2002 to 85% in 2013, with the 95 octane grade dominating
the market since 2009 at 34% to 49% in 2013 (Fig. 8).
4. PROVINCIAL PETROL AND DIESEL MARKET TRENDS
4.1. Petrol consumption per province
South Africa is characterised by provincial extremes in climate, population and
economy. The arid Northern Cape Province, the largest of the nine provinces,
accounts for 30.5 % of the total land area, however, contributes just 2.2 % of South
Africa’s GDP and comprises around 2.2% of the population. The industrial
powerhouse of Gauteng has just 1.4% of total land area, produces 34% of South
Africa’s GDP and comprises about 23.9% of the population. Gauteng, together with
Kwazulu‐Natal and Western Cape, account for 20% of the total land area, but they
produce just over 60% of South Africa’s GDP and comprise of 56.3% of the
population. These geographic and socio‐economic differences result in distinct
0
1,000,000
2,000,000
3,000,000
4,000,000
5,000,000
6,000,000
2002 2003 2004 2005 2006 2007 2008 2009 2010 2011 2012 2013
Volu
me
(kl)
93 Octane LRP 93 Octane ULP 95 Octane LRP 95 Octane ULP
10
nodes of high transport demand and high traffic volumes that are spatially remote
from each other within South Africa.
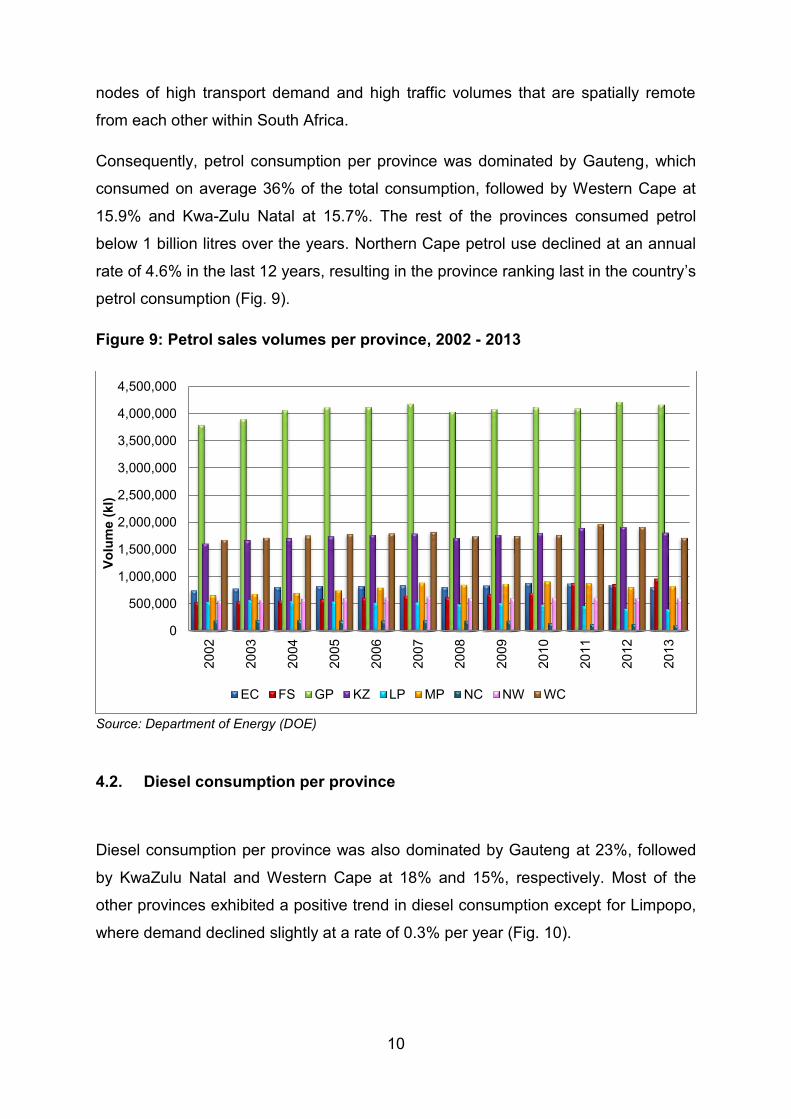
Consequently, petrol consumption per province was dominated by Gauteng, which
consumed on average 36% of the total consumption, followed by Western Cape at
15.9% and Kwa-Zulu Natal at 15.7%. The rest of the provinces consumed petrol
below 1 billion litres over the years. Northern Cape petrol use declined at an annual
rate of 4.6% in the last 12 years, resulting in the province ranking last in the country’s
petrol consumption (Fig. 9).
Figure 9: Petrol sales volumes per province, 2002 - 2013
Source: Department of Energy (DOE)
4.2. Diesel consumption per province
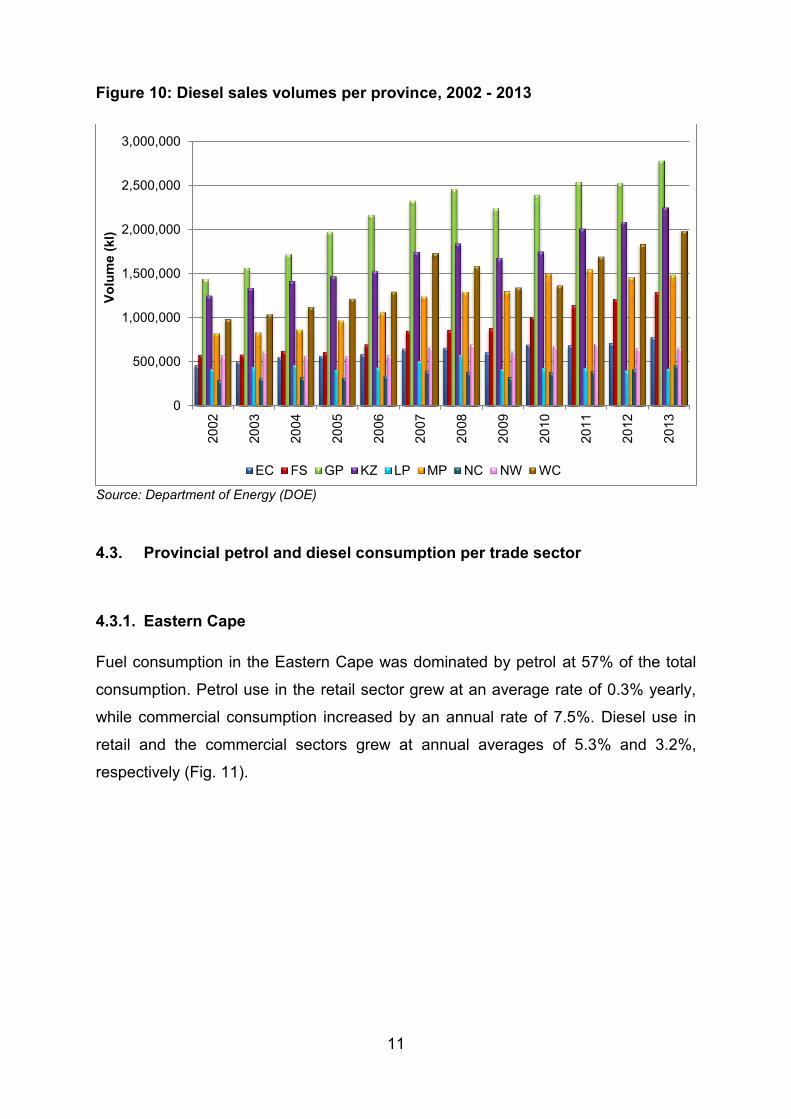
Diesel consumption per province was also dominated by Gauteng at 23%, followed
by KwaZulu Natal and Western Cape at 18% and 15%, respectively. Most of the
other provinces exhibited a positive trend in diesel consumption except for Limpopo,
where demand declined slightly at a rate of 0.3% per year (Fig. 10).
0
500,000
1,000,000
1,500,000
2,000,000
2,500,000
3,000,000
3,500,000
4,000,000
4,500,000
2002
2003
2004
2005
2006
2007
2008
2009
2010
2011
2012
2013
Volu
me
(kl)
EC FS GP KZ LP MP NC NW WC
11
Figure 10: Diesel sales volumes per province, 2002 - 2013
Source: Department of Energy (DOE)
4.3. Provincial petrol and diesel consumption per trade sector
4.3.1. Eastern Cape
Fuel consumption in the Eastern Cape was dominated by petrol at 57% of the total
consumption. Petrol use in the retail sector grew at an average rate of 0.3% yearly,
while commercial consumption increased by an annual rate of 7.5%. Diesel use in
retail and the commercial sectors grew at annual averages of 5.3% and 3.2%,
respectively (Fig. 11).
0
500,000
1,000,000
1,500,000
2,000,000
2,500,000
3,000,000
2002
2003
2004
2005
2006
2007
2008
2009
2010
2011
2012
2013
Volu
me
(kl)
EC FS GP KZ LP MP NC NW WC

12
Figure 11: Petrol and diesel consumption per trade sector in Eastern Cape, 2002 - 2013
Source: Department of Energy (DOE)
4.3.2. Free State
In Free States, diesel accounted for majority of the fuel demanded at an average of
55% of total consumption over 12 years. Diesel consumption in the commercial
sector grew at an annual rate of 8.8% due to higher mining and agricultural activities,
while demand in the retail sector increased annually by 5.6%. Petrol consumption in
the retail sector was stable during the study period and it was overtaken by the
commercial use of petrol in 2013, which grew at an annual rate of 24.6% (Fig. 12).
0
150,000
300,000
450,000
600,000
750,000
900,000
2002 2003 2004 2005 2006 2007 2008 2009 2010 2011 2012 2013
Volu
me
(kl)
Petrol- Retail Petrol-Commercial Diesel-Commercial Diesel-Retail

13
Figure 12: Petrol and diesel consumption per trade sector in Free State
Source: Department of Energy (DOE)
4.3.3. Gauteng
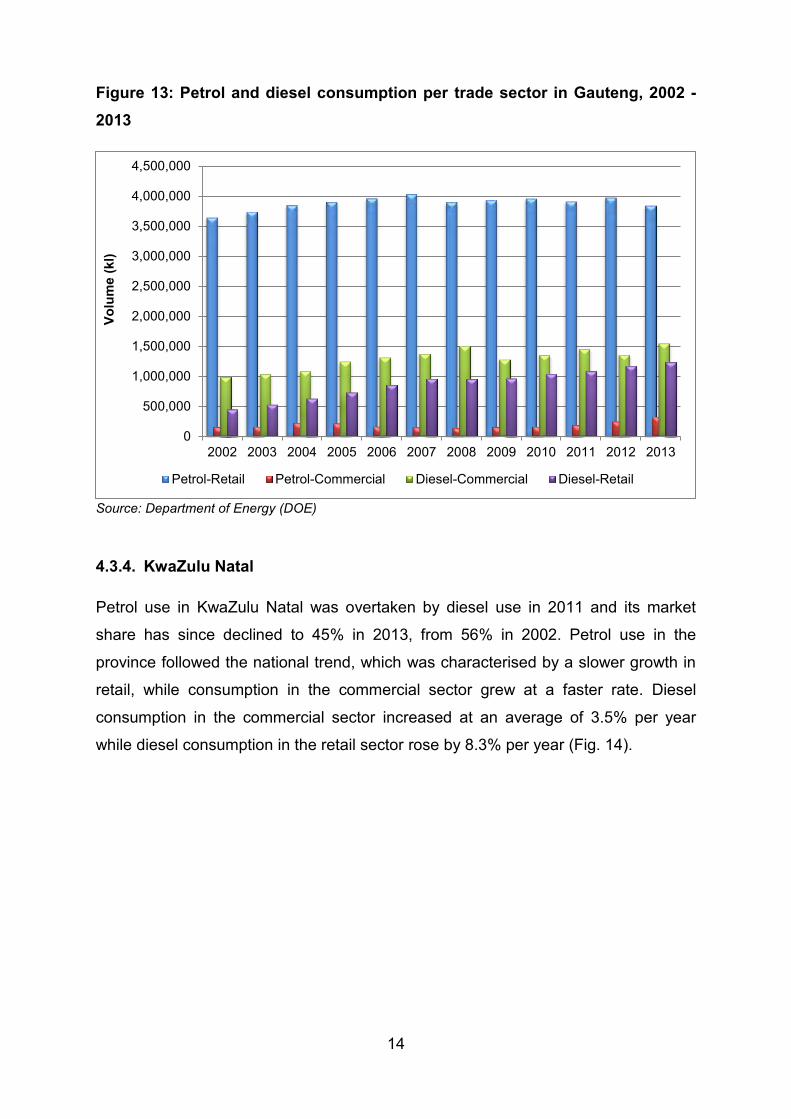
Fuel consumption in Gauteng was dominated by petrol throughout the years, despite
a drop in its market share from 73% in 2002 to 60% in 2013. Petrol and diesel retail
consumption in the province grew above the national average, however, it under-
performed in the commercial sector. Petrol consumption in the retail sector grew at
an average annual rate 0.4% from 3.6 billion litres in 2002 to 3.8 billion litres in 2013,
while diesel consumption increased by an average annual rate of 8.4% in the same
sector. The commercial sector was dominated by diesel consumption which grew by
an average of 3.4% per year, while petrol consumption grew by 3.2% per year (Fig.
13).
0
200,000
400,000
600,000
800,000
1,000,000
1,200,000
2002 2003 2004 2005 2006 2007 2008 2009 2010 2011 2012 2013
Volu
me
(kl)
Petrol-Retail Petrol-Commercial Diesel-Commercial Diesel-Retail
14
Figure 13: Petrol and diesel consumption per trade sector in Gauteng, 2002 - 2013
Source: Department of Energy (DOE)
4.3.4. KwaZulu Natal
Petrol use in KwaZulu Natal was overtaken by diesel use in 2011 and its market
share has since declined to 45% in 2013, from 56% in 2002. Petrol use in the
province followed the national trend, which was characterised by a slower growth in
retail, while consumption in the commercial sector grew at a faster rate. Diesel
consumption in the commercial sector increased at an average of 3.5% per year
while diesel consumption in the retail sector rose by 8.3% per year (Fig. 14).
0
500,000
1,000,000
1,500,000
2,000,000
2,500,000
3,000,000
3,500,000
4,000,000
4,500,000
2002 2003 2004 2005 2006 2007 2008 2009 2010 2011 2012 2013
Volu
me
(kl)
Petrol-Retail Petrol-Commercial Diesel-Commercial Diesel-Retail

15
Figure 14: Petrol and diesel consumption per trade sector in KwaZulu Natal, 2002 - 2013
Source: Department of Energy (DOE)
4.3.5. Limpopo
Petrol dominated fuel consumption at an average of 53% in Limpopo, until its market
share fell to 49% in 2013 in favour of diesel use. Petrol consumption decreased
slightly by 0.4% per annum in the retail sector while the commercial use declined
drastically at 15.6% per annum. Diesel consumption in the commercial sector
declined at an average annual rate of 3.1% while consumption in the retail sector
increased by 6.3%, on average (Fig. 15).
0
200,000
400,000
600,000
800,000
1,000,000
1,200,000
1,400,000
1,600,000
1,800,000
2002 2003 2004 2005 2006 2007 2008 2009 2010 2011 2012 2013
Volu
me
(kl)
Petrol-Retail Petrol-Commercial Diesel-Commercial Diesel-Retail

16
Figure 15: Petrol and diesel consumption per trade sector in Limpopo, 2002 - 2013
Source: Department of Energy (DOE)
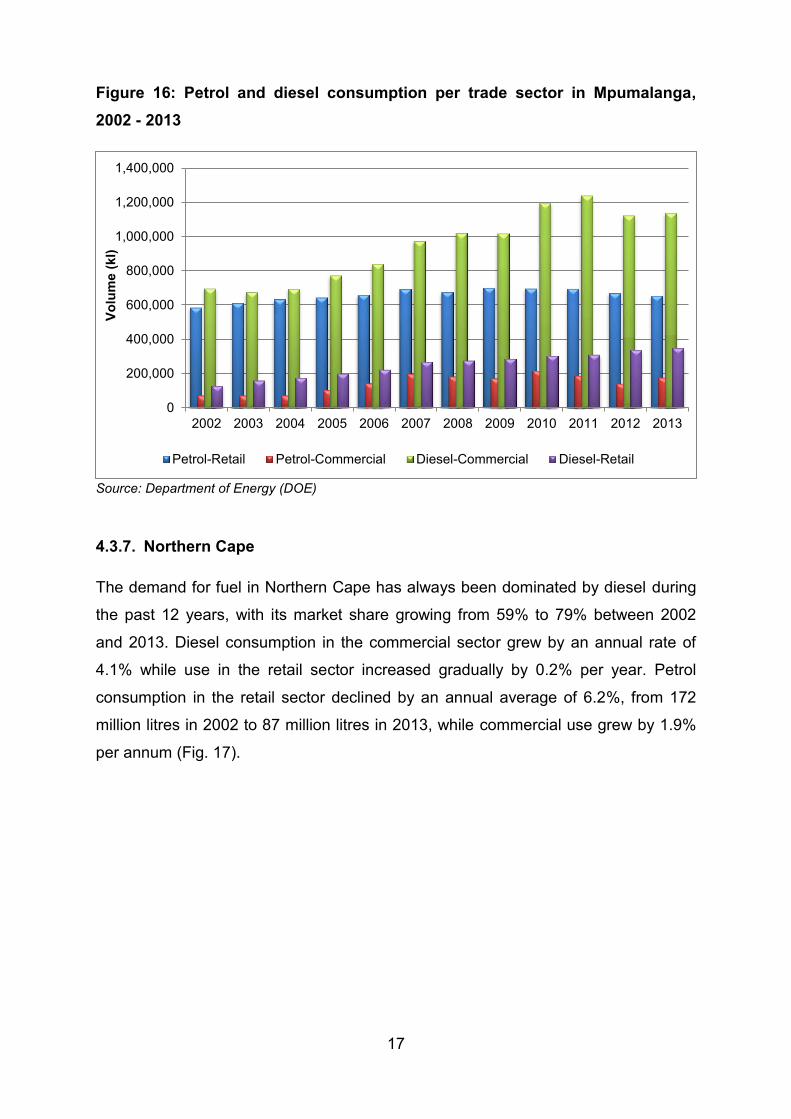
4.3.6. Mpumalanga
Diesel consumption in Mpumalanga grew substantially by 5.9% and 8.6% in the
commercial and retail sector, respectively, from 2002 to 2013. As a result, diesel use
averaged at 59% of the total fuel consumption in the province despite petrol
consumption growing above the national growth rate in both retail and commercial
sectors. In retail, petrol use increased by 1.1% per annum, while consumption in the
commercial sector grew by an annual rate of 9.3% during the study period (Fig. 16).
0
50,000
100,000
150,000
200,000
250,000
300,000
350,000
400,000
450,000
500,000
2002 2003 2004 2005 2006 2007 2008 2009 2010 2011 2012 2013
Volu
me
(kl)
Petrol-Retail Petrol-Commercial Diesel-Commercial Diesel-Retail
17
Figure 16: Petrol and diesel consumption per trade sector in Mpumalanga, 2002 - 2013
Source: Department of Energy (DOE)
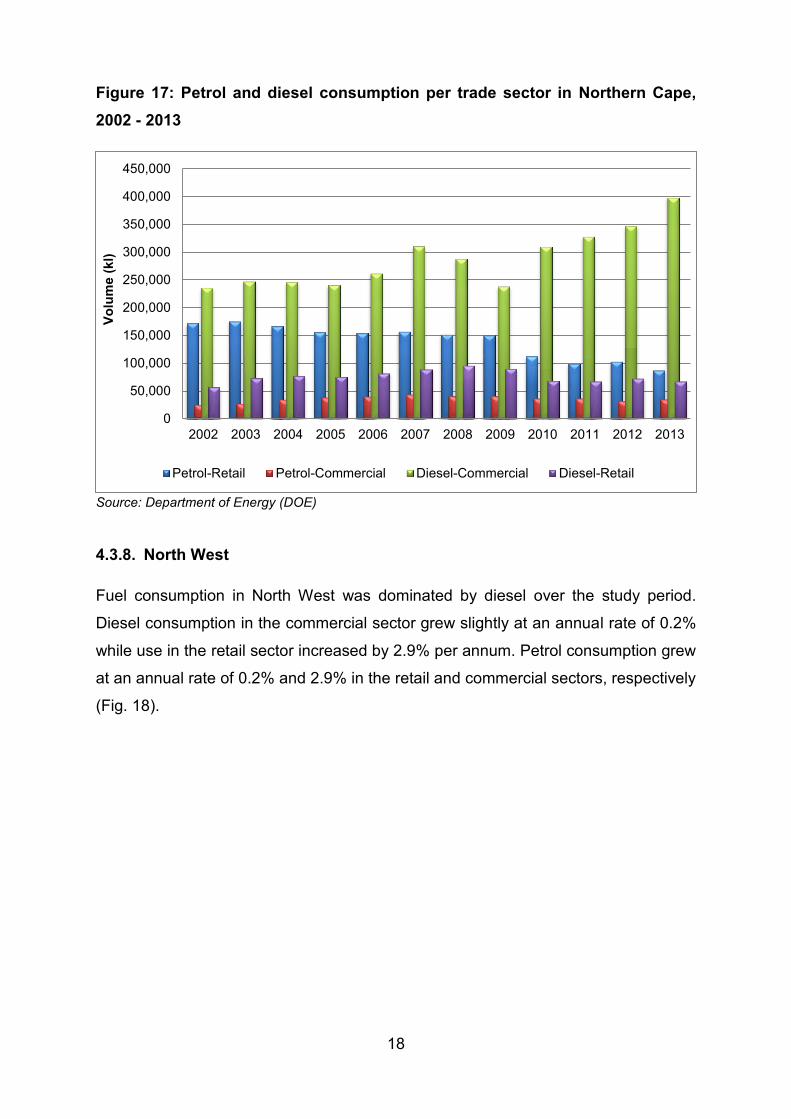
4.3.7. Northern Cape
The demand for fuel in Northern Cape has always been dominated by diesel during
the past 12 years, with its market share growing from 59% to 79% between 2002
and 2013. Diesel consumption in the commercial sector grew by an annual rate of
4.1% while use in the retail sector increased gradually by 0.2% per year. Petrol
consumption in the retail sector declined by an annual average of 6.2%, from 172
million litres in 2002 to 87 million litres in 2013, while commercial use grew by 1.9%
per annum (Fig. 17).
0
200,000
400,000
600,000
800,000
1,000,000
1,200,000
1,400,000
2002 2003 2004 2005 2006 2007 2008 2009 2010 2011 2012 2013
Volu
me
(kl)
Petrol-Retail Petrol-Commercial Diesel-Commercial Diesel-Retail
18
Figure 17: Petrol and diesel consumption per trade sector in Northern Cape, 2002 - 2013
Source: Department of Energy (DOE)
4.3.8. North West
Fuel consumption in North West was dominated by diesel over the study period.
Diesel consumption in the commercial sector grew slightly at an annual rate of 0.2%
while use in the retail sector increased by 2.9% per annum. Petrol consumption grew
at an annual rate of 0.2% and 2.9% in the retail and commercial sectors, respectively
(Fig. 18).
0
50,000
100,000
150,000
200,000
250,000
300,000
350,000
400,000
450,000
2002 2003 2004 2005 2006 2007 2008 2009 2010 2011 2012 2013
Volu
me
(kl)
Petrol-Retail Petrol-Commercial Diesel-Commercial Diesel-Retail

19
Figure 18: Petrol and diesel consumption per trade sector in North West, 2002 - 2013
Source: Department of Energy (DOE) 4.3.9. Western Cape
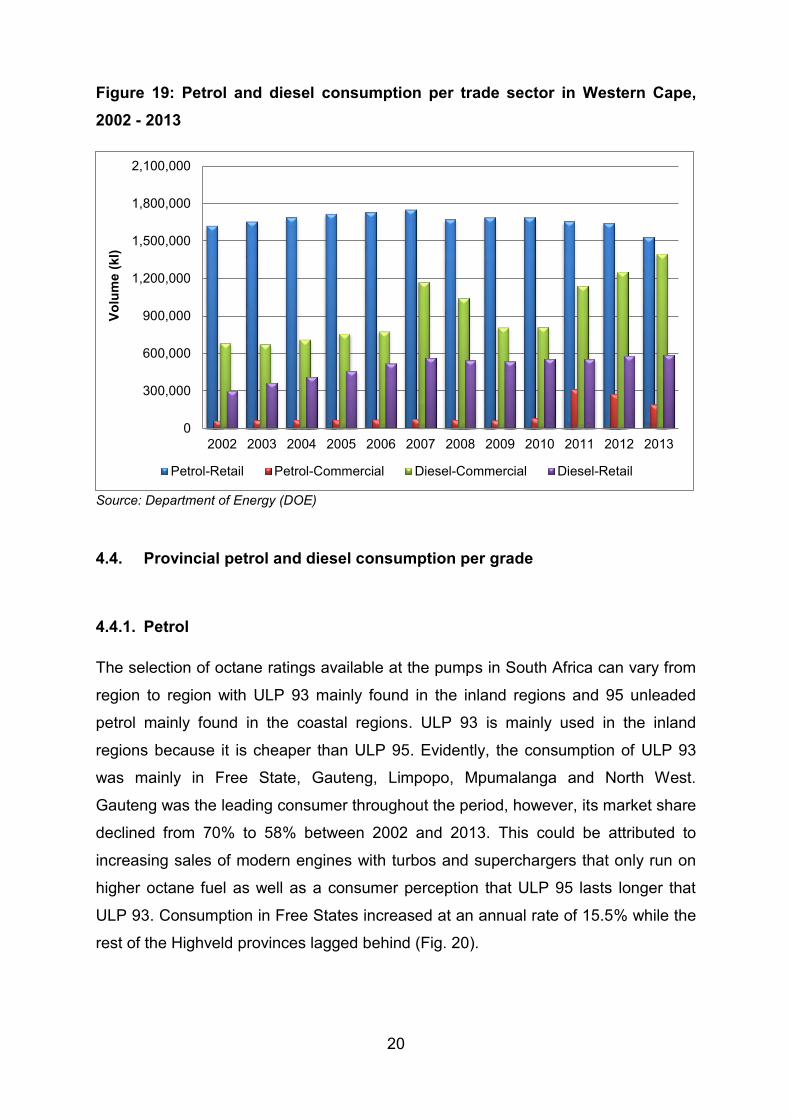
Fuel consumption in Western Cape was dominated by petrol at the beginning of the
study period, but over the years, petrol use declined and diesel eventually dominated
the market with a share of 54% in 2013. Petrol consumption in the province declined
by an annual rate of 0.4% in the retail sector and increased by 12.7% in the
commercial sector. Diesel consumption in the commercial sector had a growth rate
of 6% while the use of diesel in the retail sector grew by 5.1%, annually (Fig. 19).
0
100,000
200,000
300,000
400,000
500,000
600,000
2002 2003 2004 2005 2006 2007 2008 2009 2010 2011 2012 2013
Volu
me
(kl)
Petrol-Retail Petrol-Commercial Diesel-Commercial Diesel-Retail
20
Figure 19: Petrol and diesel consumption per trade sector in Western Cape, 2002 - 2013
Source: Department of Energy (DOE)
4.4. Provincial petrol and diesel consumption per grade
4.4.1. Petrol
The selection of octane ratings available at the pumps in South Africa can vary from
region to region with ULP 93 mainly found in the inland regions and 95 unleaded
petrol mainly found in the coastal regions. ULP 93 is mainly used in the inland
regions because it is cheaper than ULP 95. Evidently, the consumption of ULP 93
was mainly in Free State, Gauteng, Limpopo, Mpumalanga and North West.
Gauteng was the leading consumer throughout the period, however, its market share
declined from 70% to 58% between 2002 and 2013. This could be attributed to
increasing sales of modern engines with turbos and superchargers that only run on
higher octane fuel as well as a consumer perception that ULP 95 lasts longer that
ULP 93. Consumption in Free States increased at an annual rate of 15.5% while the
rest of the Highveld provinces lagged behind (Fig. 20).
0
300,000
600,000
900,000
1,200,000
1,500,000
1,800,000
2,100,000
2002 2003 2004 2005 2006 2007 2008 2009 2010 2011 2012 2013
Volu
me
(kl)
Petrol-Retail Petrol-Commercial Diesel-Commercial Diesel-Retail

21
Figure 20: 93 Unleaded Petrol (ULP) consumption per province, 2002 – 2013
Source: Department of Energy (DOE)
South Africa’s provinces along the coast predominantly demand higher octane fuel.
According to the Automobile Association of South Africa (AA), the higher demand of
ULP 95 in the coastal areas is mainly because of the lower altitude which is more
suitable for the use of high octane fuel. From the beginning of 2006, ULP 95 was
made available in the inland regions. However, a Demand Side Management Levy
(DSML) is charged on ULP 95 sold in the inland area. This levy was implemented
into the price structure of ULP 95 in January 2006 when this grade was introduced
into the inland market for the first time. Most vehicles in the inland market are not
required to run on ULP 95 and the unnecessary use thereof in the inland area could
0
100,000
200,000
300,000
400,000
500,000
600,000
700,000
800,000
2002 2003 2004 2005 2006 2007 2008 2009 2010 2011 2012 2013
Volu
me
(kl)
EC FS KZ LP MP NC NW WC
0
500,000
1,000,000
1,500,000
2,000,000
2,500,000
3,000,000
2002 2003 2004 2005 2006 2007 2008 2009 2010 2011 2012 2013
Volu
me
(kl)
GP

22
result in "octane waste" with negative economic consequences. A DSML was
introduced to curtail the demand thereof in the inland area.
There seems to be minimal or no impact of the DSML as Gauteng’s consumption of
ULP 95 grew at 70.9% per year, from 1.4 million litres to 1.3 billion litres between
2002 and 2013. The rest of the inland regions followed a positive trend, with North
West growing at a rate of 94.3% while the rest increased by approximately 20%,
annually. However, the coastal regions continued to dominate the consumption of
the ULP 95 throughout the period, with the Western Cape and Kwa-Zulu Natal
growing annually by 11.3% and 14.4%, respectively (Fig. 21).
Figure 21: 95 Unleaded Petrol (ULP) consumption per province, 2002 - 2013
Source: Department of Energy (DOE)
Leaded petrol was first introduced in the 1920s, but in recent years there has been a
move away from this petrol grade. This is due to leaded petrol being a main
contributor to urban pollution and a health risk, particularly for young children. Lead
replacement motorists still have the choice of two grades of petrol, although the
octane grades differ between the coast and high-altitude inland stations. Premium, or
super, was replaced with the new Lead Replacement Petrol (LRP), with an octane
grade of 95 at the coast and 93 inland. The use of LRP 93 octane in Gauteng
declined by 14.5% from 2.5 billion litres in 2002 to 470 million litres in 2013. The rest
of the provinces followed a similar trend as old technology cars that required leaded
petrol are being phased out (Fig. 22).
0
200,000
400,000
600,000
800,000
1,000,000
1,200,000
1,400,000
1,600,000
2002 2003 2004 2005 2006 2007 2008 2009 2010 2011 2012 2013
Volu
me
(kl)
EC FS GP KZ LP MP NC NW WC

23
Figure 22: 93 Lead Replacement Petrol (LRP) consumption per province, 2002 - 2013
Source: Department of Energy (DOE)
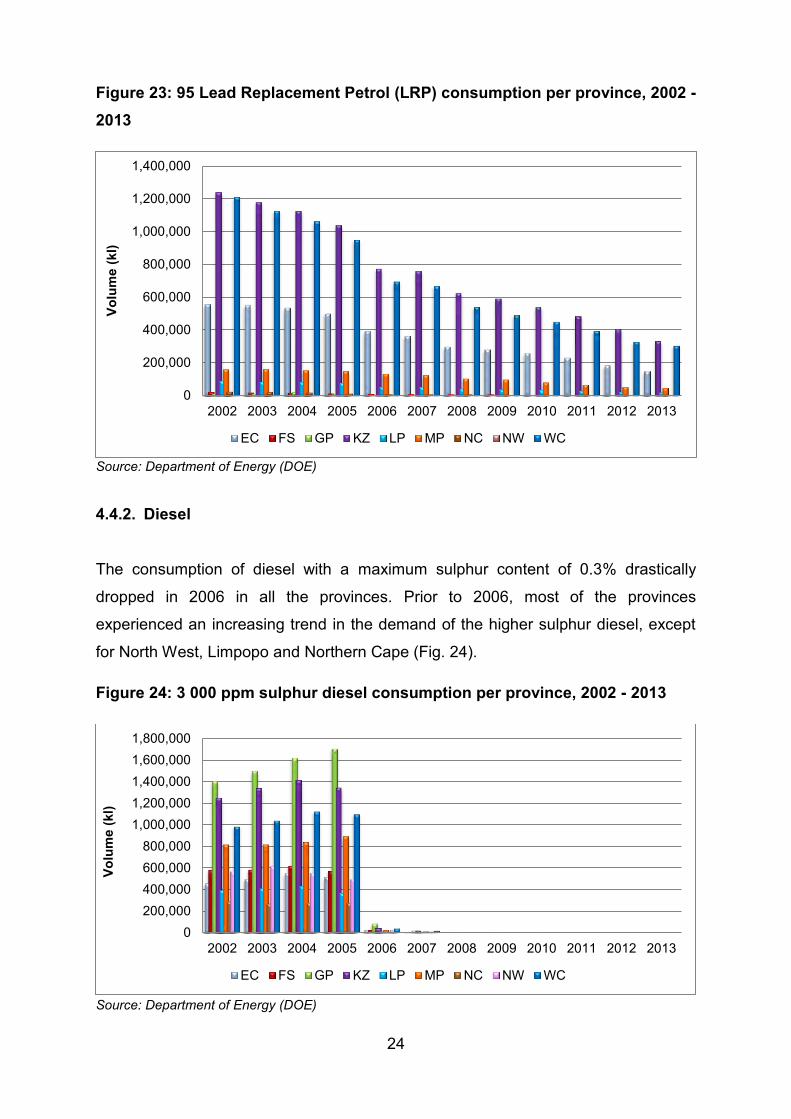
The LRP 95 grade, which was mostly demanded in the coastal regions, declined in
the past 12 years. The use of the LRP 95 declined by 12% per year in both Kwa-Zulu
Natal and Eastern Cape and declined by 13.4% in the Western Cape. Inland,
Mpumalanga led consumption of the LRP grade, but the demand dropped annually
by 12%. Limpopo was another significant consumer inland, and similarly, demand
declined by 14.6% over the years (Fig. 23).
0
500,000
1,000,000
1,500,000
2,000,000
2,500,000
3,000,000
2002 2003 2004 2005 2006 2007 2008 2009 2010 2011 2012 2013
Volu
me
(kl)
EC FS GP KZ LP MP NC NW WC
24
Figure 23: 95 Lead Replacement Petrol (LRP) consumption per province, 2002 - 2013
Source: Department of Energy (DOE)
4.4.2. Diesel
The consumption of diesel with a maximum sulphur content of 0.3% drastically
dropped in 2006 in all the provinces. Prior to 2006, most of the provinces
experienced an increasing trend in the demand of the higher sulphur diesel, except
for North West, Limpopo and Northern Cape (Fig. 24).
Figure 24: 3 000 ppm sulphur diesel consumption per province, 2002 - 2013
Source: Department of Energy (DOE)
0
200,000
400,000
600,000
800,000
1,000,000
1,200,000
1,400,000
2002 2003 2004 2005 2006 2007 2008 2009 2010 2011 2012 2013
Volu
me
(kl)
EC FS GP KZ LP MP NC NW WC
0200,000400,000600,000800,000
1,000,0001,200,0001,400,0001,600,0001,800,000
2002 2003 2004 2005 2006 2007 2008 2009 2010 2011 2012 2013
Volu
me
(kl)
EC FS GP KZ LP MP NC NW WC

25
The use of diesel with a maximum content of 0.05% escalated in 2006, replacing the
phasing out of the higher sulphur diesel. Gauteng’s consumption of the standard
grade peaked in 2008 and decreased thereafter, with a similar trend also seen for
Limpopo. The rest of the provinces showed positive growth until the end of the study
period (Fig. 25).
Figure 25: 500 ppm sulphur diesel consumption per province, 2002 - 2013
Source: Department of Energy (DOE)
The consumption of diesel with the maximum sulphur content of 0.005% was
dominated by Gauteng. The demand for diesel with the lower sulphur content in
Gauteng increased from 247 million litres to 806 million litres between 2006 and
2013, mainly due to a rise in diesel-fuelled vehicles. The rest of the provinces
experienced substantial growth, with Northern Cape taking the lead with a growth
rate of 40.5% per annum (Fig. 26).
0
500,000
1,000,000
1,500,000
2,000,000
2,500,000
2002 2003 2004 2005 2006 2007 2008 2009 2010 2011 2012 2013
Volu
me
(kl)
EC FS GP KZ LP MP NC NW WC

26
Figure 26: 50 ppm sulphur diesel consumption per province, 2002 - 2013
Source: Department of Energy (DOE)
5. LEGISLATION AND REGULATION GOVERNING THE PETROLEUM INDUSTRY
The DOE oversees the development of energy policy and implementation thereof.
Energy policy and its subsequent legislative and regulatory frameworks are the
foundation upon which the regulator and investors make decisions and consumers
make choices about which energy solution to use.
As South Africa’s economy opened up following the 1994 democratic election; the
new government reviewed and developed policies in the energy sector driven by
international trends. As a result, the White Paper on Energy Policy was developed in
1998 and it has been used as the premier policy document which guides all
subsequent policies, strategies and legislation within the energy sector. The
objectives of the White Paper are to increase access to affordable energy services,
improve energy governance, stimulate economic development, manage energy-
related environmental and health effects and secure supply through diversity.
Subsequently, in order to achieve these objectives, new policies and strategies were
developed and existing policies amended. The following are significant policies and
0
100000
200000
300000
400000
500000
600000
700000
800000
900000
2002 2003 2004 2005 2006 2007 2008 2009 2010 2011 2012 2013
Volu
me
(kl)
EC FS GP KZ LP MP NC NW WC

27
regulations pertaining to the petroleum sector post the promulgation of the White
Paper:-
Petroleum Products Amendment Act:- the Act was promulgated in 1977 but
has since undergone a number of amendments, of which the last two were
during 2003 and 2008. The objectives of the Act are for the government to
limits the number of licences allocated. The Act prohibits manufacturers and
wholesalers from holding a retail licence except for training purposes. Also, it
aims to facilitate transformation of the South Africa’s petroleum and liquid
fuels industry, ensure system for allocation of licences, prescribe offences and
penalties, provide for appeal and arbitration as well as annexure the liquid
fuels charter.
Petroleum Pipelines Act, 2003:- The Act aims to promote competition in the
construction and operation of petroleum pipelines, loading facilities and
storage facilities. It intends to promote the efficient, effective, sustainable and
orderly development, operation and use of petroleum pipelines, loading and
storage facilities. Also, the Act aims to facilitate investment in the petroleum
pipelines industry, provide for the security of petroleum pipelines and related
infrastructure as well as promote companies in the petroleum pipeline industry
that are owned or controlled by historically disadvantaged South Africans,
amongst others.
Regulations Regarding Petroleum Products Specifications and Standards for
South Africa:- The aim of the regulation is to recommend the tightening of fuel
specifications by further reducing the levels of sulphur in both petrol and
diesel as well as the reduction of benzene and aromatic levels in petrol to
levels equivalent to Euro 5 emissions standard.
Aspects of the South African petroleum value chain are regulated largely under the
mandate of the Department of Energy (DOE) and administered either directly or by
the National Energy Regulator of South Africa (NERSA). The DOE is responsible for
the setting of various price levels for petroleum products and licensing activities
throughout the downstream liquid fuels value chain in terms of the Petroleum

28
Products Act, No 120 of 1977, as amended. NERSA sets tariffs for the infrastructure
linked to the value chain e.g. petroleum pipelines and storage facilities.
6. OUTLOOK
The future of the liquid fuel sector depends on four factors, namely, demand growth,
sustainable resources, security of supply and environmental constraints. The
increase in demand for petroleum products will be determined by the growth in the
country’s GDP and GDP per capita as well as the rate of urbanisation. Currently,
around 80% of global energy demand is met by fossil fuels and the unrelenting
increase in the demand is matched by the finite nature of these sources. The growth
in the petroleum sector will depend on the sustainability of these sources as well as
the introduction of non-conventional sources. Due to low oil resources in the country,
South Africa is heavily import dependent and the security of supply will depend on
the economic and political stability in the OPEC countries as well as substantial
investment in the country’s refinery capacity. Also, efforts that are continually being
made to redress the global environmental problems will affect the demand for
petroleum products in terms of efficiency in both use and production.
South Africa’s GDP growth, which declined from 2.5% in 2012 to 1.8% in 2013, is
projected to increase to 2.7 % in 2014 and reach 3.5 % in 2016, according to
National Treasury’s economic outlook (2014 Budget Review). The forecast is in line
with the National Development Plan (NDP), which was adopted by government as a
framework for economic and social development. This plan states that, to acquire
sustainable and inclusive growth by 2030, South Africa needs to invest in a strong
network of economic infrastructure designed to support the country’s medium and
long-term objectives. Consequently, the expected public investment in infrastructure
could reduce bottlenecks in transport, while stronger employment growth will
contribute to increased household consumption, which in turn, will increase the
demand for liquid fuels in the country.
According to the Energy Information Administration (EIA), energy demand from the
transport sector is expected to remain dominated by oil. However, the growth in
transport demand for liquid fuels is anticipated to slow down post 2025, as efficiency
29
improves and displacement by gas ramp up. Natural gas is the fastest growing
alternative at 6.8% per annum and is expected to overtake biofuels in 2022 before
reaching almost 7% of the transport market by 2035. The market share of biofuels in
the energy sector is forecast to grow from 2.5% currently to 4% by 2035.
South Africa is expected to continue to import liquid fuels in order to meet its excess
demand until such time that new refining capacity is developed. Furthermore,
government is developing a 20-year liquid fuels infrastructure roadmap to ensure
continued security of supply of liquid fuels to enable South Africa’s growth and
development. The roadmap will assist in determining the capabilities and capacity for
local refining, storage, handling and logistics.
The Department (DoE) is in the process of finalising the Integrated Energy Plan
which will be guided by national objectives, informed by the Energy White Paper,
National Energy Act and influenced by various government policies. The Integrated
energy plan is aimed at determining the best way to meet current and future energy
service needs in the most efficient and socially beneficial manner.

30
7. CONCLUSION
South Africa’s petrol and diesel supply growth was steady during the past 12 years
due to capacity constraints in the country. Consequently, supply was overtaken by
demand about half way through the study period. This led to a staggering increase in
imports of both crude oil and refined products to satisfy the country’s consumption.
The increase in demand was driven by an increase in the domestic economy.
The transformation in the transport sector, driven by research and development in
efficiency and cleaner fuel, has led to the beginning of a structural shift in the liquid
fuels market. Over the years, the market share of petrol declined in the country, with
a concomitant rise in the market share of diesel. This has been due to an increase in
the uptake of diesel-fuelled vehicles as opposed to petrol-fuelled ones, largely
attributed to the fact that diesel-fuelled vehicles are more fuel efficient combined with
the relative lower price of diesel as compared to petrol over the last few years.
The retail sector accounted for majority of the petrol traded, however its market
share declined in favour of diesel trade in the sector. Diesel continuously dominated
the commercial sector during the study period. Provincially, Gauteng led the
consumption of both petrol and diesel followed by Kwa-Zulu Natal and Western
Cape, respectively. This was in line with the prevailing contribution of the three
provinces to the country’s GDP.
Each province displayed different trends in fuel consumption per trade sector.
However, petrol traded in the retail sector dominated majority of the provinces. Fuel
in Free State, Mpumalanga, and Northern Cape was mainly consumed in the
commercial sector, mainly due to higher mining activities in these regions. The use
of cleaner fuels has increased over the past 12 years in all regions. Simultaneously,
lead replacement petrol consumption continuously declined while consumption of
diesel with 0.3% maximum sulphur was completely phased out from 2008. The use
of petrol is closely linked to disposable income for individuals whereas diesel usage
is closely linked to economic activities.
The intervention of South Africa’s government with the objective to ensure
sustainability and security of supply of energy in the country will result in investment
in the petroleum sector. Also, increasing collaboration between government,
31
business and labour in implementing the NDP will help to realise faster economic
growth and job creation, and in turn, will result in an increase in demand for liquid
fuels.

32
8. REFERENCES
1. B. Merven, A. Stone, A. Hughes and B. Cohen, Quantifying the energy needs of
the transport sector for South Africa: A bottom‐up model, June 2012
2. BP, Energy Outlook 2035, bp.com/energyoutlook, January 2014
3. C J Cooper, Energy and transport issues for Gauteng, South Africa, May 2007
4. E. M. Maleka, L. Mashimbye and P. Goyns, South African Energy Synopsis,
2010
5. Energy Information Administration (EIA), The International Energy Outlook 2013,
August 2013
6. H. Winkler, Energy policies for sustainable development in South Africa, April
2006
7. J Wakeford, Peak Oil and the Transition to a Sustainable Economy in South
Africa, 2012
8. J. Wakeford, Oil Shock Vulnerabilities & Impacts: South Africa Case Study, June
2013
9. K.Sartorius, C. Eitzen and J. Hart, An Examination of the Variables Influencing
the Fuel Retail Industry, 2007
10. M Vanderschuren, R Jobanputra and T Lane, Potential transportation measures
to reduce South Africa’s dependency on crude oil, August 2008
11. National Development Plan – 2030, Chapter 4: Economic Infrastructure – The
Foundation Of Social And Economic Development, 2011
12. National Treasury, Budget Review, Chapter 2: Economic Outlook, 2014
13. South African Petroleum Industry Association (SAPIA), 2013 Annual Report,
2014
14. South African Petroleum Industry Association (SAPIA), Petrol and Diesel in
South Africa and the impact on air quality, November 2008,
15. W H Boshoff, Gasoline, Diesel Fuel And Jet Fuel Demand In South Africa, 2012