Overview of Distributed Generation Technologies June 16, 2003 Harrisburg, PA Joel Bluestein Energy...
24
Overview of Distributed Generation Technologies June 16, 2003 Harrisburg, PA Joel Bluestein Energy and Environmental Analysis, www.eea-inc.com
-
Upload
clarissa-walker -
Category
Documents
-
view
217 -
download
2
Transcript of Overview of Distributed Generation Technologies June 16, 2003 Harrisburg, PA Joel Bluestein Energy...

Overview of Distributed Generation Technologies
June 16, 2003Harrisburg, PA
Joel BluesteinEnergy and Environmental Analysis, Inc.
www.eea-inc.com

Energy and Environmental Analysis, Inc.
2
Overview
• What are the technologies?
• Environmental implications

Energy and Environmental Analysis, Inc.
3
DG Technology Options
Reciprocating Engine
Gas Turbine
Fuel Cell
Microturbine
Photovoltaic

Energy and Environmental Analysis, Inc.
4
What Affects Technology Choice?
• Energy costs and fuel availability
• Electrical load size/factor/shape
• Load criticality
• Thermal load size/shape
• Special load considerations
• Regulatory requirements

Energy and Environmental Analysis, Inc.
5
What Differentiates Technologies?
• Size• Fuels• Efficiency• Capital costs• O&M costs• Amount and quality of thermal energy• Emissions• Risk

Energy and Environmental Analysis, Inc.
6
10 100 1,000 10,000 100,000
MicroTurbines
Fuel Cells
Rich Burn Engines
Lean Burn Engines
Gas Turbines
Applicable Size Range, kWe
Strong Market Position
Market Position
Emerging Position
Technology vs Size Coverage

Energy and Environmental Analysis, Inc.
7
How do the Technologies Compare?
Status Size Efficiency(%)
InstalledCosts ($/kW)
O&M Costs($/kWh)
Reciprocating Commercial 30 kW - 28 - 38 500 - 1400 0.007-0.02Engine 6 MW
Industrial Gas Turbine
Commercial 500 kW -20 MW
22 - 40 600 - 1500 0.003-0.008
Microturbines Early Entry 25 kW -300 kW
20 - 28 800 - 1400 0.003-0.01
Fuel Cells 1996 - 2010 3kW -3MW
36 - 60+ 2000 - 8000 0.005-0.010

Energy and Environmental Analysis, Inc.
8
Reciprocating Engines
• Size Range: 30 - 6,000 kW
• Electric efficiency: 28 - 38%
• Fast startup (10 secs) capabilityallows for use as standby
• Thermal energy in the form ofhot water or low pressure steam
• High maintenance requirements (lots of movingparts)
• Emissions can be an issue

Energy and Environmental Analysis, Inc.
9
Reciprocating Engines
• Dominant technology for current applications of small distributed generation
• Mature commercial business with established sales and service networks
• Gas-fired spark ignition engines appropriate for CHP, peak shaving and direct drive
• Diesel engines most common for standby, emergency and remote applications

Energy and Environmental Analysis, Inc.
10
Reciprocating Engine Emission Controls
• Lean burn gas with electronic air/fuel ratio control - 0.5 - 2 gm NOx/bhp-hr (1.5 - 6 lb/MWh)
• Rich burn gas with three-way catalyst - 0.15 gm NOx/bhp-hr (0.47 lb/MWh)
• Diesel engine - 4.5 to 7 gm/bhp-hr (14 - 21 lb/MWh)

Energy and Environmental Analysis, Inc.
11
Industrial Gas Turbines• Size range: 500 kW - 50 MW
• Electric efficiency (22-40%)
• Start-up time: 10min - 1hr
• Established technology formany power and direct driveapplications
• Multi-fuel capable, but economics and emissions favor natural gas
• High pressure steam or high temperature direct heat

Energy and Environmental Analysis, Inc.
12
Gas Turbine Emission Controls
• Water/steam injection (42 ppm NOx - 1.8 lb/MWh)
• Lean-premix, dry low NOx (15 - 25 ppm NOx - 0.6 - 1
lb/MWh)
• Selective catalytic reduction (3 - 9 ppm NOx - 0.1 - 0.4 lb/MWh)
• Control technologies can be used in series (3 ppm NOx - 0.1 lb/MWh)
• Emerging technologies: catalytic combustion - 3 ppm; SCONOx™ -2 ppm; lean pre-mix <15 ppm

Energy and Environmental Analysis, Inc.
13
Microturbines
• Size range: 25 - 300 kW
• Electric efficiency: 20 - 30%
• Start-up time: >1 min.
• Fuel compressor usually required
• Alternative to small reciprocatingengines
• Commercial introduction underway

Energy and Environmental Analysis, Inc.
14
Why the Interest in microturbines?
• High reliability expected due to few moving parts• Potential for low maintenance requirements
– No Oil Changes– No Spark Plug Changes– No Valve Adjustment or Machining
• Low NOx (9 ppm ~ 0.5 lb/MWh), CO, CO2, and UHC emissions
• Competitive efficiency (24 - 26%) when recuperated

Energy and Environmental Analysis, Inc.
15
Fuel Cells
Size range: 3 - 3,000 kW
Start-up time: 3 hrs +
Electric efficiency: 36-65%
Very low emissions - exempt in some areas
Only PAFC is commerciallyavailable

Energy and Environmental Analysis, Inc.
16
Combined Heat and Power
• CHP sequentially produces electricity, thermal or mechanical energy
• Traditionally the most effective DG option
• High system efficiency is key to economics
• High operating hours covers high capital costs
• CHP is attractive from an energy and environmental policy perspective

Energy and Environmental Analysis, Inc.
17
Typical CHP Systems
Gas Turbine or Engine/Heat Recovery Unit:Steam Boiler/Steam Turbine:

Energy and Environmental Analysis, Inc.
18
Efficiency Benefits of CHP

Energy and Environmental Analysis, Inc.
19
Environmental Benefits of CHP (NOX)
Energy and Environmental Analysis, Inc.
20
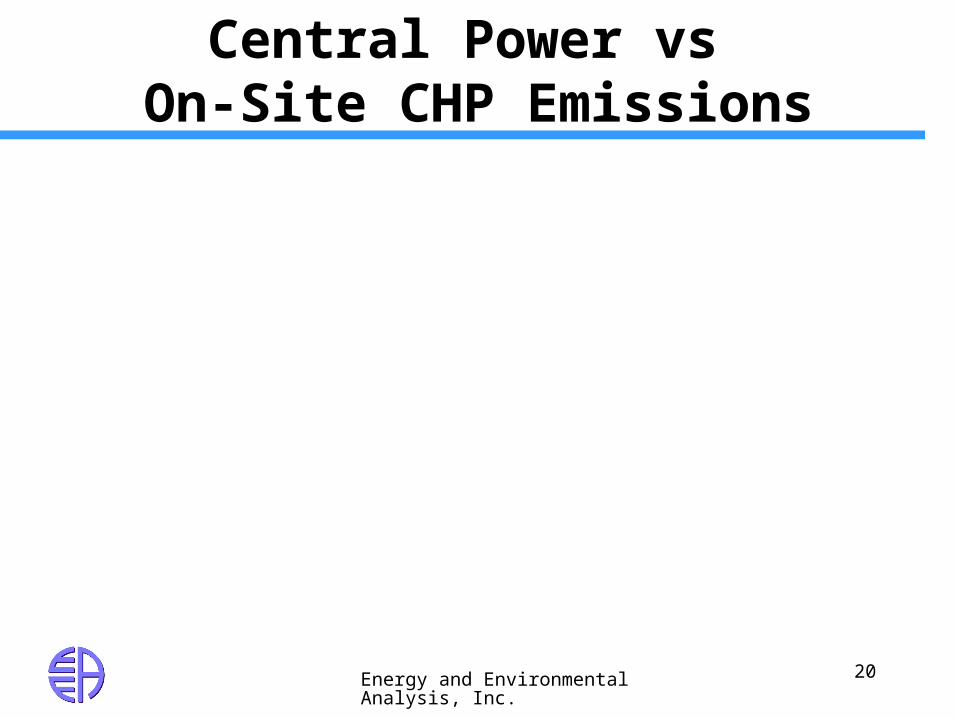
Central Power vs On-Site CHP Emissions
0
5
10
15
20
25
30
35
40
45
Boiler+Grid Boiler+Non-CHP DG (25 ppm)
CHP (25 ppm) CHP (15 ppm)
Ton
s N
Ox/
yr
Electricity
Boiler
Grid = 1.5 lb NOx/MWhBoiler=0.10 lb NOx/MMBtu

Energy and Environmental Analysis, Inc.
21
DG Equipment Representative 2002 Performance and Costs
Technology Capacity (kW) Heat Rate HHV (Btu/kWh)
Electrical Efficiency HHV (%)
Total CHP Efficiency HHV
(%)
Equipment Process Capital
Costs ($/kW)
Installed Costs Power Only ($/kW)
Installed Costs CHP
($/kW)
Gas Turbine 1000 15,580 21.9 68.0 1,136 1,329 1,929Gas Turbine 5000 12,590 27.1 69.0 663 773 1,063Rich-Burn Gas Engine 100 11,780 29.0 77.0 771 1,030 1,491Lean-Burn Gas Engine 800 10,246 33.3 76.0 593 724 971Microturbine 30 15,443 22.1 73.0 1,851 2,201 2,604Microturbine 100 13,127 26.0 68.0 1,260 1,485 1,745PA Fuel Cell 200 9,480 36.0 75.0 4,230 - 4,500MC Fuel Cell 250 7,930 43.0 65.0 4,730 - 5,000SO Fuel Cell 100 7,580 45.0 70.0 3,220 - 3,500
PEM Fuel Cell 10 11,370 30.0 68.0 5,050 - 5,500

Energy and Environmental Analysis, Inc.
22
NOx Emissions ComparisonNOx (lb/MWh)
0.5
2.2
0.3
0.6
1.1
0.4
0.06
0.04
0.01
0.6
3.4
5.1
5.6
4.7
14.0
- 2 4 6 8 10 12 14 16
U.S. Average All Generation
U.S. Average Fossil Generation
U.S. Average Coal Generation
Engine: Diesel, SCR
Engine: Diesel
Engine: Gas fired, 3-way catalyst
Engine: Gas fired, Lean Burn
Fuel Cell: Phosphoric Acid
Fuel Cell: Solid Oxide
Turbine: ATS Simple Cycle
Turbine: Medium, Simple Cycle
Turbine: Small, Simple Cycle
Turbine: Microturbine
Turbine: Large, Simple Cycle
Turbine: Large Combined Cycle, SCR
Energy and Environmental Analysis, Inc.
23
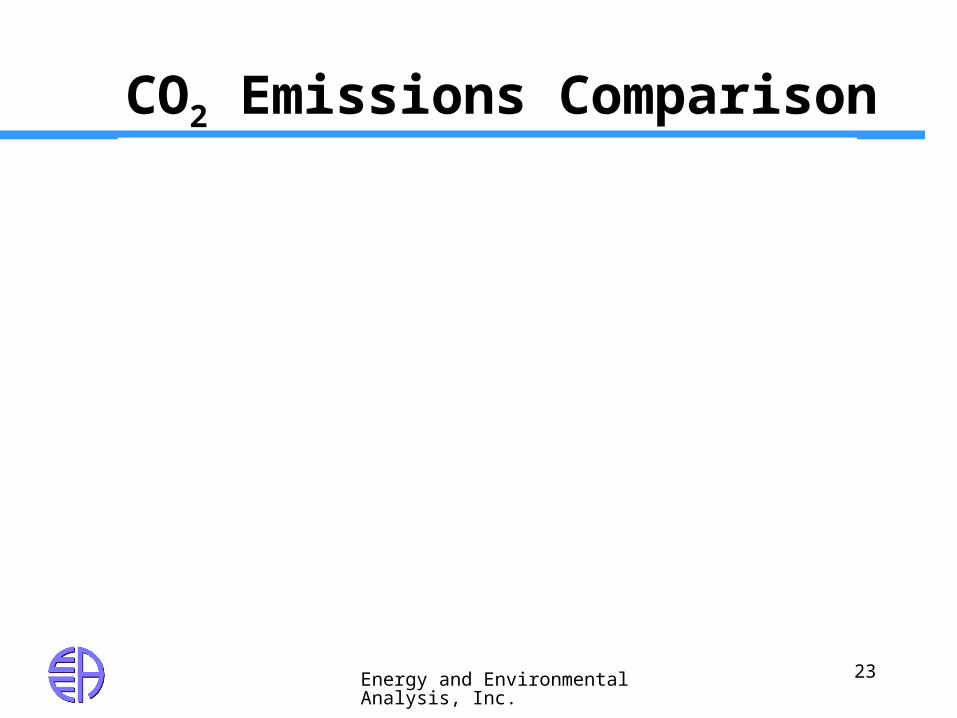
CO2 Emissions ComparisonCO2 (lb/MWh)
1,408
2,031
2,115
1,432
1,432
1,376
1,108
1,185
950
1,154
1,327
1,494
1,596
1,281
776
- 500 1,000 1,500 2,000 2,500
U.S. Average All Generation
U.S. Average Fossil Generation
U.S. Average Coal Generation
Engine: Diesel, SCR
Engine: Diesel
Engine: Gas fired, 3-way catalyst
Engine: Gas fired, Lean Burn
Fuel Cell: Phosphoric Acid
Fuel Cell: Solid Oxide
Turbine: ATS Simple Cycle
Turbine: Medium, Simple Cycle
Turbine: Small, Simple Cycle
Turbine: Microturbine
Turbine: Large, Simple Cycle
Turbine: Large Combined Cycle, SCR

Energy and Environmental Analysis, Inc.
24
Conclusions
• Improved technology offers improving efficiency, utility and emissions.
• Environmental regulations should recognize the role, value and limitations of DG technology.


![Harrisburg telegraph. (Harrisburg, Pa.) 1914-11-28 [p 9]](https://static.fdocuments.in/doc/165x107/626c10259a162172630a25f1/harrisburg-telegraph-harrisburg-pa-1914-11-28-p-9.jpg)