Overview and Descriptive Statistics. Outline – Populations, Samples and Processes.
35
Overview and Descriptive Statistics
-
date post
19-Dec-2015 -
Category
Documents
-
view
217 -
download
0
Transcript of Overview and Descriptive Statistics. Outline – Populations, Samples and Processes.

Overview and Descriptive Statistics

Outline – Populations, Samples and Processes

Outline – Pictorial and Tabular Methods in Descriptive Statistics
Outline – Measures of Location

Outline – Measures of Variability

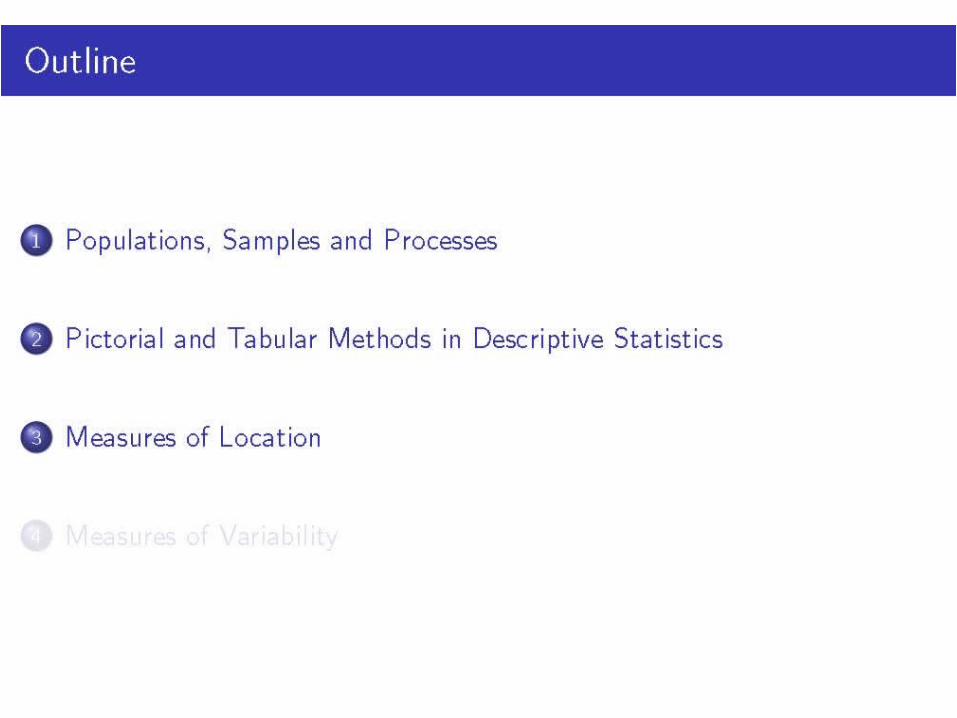
Chapter 1: Descriptive Statistics

1.1 Populations, samples and processes

Descriptive statistics

Challenger example
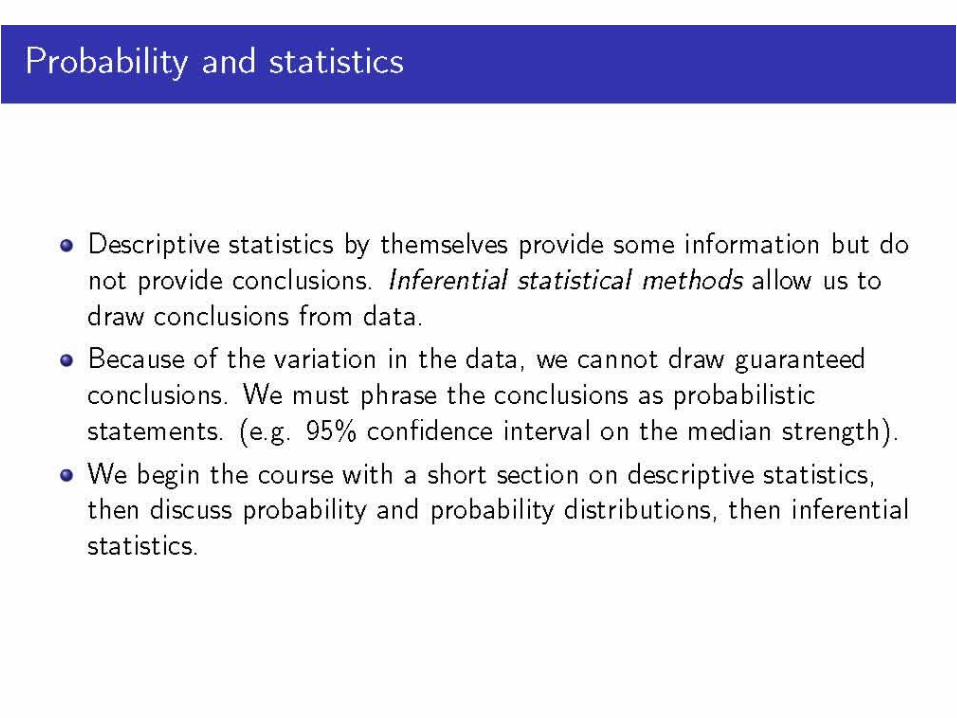
Probability and statistics

Data collection

Data collection (cont’d)

1.2 Pictorial Methods
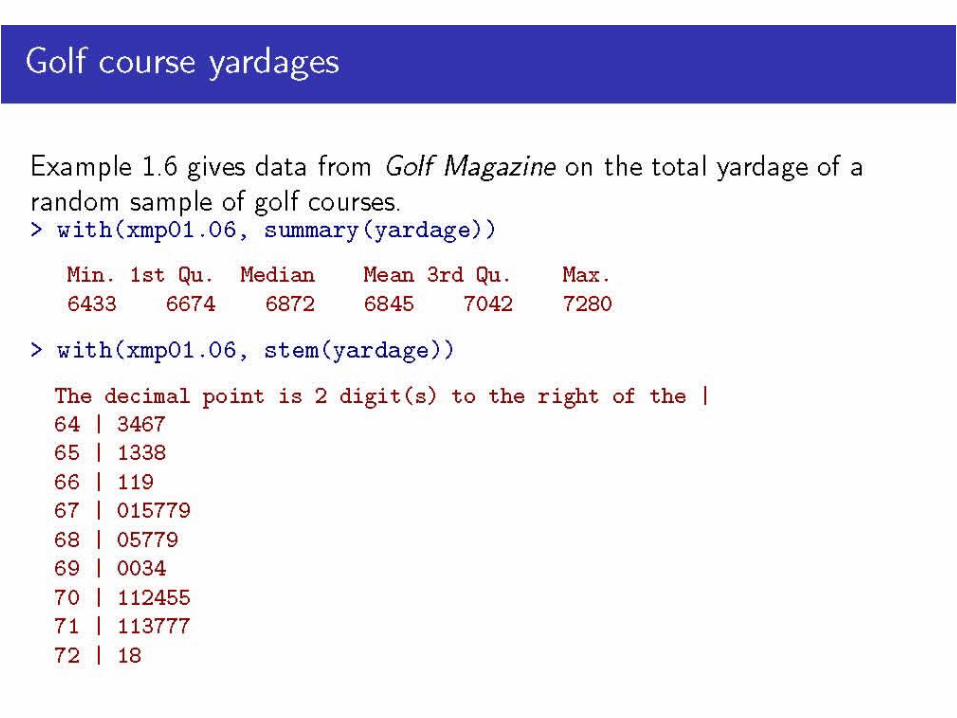
Golf course yardages

Histograms
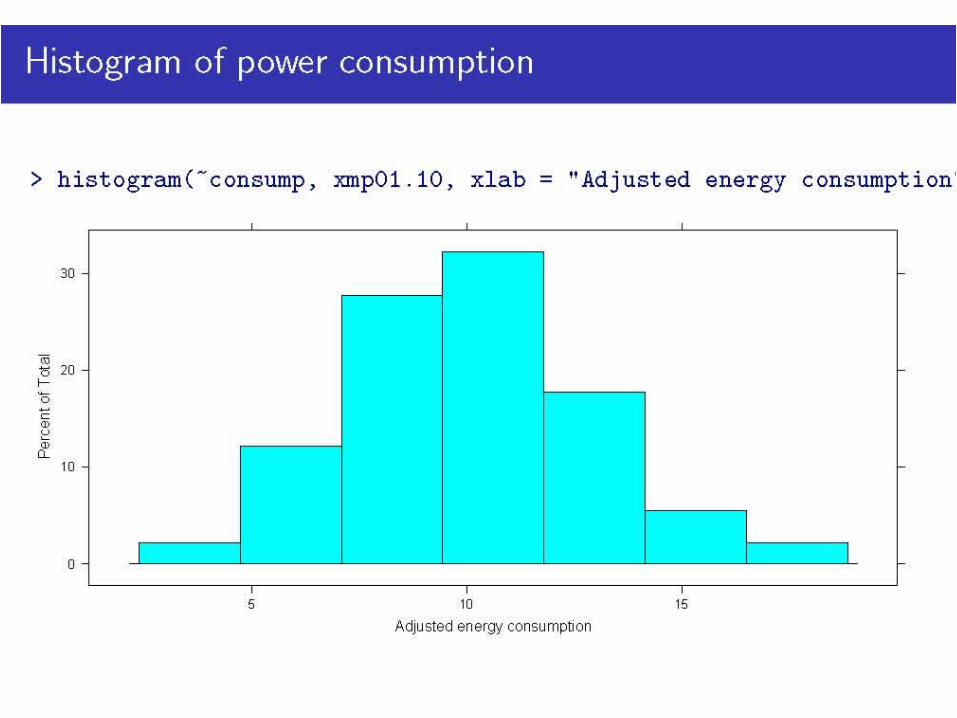
Histogram of power consumption

Density plot of power consumption

Unequal bin widths

Default histogram of strength
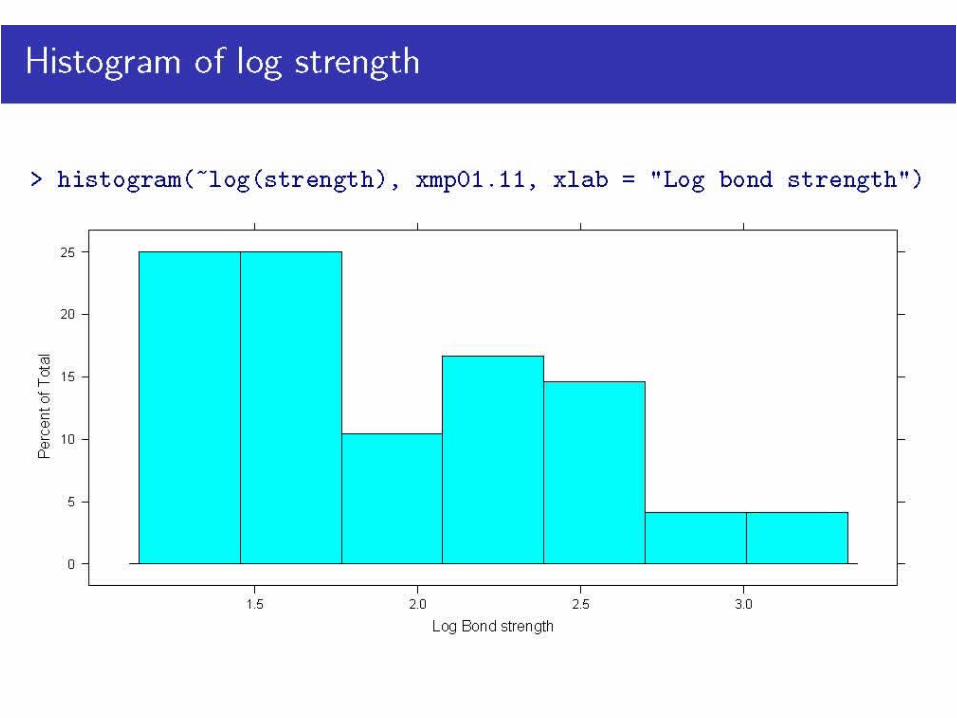
Histogram of log strength

Alternative histogram of log strength
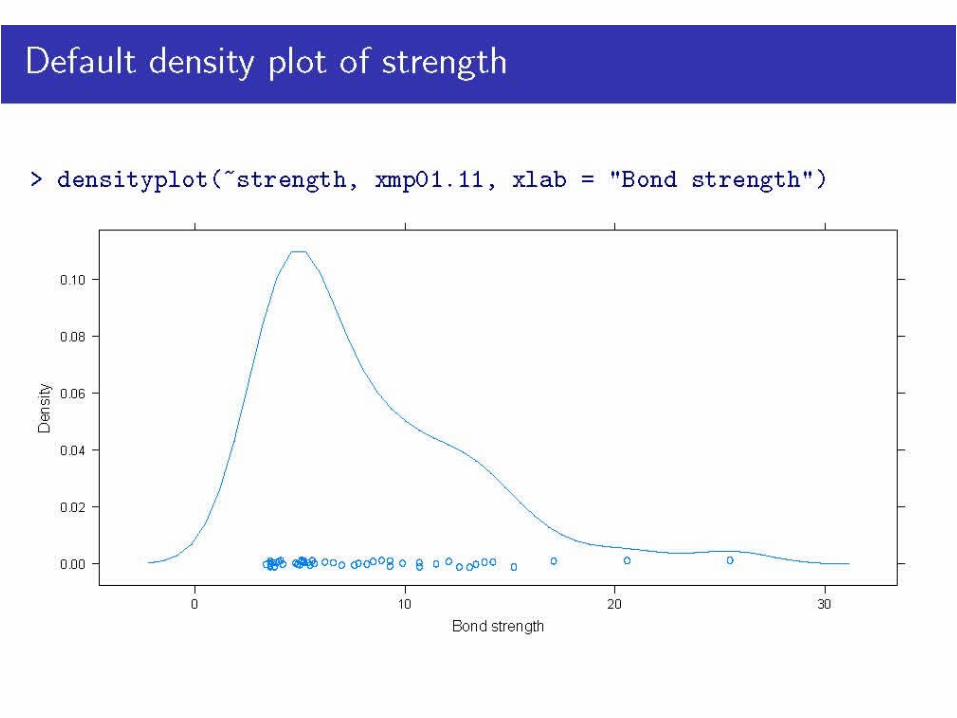
Default density plot of strength

Density plot of log strength

Categorical data

Bar plot for health complaints
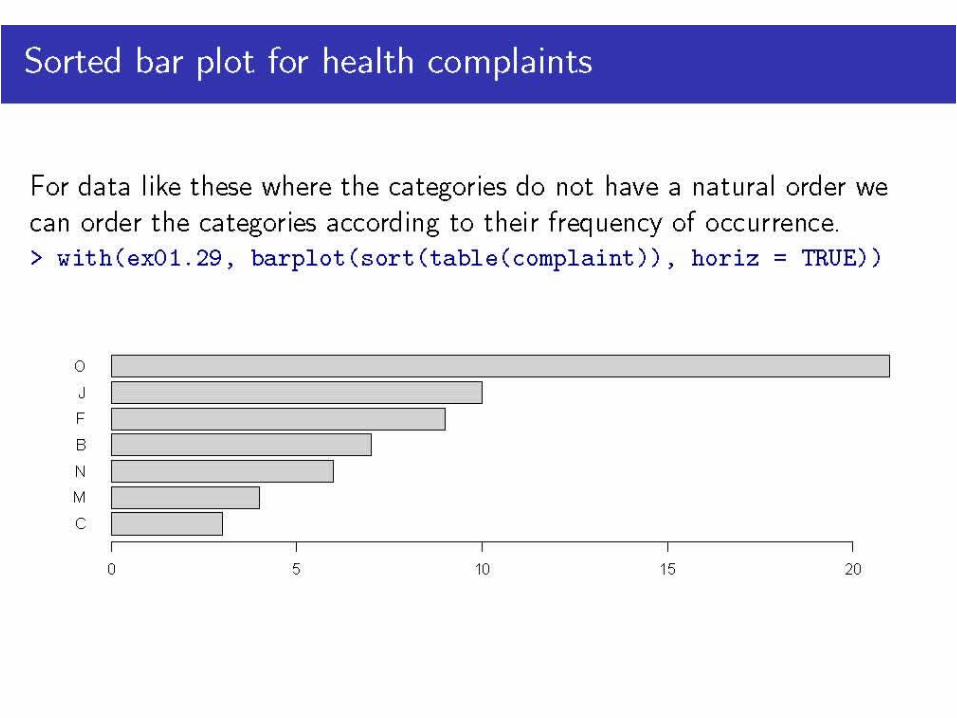
Sorted bar plot for health complaints

Multivariate data

Measures of location

Quartiles, percentiles, and quantities

Trimmed means

Summary of categorical data

Sample Variance and standard deviation

Properties of variance

Boxplots

Comparative boxplots