Populations and Samples - UMasspeople.umass.edu/~biep540w/pdf/Populations and Samples.pdf · BE540W...
33
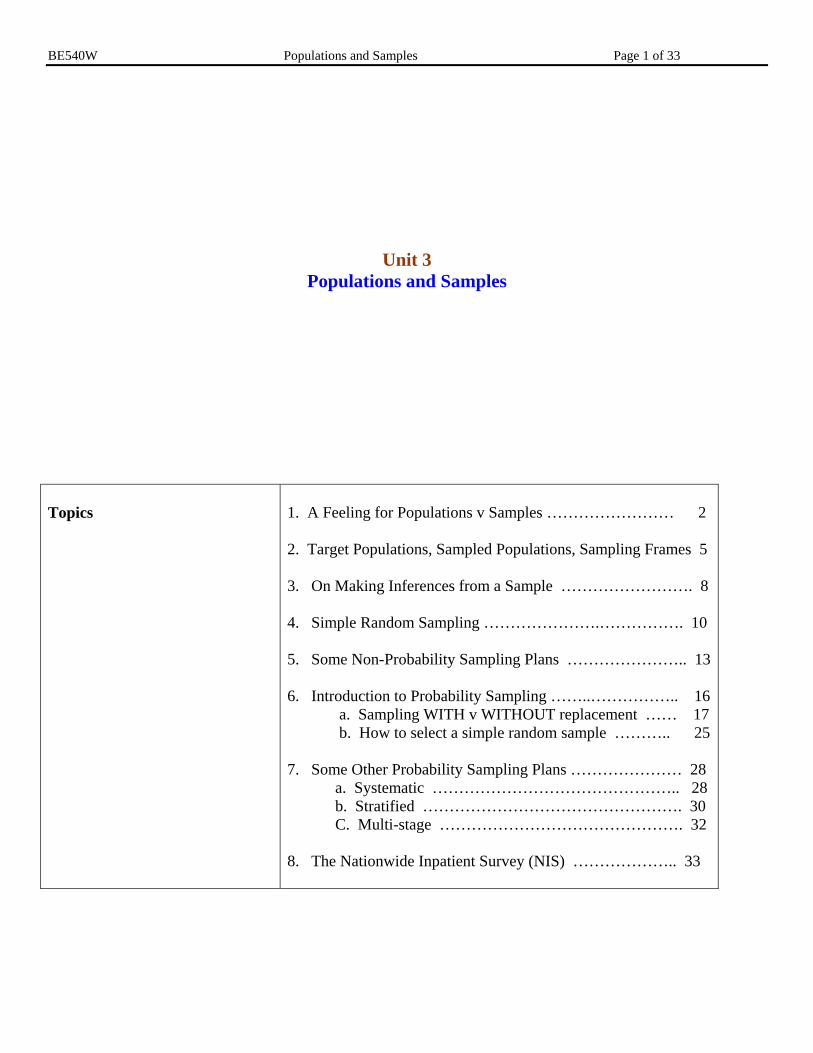
BE540W Populations and Samples Page 1 of 33 Unit 3 Populations and Samples Topics 1. A Feeling for Populations v Samples …………………… 2 2. Target Populations, Sampled Populations, Sampling Frames 5 3. On Making Inferences from a Sample ……………………. 8 4. Simple Random Sampling ………………….……………. 10 5. Some Non-Probability Sampling Plans ………………….. 13 6. Introduction to Probability Sampling ……..…………….. 16 a. Sampling WITH v WITHOUT replacement …… 17 b. How to select a simple random sample ……….. 25 7. Some Other Probability Sampling Plans ………………… 28 a. Systematic ……………………………………….. 28 b. Stratified …………………………………………. 30 C. Multi-stage ………………………………………. 32 8. The Nationwide Inpatient Survey (NIS) ……………….. 33
Transcript of Populations and Samples - UMasspeople.umass.edu/~biep540w/pdf/Populations and Samples.pdf · BE540W...
BE540W Populations and Samples Page 1 of 33
Unit 3 Populations and Samples
Topics
1. A Feeling for Populations v Samples …………………… 2 2. Target Populations, Sampled Populations, Sampling Frames 5 3. On Making Inferences from a Sample ……………………. 8
4. Simple Random Sampling ………………….……………. 10
5. Some Non-Probability Sampling Plans ………………….. 13
6. Introduction to Probability Sampling ……..…………….. 16
a. Sampling WITH v WITHOUT replacement …… 17 b. How to select a simple random sample ……….. 25
7. Some Other Probability Sampling Plans ………………… 28 a. Systematic ……………………………………….. 28 b. Stratified …………………………………………. 30 C. Multi-stage ………………………………………. 32
8. The Nationwide Inpatient Survey (NIS) ……………….. 33
BE540W Populations and Samples Page 2 of 33
1. A Feeling for Populations versus Samples
Initially, we gave ourselves permission to consider not at all the source of the available data.
• The course introduction included some examples making the point that statistics is a tool for evaluating uncertainty and that we must be wary of biases that might enter our thinking; • In topic 1, Summarizing Data, the techniques and advantages of graphical and tabular summaries of data were emphasized; and • In topic 1, Summarizing Data, too, we familiarized ourselves with the basics of summarizing data using numerical approaches (means, variances, etc)
The backdrop has been an overall communication of what, ultimately, statistics is about
• To learn about and describe the population which gave rise to the sample; or • To investigate some research question; or • To assigning probabilities of events (mathematical tool); or • To calculate the likelihood of the observed events under some specified postulates (statistical significance); and • What statistics is not about - Statistical significance is not the same as biological significance.
In this unit, Populations and Samples, we broaden our “lense” to include an appreciation of the connections between populations and samples.
BE540W Populations and Samples Page 3 of 33
Example – The 1948 Gallup Poll
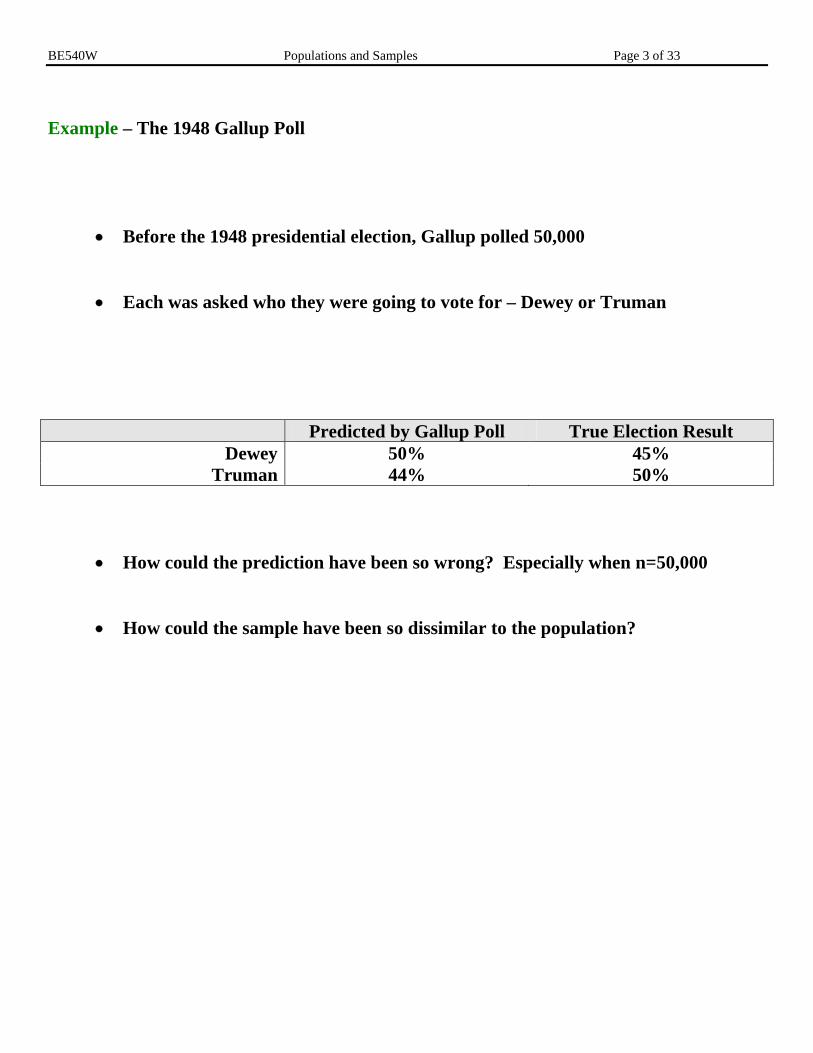
• Before the 1948 presidential election, Gallup polled 50,000 • Each was asked who they were going to vote for – Dewey or Truman
Predicted by Gallup Poll True Election Result Dewey 50% 45%
Truman 44% 50% • How could the prediction have been so wrong? Especially when n=50,000 • How could the sample have been so dissimilar to the population?
BE540W Populations and Samples Page 4 of 33
The 1948 Gallup Poll
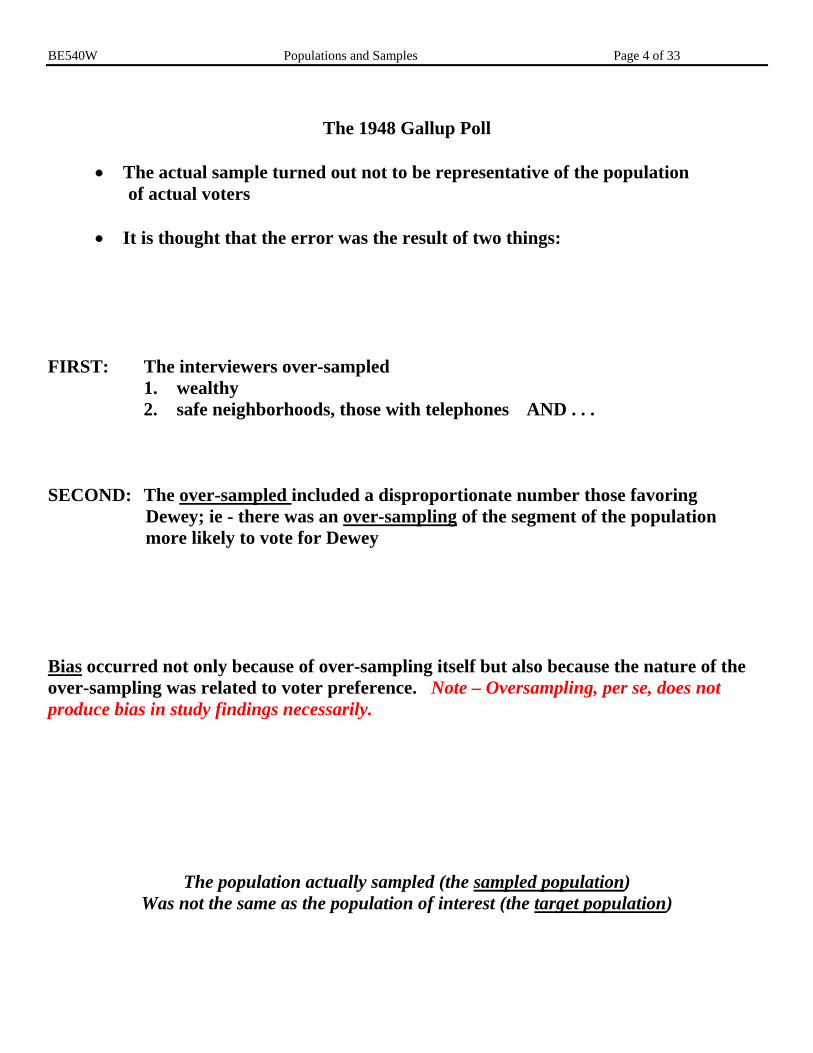
• The actual sample turned out not to be representative of the population of actual voters • It is thought that the error was the result of two things:
FIRST: The interviewers over-sampled 1. wealthy 2. safe neighborhoods, those with telephones AND . . .
SECOND: The over-sampled included a disproportionate number those favoring Dewey; ie - there was an over-sampling of the segment of the population more likely to vote for Dewey Bias occurred not only because of over-sampling itself but also because the nature of the over-sampling was related to voter preference. Note – Oversampling, per se, does not produce bias in study findings necessarily.
The population actually sampled (the sampled population)
Was not the same as the population of interest (the target population)
BE540W Populations and Samples Page 5 of 33
2. Target Population, Sampled Population, Sampling Frame
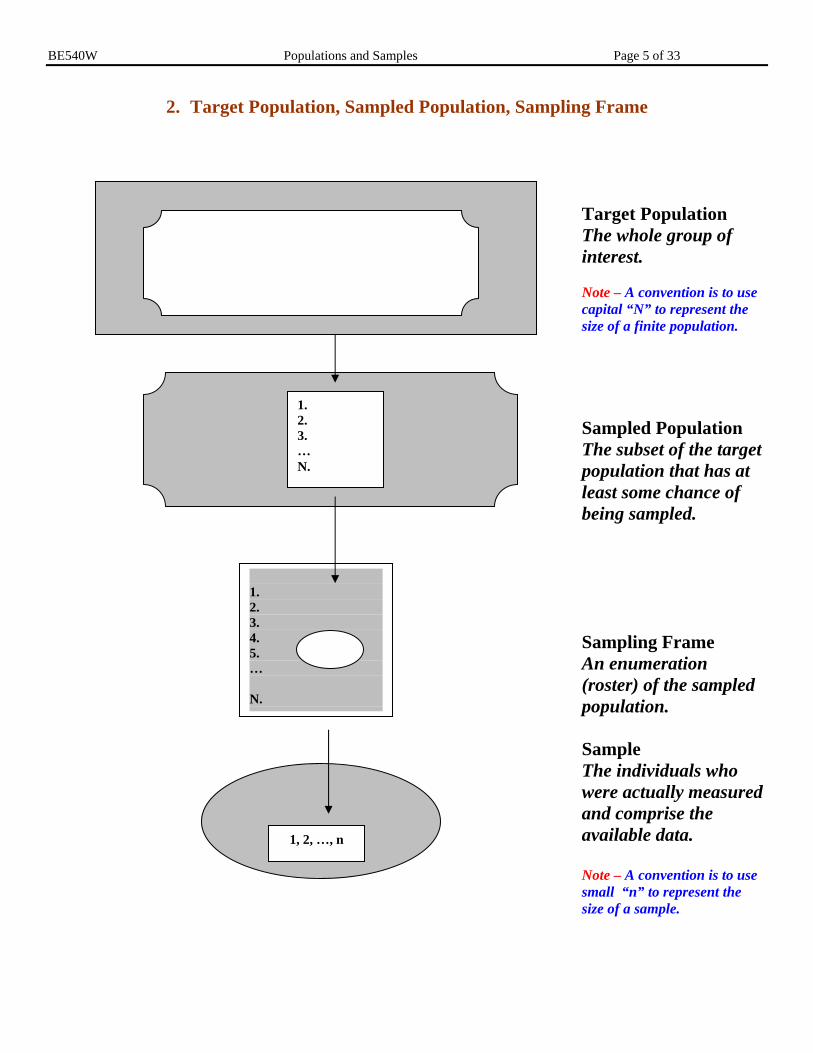
Target Population The whole group of interest. Note – A convention is to use capital “N” to represent the size of a finite population.
Sampled Population The subset of the target population that has at least some chance of being sampled.
Sampling Frame An enumeration (roster) of the sampled population.
Sample The individuals who were actually measured and comprise the available data. Note – A convention is to use small “n” to represent the size of a sample.
1. 2. 3. 4. 5. … N.
1. 2. 3. … N.
1, 2, …, n
BE540W Populations and Samples Page 6 of 33
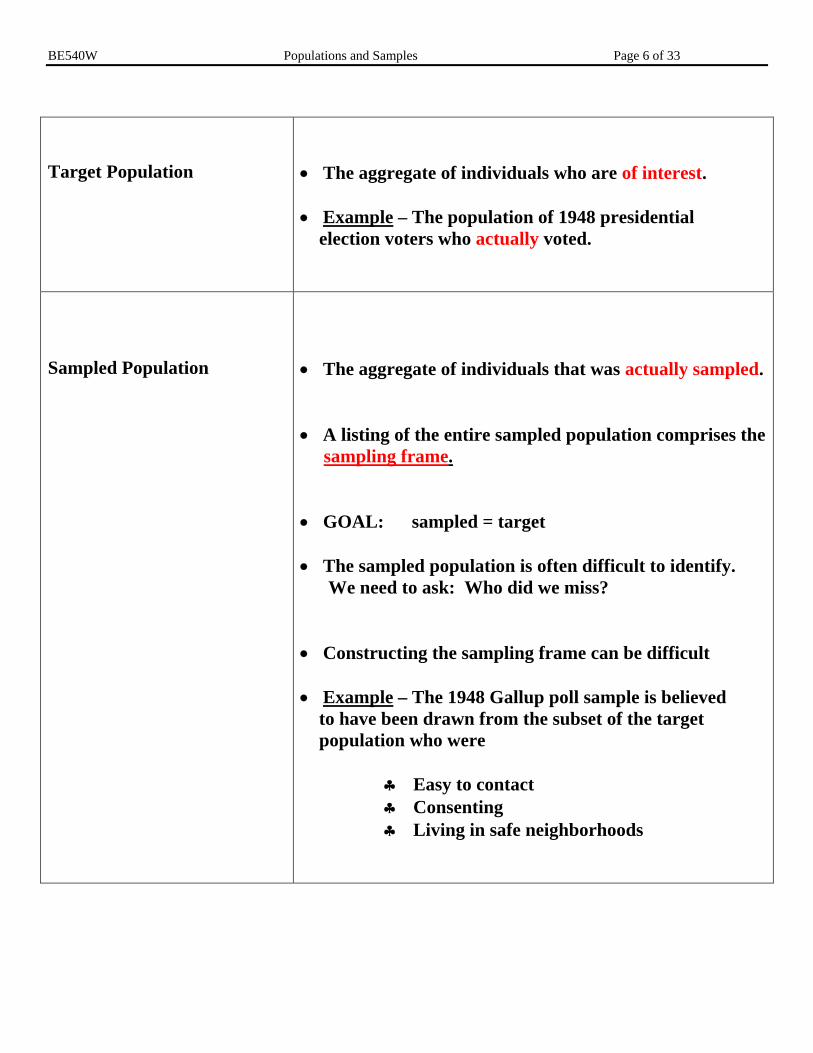
Target Population
• The aggregate of individuals who are of interest. • Example – The population of 1948 presidential election voters who actually voted.
Sampled Population
• The aggregate of individuals that was actually sampled. • A listing of the entire sampled population comprises the sampling frame. • GOAL: sampled = target • The sampled population is often difficult to identify. We need to ask: Who did we miss? • Constructing the sampling frame can be difficult • Example – The 1948 Gallup poll sample is believed to have been drawn from the subset of the target population who were
♣ Easy to contact ♣ Consenting ♣ Living in safe neighborhoods
BE540W Populations and Samples Page 7 of 33
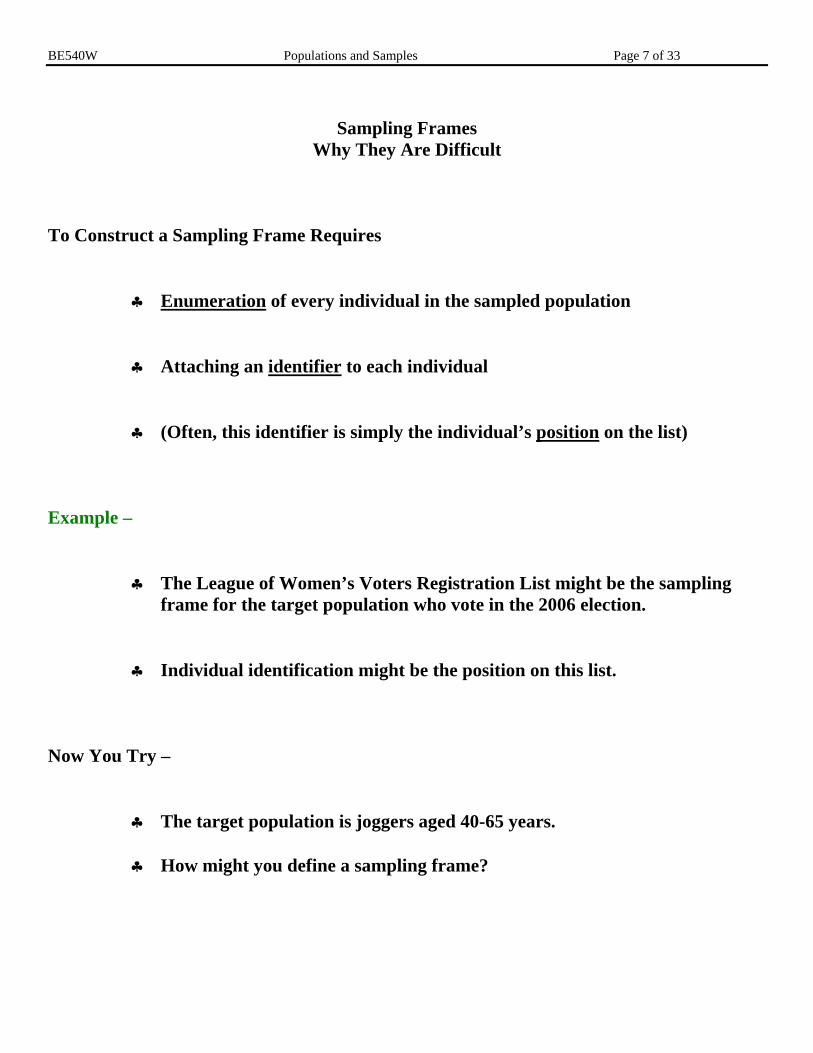
Sampling Frames
Why They Are Difficult
To Construct a Sampling Frame Requires
♣ Enumeration of every individual in the sampled population
♣ Attaching an identifier to each individual
♣ (Often, this identifier is simply the individual’s position on the list) Example –
♣ The League of Women’s Voters Registration List might be the sampling frame for the target population who vote in the 2006 election.
♣ Individual identification might be the position on this list. Now You Try –
♣ The target population is joggers aged 40-65 years.
♣ How might you define a sampling frame?
BE540W Populations and Samples Page 8 of 33
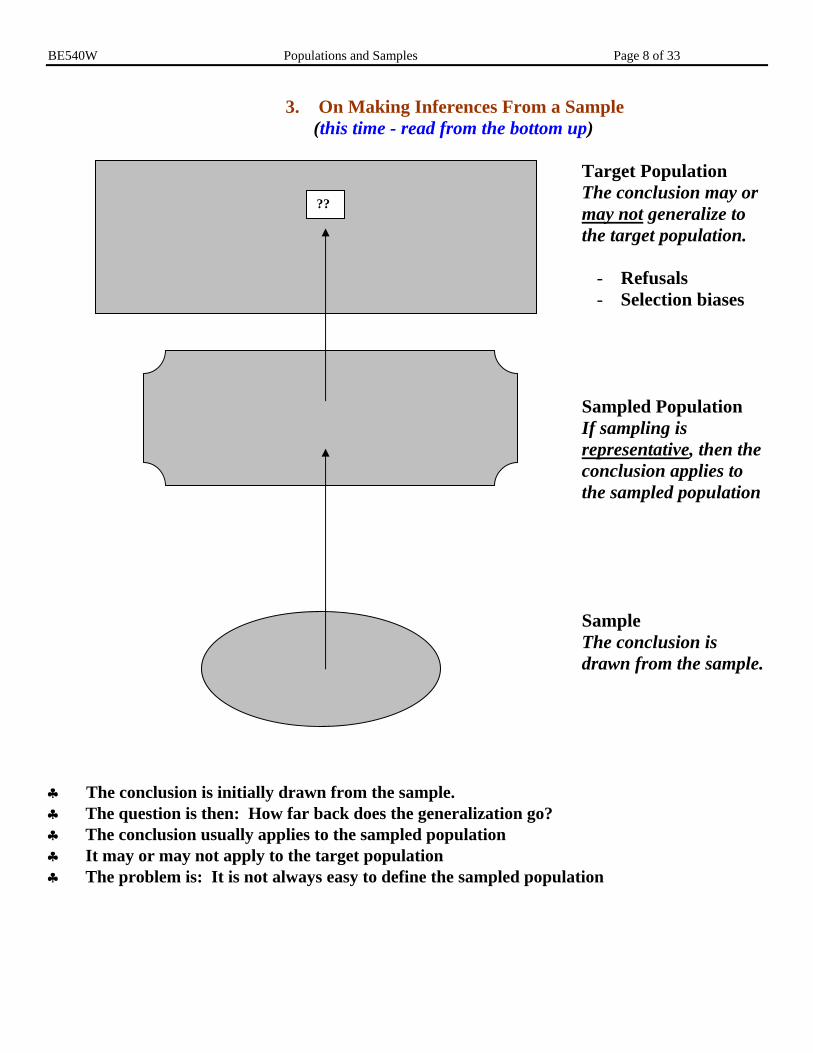
3. On Making Inferences From a Sample (this time - read from the bottom up)
Target Population The conclusion may or may not generalize to the target population.
- Refusals - Selection biases
Sampled Population If sampling is representative, then the conclusion applies to the sampled population
Sample The conclusion is drawn from the sample.
♣ The conclusion is initially drawn from the sample. ♣ The question is then: How far back does the generalization go? ♣ The conclusion usually applies to the sampled population ♣ It may or may not apply to the target population ♣ The problem is: It is not always easy to define the sampled population
??
BE540W Populations and Samples Page 9 of 33
Example – an NIH Funded Randomized Trial
♦ The sampling frame, by definition, is allowed to contain only consenters
♦ Thus, refusers, by definition, are not in the sampling frame.
♦ Accordingly, the sampled population differs from the target population in at least one
respect, ALWAYS.
♦ This suggests that in any study, the preliminary analyses should always include a
comparison of the consenters versus the refusers.
Now You Try …
♦ Suppose the target population is current smokers.
♦ How might you construct a sampling frame? ♦ What do you end up with for a sampled population? ♦ Comment on the nature of generalization, to the extent possible.
BE540W Populations and Samples Page 10 of 33
4. Simple Random Sampling
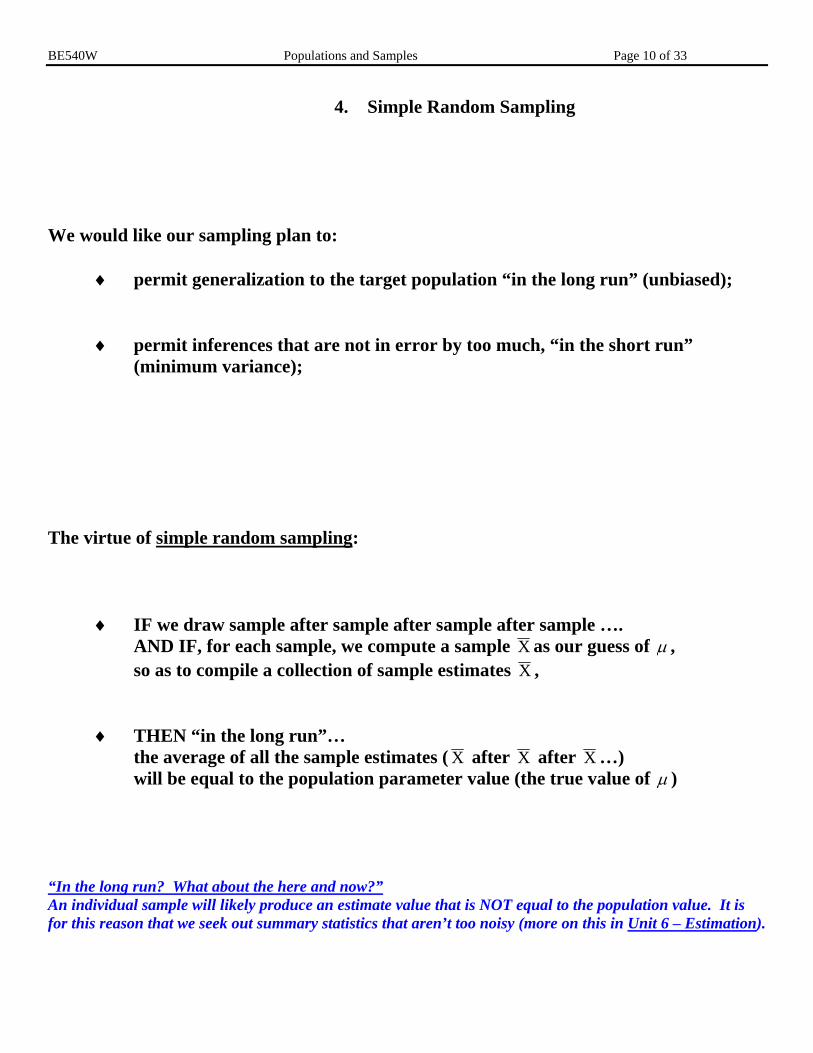
We would like our sampling plan to:
♦ permit generalization to the target population “in the long run” (unbiased);
♦ permit inferences that are not in error by too much, “in the short run”
(minimum variance); The virtue of simple random sampling:
♦ IF we draw sample after sample after sample after sample …. AND IF, for each sample, we compute a sample X as our guess of µ , so as to compile a collection of sample estimates X ,
♦ THEN “in the long run”…
the average of all the sample estimates ( X after X after X …) will be equal to the population parameter value (the true value of µ )
“In the long run? What about the here and now?” An individual sample will likely produce an estimate value that is NOT equal to the population value. It is for this reason that we seek out summary statistics that aren’t too noisy (more on this in Unit 6 – Estimation).
BE540W Populations and Samples Page 11 of 33
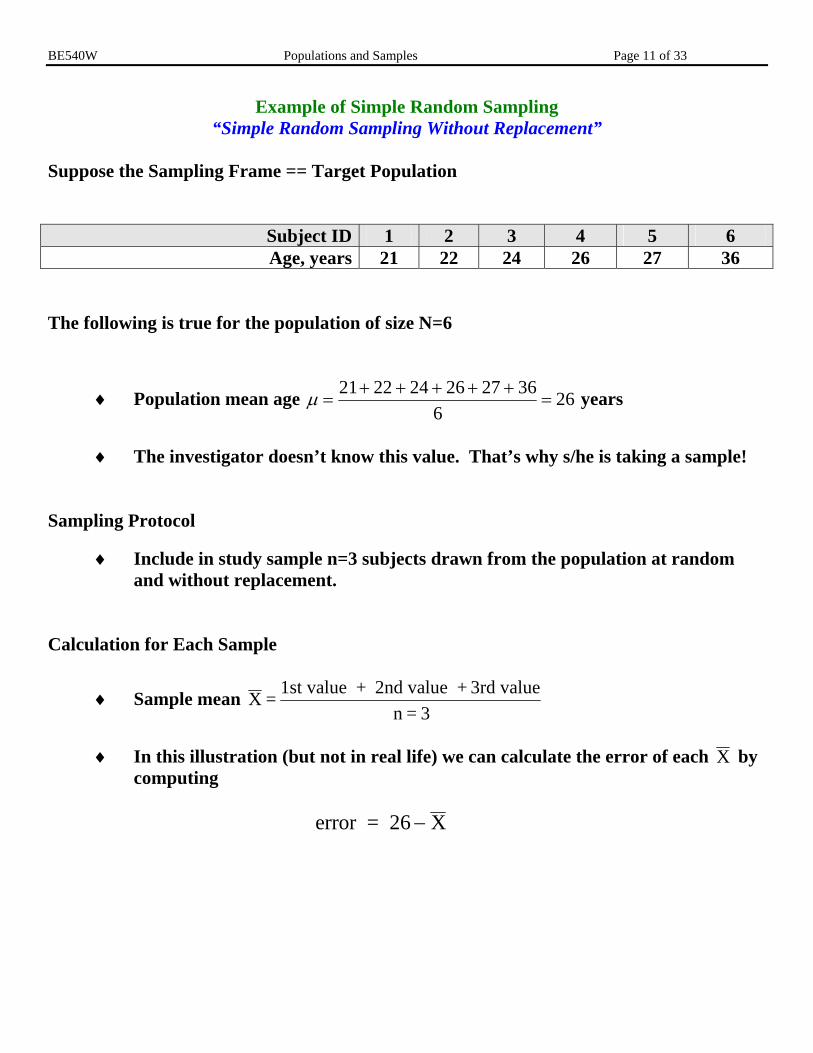
Example of Simple Random Sampling “Simple Random Sampling Without Replacement”
Suppose the Sampling Frame == Target Population
Subject ID 1 2 3 4 5 6 Age, years 21 22 24 26 27 36
The following is true for the population of size N=6
♦ Population mean age µ =+ + + + +
=21 22 24 26 27 36
626 years
♦ The investigator doesn’t know this value. That’s why s/he is taking a sample!
Sampling Protocol
♦ Include in study sample n=3 subjects drawn from the population at random and without replacement.
Calculation for Each Sample
♦ Sample mean X = 1st value + 2nd value + 3rd valuen = 3
♦ In this illustration (but not in real life) we can calculate the error of each X by
computing error = 26 X−
BE540W Populations and Samples Page 12 of 33
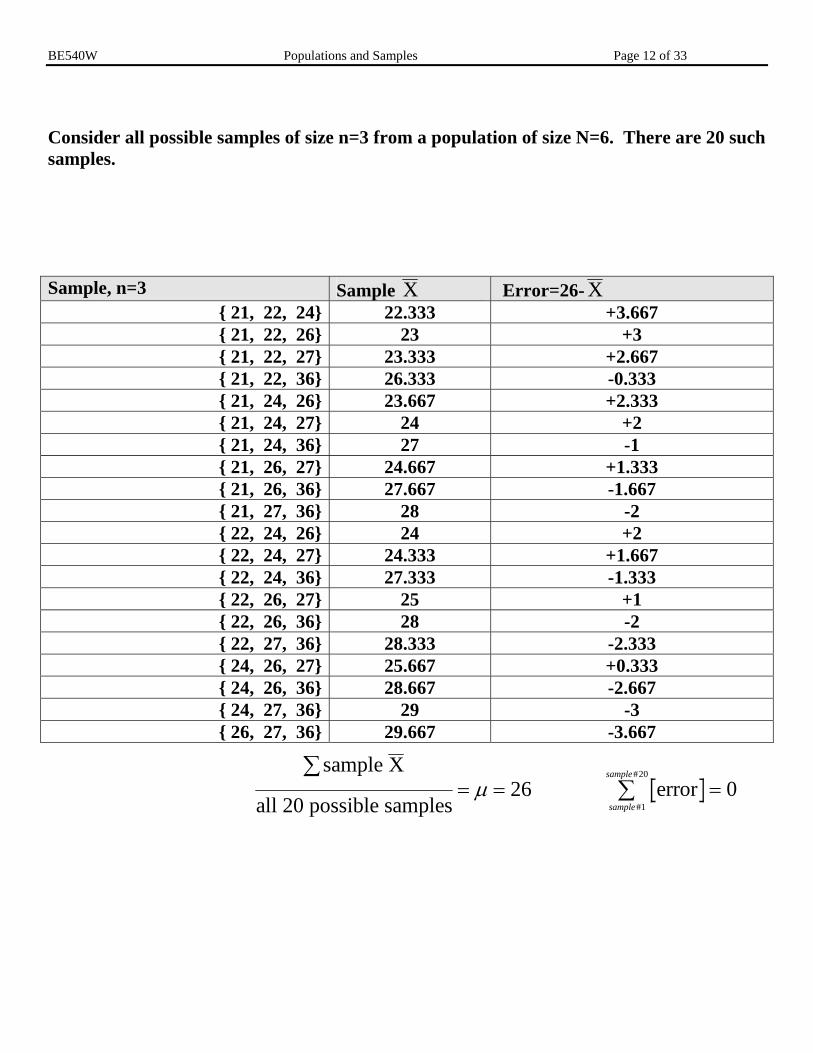
Consider all possible samples of size n=3 from a population of size N=6. There are 20 such samples. Sample, n=3 Sample X Error=26- X
{ 21, 22, 24} 22.333 +3.667 { 21, 22, 26} 23 +3 { 21, 22, 27} 23.333 +2.667 { 21, 22, 36} 26.333 -0.333 { 21, 24, 26} 23.667 +2.333 { 21, 24, 27} 24 +2 { 21, 24, 36} 27 -1 { 21, 26, 27} 24.667 +1.333 { 21, 26, 36} 27.667 -1.667 { 21, 27, 36} 28 -2 { 22, 24, 26} 24 +2 { 22, 24, 27} 24.333 +1.667 { 22, 24, 36} 27.333 -1.333 { 22, 26, 27} 25 +1 { 22, 26, 36} 28 -2 { 22, 27, 36} 28.333 -2.333 { 24, 26, 27} 25.667 +0.333 { 24, 26, 36} 28.667 -2.667 { 24, 27, 36} 29 -3 { 26, 27, 36} 29.667 -3.667
sample X
all 20 possible samples
∑= =µ 26 error
sample
sample
#
#
1
20
0∑ =
BE540W Populations and Samples Page 13 of 33
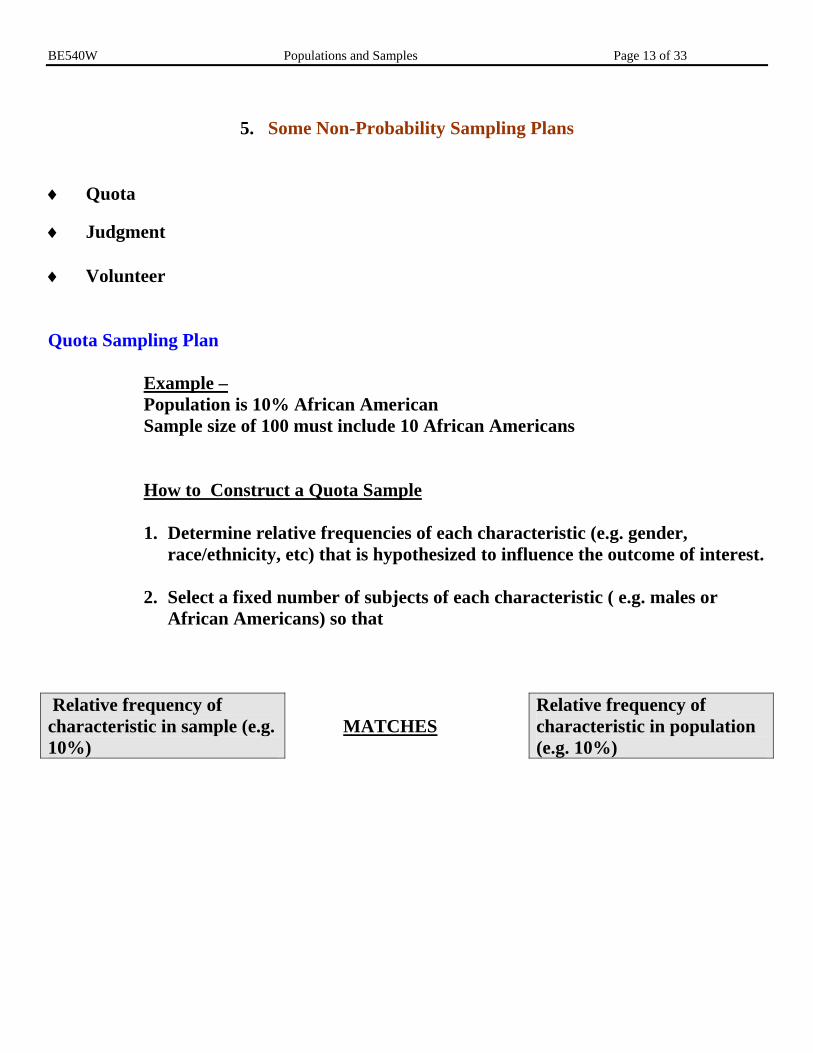
5. Some Non-Probability Sampling Plans
♦ Quota
♦ Judgment ♦ Volunteer Quota Sampling Plan
Example – Population is 10% African American Sample size of 100 must include 10 African Americans How to Construct a Quota Sample 1. Determine relative frequencies of each characteristic (e.g. gender,
race/ethnicity, etc) that is hypothesized to influence the outcome of interest.
2. Select a fixed number of subjects of each characteristic ( e.g. males or African Americans) so that
Relative frequency of characteristic in sample (e.g. 10%)
MATCHES
Relative frequency of characteristic in population (e.g. 10%)
BE540W Populations and Samples Page 14 of 33
Judgment Sampling Plan Decisions regarding inclusion or non-inclusion are left entirely to the investigator. Judgment sampling is sometimes used in conjunction with quota sampling.
Example – “Interview 10 persons aged 20-29, 10 persons aged 30-39, etc” Sample size of 100 must include 10 African Americans. Example – Market research at shopping centers
Volunteer Sampling Plan Volunteers are recruited for inclusion in the study by word of mouth, sometimes with an incentive of some sort (eg. gift certificate at a local supermarket)
Example – For a study of a new diet/exercise regime, volunteers are recruited through advertising at local clinics, health clubs, media, etc.
Problem?
BE540W Populations and Samples Page 15 of 33
Limitations of a Non-Probability Sampling Plan
They’re serious!
1. We have no idea if the sampling plan produces unbiased estimators. It probably
doesn’t. 2. Any particular sample, by using fixed selection, may be highly unrepresentative of the
target population. 3. Statistical inference, by definition based on some sort of probability model, is not
possible. 4. Regarding quota sampling
- We have no real knowledge of how subjects were selected (recall the Gallup poll example)
5. Regarding judgment sampling
- Likely, there is bias in the selection – at least for the reasons of comfort and convenience
6. Regarding volunteer sampling
- Volunteers are likely to be a “select” group for being motivated
BE540W Populations and Samples Page 16 of 33
6. Introduction to Probability Sampling Plans
The way to go.
A probability sampling plan is “out of the hands” of the investigator.
♦ Each individual has a known probability of inclusion in the sample, prior to sampling.
♦ The investigator has no discretion regarding the inclusion or exclusion of an individual
♦ This eliminates one source of potential bias – that on the part of the investigator.
How do we know if a sample is REPRESENTATIVE?
♦ Ultimately, we don’t know.
♦ So, instead, we use an unbiased sampling plan and hope for the best.
♦ In the meantime, we can generate some descriptive statistics and compare these to what we know about the population.
Simple Random Sampling is the basic probability sampling method.
BE540W Populations and Samples Page 17 of 33
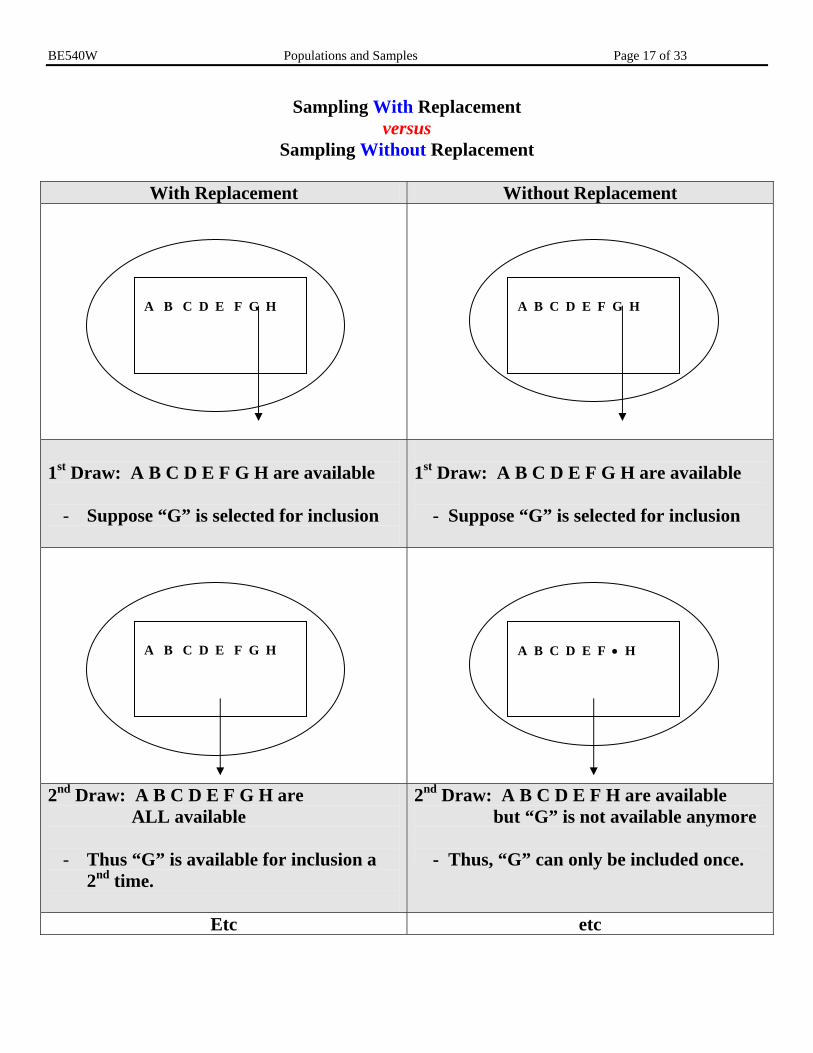
Sampling With Replacement versus
Sampling Without Replacement
With Replacement Without Replacement
1st Draw: A B C D E F G H are available
- Suppose “G” is selected for inclusion
1st Draw: A B C D E F G H are available - Suppose “G” is selected for inclusion
2nd Draw: A B C D E F G H are ALL available
- Thus “G” is available for inclusion a 2nd time.
2nd Draw: A B C D E F H are available but “G” is not available anymore - Thus, “G” can only be included once.
Etc etc
A B C D E F G H A B C D E F G H
A B C D E F G H A B C D E F • H
BE540W Populations and Samples Page 18 of 33
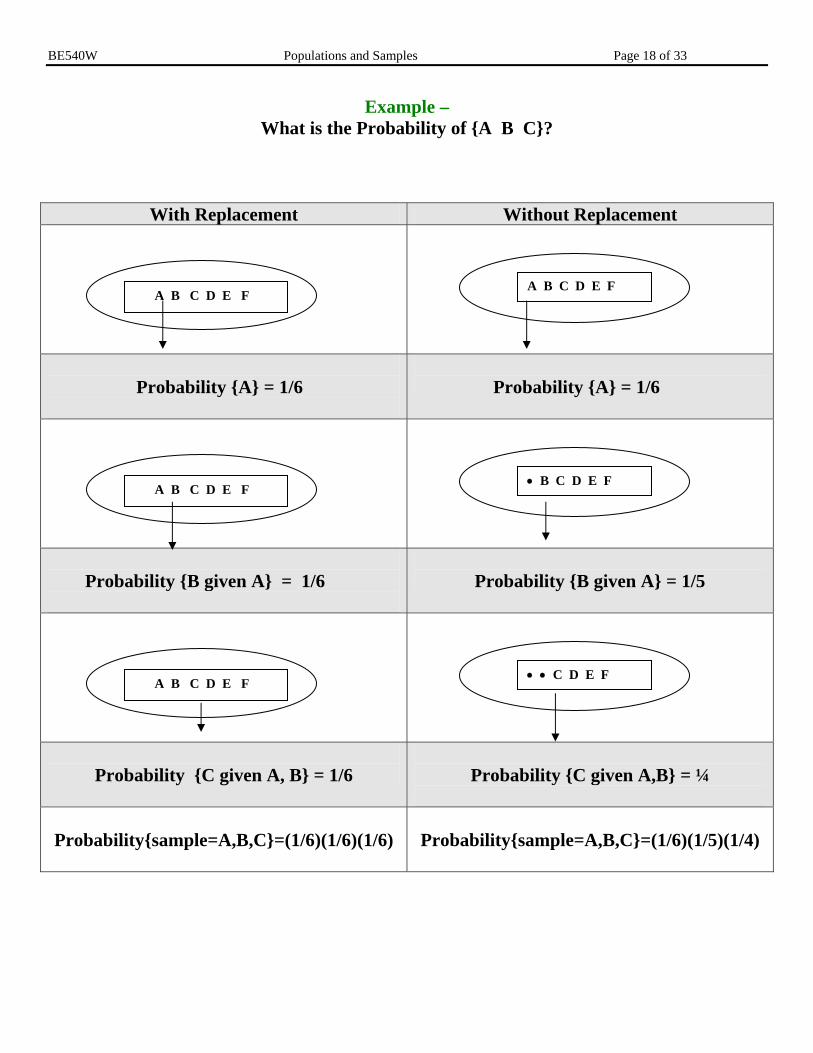
Example – What is the Probability of {A B C}?
With Replacement Without Replacement
Probability {A} = 1/6
Probability {A} = 1/6
Probability {B given A} = 1/6
Probability {B given A} = 1/5
Probability {C given A, B} = 1/6
Probability {C given A,B} = ¼
Probability{sample=A,B,C}=(1/6)(1/6)(1/6)
Probability{sample=A,B,C}=(1/6)(1/5)(1/4)
A B C D E F A B C D E F
A B C D E F • B C D E F
A B C D E F • • C D E F
BE540W Populations and Samples Page 19 of 33
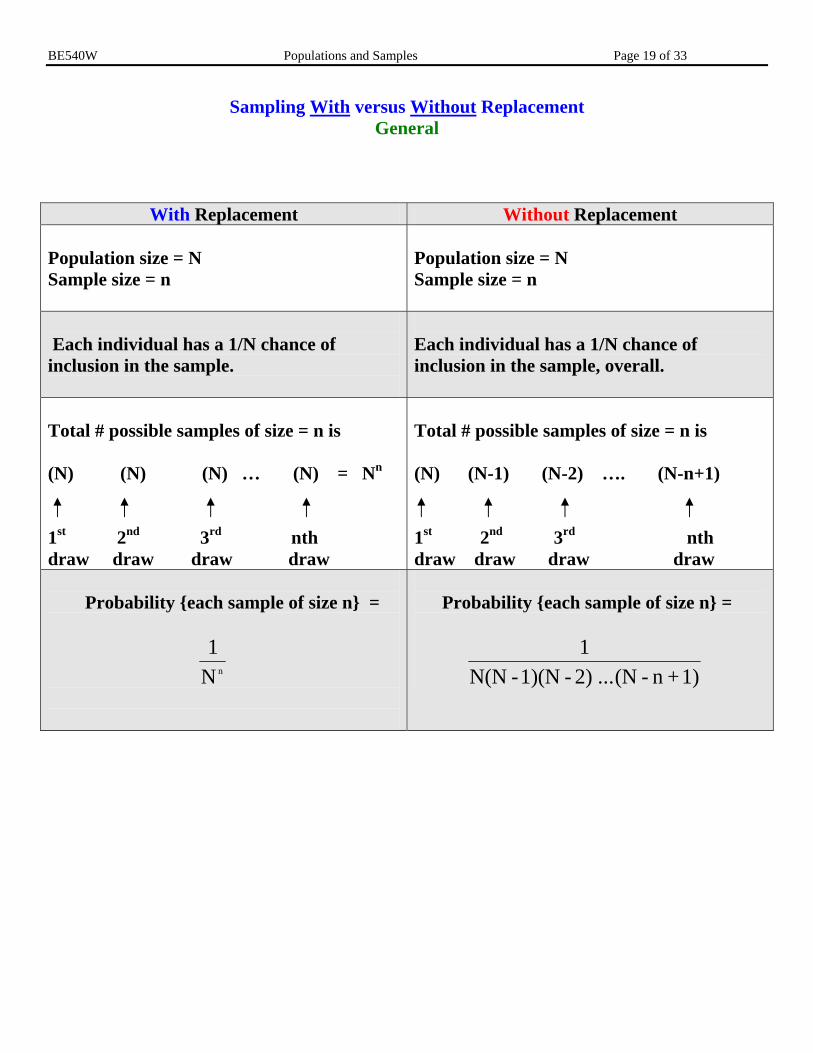
Sampling With versus Without Replacement General
With Replacement Without Replacement Population size = N Sample size = n
Population size = N Sample size = n
Each individual has a 1/N chance of inclusion in the sample.
Each individual has a 1/N chance of inclusion in the sample, overall.
Total # possible samples of size = n is (N) (N) (N) … (N) = Nn 1st 2nd 3rd nth draw draw draw draw
Total # possible samples of size = n is (N) (N-1) (N-2) …. (N-n+1) 1st 2nd 3rd nth draw draw draw draw
Probability {each sample of size n} =
1
N n
Probability {each sample of size n} =
1
N(N -1)(N - 2) ...(N - n +1)
BE540W Populations and Samples Page 20 of 33
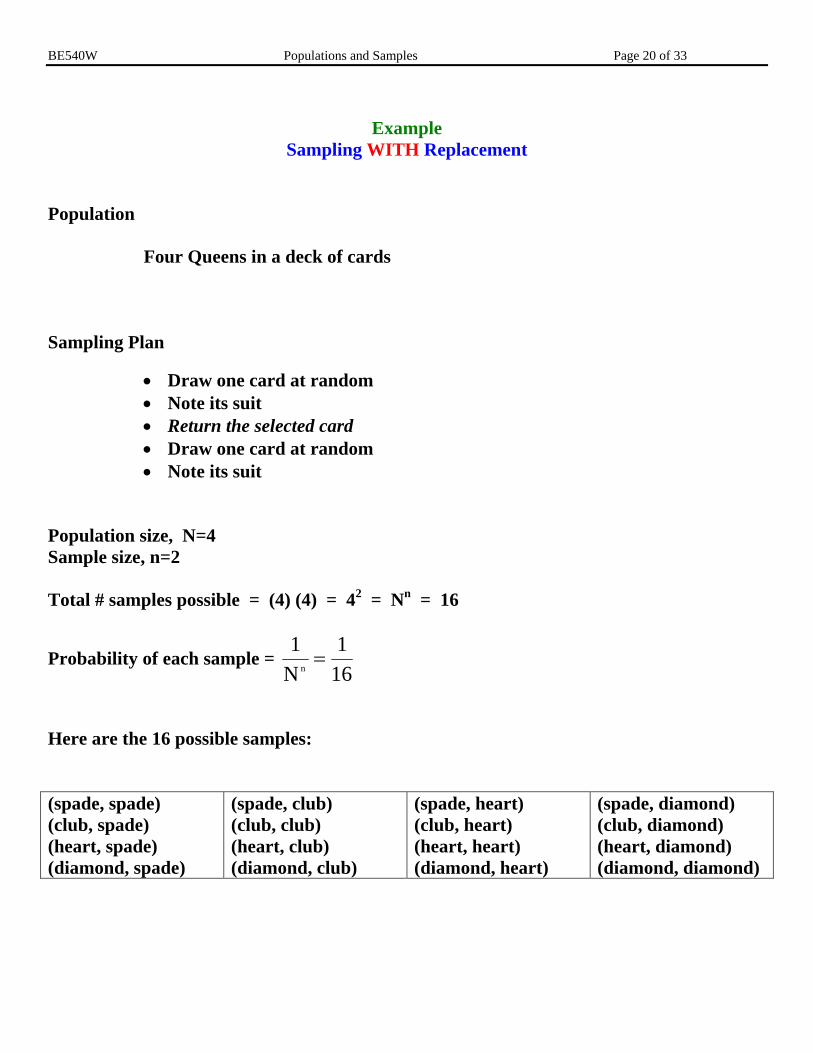
Example
Sampling WITH Replacement
Population
Four Queens in a deck of cards
Sampling Plan
• Draw one card at random • Note its suit • Return the selected card • Draw one card at random • Note its suit
Population size, N=4 Sample size, n=2 Total # samples possible = (4) (4) = 42 = Nn = 16
Probability of each sample = 1 1
16N n=
Here are the 16 possible samples: (spade, spade) (club, spade) (heart, spade) (diamond, spade)
(spade, club) (club, club) (heart, club) (diamond, club)
(spade, heart) (club, heart) (heart, heart) (diamond, heart)
(spade, diamond) (club, diamond) (heart, diamond) (diamond, diamond)
BE540W Populations and Samples Page 21 of 33
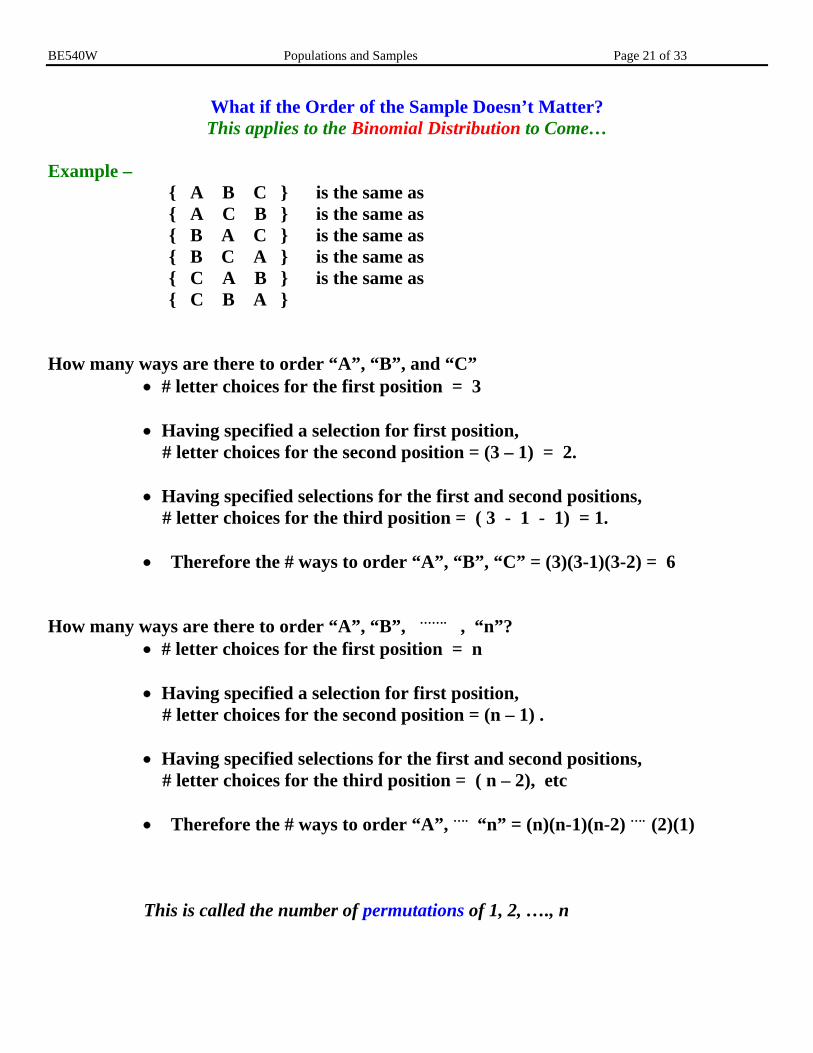
What if the Order of the Sample Doesn’t Matter? This applies to the Binomial Distribution to Come…
Example – { A B C } is the same as { A C B } is the same as { B A C } is the same as { B C A } is the same as { C A B } is the same as { C B A } How many ways are there to order “A”, “B”, and “C”
• # letter choices for the first position = 3 • Having specified a selection for first position, # letter choices for the second position = (3 – 1) = 2. • Having specified selections for the first and second positions, # letter choices for the third position = ( 3 - 1 - 1) = 1. • Therefore the # ways to order “A”, “B”, “C” = (3)(3-1)(3-2) = 6
How many ways are there to order “A”, “B”, ……. , “n”?
• # letter choices for the first position = n • Having specified a selection for first position, # letter choices for the second position = (n – 1) . • Having specified selections for the first and second positions, # letter choices for the third position = ( n – 2), etc • Therefore the # ways to order “A”, …. “n” = (n)(n-1)(n-2) …. (2)(1) This is called the number of permutations of 1, 2, …., n
BE540W Populations and Samples Page 22 of 33
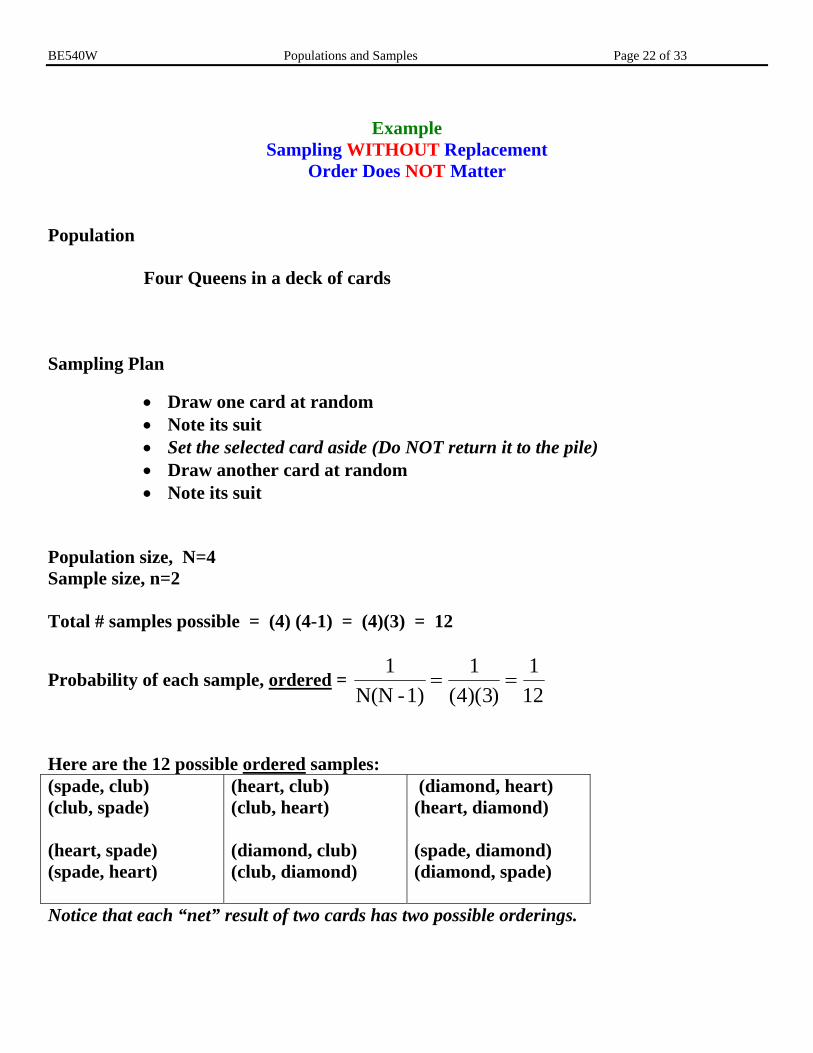
Example
Sampling WITHOUT Replacement Order Does NOT Matter
Population
Four Queens in a deck of cards
Sampling Plan
• Draw one card at random • Note its suit • Set the selected card aside (Do NOT return it to the pile) • Draw another card at random • Note its suit
Population size, N=4 Sample size, n=2 Total # samples possible = (4) (4-1) = (4)(3) = 12
Probability of each sample, ordered = 1 1
4 31
12N(N -1)= =
( )( )
Here are the 12 possible ordered samples: (spade, club) (club, spade) (heart, spade) (spade, heart)
(heart, club) (club, heart) (diamond, club) (club, diamond)
(diamond, heart) (heart, diamond) (spade, diamond) (diamond, spade)
Notice that each “net” result of two cards has two possible orderings.
BE540W Populations and Samples Page 23 of 33
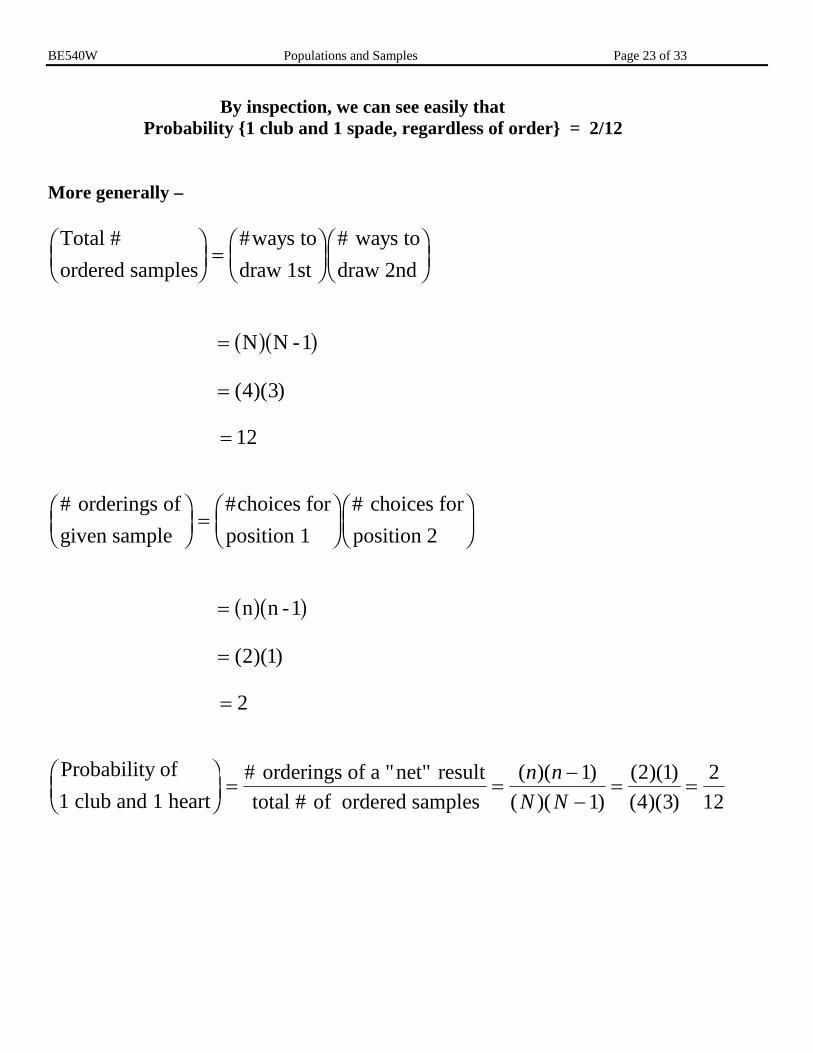
By inspection, we can see easily that Probability {1 club and 1 spade, regardless of order} = 2/12
More generally –
Total #ordered samples
ways todraw 1st
# ways todraw 2nd
FHG
IKJ =FHG
IKJFHG
IKJ
#
= N N -1a fa f = ( )( )4 3
= 12
# orderings ofgiven sample
choices forposition 1
# choices forposition 2
FHG
IKJ =FHG
IKJFHG
IKJ
#
= n n -1a fa f = ( )( )2 1
= 2
Probability of 1 club and 1 heart
# orderings of a "net" resulttotal # of ordered samples
FHG
IKJ = =
−−
= =( )( )
( )( )( )( )( )( )
n nN N
11
2 14 3
212
BE540W Populations and Samples Page 24 of 33
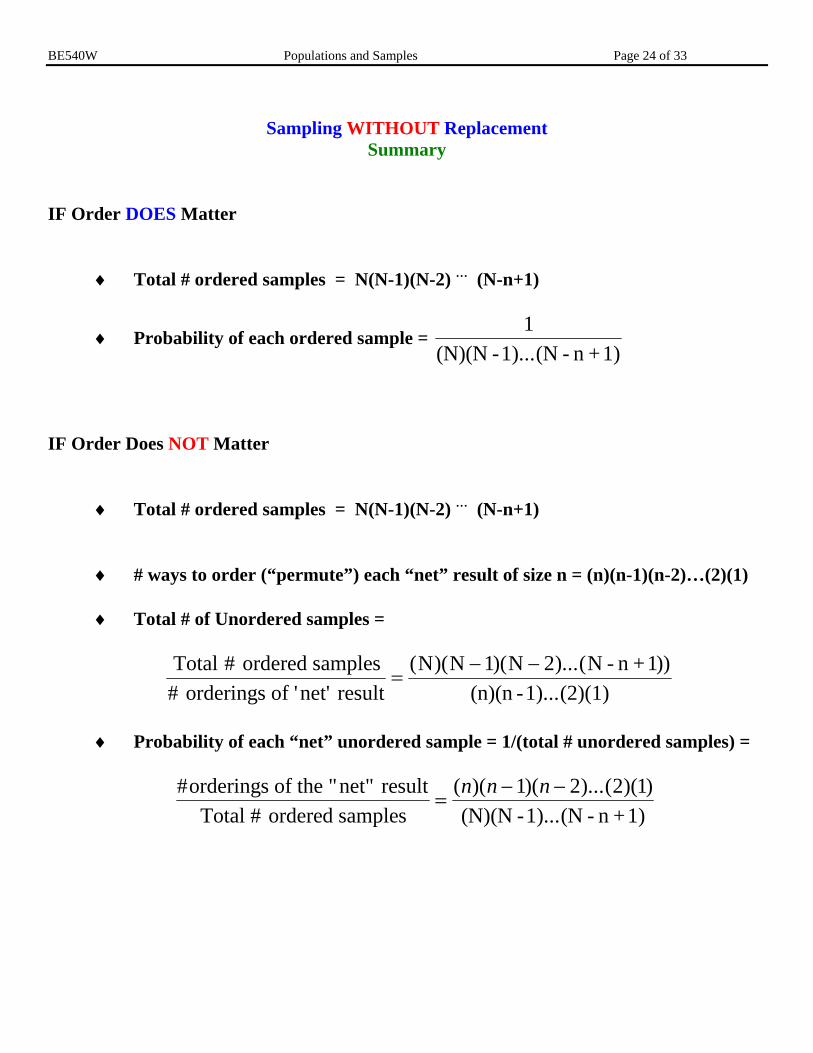
Sampling WITHOUT Replacement
Summary
IF Order DOES Matter
♦ Total # ordered samples = N(N-1)(N-2) … (N-n+1)
♦ Probability of each ordered sample = 1
(N)(N -1)...(N - n +1)
IF Order Does NOT Matter
♦ Total # ordered samples = N(N-1)(N-2) … (N-n+1)
♦ # ways to order (“permute”) each “net” result of size n = (n)(n-1)(n-2)…(2)(1)
♦ Total # of Unordered samples =
Total ordered samples
# orderings of 'net' resultN N N N - n +1
(n)(n -1)...(2)(1)# ( )( )( )...( ))
=− −1 2
♦ Probability of each “net” unordered sample = 1/(total # unordered samples) =
# ( )( )( )...( )( )orderings of the "net" result
Total # ordered samples (N)(N -1)...(N - n +1)=
− −n n n1 2 2 1
BE540W Populations and Samples Page 25 of 33
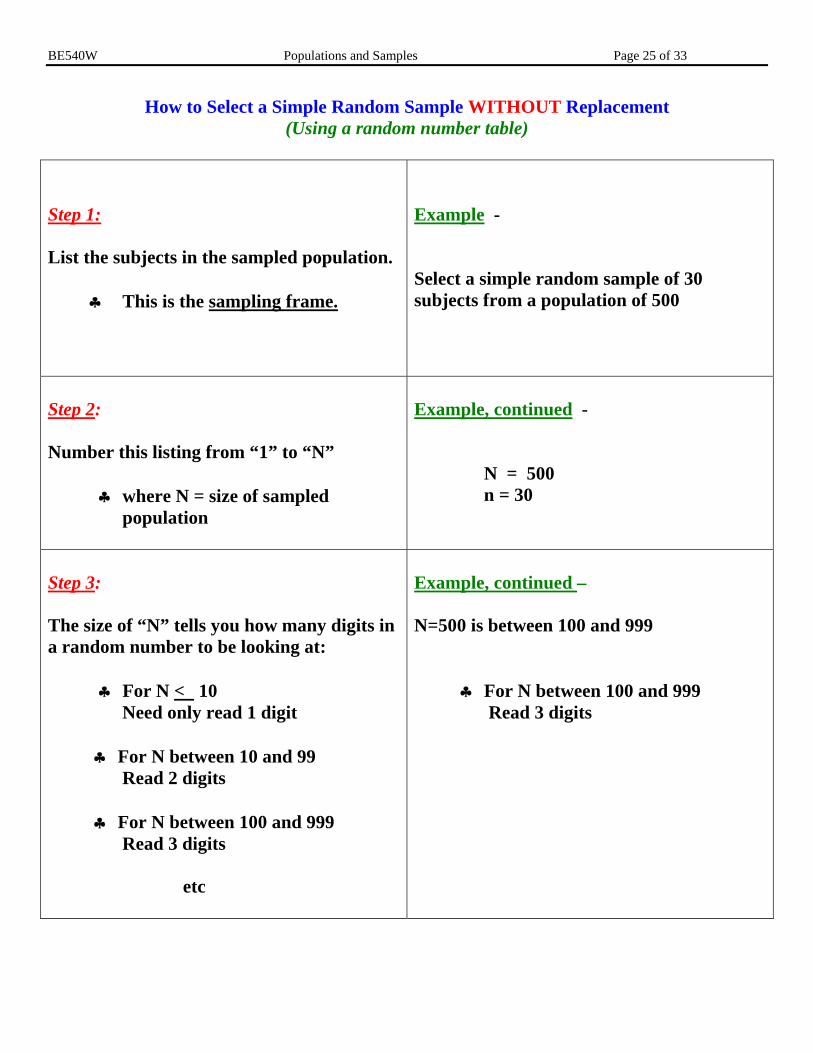
How to Select a Simple Random Sample WITHOUT Replacement (Using a random number table)
Step 1: List the subjects in the sampled population. ♣ This is the sampling frame.
Example - Select a simple random sample of 30 subjects from a population of 500
Step 2: Number this listing from “1” to “N” ♣ where N = size of sampled population
Example, continued - N = 500 n = 30
Step 3: The size of “N” tells you how many digits in a random number to be looking at: ♣ For N < 10 Need only read 1 digit ♣ For N between 10 and 99 Read 2 digits ♣ For N between 100 and 999 Read 3 digits etc
Example, continued – N=500 is between 100 and 999 ♣ For N between 100 and 999 Read 3 digits
BE540W Populations and Samples Page 26 of 33
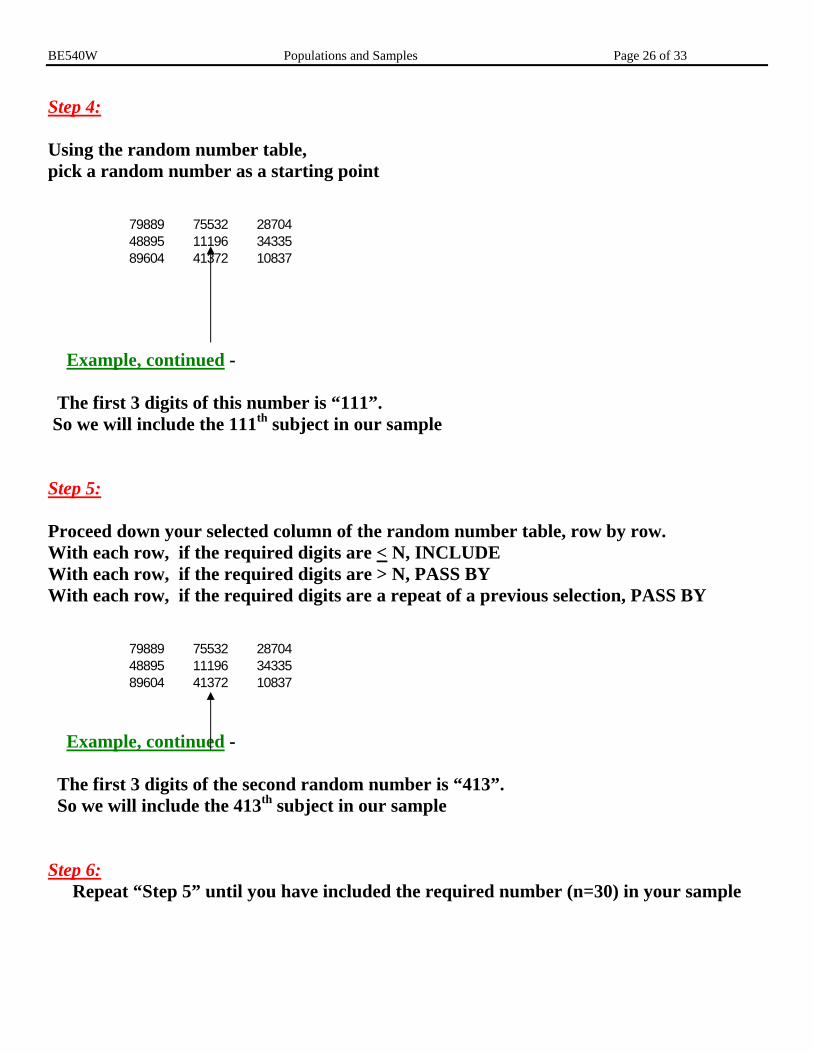
Step 4: Using the random number table, pick a random number as a starting point
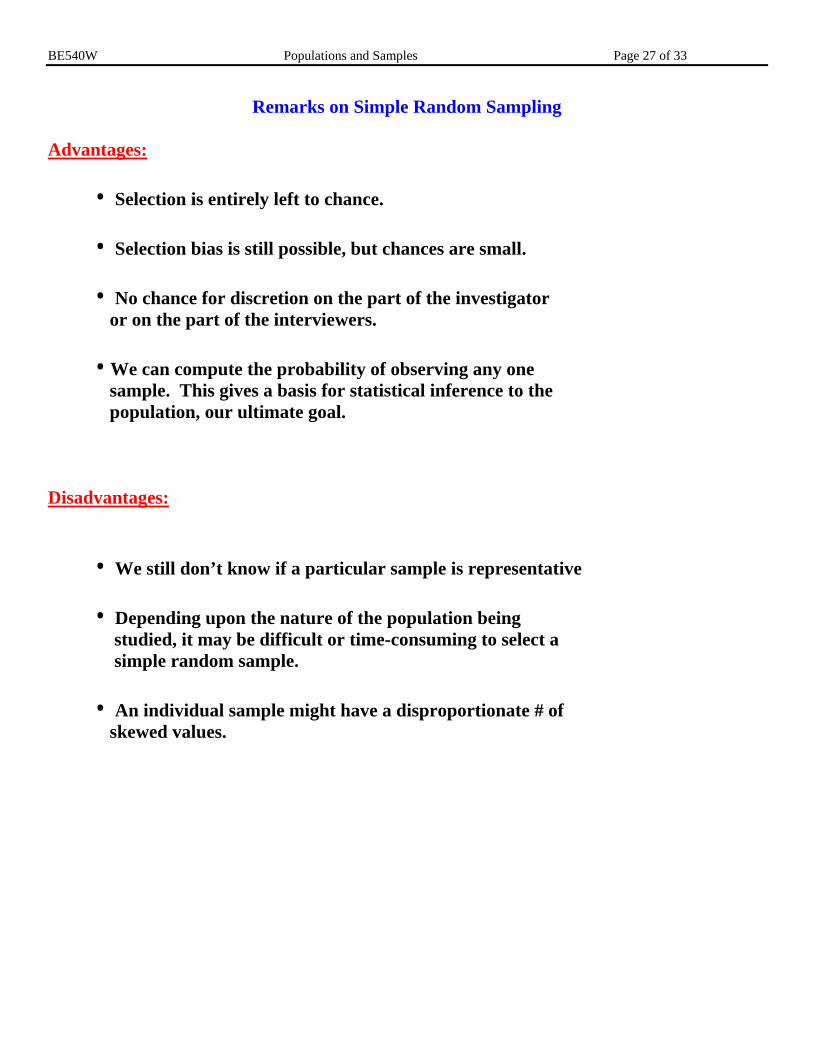
Example, continued - The first 3 digits of this number is “111”. So we will include the 111th subject in our sample Step 5: Proceed down your selected column of the random number table, row by row. With each row, if the required digits are < N, INCLUDE With each row, if the required digits are > N, PASS BY With each row, if the required digits are a repeat of a previous selection, PASS BY
Example, continued - The first 3 digits of the second random number is “413”. So we will include the 413th subject in our sample Step 6:
Repeat “Step 5” until you have included the required number (n=30) in your sample
79889 75532 2870448895 11196 3433589604 41372 10837
79889 75532 2870448895 11196 3433589604 41372 10837
BE540W Populations and Samples Page 27 of 33
Remarks on Simple Random Sampling Advantages:
• Selection is entirely left to chance. • Selection bias is still possible, but chances are small. • No chance for discretion on the part of the investigator or on the part of the interviewers. •We can compute the probability of observing any one sample. This gives a basis for statistical inference to the population, our ultimate goal.
Disadvantages:
• We still don’t know if a particular sample is representative • Depending upon the nature of the population being studied, it may be difficult or time-consuming to select a simple random sample. • An individual sample might have a disproportionate # of skewed values.
BE540W Populations and Samples Page 28 of 33
7. Some Other Probability Sampling Plans
♦ Systematic
♦ Stratified ♦ Multi-stage Systematic Sampling
• Population size = N • Desired is an (n/N) = X, or a 100X% sample • Pick the first item by simple random sampling. . Thereafter, select every (1/X)th item Example: n=20, N=100 (n/N) = 20/100 = .05 or X=.05, for a 100(.05)=5% sample select 1/.05=20, or every 20th item . Probability an item is included on the 1ST draw = 1/N = .01 . Given the 1ST item has been drawn, probability an item is included on any other
draw is 0 or 1. Example – Suppose we want a sample of size n=100 from the N=1000 medical charts in a clinic office. Pick the 1ST chart by simple random sampling. n/N = 100/1000 = .10 1/.10 = 10 Thereafter, select every 10th chart.
BE540W Populations and Samples Page 29 of 33
Remarks on Systematic Sampling Advantages:
• It’s easy. • Depending on the listing, the sampled items are more evenly distributed. • As long as there is no association with the order of the listing and the characteristic under study, this should yield a representative sample.
Disadvantage:
•If the sampling frame has periodicities (a regular pattern) and the rule for systematic sampling happens to coincide, the resulting sample may not be representative.
Example of a Periodicity that Results in a Biased Sample: • Clinic scheduling sets up 15 minute appointments with physicians • Leaves time for an emergency, or walk-in visit at 15 minutes before the hour, every hour.
• Doing a chart-audit, you sample every 4th visit and get only the emergency visits selected into the sample, or else none of them.
BE540W Populations and Samples Page 30 of 33
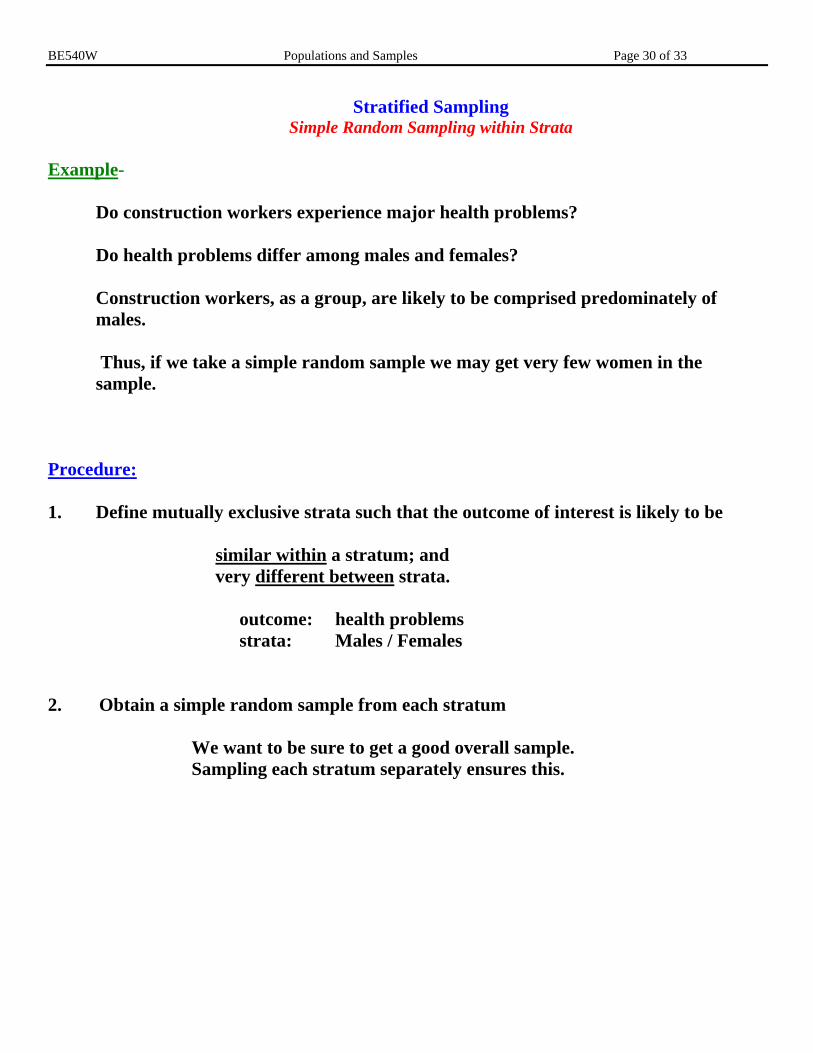
Stratified Sampling Simple Random Sampling within Strata
Example-
Do construction workers experience major health problems? Do health problems differ among males and females? Construction workers, as a group, are likely to be comprised predominately of males. Thus, if we take a simple random sample we may get very few women in the sample.
Procedure: 1. Define mutually exclusive strata such that the outcome of interest is likely to be similar within a stratum; and very different between strata.
outcome: health problems strata: Males / Females
2. Obtain a simple random sample from each stratum We want to be sure to get a good overall sample. Sampling each stratum separately ensures this.
BE540W Populations and Samples Page 31 of 33
Remarks on Stratified Sampling
Advantage:
• Good when population has high variability, especially when the population includes a mix of people (eg. males and females) that are NOT similarly represented (eg. population is disproportionately male)
Take care:
• Strata MUST be mutually exclusive and exhaustive • To compute an overall population estimate requires use of weights that correspond to representation in the population. Following is an example.
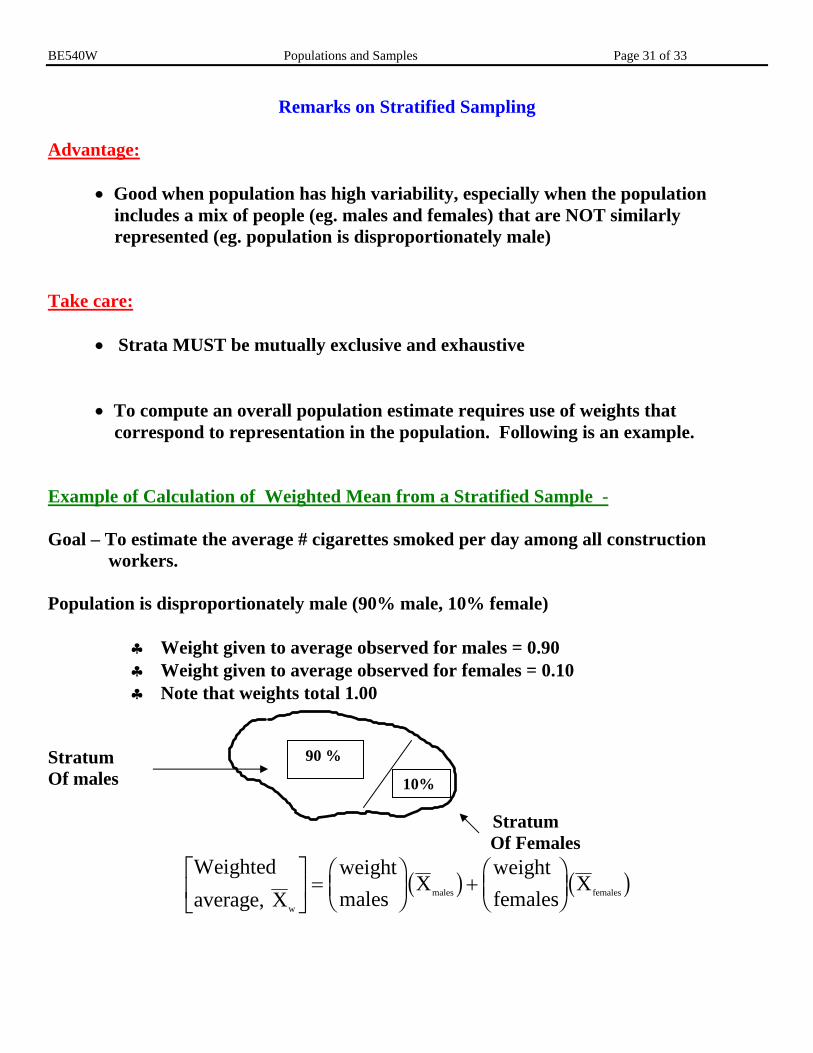
Example of Calculation of Weighted Mean from a Stratified Sample -
Goal – To estimate the average # cigarettes smoked per day among all construction workers. Population is disproportionately male (90% male, 10% female)
♣ Weight given to average observed for males = 0.90 ♣ Weight given to average observed for females = 0.10 ♣ Note that weights total 1.00
Stratum Of males
Stratum Of Females
Weightedaverage, X
weightmales
Xweightfemales
Xw
males females
LNM
OQP =FHG
IKJ +
FHG
IKJb g b g
90 %
10%
BE540W Populations and Samples Page 32 of 33
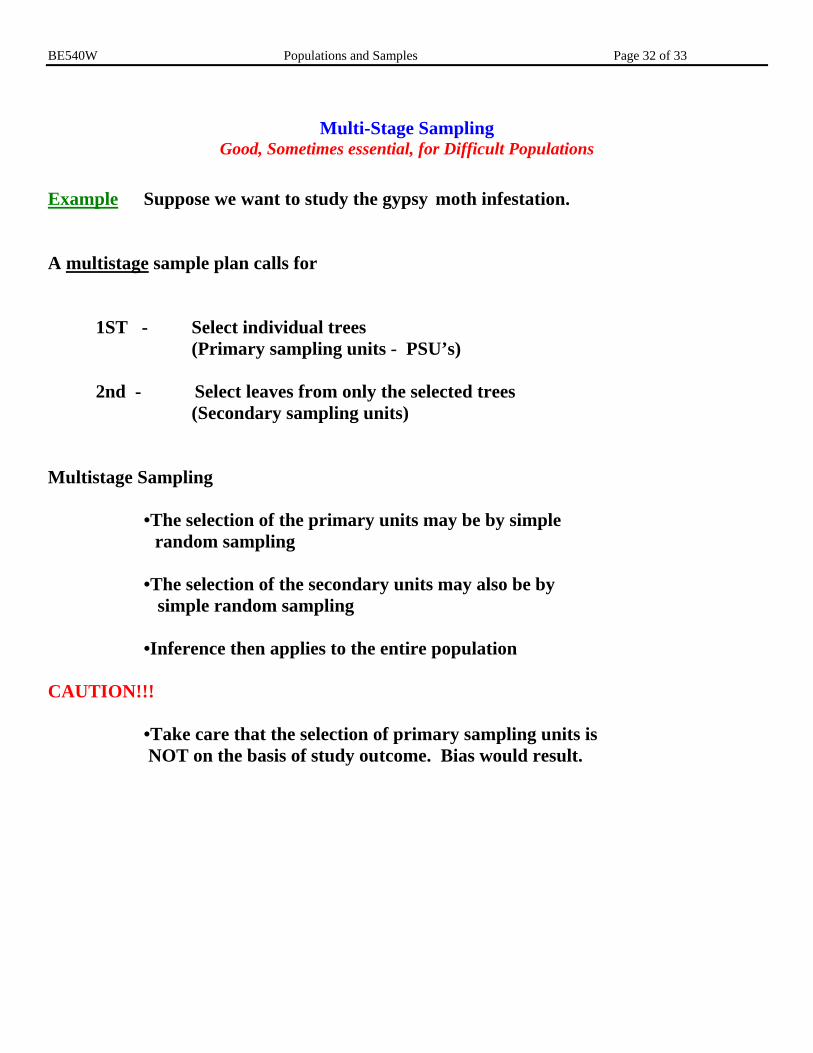
Multi-Stage Sampling
Good, Sometimes essential, for Difficult Populations
Example Suppose we want to study the gypsy moth infestation. A multistage sample plan calls for 1ST - Select individual trees (Primary sampling units - PSU’s) 2nd - Select leaves from only the selected trees (Secondary sampling units) Multistage Sampling
•The selection of the primary units may be by simple random sampling
•The selection of the secondary units may also be by simple random sampling •Inference then applies to the entire population
CAUTION!!!
•Take care that the selection of primary sampling units is NOT on the basis of study outcome. Bias would result.
BE540W Populations and Samples Page 33 of 33
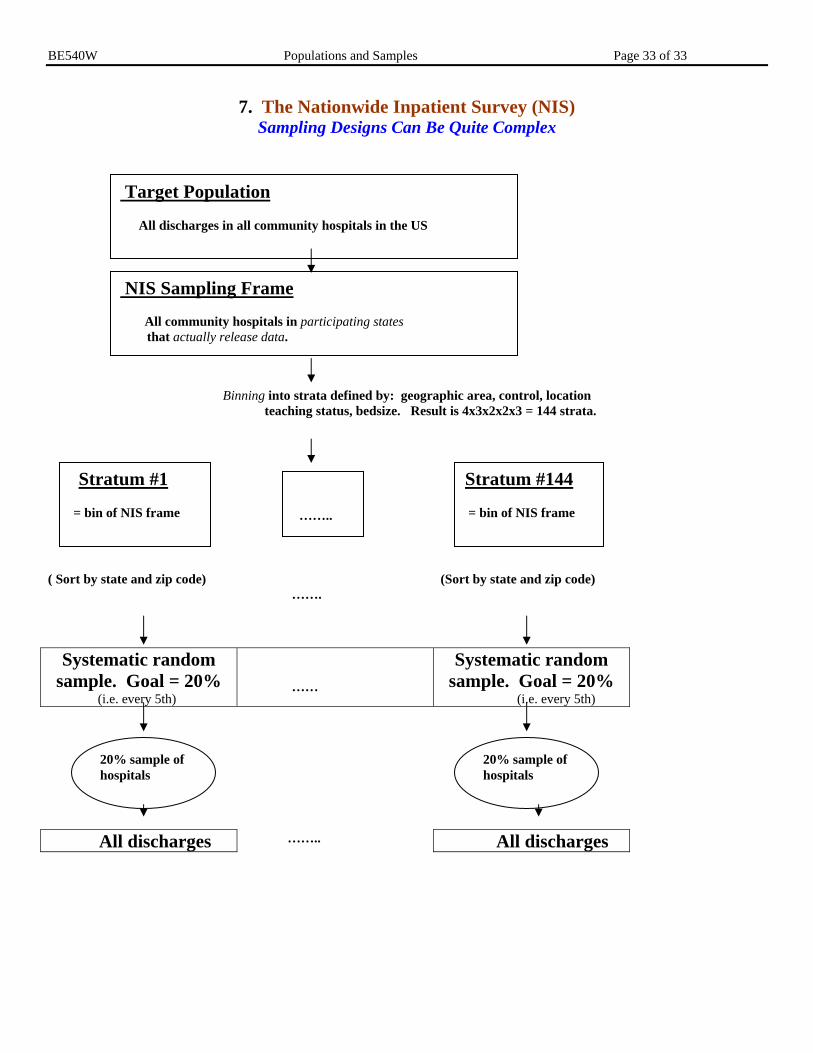
7. The Nationwide Inpatient Survey (NIS) Sampling Designs Can Be Quite Complex
Binning into strata defined by: geographic area, control, location teaching status, bedsize. Result is 4x3x2x2x3 = 144 strata.
( Sort by state and zip code)
……. (Sort by state and zip code)
Systematic random sample. Goal = 20%
(i.e. every 5th)
……
Systematic random sample. Goal = 20%
(i.e. every 5th)
All discharges …….. All discharges
Target Population
All discharges in all community hospitals in the US
NIS Sampling Frame
All community hospitals in participating states that actually release data.
Stratum #1 = bin of NIS frame
……..
Stratum #144 = bin of NIS frame
20% sample of hospitals
20% sample of hospitals