
Overinvestment When Control Separates from Ownership ... · 1 Overinvestment When Control Separates...
31
Overinvestment When Control Separates from Ownership: Evidence from China * Baizhu Chen Marshall School of Business University of Southern California Los Angeles, CA 90089 [email protected] Longbing Xu Shanghai University of Finance and Economics Shanghai, China, 200433 [email protected] Honghai Yu Nanjing University Nanjing, China, 210093 [email protected] First version: March 2009; this version: November 2009 Abstract In this paper, we study how separation of control from ownership affects overinvestment by presenting a simple model extended from La Porta et al. (2002). We show that firms with controlling shareholders whose control is more separated from ownership are likely to overinvest more, even if controlling shareholders expropriate funds for purpose of other than investment. Using over 1000 public listed companies in China from 2004-2007, we confirm this result, which points to possible inefficiency in the high investment in China’s recent history. Keywords: Controlling shareholder; Pyramidal Structure; Separation of Control from Ownership; Overinvestment; China JEL classification: G31; G34; G38 * This research was supported by National Natural Science Foundation of China (70673056, 70803027, 70873080). We would like to thank Wayne Ferson, Mingyi Hung, Chris Jones, Kevin Murphy, Jun Qian, Wei Xiong and participants of 2010 Atlanta AEA Annual Meeting for their helpful comments. The remaining errors are our own. Corresponding author: Baizhu Chen, Tel: 1-213-740-7558; fax: 1-213-740-6650, Email address: [email protected].
Transcript of Overinvestment When Control Separates from Ownership ... · 1 Overinvestment When Control Separates...
Overinvestment When Control Separates from Ownership:
Evidence from China*
Baizhu Chen
Marshall School of Business
University of Southern California
Los Angeles, CA 90089
Longbing Xu
Shanghai University of Finance and Economics
Shanghai, China, 200433
Honghai Yu
Nanjing University
Nanjing, China, 210093
First version: March 2009; this version: November 2009
Abstract In this paper, we study how separation of control from ownership
affects overinvestment by presenting a simple model extended from La Porta
et al. (2002). We show that firms with controlling shareholders whose control
is more separated from ownership are likely to overinvest more, even if
controlling shareholders expropriate funds for purpose of other than
investment. Using over 1000 public listed companies in China from
2004-2007, we confirm this result, which points to possible inefficiency in the
high investment in China’s recent history.
Keywords: Controlling shareholder; Pyramidal Structure; Separation of
Control from Ownership; Overinvestment; China
JEL classification: G31; G34; G38
* This research was supported by National Natural Science Foundation of China (70673056,
70803027, 70873080). We would like to thank Wayne Ferson, Mingyi Hung, Chris Jones, Kevin
Murphy, Jun Qian, Wei Xiong and participants of 2010 Atlanta AEA Annual Meeting for their
helpful comments. The remaining errors are our own. Corresponding author: Baizhu Chen, Tel: 1-213-740-7558; fax: 1-213-740-6650, Email address:
1
Overinvestment When Control Separates from Ownership:
Evidence from China
Abstract In this paper, we study how separation of control from ownership affects
overinvestment by presenting a simple model extended from La Porta et al. (2002).
We show that firms with controlling shareholders whose control is more separated
from ownership are likely to overinvest more, even if controlling shareholders
expropriate funds for purpose of other than investment. Using over 1000 publicly
listed companies in China from 2004-2007, we confirm this result, which points to
possible inefficiency in the high investment in China’s recent history.
Keywords: Controlling shareholder; Pyramidal Structure; Separation of Control from
Ownership; Overinvestment; China
JEL classification: G31; G34; G38
2
I. Introduction
Recent studies have shown that most publicly traded companies in
countries without good legal protection of minority shareholders are often not widely
held, but rather have controlling shareholders (La Porta et al., 1999). Even in the
United States, there are several hundred publicly traded firms with shareholders of
more than 51 percent (Holderness and Sheehan, 1988). Significant share
concentration of ownership is also observed in other developed nations, such as
Germany (Gorton and Schmid, 1996), Japan (Prowse, 1992), and Italy (Barca, 1995).
The existence of controlling shareholders is a more widely prevalent phenomenon in
developing countries where protection of minority shareholders is absent or poor
(Claessens et al., 2000). The controlling shareholder in these companies, typically an
individual, a family or the state, often controls a large number of firms in a pyramidal
structure. This pyramidal structure allows the controlling shareholder to achieve the
ultimate control of a company through a chain of ownership relations. This structure
also allows the shareholder to achieve effective control of the company with much
smaller cash-flow ownership right. For example, a shareholder that directly controls
51% of firm A which in turn controls 51% of firm B achieves effective control of firm
B with only 26% of cash flow right.
In a widely held corporation in which the ownership is separated from
management, the central agency issue is the failure of managers to look after the
interest of shareholders. Numerous studies have focused on how to design a
mechanism to align the interest of management with that of shareholders (e.g., Jensen
and Meckling, 1976; Myers and Majluf, 1984; Grossman and Hart, 1988; Harris and
Raviv, 1988). The existence of controlling shareholders has changed the central
agency problem. In most countries, many publicly traded companies that shares are
highly concentrated are often managed directly by controlling shareholders or by
managers whom are closely monitored and designated by controlling shareholders.
The agency problem in this context is no longer the expropriation of shareholders by
managers, but rather the likelihood of controlling shareholders to expropriate minority

3
or creditors, often legally (Shleifer and Vishny, 1997).
The essence of the agency problem when shares are highly concentrated is
the separation of control from ownership of the controlling shareholders. A controlling
shareholder can be viewed as serving dual roles: first as the shareholder and second as
the manager. The separation of control from ownership splits the interest as the
manager from the shareholder. The larger the ownership of a company, the less the
incentive the controlling shareholder has to expropriate other investors because doing
so, though generates private benefits, would reduce the cash flow that the controlling
shareholder is entitled to. This is the same incentive effect emphasized by Jensen and
Meckling (1976) to minimize the agency cost by making managers owning some
portions of a company. However in many countries the largest shareholder establishes
effective control over a company despite a substantial smaller cash flow right using a
pyramidal structure. In such a structure, the controlling shareholder may have a strong
incentive to expropriate other investors by diverting funds for her private benefits,
which is referred to as “tunneling” by Johnson et al. (2000). Tunneling, also called
stealing in this paper, can take the form of outright theft or fraud. It can also take any
form of cash extracting transactions, such as transfer pricing advantageous to the
controlling shareholder, excessive executive compensation, transferring assets to other
connected companies under control, diluting the interest of minority shareholders, and
so on. Several studies report direct evidence of expropriation of minority shareholders
by examining data of connected transactions between companies listed in India
(Bertrand et al., 2002) , Korea (Bae et al., 2002), and Hong Kong (Cheung et al., 2006)
and their controlling shareholders.
In this paper, we study how tunneling by controlling shareholders results
in overinvestment, which is an additional cost on top of tunneling to firms. We extend
a simple model developed by La Porta et al. (2002), by explicitly including the
separation of voting right and ownership. In this model, the controlling shareholder
whose ownership in a firm is only a fraction of her voting right decides on the fund to
be expropriated to maximize the value derived from her entitled cash dividend and
private benefit of stolen funds net of cost of stealing. We show in this model that as
4
long as the marginal private benefit of expropriated fund exceeds the controlling
shareholder’s ownership share, firm will overinvest, even if the expropriated fund is
used for other purposes. This is because, with her ownership being a small portion of
her voting right, the controlling shareholder shoulders only a fraction of total
investment cost. The fund expropriated for her private benefits, however, augments
the controlling shareholder’s expected investment return. Therefore, a firm that is
controlled by a shareholder whose private benefit of expropriated funds exceeds her
ownership share in the firm is likely to invest more than the amount which maximizes
the firm value. Further, we demonstrate that firm overinvests more if the separation
ratio between ownership and control becomes larger.
Using over 1000 Chinese firms listed on both Shanghai and Shenzhen
stock exchanges, we then evaluate how separation between ownership and control
affects overinvestment. China is a particular interesting case for studying the
tunneling phenomenon. As a transitional economy, most of its firms started as the
State Owned Enterprises (SOEs) in which the state is the dominant shareholder. As
economic reform deepens, many have transformed to different ownership structures.
Today, most of these firms still have a highly concentrated ownership structure, with
either the state, or local government, or private family being the controlling
shareholder. However, as a legacy problem, the controlling shareholders in many
Chinese firms often own block non-tradable shares, which effectively limits their
abilities to take advantage of price appreciation. Naturally this increases the incentive
for the controlling shareholders to expropriate funds via a complex pyramidal
structure. Jiang, Lee and Yue (2005) documents evidence of tunneling when block
shareholder’s controlling right is significantly larger than her ownership right. Fan,
Wong, and Zhang (2005) explains why different types of owners in China decide
using pyramidal structure to control their firms. Wei, Xie and Zhang (2005) shows
that state and institutional ownerships of China’s partially privatized firms are
negatively related to the values of these firms. Sheng (2009), using 156 Chinese
publicly-listed firms between 2002 and 2007, finds that the divergence of control
rights and cash flow rights leads to lower firm value. In this study, we point out that

5
overinvestment is an important source of value destruction in a pyramidal structure.
Second, the co-existence of state and private ownerships provides an ideal test ground
to compare which type of ownership structure is more conducive to tunneling. Third,
our study of overinvestment by Chinese firms provides an interesting explanation for
China’s high investment. A widely cited study by Kuijs (2005) finds that China’s high
total investment is mainly due to enterprises, while investment by household and
government are steady and comparable to other nations. To the extent that the
separation of ownership and control of Chinese enterprises results in overinvestment,
our study points to the potential source of inefficiency in China’s capital formation.
We find that the separation of ownership and control has a significant
effect on overinvestment. Our estimate indicates that for every one unit of increase in
the ratio of control to ownership right leads to about 0.0066 unit increase in
overinvestment-total asset ratio. This implies that on average a Chinese firm
overinvests about $3.8 million relative to a company without separation of ownership
and control rights. Given that our sample firms on average make about 336 million
Yuan or about $50 million new investment a year, this implies that the overinvestment
due to pyramid structure of control is more than 7.5 percent of annual new capital
spending. We also find that companies with a larger free cash flow tend to overinvest.
Private enterprises, due to external financing constraints, tend to make more
overinvestment than central or local government owned firms, particularly for those
firms with private entities controlling with small ownership. Chen et al. (2008) argues
that transferring of control from the state to private owners will improve profitability.
Our result points out on the other hand that with external financing constraints,
privatization of state ownership may instead reduce the value of the firms. None of
the corporate governance measures, however, is found to be significant in
constraining overinvestment.
Our work contributes to the current literature on corporate pyramidal
structure in an important way. Many studies (for example, Clasessens et al., 2002; La
Porta et al., 2002; Shleifer and Wolfenzon, 2002) have shown that pyramidal
ownership structure results in lower firm value as capital market understands that

6
resources are likely to be tunneled by controlling shareholders for private benefits. We
show that separation of control from ownership in a pyramidal structure is likely to
cause overinvestment, which we quantify using China’s publicly listed companies.
The inefficient capital formation due to overinvestment is an additional important
cause for value destruction on top of resources expropriated by controlling
shareholders. To our knowledge, our paper is the first to quantify the relationship
between overinvestment and pyramidal structure.
We present our model in Section II. Section III describes the data. Section
IV presents our empirical results. We provide further empirical analyses in Section V
to show the robustness of our results. Section VI concludes.
II. A Simple Model
In this section, we extend a simple model used by La Porta et al. (2002)
and Johnson et al. (2000) by explicitly including the separation of cash flow right and
voting. We are interested in seeing how the separation of ownership and control of a
controlling shareholder affects the investment decision.
We assume that there is a controlling shareholder whose cash flow or
equity ownership in the firm is , which is assumed to be exogenously determined by
the history. The controlling shareholder typically controls a much larger voting right
of the firm through a pyramidal ownership structure (La Porta et al. 1999). We assume
that the voting right v of this controlling shareholder is a multiplier of her cash flow
right, 𝑣 = 𝑡𝛼, where 𝑡 ≥ 1. 𝑡, called separation ratio, is the ratio of voting right to
cash flow right, which measures the separation of ownership from control.
The firm has an amount of free cash flow, 𝐼, which is used for investment
in a project wholly. The investment is risky and there are two states of nature: high
return 𝑅ℎ with probability 𝑃, and low return 𝑅𝑙 with probability 1 − 𝑃. We assume
that 𝑅ℎ> 𝐼 > 𝑅𝑙
For simplicity, we assume that the firm does not have any cost so the profit
is 𝑅, which is either 𝑅ℎ or 𝑅𝑙 depending on the states of nature. A portion s of the

7
profits is “stolen”, a term we use for diverting or tunneling, from the firm by the
controlling shareholder to herself so the rest (1-s)R is distributed as dividends. The
tunneling can take the form of excessive executive compensation, favorable
contractual pricing agreement with connected firms, subsidized personal loans, and so
on. Such stealing of funds, though often legal in many countries, usually involves
costly transactions, such as paying off others to maintain a good image, or setting up
connected companies to carry out the transaction. We label 𝐶 𝑠, 𝑘, 𝑣 as a portion of
revenue to be wasted due to expropriation, where k is a parameter measuring the
quality of corporate governance. Therefore the total cost of expropriation
is 𝐶 𝑠, 𝑘, 𝑣 𝑅. We assume that 𝐶𝑠 > 0, 𝐶𝑘 > 0, 𝐶𝑣 < 0. The first inequality says that
the marginal cost of stealing is positive. The second inequality implies that the better
the corporate governance system is, the costlier it is to steal as more resource needs to
be wasted to expropriate a given share of profits. Unlike previous studies (La Porta et
al., 2002, Johnson et al. 2000), we include voting right in the cost function of theft,
which allows us to study how the separation of ownership and control impacts
corporate investment decision. The third inequality suggests that a higher degree of
control makes it easier for the controlling shareholder to steal and thus cost-of-theft is
lower. We also assume that the marginal cost of stealing is an increasing function of
stealing, 𝐶𝑠𝑠 > 0 and 𝐶 = 0, when 𝑠 = 0, i.e., the cost-of-theft is zero when there is
no tunneling.
For every dollar expropriated, the controlling shareholder receives some
private benefits. m is the marginal benefit of stealing, and varies depending on the
nature of the controlling shareholder. In many developing countries, the state owned
enterprises usually receive preferential treatment in funding while the private
businesses often face challenges of getting loans. Resource expropriated brings more
benefits if the controlling shareholder is a private enterprise. Thus, the marginal
benefit of stealing is larger if a private business rather than a state owned enterprise is
the controlling shareholder.
The controlling shareholder is assumed to be risk neutral and is to
maximize
8
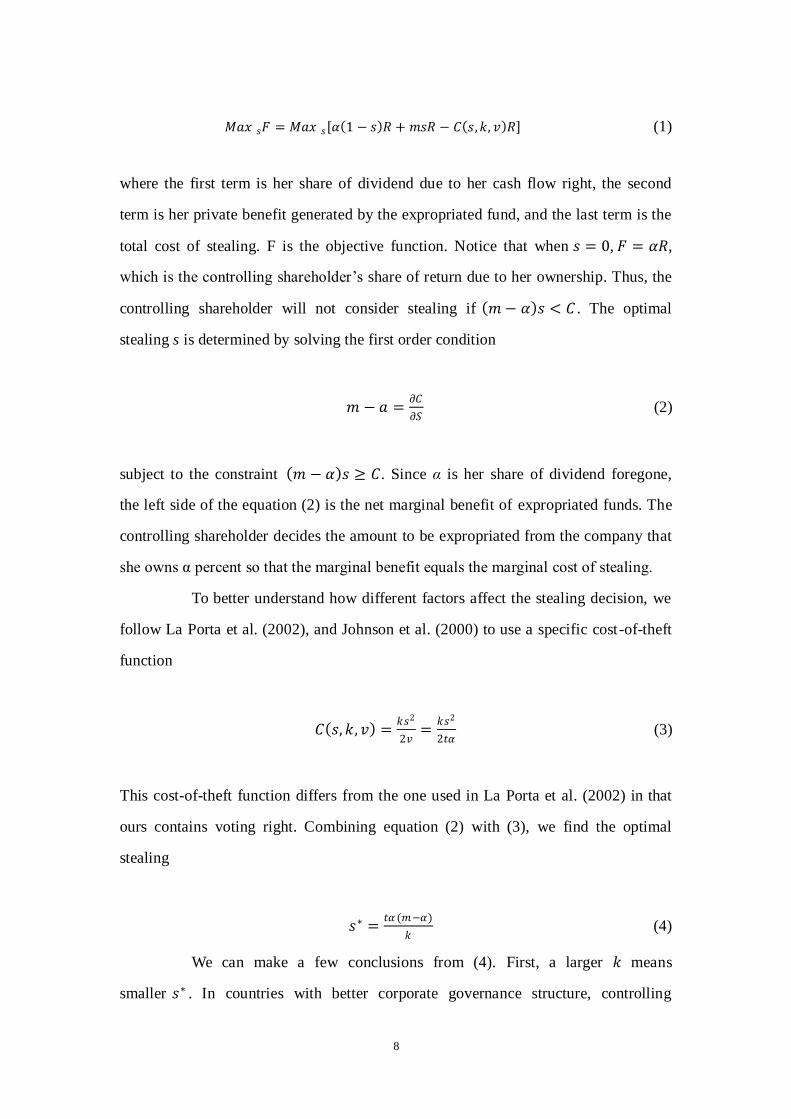
𝑀𝑎𝑥 𝐹 = 𝑀𝑎𝑥 𝛼 1 − 𝑠 𝑅 + 𝑚𝑠𝑅 − 𝐶 𝑠,𝑘, 𝑣 𝑅 𝑠𝑠 (1)
where the first term is her share of dividend due to her cash flow right, the second
term is her private benefit generated by the expropriated fund, and the last term is the
total cost of stealing. F is the objective function. Notice that when 𝑠 = 0, 𝐹 = 𝛼𝑅,
which is the controlling shareholder’s share of return due to her ownership. Thus, the
controlling shareholder will not consider stealing if 𝑚 − 𝛼 𝑠 < 𝐶 . The optimal
stealing s is determined by solving the first order condition
𝑚 − 𝑎 =𝜕𝐶
𝜕𝑆 (2)
subject to the constraint 𝑚 − 𝛼 𝑠 ≥ 𝐶. Since α is her share of dividend foregone,
the left side of the equation (2) is the net marginal benefit of expropriated funds. The
controlling shareholder decides the amount to be expropriated from the company that
she owns α percent so that the marginal benefit equals the marginal cost of stealing.
To better understand how different factors affect the stealing decision, we
follow La Porta et al. (2002), and Johnson et al. (2000) to use a specific cost-of-theft
function
𝐶 𝑠, 𝑘, 𝑣 =𝑘𝑠2
2𝑣=
𝑘𝑠2
2𝑡𝛼 (3)
This cost-of-theft function differs from the one used in La Porta et al. (2002) in that
ours contains voting right. Combining equation (2) with (3), we find the optimal
stealing
𝑠∗ =𝑡𝛼 (𝑚−𝛼)
𝑘 (4)
We can make a few conclusions from (4). First, a larger 𝑘 means
smaller 𝑠∗ . In countries with better corporate governance structure, controlling

9
shareholders choose to tunnel less funds from the companies they control. Second,
when stolen fund brings more private benefits, there is more expropriation of minority
shareholders. To the extent that private enterprises are discriminated in getting
finances from financial institutions in many developing countries, we expect that
tunneling of funds are more likely to occur in companies where the controlling
shareholders are private rather than the state owned enterprises. Third, companies of
controlling shareholders with larger separation of ownership and control will see more
funds to be expropriated. Fourth, the optimal stealing is a non-linear function of the
cash flow right. When the cash flow right is low, increasing the ownership of the
controlling shareholder encourages her to stealing more. On the other hand, if the
controlling shareholder has already owned a large share of the company, increasing
her ownership is associated with less expropriation of minority shareholders. The
reason is that increasing the controlling shareholder’s ownership has two effects. It
increases the dividend foregone due to stealing. At the same time, it lowers the
cost-of-theft because it increases her control of the company. When the cash flow
ownership is small, the first effect is dominated by the second one so that the
controlling shareholder steals more as her ownership increases. Notice that stealing is
positive as long as the private benefit from stolen fund is larger than the controlling
shareholder’s ownership in the firm.
If the manager, in this case the controlling shareholder, operates the
company in the best interest of all shareholders, she will invest in a project only if the
future expected return is larger than the total investment. That is
𝑃𝑅ℎ + 1 − 𝑃 𝑅𝑙 ≥ 𝐼 (5)
We can calculate the threshold probability
𝑃1∗ =
𝐼− 𝑅𝑙
𝑅ℎ−𝑅𝑙 (6)
which is the minimum probability of the high return state for the controlling

10
shareholder to consider to invest in this project, if maximizing all shareholders’
interest is the objective function. Investment in the project will be taken if 𝑃 > 𝑃1∗.
Of course, the controlling shareholder will only consider her own interest
when making the company’s investment decision. She will invest only if her expected
return is larger than her share of investment cost:
𝑃 𝛼 1 − 𝑠∗ + 𝑚𝑠∗ − 𝐶 𝑅ℎ + 1 − 𝑃 𝛼 1 − 𝑠∗ + 𝑚𝑠∗ − 𝐶 𝑅𝑙 ≥ 𝛼𝐼. (7)
The threshold probability for the high return state
𝑃2∗ =
𝐼−𝑅𝑙
𝑅ℎ−𝑅𝑙 −
𝑚−𝛼 𝑠∗−𝐶
𝛼 1−𝑠∗ +𝑚𝑠∗−𝐶 (𝑅ℎ−𝑅𝑙). (8)
For the controlling shareholder, as long as the probability of the high return state is
larger than 𝑃2∗, she will choose to invest in the project. We can obtain
∆𝑃 = 𝑃1∗ − 𝑃2
∗ = 𝑚−𝛼 𝑠∗−𝐶
𝛼 1−𝑠∗ +𝑚𝑠∗−𝐶 (𝑅ℎ−𝑅𝑙)𝐼 > 0 (9)
This implies that the controlling shareholder is more likely to invest than if she acts
upon the interests of all shareholders. With equations (3) and (4), we calculate that the
amount of over-investment when the controlling shareholder expropriates company’s
fund for her private benefit is
𝐸 = ∆𝑃𝐼 = 𝑃1∗ − 𝑃2
∗ 𝐼 = [1 − 2𝑘
2𝑘+𝑡(𝑚−𝛼)2]
𝐼2
𝑅ℎ−𝑅𝑙 (10)
where we label E as the overinvestment. Notice that in our model, the company will
overinvest as long as the marginal private benefit of expropriated fund exceeds the
controlling shareholder’s ownership share. The expropriated fund does not necessarily
have to be used for investment. The intuition is very simple. When ownership is
separated from control, the controlling shareholder only shares a fraction of the
investment cost. On the other hand, by stealing fund from the company for her private

11
benefit, the controlling shareholder augments her expected returns from investment.
Thus, even if the expropriated fund is used for the purpose of other than investment,
the company with a controlling shareholder whose ownership separates from control
is more likely to overinvest. We also notice that a larger separation ratio 𝑡 results in
more overinvestment. Therefore, we derive our major testable conclusion:
H1: The larger the separation of ownership and control, the more the
overinvestment firms makes.
Based on expression (10), we also derive the following conclusions:
H2: Firms with more cash flow overinvest more.
H3: Firms with better legal protection of minority shareholders are less likely to
overinvest.
Equation (10) also allows us to address the relationship between the
overinvestment and the cash flow right of the controlling shareholder, as well as the
private benefit of stolen fund. Differentiating equation (10) with respect to 𝛼 and 𝑚,
we obtain
𝑑𝐸
𝑑𝛼= −
4𝑘𝑡(𝑚−𝛼)
[4𝑘+𝑡𝛼 𝑚−𝛼 ]2×
𝐼2
𝑅ℎ−𝑅𝑙 (11)
𝑑𝐸
𝑑𝑚=
4𝑘𝑡 (𝑚−𝛼)
[4𝑘+𝑡𝛼 𝑚−𝛼 ]2×
𝐼2
𝑅ℎ−𝑅𝑙 (12)
One necessary condition for the controlling shareholder to expropriate funds from a
company that she also owns is that the marginal private benefit of stolen fund exceeds
the share of cash dividend that she is entitled to, i.e., 𝑚 − 𝛼 > 0. Therefore for those
firms that controlling shareholders are engaging tunneling, equations (11) and (12)
imply that firm overinvestment decreases as cash flow right increases, or increases as
12
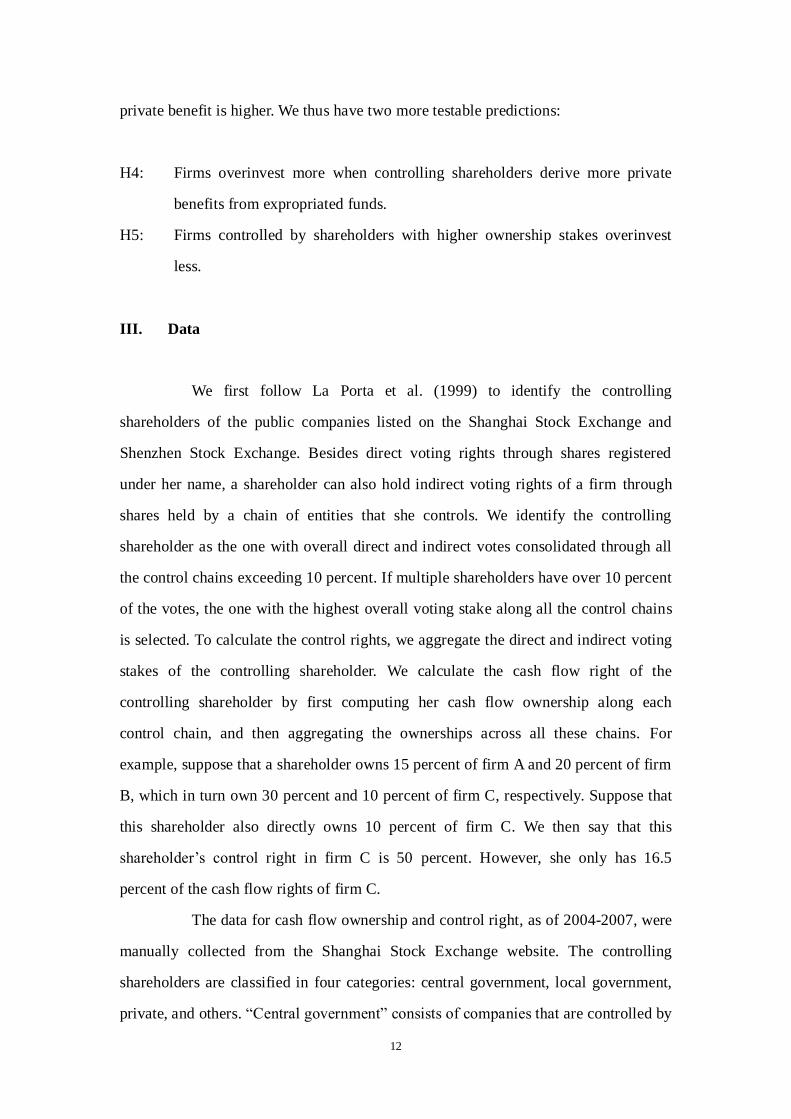
private benefit is higher. We thus have two more testable predictions:
H4: Firms overinvest more when controlling shareholders derive more private
benefits from expropriated funds.
H5: Firms controlled by shareholders with higher ownership stakes overinvest
less.
III. Data
We first follow La Porta et al. (1999) to identify the controlling
shareholders of the public companies listed on the Shanghai Stock Exchange and
Shenzhen Stock Exchange. Besides direct voting rights through shares registered
under her name, a shareholder can also hold indirect voting rights of a firm through
shares held by a chain of entities that she controls. We identify the controlling
shareholder as the one with overall direct and indirect votes consolidated through all
the control chains exceeding 10 percent. If multiple shareholders have over 10 percent
of the votes, the one with the highest overall voting stake along all the control chains
is selected. To calculate the control rights, we aggregate the direct and indirect voting
stakes of the controlling shareholder. We calculate the cash flow right of the
controlling shareholder by first computing her cash flow ownership along each
control chain, and then aggregating the ownerships across all these chains. For
example, suppose that a shareholder owns 15 percent of firm A and 20 percent of firm
B, which in turn own 30 percent and 10 percent of firm C, respectively. Suppose that
this shareholder also directly owns 10 percent of firm C. We then say that this
shareholder’s control right in firm C is 50 percent. However, she only has 16.5
percent of the cash flow rights of firm C.
The data for cash flow ownership and control right, as of 2004-2007, were
manually collected from the Shanghai Stock Exchange website. The controlling
shareholders are classified in four categories: central government, local government,
private, and others. “Central government” consists of companies that are controlled by

13
and report to the State-owned Assets Supervision and Administration Commission
(SASAC) and ministries such as the Ministry of Finance. Companies report to
agencies at local government levels are classified as “local government”. Private
individuals, couples, families, village committees, employee committees, etc., are put
into “private” category. We exclude controlling shareholders that are classified as
“others”. We also exclude the companies that the controlling shareholders had
changed during the sample period1.
For the corporate governance variable, k, we use three rough proxies
measuring protection of minority shareholders. The first is the government
intervention index. This index measures the degree of intervention by local
governments in company management. It can occur quite often to some companies
that local governments interfere with management practices by influencing board
decision in China. Smaller government intervention index implies heavy government
intervention in corporate decisions and thus may indicate a weak corporate board in
protecting small investors. The second proxy is a rule of law index. The third proxy
for the quality of corporate governance is the marketisation index. Fan, Wang and
Zhu(2007) constructed these indices for 2001-20052. We take these three indices of
2004-2005, and use 2005 data to represent 2006-2007, believing that they tend to be
relatively stable.
All the rest of the data are collected from Wind Database. We select annual
data from 2002 to 2007. We exclude from the sample all financial, and ST companies
which are often financially distressed3. We have total 1086 publicly listed companies
in our sample. After matching all data and checking the consistency, we obtain a
sample size of 2914. Table 1 summarizes all the variables.
1 In our sample, “private” accounts 25.40% while “central government” and “local government” account 19.25% and 55.45% respectively. 2 These indices have also been used in Fan et al. (2007), Fan et al. (2008), and Li, Yue and Zhao (2006). 3 A company receiving ST (Special Treatment) status is one that has reported two consecutive annual losses, or
whose book value has become negative. A company with ST status can still be traded, with some trading restrictions. Trading will be suspended if third year lose is reported and will be delisted with four consecutive
annual loses.
14
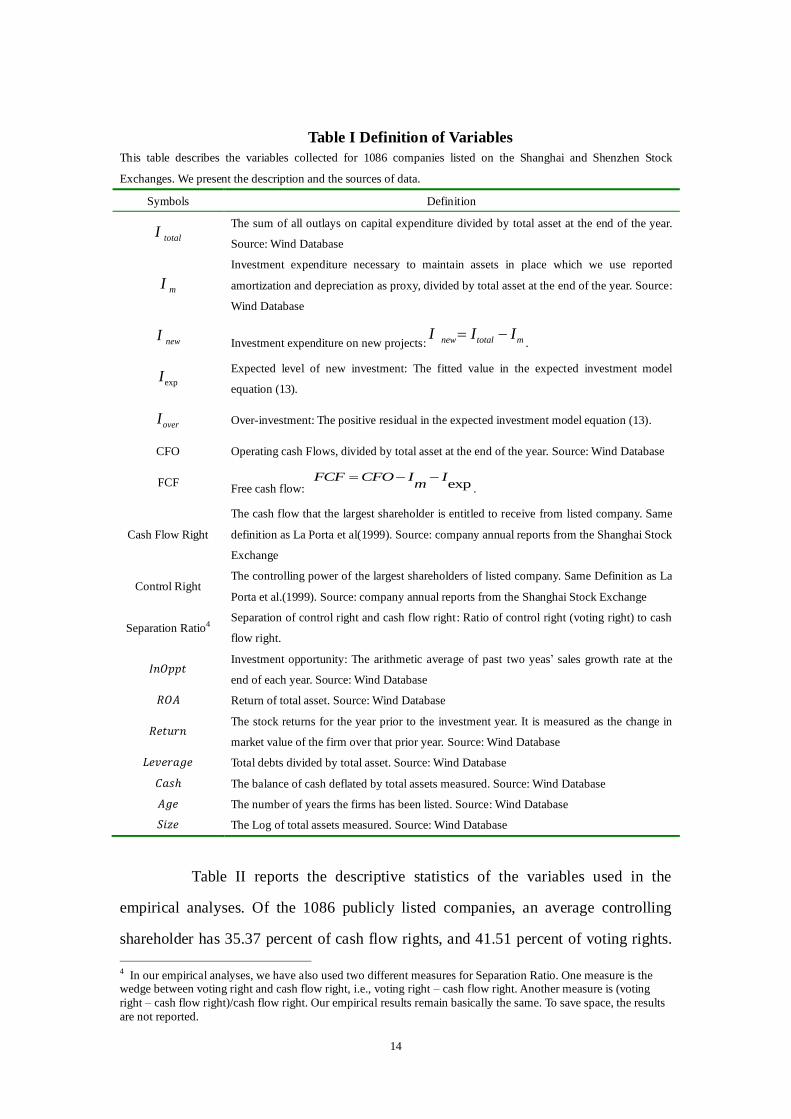
Table I Definition of Variables
This table describes the variables collected for 1086 companies listed on the Shanghai and Shenzhen Stock
Exchanges. We present the description and the sources of data.
Symbols Definition
totalI
The sum of all outlays on capital expenditure divided by total asset at the end of the year.
Source: Wind Database
mI
Investment expenditure necessary to maintain assets in place which we use reported
amortization and depreciation as proxy, divided by total asset at the end of the year. Source:
Wind Database
newI Investment expenditure on new projects: new total mI I I
.
expI
Expected level of new investment: The fitted value in the expected investment model
equation (13).
overI
Over-investment: The positive residual in the expected investment model equation (13).
CFO Operating cash Flows, divided by total asset at the end of the year. Source: Wind Database
FCF Free cash flow: exp
FCF CFO I Im
.
Cash Flow Right
The cash flow that the largest shareholder is entitled to receive from listed company. Same
definition as La Porta et al(1999). Source: company annual reports from the Shanghai Stock
Exchange
Control Right The controlling power of the largest shareholders of listed company. Same Definition as La
Porta et al.(1999). Source: company annual reports from the Shanghai Stock Exchange
Separation Ratio4 Separation of control right and cash flow right: Ratio of control right (voting right) to cash
flow right.
𝐼𝑛𝑂𝑝𝑝𝑡 Investment opportunity: The arithmetic average of past two yeas’ sales growth rate at the
end of each year. Source: Wind Database
𝑅𝑂𝐴 Return of total asset. Source: Wind Database
𝑅𝑒𝑡𝑢𝑟𝑛 The stock returns for the year prior to the investment year. It is measured as the change in
market value of the firm over that prior year. Source: Wind Database
𝐿𝑒𝑣𝑒𝑟𝑎𝑔𝑒 Total debts divided by total asset. Source: Wind Database
𝐶𝑎𝑠ℎ The balance of cash deflated by total assets measured. Source: Wind Database
𝐴𝑔𝑒 The number of years the firms has been listed. Source: Wind Database
𝑆𝑖𝑧𝑒 The Log of total assets measured. Source: Wind Database
Table II reports the descriptive statistics of the variables used in the
empirical analyses. Of the 1086 publicly listed companies, an average controlling
shareholder has 35.37 percent of cash flow rights, and 41.51 percent of voting rights.
4 In our empirical analyses, we have also used two different measures for Separation Ratio. One measure is the wedge between voting right and cash flow right, i.e., voting right – cash flow right. Another measure is (voting
right – cash flow right)/cash flow right. Our empirical results remain basically the same. To save space, the results
are not reported.
15
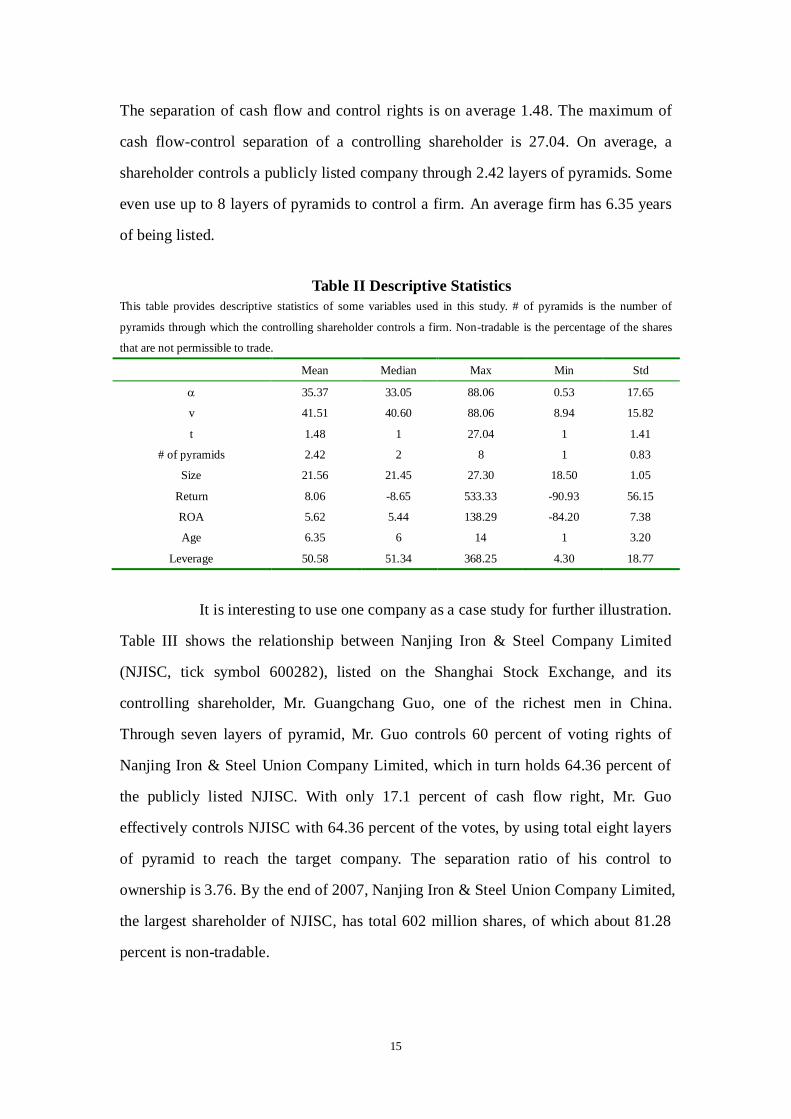
The separation of cash flow and control rights is on average 1.48. The maximum of
cash flow-control separation of a controlling shareholder is 27.04. On average, a
shareholder controls a publicly listed company through 2.42 layers of pyramids. Some
even use up to 8 layers of pyramids to control a firm. An average firm has 6.35 years
of being listed.
Table II Descriptive Statistics
This table provides descriptive statistics of some variables used in this study. # of pyramids is the number of
pyramids through which the controlling shareholder controls a firm. Non-tradable is the percentage of the shares
that are not permissible to trade.
Mean Median Max Min Std
35.37 33.05 88.06 0.53 17.65
v 41.51 40.60 88.06 8.94 15.82
t 1.48 1 27.04 1 1.41
# of pyramids 2.42 2 8 1 0.83
Size 21.56 21.45 27.30 18.50 1.05
Return 8.06 -8.65 533.33 -90.93 56.15
ROA 5.62 5.44 138.29 -84.20 7.38
Age 6.35 6 14 1 3.20
Leverage 50.58 51.34 368.25 4.30 18.77
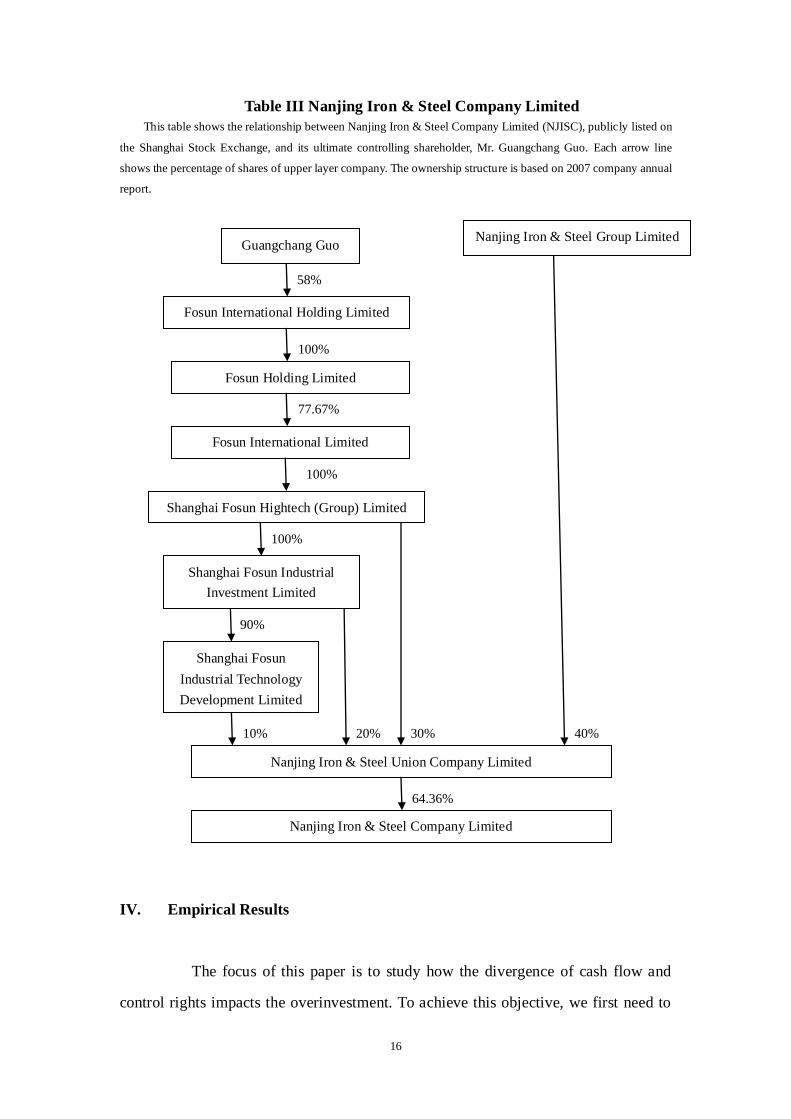
It is interesting to use one company as a case study for further illustration.
Table III shows the relationship between Nanjing Iron & Steel Company Limited
(NJISC, tick symbol 600282), listed on the Shanghai Stock Exchange, and its
controlling shareholder, Mr. Guangchang Guo, one of the richest men in China.
Through seven layers of pyramid, Mr. Guo controls 60 percent of voting rights of
Nanjing Iron & Steel Union Company Limited, which in turn holds 64.36 percent of
the publicly listed NJISC. With only 17.1 percent of cash flow right, Mr. Guo
effectively controls NJISC with 64.36 percent of the votes, by using total eight layers
of pyramid to reach the target company. The separation ratio of his control to
ownership is 3.76. By the end of 2007, Nanjing Iron & Steel Union Company Limited,
the largest shareholder of NJISC, has total 602 million shares, of which about 81.28
percent is non-tradable.
16
Table III Nanjing Iron & Steel Company Limited
This table shows the relationship between Nanjing Iron & Steel Company Limited (NJISC), publicly listed on
the Shanghai Stock Exchange, and its ultimate controlling shareholder, Mr. Guangchang Guo. Each arrow line
shows the percentage of shares of upper layer company. The ownership structure is based on 2007 company annual
report.
IV. Empirical Results
The focus of this paper is to study how the divergence of cash flow and
control rights impacts the overinvestment. To achieve this objective, we first need to
Guangchang Guo
Fosun International Holding Limited
Fosun Holding Limited
Fosun International Limited
Shanghai Fosun Hightech (Group) Limited
Shanghai Fosun Industrial
Investment Limited
Shanghai Fosun
Industrial Technology
Development Limited
Nanjing Iron & Steel Union Company Limited
Nanjing Iron & Steel Group Limited
Nanjing Iron & Steel Company Limited
58%
90%
100%
100%
77.67%
100%
10% 20% 30% 40%
64.36%

17
measure firm’s overinvestment based on a method developed by Richardson (2006).
This method decomposes total investment expenditure into two components: (i)
required investment expenditure to maintain assets in place, (ii) investment
expenditure on new projects. The first component is often measured by amortization
and depreciation as a proxy. The second component, investment expenditure on new
projects, is total investment expenditure net of required investment. There is an
extensive literature that has examined firm level investment decisions on new projects
(Hubbard, 1998; Richardson, 2006). This literature usually decomposes investment
expenditure into an expected investment in new positive NPV projects, which is
explained by a set of variables, and a residual component. A positive (negative)
residual component corresponds to over-(under-)investment. In this paper, we focus
on firms with positive values of residual.
Following Richardson (2006), we assume that the investment expenditure
on new projects is explained by the following regression equation:
𝐼𝑛𝑒𝑤 = 𝛼0 + 𝛼1𝐼𝑛𝑜𝑝𝑝𝑡−1 + 𝛼2𝐿𝑒𝑣𝑒𝑟𝑎𝑔𝑒−1 + 𝛼3𝐶𝑎𝑠ℎ−1 + 𝛼4𝐴𝑔𝑒−1 +
𝛼5𝑆𝑖𝑧𝑒−1 + 𝛼6𝑅𝑒𝑡𝑢𝑟𝑛−1 + 𝛼7𝑅𝑂𝐴−1 + 𝛼8𝐼𝑛𝑒𝑤 −1 + 𝜀, (13)
where all the variables are described in Table I. Those indexed with -1 refer to t-1
variables. To estimate equation (13), we need to measure the investment
opportunity, 𝐼𝑛𝑜𝑝𝑝𝑡 . We use the arithmetic average of annual sales growth rate over
the most recent two years. La Porta et al. (2002) argues for using sales growth instead
of earnings growth as a proxy for growth opportunities, because it is less likely to be
manipulated as earnings growth5. In the following analyses, we also used other
measures as proxies for the investment opportunity.
Table IV shows the regression results of equation (13). Model 1 only uses
the investment opportunity, 𝐼𝑛𝑜𝑝𝑝𝑡−1as the explanatory variable for investment.
Though 𝐼𝑛𝑜𝑝𝑝𝑡−1 is highly significant, its explanatory power is low. When we
include other explanatory variables in Model 2, the adjusted R2 increases to 22.2
percent. Most exogenous variables are significant at 10 percent level. We use Model 2
5 La Porta et al. (2002) in fact uses geometric average annual percentage growth. To make sure that this difference
does not result in different conclusions in the following analyses, we also estimate the investment equation using
geometric average. Our conclusions are the same.

18
in Table IV to generate the residuals. The positive residuals are taken as the
overinvestment.
Table IV Analysis of Investment Expenditure
The table provides regression results of equation (13). The dependent variable is the new investment, which is the
total investment net of maintenance investment, scaled by total assets. The independent variables are explained in
Table II. Index “-1” refers to lag one variable. We also include year indicators in the regressions to capture annual
fixed effects. The year indicators are dummy variables: if year = 2004, then year1 = 1, else year1 = 0; if year =
2005, then year2 = 1, else year2 = 0; if year = 2006, then year3 = 1, else year3 = 0. The sample companies are
classified into 20 industries. We also include a vector of dummies to capture the industry fixed effects in the
regressions. T-statistics based on Huber-White robust standard errors are shown in parentheses.
Model 1 Model 2
Constant 0.0368***
(11.97)
-0.0130
(-0.51)
𝐼𝑛𝑜𝑝𝑝𝑡−1 0.0001***
(2.78)
0.00004
(0.95)
𝑆𝑖𝑧𝑒−1 0.0019
(1.52)
𝑅𝑒𝑡𝑢𝑟𝑛−1 0.0001***
(2.91)
𝑅𝑂𝐴−1 0.0012***
(5.99)
𝐿𝑒𝑣𝑒𝑟𝑎𝑔𝑒−1 -0.0003***
(-3.43)
𝐴𝑔𝑒−1 -0.0011***
(-2.64)
𝐶𝑎𝑠ℎ−1 0.0382***
(2.64)
𝐼−1 0.3088***
(14.15)
Adj. R-sq 0.046 0.222
Note * ** and *** indicate 10% 5% and 1% levels of significance, respectively.
Once we have generated the overinvestment data, we can test hypotheses
H1-H5. Table V shows the regression results of the relationship between
overinvestment, free cash flow, separation ratio, and investor protection. It also lists
the expected sign of each explanatory variable based on hypotheses H1-H5. We report
three regressions, each using different proxy for investor protection: government
19
invention, rule of law, and marketization index. Our hypothesis H3 suggests that
better investor protection should have a negative impact on overinvestment. We
expect that all three proxies for investor protection should have negative coefficients
in these regressions. To test hypothesis H4, we include a private control dummy
variable, which equals one if the controlling shareholder is “Private”, and zero if
otherwise. To the extent that it is more difficult to receive funding for a private
enterprise than a state owned enterprise in a developing country, stealing generates
higher marginal benefits for private enterprises and thus we expect that the coefficient
for the Private Control dummy is positive.
In Table V, the coefficient for separation ratio in all regression equations is
positive and significant at 10 percent level of significance. Other things the same, a
firm is likely to increase overinvestment by about 0.0066 for every unit increase in the
ratio of voting right to ownership right. The average total asset for all the firms in our
sample is 7.962 billion Yuan. Thus, average firm increases overinvestment by about
53 million Yuan, or about US$7.9 million6 for every one unit increase in the
separation ratio. Our sample firms have an average separation ratio 1.48. Relative to
an economy with voting right the same as ownership, a typical Chinese company
overinvests 25 million Yuan, or about US$3.8 million. Our sample firms on average
make about 336 million Yuan new investment a year. The overinvestment due to
pyramid structure of control is about 7.5 percent of average annual new investment.
This implies that our sample of 1086 firms overinvests 27.4 billion Yuan, or about $4
billion a year relative to an economy without pyramidal structure. This is quite a
significant number, indicating a substantial amount of resources is not used for the
purpose of maximizing firm values in China due to the divergence of ownership and
control.
As predicted by our model, the coefficient for FCF in all regressions is
positive and significant at 10 percent level of significance. All proxies for investor
protection do not have the expected sign, but all are not significant. These measures
for corporate governance do not seem to achieve the intended effects of protecting
6 We use exchange rate as US$1 = 6.7 Yuan.

20
small investors in China7. We suspect that ineffective enforcement of existing investor
protection law rather than ineffective law itself as the root problem in China8. The
coefficient for cash flow right is positive, contradictory to hypothesis H5, but
insignificant. The Private Control dummy has a positive sign on overinvestment
which is consistent to hypothesis H4, but none of the estimates are significant9. We
notice that the adjusted R2 of the model in Table V is very low. Only a little over 2%
of the variation is explained by FCF, cash flow right, separation ratio and other
determinants. However, the explained variable (overinvestment) itself is the residual
of another regression equation and thus this explanatory power is incremental to the
set of variables explaining the firm level investment expenditure, which is 22.2% in
Table IV. Therefore, the combined models of Table IV and V are able to explain a
significant portion of the cross-sectional variation in investment over time10
.
Table V Overinvestment and Corporate Governance
The table presents results of regressions for the sample of 1086 Chinese firms with a controlling shareholder. The
dependent variable is overinvestment calculated from regression equation (13) as the positive residual. The
independent variables are: 1) FCF, the free cash flow; 2) Cash Flow Right, the ownership of the controlling
shareholder; 3). Separation Ratio, the ratio of voting right to cash flow right; 4) Private Control, a dummy variable
equals one if the controlling shareholder is a private enterprise or family; and 5) One of three indices measuring
investor protection: Government Intervention, Rule of Law, and Marketization Index, of which a larger number
indicates better investor protection. T-statistics based on Huber-White robust standard errors are shown in
parentheses.
Variable Expected Sign Model 1 Model 2 Model 3
Constant 0.0259**
(2.39)
0.0224**
(2.18)
0.0200
(1.40)
FCF + 0.1115*
(1.85)
0.1097*
(1.82)
0.1103*
(1.83)
Cash Flow Right - 0.0002
(1.60)
0.0002
(1.49)
0.0002
(1.56)
Separate Ratio + 0.0066*
(1.81)
0.0065*
(1.81)
0.0066**
(1.84)
7 We have also used other measures for investor’s protection, but none of them seems to yield results predicted by
the model. Appendix 1 provides regression results using three different indices of corporate governance. 8 Jiang, Lee and Yue (2005) also reach a similar conclusion when evaluating the monitoring role of auditors. They
conclude that unclean audit opinions alone are not sufficient to deter tunneling behavior. 9 In fact, the hypotheses H4 and H5 are only true if 𝑚 − 𝛼 > 0. Unfortunately, we have no way to identify the companies of which the private benefit of stolen fund exceeds cash flow right. 10 This argument was also forcefully made by Richardson (2006).

21
Private Control + 0.0078
(0.95)
0.0076
(0.93)
0.0076
(0.93)
Government Intervention - 0.0002
(0.17)
Rule of Law - 0.0009
(0.94)
Marketization Index - 0.0009
(0.64)
Adj. R-sq 0.022 0.024 0.023
Note * ** and *** indicate 10% 5% and 1% levels of significance, respectively.
We conclude in our theoretical discussion that firms will overinvest as long
as controlling shareholders expropriate funds. One implication is that overinvestment
will not occur in our model if controlling shareholders do not tunnel funds for their
private benefits. Thus the hypotheses H1-H5 are conditional on that firms engage in
tunneling. One necessary condition for tunneling is 𝑚 > 𝛼, that is, the marginal
private benefit of stolen fund exceeds the cash flow ownership of the controlling
shareholders. Since it is difficult to estimate the marginal private benefit of stolen
fund, we hypothesis that our conclusions are probably more true for firms with
smaller cash flow rights by the controlling shareholders. To test this, we divide our
sample into two, using median level of cash flow right as a cut-off line.
Table VI Overinvestment and Corporate Governance with Split Sample
The table presents results of regressions for the sample of 1086 Chinese firms with a controlling shareholder, using
split sample. The dependent variable is overinvestment calculated from regression equation (13) as the positive
residual. The independent variables are: 1) FCF, the free cash flow; 2) Cash Flow Right, the ownership of the
controlling shareholder; 3). Separation Ratio, the ratio of voting right to cash flow right; 4) Private Control, a
dummy variable equals one if the controlling shareholder is a private enterprise or family, and zero otherwise; and
5) Government Intervention, an index measuring investor protection, of which a larger number indicates better
investor protection. High (Low) refers to sub-sample of cash flow right larger (smaller) than the median.
T-statistics based on Huber-White robust standard errors are shown in parentheses.
Variables High Low
Constant 0.0168
(0.45)
-0.0052
(-0.25)
FCF 0.1304
(1.35)
0.0916
(1.39)
Cash Flow Right -0.0003 0.0010

22
(-0.90) (1.61)
Separation Ratio 0.0404
(1.24)
0.0084**
(2.18)
Private Control -0.0091
(-0.89)
0.0181*
(1.63)
Rule of Law 0.0006
(0.48)
0.0012
(0.86)
Adj. R-sq 0.026 0.046
Note * ** and *** indicate 10% 5% and 1% levels of significance, respectively.
Table VI re-estimates the relationship between overinvestment and the
explanatory variables with split samples of low and high cash flow rights, using the
median as the cut-off line11
. For the small ownership right sample, the coefficient for
the separation ratio remains to be positive and becomes significant at 5 percent level.
The private control dummy has a positively significant coefficient, implying that
firms with controlling shareholders classified as “Private” tend to overinvest more
than firms with other types of controlling shareholders. The coefficient for the cash
flow right is still positive and but is no longer significant. For the sample of high cash
flow right, none of the coefficient estimates is significant. None of the measures for
investor protection is significant in these equations.
V. Robustness of Results
One criticism of our above analyses is the use of a particular proxy for
investment opportunity. Like La Porta et al. (2002), we have used the average of
annual sales growth rate over the most recent two years. This effectively uses past
sales growth to forecast future. Alternatively we can use other measures for
investment opportunity. One popular approach is to use Tobin’s Q, the ratio of the
market value of assets to the current replacement cost of those assets. However,
Tobin’s Q is also subject to the same criticism as the sales growth that it does not
paint a complete picture of the growth opportunities. Other measures, such as
11 We have also used 50 percent of cash flow right and the sample mean as a cut-off line. The results are basically
similar.

23
book-to-market of equity (B/P) and earnings-price ratios (E/P) are not perfect proxies
for investment opportunity either12
. Richardson (2006) decomposes firm value into
two components: value of the assets in place which reflects the value of the firm
indicated by current book values and current earnings, and the value of growth
opportunities. According to Richardson (2006), value of the assets in place can be
estimated using residual income framework, assuming price equals discounted
expected dividends, and abnormal earnings follow an auto-regressive process with a
persistence parameter13
. The value of growth opportunities is the difference between
the value of the firm and value of the assets in place. This measure, V/P, according to
Richardson (2006), simultaneously capturing market value relative to both book value
and earnings in an accepted valuation framework, is able to measure growth
opportunities better than other proxies. The index generated to measure growth
opportunities based on Richardson (2006) is in fact a linear combination of B/P and
E/P.
Identifying the best relationship to describe investment is not the objective
of this paper. Thus, instead of using a particular measure for growth opportunities to
generate overinvestment, we decide to use all the four possible proxies, keeping in
mind that none of them is a perfect measure. Our objective is to test if our main result,
that firm with higher separation ratio overinvests more, is robust no matter what
measure is used as a proxy for growth opportunities.
Table VII Investment Analysis Using Different Measures of Investment
Opportunity
The table provides regression results of equation (13), using four different proxies for Inoppt: B/P, E/P, Tobin’s Q
and V/P. B/P is the book-to-market of equity. E/P is the earnings-price ratio. Tobin’s Q is the ratio of the market
value of assets to the current replacement cost of those assets. V/P is measured as the ratio of value of the assets in
place to market value. The dependent variable is the new investment, which is the total investment net of
maintenance investment, scaled by total assets. The independent variables are expla ined in Table II. Index “-1”
refers to lag one variable. We also include the year indicators in the regressions to capture annual fixed effects. The
12 BM (EP) can serve as sufficient statistics for growth opportunity if earnings are transitory (permanent). However, Dechow, Hutton and Sloan (1999) showed that earnings contain a certain degree of mean reversion in
between the two extremes. 13 Richardson (2006) decomposed the value of a firm, P, into P = VAIP + VGO, where VGO the value of growth
opportunity. VAIP is value of assets in place which is calculated according to 𝑉𝐴𝐼𝑃 = 1 − 𝛼𝑟 𝐵𝑉 + 𝛼 1 + 𝑟 𝑋 −𝛼𝑟𝑑, where BV is the book value of equity, X is earnings, r is the discount rate, d is dividend, 𝛼 = 𝜔/(1 + 𝑟 − 𝜔),
and 𝜔 a fixed persistence parameter restricted to be positive and less than one.

24
year indicators are dummy variables: if year = 2004, then year1 = 1, else year1 = 0; if year = 2005, then year2 = 1,
else year2 = 0; if year = 2006, then year3 = 1, else year3 = 0. The sample companies are classified into 20
industries. We use a vector of dummies to capture the industry fixed effects in the regressions. T-statistics based on
Huber-White robust standard errors are shown in parentheses.
Model 1
B/P
Model 2
E/P
Model 3
Tobin’s Q
Model 4
V/P
Constant -0.0217
(-0.77)
-0.0117
(-0.45)
0.0212
(0.55)
-0.0040
(-0.35)
𝐼𝑛𝑜𝑝𝑝𝑡−1 -0.0172***
(-3.60)
0.0130
(0.66)
-0.0013
(-0.50)
-0.0040
(-1.02)
𝑠𝑖𝑧𝑒−1 0.0035***
(2.60)
0.0017
(1.35)
0.0002
(0.11)
0.0025*
(1.85)
𝑅𝑒𝑡𝑢𝑟𝑛−1 0.0001*
(1.68)
0.0001***
(2.95)
0.0001**
(1.93)
0.0001**
(2.44)
𝑅𝑂𝐴−1 0.0011***
(6.07)
0.0012***
(5.76)
0.0015***
(5.05)
0.0013***
(5.48)
𝐿𝑒𝑣𝑒𝑟𝑎𝑔𝑒−1 -0.0003***
(-4.45)
-0.0003***
(-3.23)
-0.0003**
(-2.33)
-0.0003***
(-3.52)
𝐴𝑔𝑒−1 -0.0012***
(-2.94)
-0.0011***
(-2.79)
-0.0003
(-0.57)
-0.0011***
(-2.80)
𝐶𝑎𝑠ℎ−1 0.0388***
(2.69)
0.0381***
(2.65)
0.0434**
(2.00)
0.0385***
(2.67)
𝐼−1 0.3053***
(14.08)
0.3081***
(14.01)
0.3465***
(9.81)
0.3100***
(14.19)
Adj. R-sq 0.231 0.221 0.228 0.222
Note * ** and *** indicate 10% 5% and 1% levels of significance, respectively.
Table VII shows the regression results of investment equation (13), using
B/P, E/P, Tobin’s Q, and V/P as a measure for growth opportunities, 𝐼𝑛𝑜𝑝𝑝𝑡−1. V/P is
the ratio of value of the assets in place to the firm value, calculated according to
Richardson (2006). Lower V/P indicates more growth opportunities so does B/P or
E/P. The coefficients of these measures in the investment regression equations are
expected to be negative. We find that the coefficient for 𝐼𝑛𝑜𝑝𝑝𝑡−1, using B/P, is
negative and significant. On the other hand, the coefficient using V/P or Tobin’s Q is
negative but not significant. Coefficient estimates for other explanatory variables are
mostly in line with Table IV and are significant with the expected sign. The
explanatory power for investment of these regression equations is reasonably good,
with the adjusted R2 being more than 22 percent.

25
From Table VII, we generate four sets of residuals. The positive residual is
taken as the overinvestment. We re-estimate the relationship between overinvestment,
FCF, Separation Ratio, and other explanatory variables based on different proxies for
growth opportunities. Table VIII lists the regression results.
Table VIII Overinvestment and Corporate Governance Using Different
Measures of Investment Opportunity
The table presents results of regressions for the sample of 1086 Chinese firms with a controlling shareholder, using
positive residuals generated from Table VI as the dependent variable. Four different proxies for Inoppt: B/P, E/P,
Tobin’s Q and V/P, are used. B/P is the book-to-market of equity. E/P is the earnings-price ratio. Tobin’s Q is the
ratio of the market value of assets to the current replacement cost of those assets. V/P is measured as the ratio of
value of the assets in place to market value. The independent variables are: 1) FCF, the free cash flow; 2) Cash
Flow Right, the ownership of the controlling shareholder; 3) Separation Ratio, the ratio of voting right to cash flow
right; 4) Private Control, a dummy variable equals one if the controlling shareholder is a private enterprise or
family; and 5) Government Intervention, an index measuring investor protection, of which a larger number
indicates better investor protection. T-statistics based on Huber-White robust standard errors are shown in
parentheses.
Variable B/P E/P Tobin’s Q V/P
Constant 0.0194**
(1.92)
0.0229**
(2.22)
0.0166
(1.23)
0.0212**
(2.06)
FCF 0.1057*
(1.76)
0.1036*
(1.72)
0.0910
(1.45)
0.1079*
(1.78)
Cash Flow Right 0.0003*
(1.79)
0.0002
(1.41)
0.0003
(1.16)
0.0002*
(1.63)
Separate Ratio 0.0075**
(2.10)
0.0065*
(1.82)
0.0070*
(1.84)
0.0066*
(1.84)
Private Control 0.0078
(0.96)
0.0075
(0.91)
0.0072
(0.93)
0.0074
(0.91)
Rule of Law14 0.0009
(1.03)
0.0009
(0.97)
0.0015
(1.14)
0.0009
(1.03)
Adj. R-sq 0.029 0.023 0.027 0.024
Note * ** and *** indicate 10% 5% and 1% levels of significance, respectively.
We find that our main conclusion is robust. The coefficient for Separation
Ratio is positive and significant at the 10 percent level, in all regressions. FCF in all
14 We have also used other measures for investor protection, and the results are the same. To save space, we do not
list them here.
26
specifications has a positive coefficient, and all coefficient estimates are significant
except when using Tobin’s Q as a proxy for growth opportunities to generate
overinvestment. The coefficient on Private Control dummy has a positive sign,
consistent with our model prediction, though none of the estimates is significant. As
in Table V, both coefficients on Cash Flow Right and small investor protection index,
Rule of Law, are insignificant, except for the model using B/P.
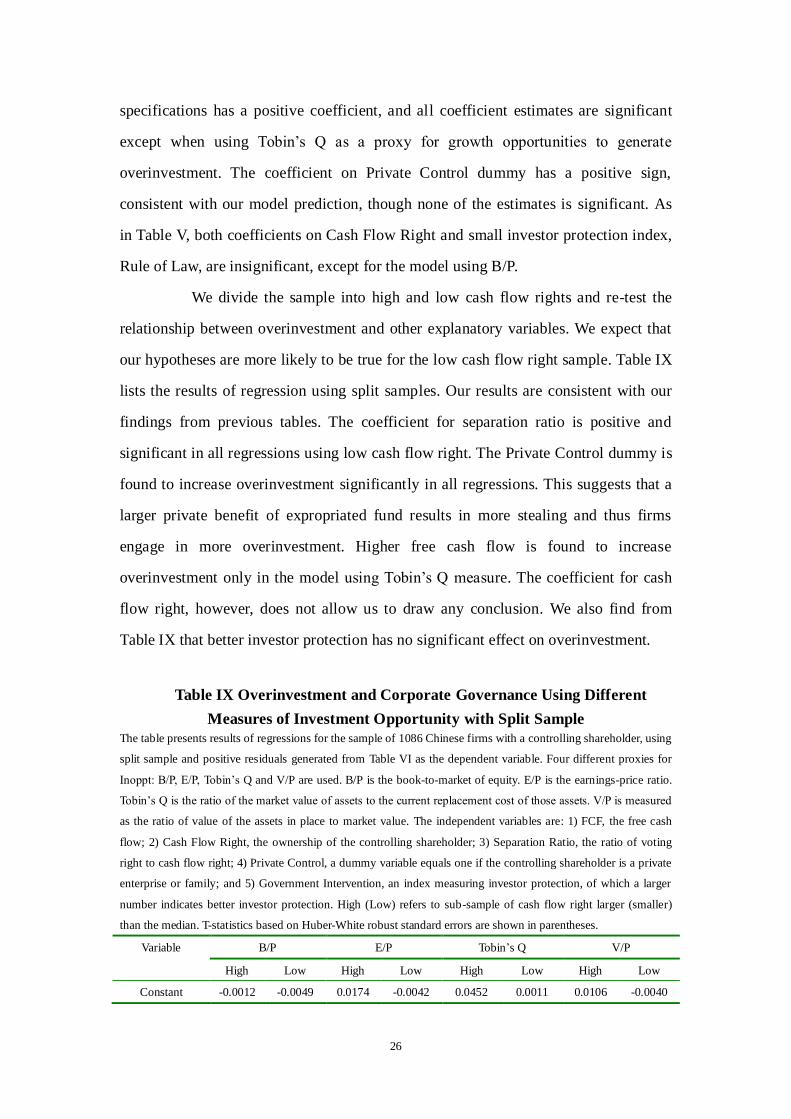
We divide the sample into high and low cash flow rights and re-test the
relationship between overinvestment and other explanatory variables. We expect that
our hypotheses are more likely to be true for the low cash flow right sample. Table IX
lists the results of regression using split samples. Our results are consistent with our
findings from previous tables. The coefficient for separation ratio is positive and
significant in all regressions using low cash flow right. The Private Control dummy is
found to increase overinvestment significantly in all regressions. This suggests that a
larger private benefit of expropriated fund results in more stealing and thus firms
engage in more overinvestment. Higher free cash flow is found to increase
overinvestment only in the model using Tobin’s Q measure. The coefficient for cash
flow right, however, does not allow us to draw any conclusion. We also find from
Table IX that better investor protection has no significant effect on overinvestment.
Table IX Overinvestment and Corporate Governance Using Different
Measures of Investment Opportunity with Split Sample
The table presents results of regressions for the sample of 1086 Chinese firms with a controlling shareholder, using
split sample and positive residuals generated from Table VI as the dependent variable. Four different proxies for
Inoppt: B/P, E/P, Tobin’s Q and V/P are used. B/P is the book-to-market of equity. E/P is the earnings-price ratio.
Tobin’s Q is the ratio of the market value of assets to the current replacement cost of those assets. V/P is measured
as the ratio of value of the assets in place to market value. The independent variables are: 1) FCF, the free cash
flow; 2) Cash Flow Right, the ownership of the controlling shareholder; 3) Separation Ratio, the ratio of voting
right to cash flow right; 4) Private Control, a dummy variable equals one if the controlling shareholder is a private
enterprise or family; and 5) Government Intervention, an index measuring investor protection, of which a larger
number indicates better investor protection. High (Low) refers to sub-sample of cash flow right larger (smaller)
than the median. T-statistics based on Huber-White robust standard errors are shown in parentheses.
Variable B/P E/P Tobin’s Q V/P
High Low High Low High Low High Low
Constant -0.0012 -0.0049 0.0174 -0.0042 0.0452 0.0011 0.0106 -0.0040

27
(-0.03) (-0.25) (0.47) (-0.21) (0.52) (0.04) (0.29) (-0.19)
FCF 0.1281
(1.31)
0.0869
(1.35)
0.1254
(1.30)
0.0852
(1.29)
0.0592
(0.60)
0.1671*
(1.85)
0.1281
(1.32)
0.0923
(1.40)
Cash Flow Right -0.0001
(-0.27)
0.0010*
(1.68)
-0.0003
(-0.91)
0.0010
(1.53)
-0.0007*
(-1.93)
0.0000
(0.06)
-0.0002
(-0.64)
0.0010
(1.51)
Separate Ratio 0.0464
(1.43)
0.0092**
(2.40)
0.0403
(1.24)
0.0083**
(2.17)
0.0399
(0.44)
0.0075*
(1.82)
0.0418
(1.28)
0.0082**
(2.15)
Private Control -0.0086
(-0.84)
0.0179*
(1.63)
-0.0089
(-0.87)
0.0178*
(1.64)
-0.0048
(-0.37)
0.0153*
(1.68)
-0.0089
(-0.88)
0.0175*
(1.63)
Rule of Law 0.0008
(0.73)
0.0011
(0.78)
0.0005
(0.44)
0.0013
(0.93)
0.0003
(0.13)
0.0023
(1.14)
0.0007
(0.61)
0.0013
(0.87)
Adj. R-sq 0.024 0.050 0.023 0.045 -0.003 0.133 0.023 0.043
Note * ** and *** indicate 10% 5% and 1% levels of significance, respectively.
VI. Conclusion
In this paper, we study how separation of control and ownership of
controlling shareholders via a pyramidal corporate structure affects overinvestment by
extending a simple model developed by La Porta et al. (2002). Using over 1000
publicly listed Chinese firms, we confirm the prediction of our model that firms
overinvest more when the controlling shareholder’s voting right is separated more
from her ownership. We quantify the amount of overinvestment due to pyramidal
structure and find that overinvestment is quite substantial in China. This implies that
firms with controlling shareholders via pyramidal corporate structure are likely to
invest in projects that destroy firm value. Our paper provides an additional
explanation on why capital markets penalize firms with large separation of control
and ownership in terms of lower equity value. The result of this paper also points to
the possible inefficiency in China’s high investment in recent years.
This paper also draws other conclusions. Firms with more free cash flow
tend to overinvest more. Private enterprises as controlling shareholders, due to limited
external financing opportunities, derive more private benefits from expropriated funds.
We find that with controlling shareholder’s ownership being small, firms under
private control tend to overinvest more relative to firms under state government or
local government control in China. Unlike implications from Claessens et al. (2002)

28
and La Porta et al. (2002), we do not find evidence to support the hypothesis that
better investor protection reduces overinvestment in China, using measures such as
government intervention, rule of law index, marketization index, and others. La Porta
et al. (2002) found that higher cash flow right by the controlling shareholder improves
firm valuation. Our paper, however, does not find evidence to link ownership of
controlling shareholders with overinvestment.
Reference
1. Bae, Kee-Hong, Jun-Koo Kang, and Jin-Mo Kim, 2002, Tunneling or value added? Evidence
from mergers by Korean business groups, Journal of Finance 57, 2695-2740.
2. Barca, Fabrizio, 1995, On corporate governance in Italy: Issues, facts, and agency,
Unpublished manuscript, Bank of Italy, Rome.
3. Bertrand, Marianne, Paras Mehta, and Sendhil Mullainathan, 2002, Ferreting out tunneling:
an application to Indian business groups, Quarterly Journal of Economics 117, 121-148.
4. Chen, Gongmeng, Michael Firth, Yu Xin, and Liping Xu, 2008, Control Transfers,
Privatization, and Corporate Performance: Efficiency Gains in China’s Listed Companies,
Journal of Financial and Quantitative Analysis 43, 161-190.
5. Cheung, Yan-Leung, P. Raghqvendra Rau, and Aris Stouraitis, 2006, Tunneling, propping,
and expropriation: evidence from connected party transactions in Hong Kong, Journal of
Financial Economics 82, 343-386.
6. Claessens, Stijn, Simeon Djankov, and Larry Lang, 2000, The separation of ownership and
control in East Asian corporations, Journal of Financial Economics 58, 81-112.
7. Claessens, Stijn, Simeon Djankov, Joseph P. H. Fan, and Larry H. P. Lang, 2002,
Disentangling the Incentive and Entrenchment Effects of Large Shareholdings, Journal of
Finance 57, 2741-2771.
8. Dechow, P. M., A. P. Hutton, and R. G. Sloan, 1999, An empirical assessment of the residual
income valuation model, Journal of Accounting and Economics 26, 1-34.
9. Fan, Joseph P. H., T. J. Wong, and Tianyu Zhang, 2005, The emergence of corporate
pyramids in China, Working Paper.
10. Fan, Joseph P. H., Jun Huang, Felix Oberholzer-Gee, and Mengxin Zhao, 2007, Corporate
Diversification in China: Cause and Consequences, Working Paper.
11. Fan, Joseph P. H., Jun Huang, Randall Morck, and Bernard Yeung, 2008, Vertical Integration,
Institutional Determinants and Impact: Evidence from China, Working Paper.
12. Fan, Gang, Xiaolu Wang, Hengpeng Zhu, 2007, NERI Index of Marketization of China’s
Provinces, Economic Science Press(in Chinese).
13. Gorton, Gary, and Frank Schmid, 1996, Universal banking and the performance of German
firms, working paper 5453, National Bureau of Economic Research, Cambridge, Mass.
14. Grossman, Sanford, and Oliver Hart, 1988, One-share, one-vote, and the market for corporate
control, Journal of Financial Economics 20, 175-202.
15. Harris, Milton, and Artur Raviv, 1988, Corporate governance: voting rights and majority

29
rules, Journal of Financial Economics 20, 203-235.
16. Holderness, Clifford, and Dennis Sheehan, 1988, The role of majority shareholders in
publicly held corporations: an exploratory analysis, Journal of Financial Economics 20,
317-346.
17. Hubbard, R. Glenn, 1998, Capital-market imperfections and investment, Journal of Economic
Literature 36, 193–225.
18. Jensen, Michael, and William Meckling, 1976, Theory of the firm: managerial behavior,
agency costs, and ownership structure, Journal of Financial Economics 3, 305-360.
19. Jiang, Guohua, Charles M. C. Lee, and Heng Yue, 2005, Tunneling in China: The
surprisingly pervasive use of corporate loans to extract funds from Chinese listed companies,
Working paper.
20. Johnson, Simon, Rafael La Porta, Florencio Lopez-de-Silanes, and Andrei Shleifer, 2000,
Tunneling, American Economic Review 90, 22-27.
21. Johnson, Simon, Peter Boone, Alasdair Breach, and Eric Friedman, 2000, Corporate
governance in the Asian financial crisis, Journal of Financial Economics 58, 141-186.
22. Kuijs, Louis, 2005, Saving and investment in China, World Bank Policy Research Working
Paper 3633.
23. La Porta, Rafael, Florencio Lopez-de-Silanes, and Andrei Shleifer, 1999, Corporate
ownership around the world, Journal of Finance 54, 471-517.
24. La Porta, Rafael, Florencio Lopez-de-Silanes, Andrei Shleifer, and Robert W. Vishny, 2002,
Investor protection and corporate valuation, Journal of Finance 57, 1147-1170.
25. Li, Kai, Heng Yue, and Longkai Zhao, 2006, Ownership, Institutions, and Capital Structure:
Evidence from Chinese Firms, Working Paper.
26. Myers, Stewart C., and Nicholas S. Majluf, 1984, Corporate financing and investment
decisions when firms have information that investors do not have, Journal of Financial
Economics 13, 187-221.
27. Prowse, Stephen, 1992, The structure of corporate ownership in Japan, Journal of Finance 47,
1121-1140.
28. Richardson, Scott, 2006, Over-investment of free cash flow, Review of Accounting Studies
11, 159-189.
29. Sheng, Xiao, 2009, How Do Angency Costs Affect Firm Value? – Evidence from China,
Working Paper.
30. Shleifer, Andrei, and Robert W. Vishny, 1997, A Survey of Corporate Governance, Journal of
Finance 52, 737-783.
31. Shleifer, Andrei, and Daniel Wolfenzon, 2002, Investor protection and equity markets,
Journal of Financial Economics 66, 3-27.
32. Wei, Zuobao, Feixue Xie, and Shaorong Zhang, 2005, Ownership Structure and Firm Value
of China’s Privatized Firms: 1991 – 2001, Journal of Financial and Quantitative Analysis 40,
87 - 108

30
Appendix 1 Overinvestment and Corporate Governance Using Different
Measures
The table presents results of regressions for the sample of 1086 Chinese firms with a controlling shareholder, using
other measures for investor protection. The dependent variable is overinvestment calculated from regression
equation (12) as the positive residual. The independent variables are: 1) FCF, the free cash flow; 2) Cash Flow
Right, the ownership of the controlling shareholder; 3). Separation Ratio, the ratio of voting right to cash flow right;
4) Private Control, a dummy variable equals one if the controlling shareholder is a private enterprise or family; and
5) One of three indices measuring investor protection: Independent, Internal Institutional Holding, and External
Institutional Holding, of which a larger number indicates better investor protection. Independent is the percentage
of independent members on the board. Internal Institutional Holding is the total percentage owned by the ten
largest shareholders, excluding the controlling shareholder. External Institutional Holding is the total percentage
owned by the ten largest shareholders of tradable shares. T-statistics based on Huber-White robust standard errors
are shown in parentheses.
Variable Expected Sign Model 1 Model 2 Model 3
Constant 0.0284*
(1.86)
0.0183
(1.34)
0.0256**
(2.43)
FCF + 0.1118*
(1.82)
0.1139*
(1.86)
0.1101*
(1.84)
Cash Flow Right - 0.0002
(1.58)
0.0003*
(1.82)
0.0003*
(1.63)
Separation Ratio + 0.0066*
(1.79)
0.0070*
(1.89)
0.0067*
(1.81)
Private Control Dummy + 0.0078
(0.95)
0.0077
(0.94)
0.0079
(0.97)
Independent - -0.0004
(-0.14)
Internal Institutional Holding - 0.0002
(1.03)
External Institutional Holding - 0.0001
(0.33)
Adj. R-sq 0.022 0.025 0.022
Note * ** and *** indicate 10% 5% and 1% levels of significance, respectively.