How group A Streptococcus circumvents host phagocyte defenses
Overall student visa trends
March 2017

Caveats and notes
International student
International student- Students who are non-residents of New Zealand and Australia who:
• Have entered into New Zealand expressly with the intention to study
• Have enrolled in a New Zealand provider offshore, where the educational programme is delivered in-market.
Rule 18 – Rule governing English Language requirements for certain international students. More information about this is available on
http://www.nzqa.govt.nz/about-us/our-role/legislation/nzqa-rules/nzqf-related-rules/programme-approval-and-accreditation/8/18/
Section 61 – visas issued to people who are currently in New Zealand outside of Immigration NZ policy.
Scope of this document
• This dashboard excludes dependants, applicants under Section 61, and applications for variation of conditions.
• There is a potential delay between students having their visas approved and their actual entry into New Zealand, therefore the figures
shown here may not necessarily represent the actual number of students currently in New Zealand.
The student visa dashboard does not include all international students:
• Student visas only capture students who enter New Zealand with a student visa. These students are mostly those who are planning to
study for more than three months.
• Students who undertake a course less than three months in duration are not required to enter on a student visa. Students who do
choose to enter on a visitor visa (usually from visa-free nationalities) are not captured in this dashboard.
• Working holiday visas allow students to study for up to six months. Those who enter NZ on a working holiday visa and plan on taking
up this option are not included in this dashboard. These factors will affect private training establishments (PTE) numbers.
2
3
Acronyms
Acronyms
FSV – First-time student visas – The number of visas issued to students for the first time. Visas for dependants and section 61 applicants are
excluded since these people do not fall under the definition of international students.
RSV – Returning student visas – The number of visas issued to students subsequent to the first issuing of visas. Visas for dependants and
section 61 applicants do not fall under the definition of international students.
TSV- Total student visas – The number of visas issued to students, either for the first time, or after the first time. Declined visas are not
included. Visas for dependants and section 61 applicants are excluded since these people do not fall under the definition of international
students.
VSV- Valid Student visas – the number of people holding a student visa and/or permit at the beginning of each calendar month. Visas for
dependants are excluded. The presented figures can be interpreted as the number per month of international students with authority to study
in a course of three or greater months in duration. This does not mean that these students are present in New Zealand for the entire duration of
their visa.
YTD – Year-to-date
Sectors
ITP- Institutes of Technology and Polytechnics
PTE- Private Training Establishments, including Private Training Establishments which receive government funding for
Schools – includes all students in primary, intermediate and secondary schools.
Additional notes
• Results for YTD this year will be compared to the YTD 2016 unless otherwise stated.
• VSV are being reported on for the first time in this dashboard.

4
Executive summary
1. The 2017 year is looking positive so far. TSV (+17%, +4,712), FSV (8%, +855), and RSV (23%, 3,343) have all increased for the YTD 2017
when compared with the YTD 2016. VSV for 1 April 2017 have increased by 3% (+1,725) when compared to 1 April 2016.
• TSV for the universities sector increased by 17% (+1,796), due to an increase in FSV (+26%, +708). The increase in FSV is from the
USA (+45%,+251), India (+44%, +120), and Viet Nam (+239%, +98) markets.
• PTE sector TSV increased by 9%(+684) for the YTD 2017, compared to the YTD 2016. RSV increased by 27%(+885). However, FSV
had a 5% decrease (-201). This was due to a 54% (-648) decrease in FSV for the India market.
• TSV for the Schools sector grew by 33% (+1,469), driven by the TSV from secondary schools for China (+40%, +662) and Korea
(+29%, +170).
• RSV for the YTD 2017 increased by 23%. Over half of this growth came from Chinese students in schools and universities, which
indicates that a higher number of students are choosing to stay in New Zealand.
• VSV for April 2017 are stable. PTE VSV have decreased, but VSV for all other sectors have more than offset the VSV PTE decrease.
2. The China market continues to grow. FSV are up 18% (+339), particularly in the schools (+30%, +118) and PTE sectors (24%, +135). RSV
increased across all sectors, particularly in the universities (+19%, +891) and schools (+47%, +625) sectors.
3. The India market is rebalancing with PTE FSV decreasing (-54%, -648) while universities FSV have increased (+44%, +120).
Outlook for the year ahead
4. Indications are that student numbers will be up on last year. However, there is uncertainty around how the recent immigration changes
will impact on migration-focused students.
Cautionary note: This dashboard presents data for three months. The timeframe used in this dashboard is too brief to draw robust analytical conclusions.
5
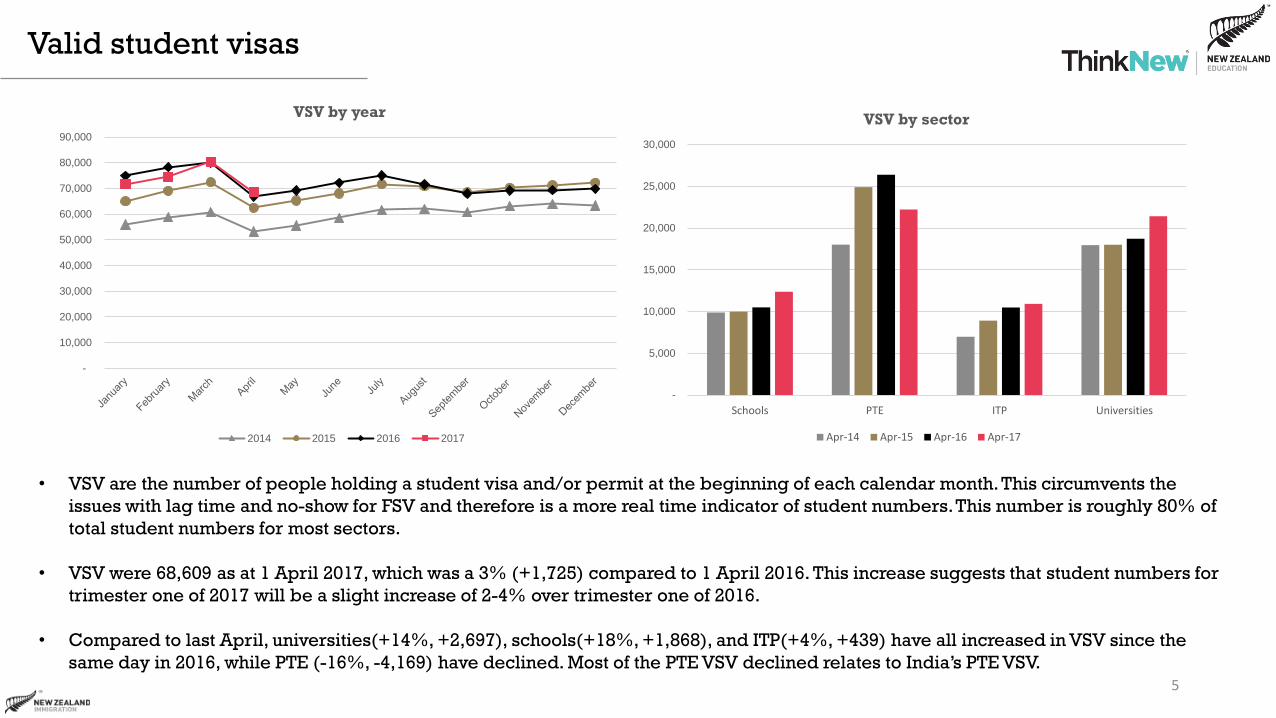
• VSV are the number of people holding a student visa and/or permit at the beginning of each calendar month. This circumvents the
issues with lag time and no-show for FSV and therefore is a more real time indicator of student numbers. This number is roughly 80% of
total student numbers for most sectors.
• VSV were 68,609 as at 1 April 2017, which was a 3% (+1,725) compared to 1 April 2016. This increase suggests that student numbers for
trimester one of 2017 will be a slight increase of 2-4% over trimester one of 2016.
• Compared to last April, universities(+14%, +2,697), schools(+18%, +1,868), and ITP(+4%, +439) have all increased in VSV since the
same day in 2016, while PTE (-16%, -4,169) have declined. Most of the PTE VSV declined relates to India’s PTE VSV.
Valid student visas
-
10,000
20,000
30,000
40,000
50,000
60,000
70,000
80,000
90,000
VSV by year
2014 2015 2016 2017
-
5,000
10,000
15,000
20,000
25,000
30,000
Schools PTE ITP Universities
VSV by sector
Apr-14 Apr-15 Apr-16 Apr-17

Comparison to previous years (Cumulative)
6
• TSV for March 2017 are up (+24%, +2,694) compared to March 2016.
• FSV for March 2017 have increased (12%, +331) compared to March 2016.
• RSV have increased (+29%, +2,363) compared to March 2016. Many visas expire on 31 March, which means that RSV generally peak in March.
Most of this RSV increase comes from China, and was spread across all sectors.

7
• The RSV increase from China is a reflection of the increased FSV during 2015 and
2016 (9,053 and 9,624 respectively).
• RSV for India increased by +34% (+584) which was responsible for an additional
15% of the RSV increase. RSV increases were in the PTE (+29%, +278) and ITP
(+41%, +231) sectors. This reflects the increase in FSV before rule 18 in 2015.
• All sectors had increases, led by the schools sector (+38%, +1,142), the universities
sector (+39%, +1,088), with increases from the PTE (+27%, +885) and ITP sectors
(+29%, +772).
• All regions showed RSV increases, especially Auckland (+24%, +2,447), Canterbury
(+25%, +417) and Wellington (+21%, +257).
Returning student visas
-
1,000
2,000
3,000
4,000
5,000
6,000
7,000
8,000
9,000
10,000
Schools ITPs PTEs Universities
RSV by sector
2014 YTD 2015 YTD 2016 YTD 2017 YTD
• RSV for the YTD 2017 increased by
23% (3,343) compared to the YTD
2016. This increase was multiple
markets, particularly China and India.
• RSV for China increased by +25%
(+2,184), and were responsible for
57% of the overall increase. RSV
increased across all sectors, especially
the schools(+47%, +625) and
universities (+19%, +891) sectors.

Trends by market

Global region definitions
In order of appearance:
South East Asia includes: Brunei Darussalam, Cambodia, Indonesia, Laos, Malaysia, Myanmar, Philippines, Singapore,
Thailand, and Viet Nam.
Latin America includes: Argentina, Bolivia, Brazil, Chile, Colombia, Ecuador, El Salvador, Guatemala, Mexico,
Nicaragua, Panama, Paraguay, Peru, Suriname, Trinidad and Tobago, Turks and Caicos Islands, Uruguay, Venezuela,
Cuba, Honduras, St Lucia, Costa Rica, Dominican Republic, Belize, Dominica, St Vincent and the Grenadines, Guyana,
and Honduras.
Europe includes: Austria, Belarus, Belgium, Bulgaria, Croatia, Czech Republic, Denmark, Estonia, Finland, France,
Georgia, Germany, UK, Greece, Hungary, Iceland, Ireland, Italy, Latvia, Liechtenstein, Lithuania, Luxembourg, Macedonia,
Netherlands, Norway, Poland, Portugal, Romania, Russia, Serbia, Serbia & Montenegro, Slovakia, Spain, Sweden,
Switzerland, Turkey, Ukraine, Yugoslavia, Kosovo, Armenia, Bosnia and Herzegovina, Albania, Andorra, Cyprus, Slovenia,
and Monaco.
Middle East includes: Bahrain, Iran, Iraq, Israel, Jordan, Kuwait, Lebanon, Libya, Oman, Palestine, Qatar, Saudi Arabia,
Syria, United Arab Emirates, and Yemen.
9

10
All markets March 2017
In brief All markets: TSV by sector (*)
YTD FSV RSV TSV2014 YTD 2015 YTD 2016 YTD 2017 YTD
Change
Number
Change
Percentage
Visas 11,352 20,457 31,809 Schools 4,875 4,953 4,454 5,923 1,469 33%
Change No. 885 3,827 4,712 ITP 3,677 4,587 4,486 5,288 802 18%
Change Percent 8% 23% 17% PTE 7,813 8,418 7,270 7,954 684 9%
Universities 10,893 10,903 10,773 12,569 1,796 17%
Total 27,258 28,861 26,983 31,734 4,751 18%
All markets: Cumulative FSV and RSV All markets: FSV by sector (*)
2014 YTD 2015 YTD 2016 YTD 2017 YTDChange
Number
Change
Percentage
Schools 1,677 1,669 1,534 1,861 327 21%
ITP 1,295 1,988 2,014 2,104 90 4%
PTE 4,440 4,914 4,040 3,839 201- -5%
Universities 2,625 2,836 2,772 3,480 708 26%
Total 10,037 11,407 10,360 11,284 924 9%
All markets: TSV by region
Region 2014 YTD 2015 YTD 2016 YTD 2017 YTD
Change
Number
Change
Percentage
Auckland 16,246 17,405 15,930 18,839 2,909 18%
Canterbury 2,702 2,806 2,816 3,231 415 15%
Wellington 2,021 2,038 2,021 2,433 412 20%
Waikato 1,677 1,669 1,671 1,936 265 16%
Otago 1,644 1,638 1,537 1,783 246 16%
Other 3,045 3,437 3,122 3,587 465 15%
Total 27,335 28,993 27,097 31,809 4,712 17%
All markets: TSV approved in 2014-2017
All markets: FSVs approved in 2014-2017
0
1000
2000
3000
4000
5000
6000
0
2000
4000
6000
8000
10000
12000
14000
16000
2014 2015 2016 3 yr Av 2017
-
5,000
10,000
15,000
20,000
25,000
30,000
35,000
2013
YTD
2014
YTD
2015
YTD
2016
YTD
2017
YTD
Average
of
previous
3 years
FSV RSV
(*) Please note that numbers by sector may not always add up to the same as the
total because sector is not always stated.
Changes are from the YTD 2016 to the YTD 2017
• TSV increased by 17% (+4,712) from the YTD 2016 to the YTD 2017. FSV (+8%, +885) and RSV (+23%, +3,827) both increased.
• All markets profiled have shown increases apart from the India, Malaysia, and Germany markets, which were stable, and the Saudi Arabian market, which has
declined.
• All sectors showed increases in both TSV and FSV, apart from PTE sector, which had a decrease in FSV.
• All regions showed increased in TSV, apart from Hawke’s Bay, Nelson and Taranaki, which were flat.

11
China March 2017
In brief China: TSV by sector (*)
YTD FSV RSV TSV2014 YTD 2015 YTD 2016 YTD 2017 YTD
Change
Number
Change
Percentage
Visas 2,212 10,945 13,157 Schools 1,322 1,574 1,706 2,449 743 44%
Change No. 339 2,184 2,523 ITP 1,502 1,670 1,603 1,972 369 23%
Change Percent 18% 25% 24% PTE 1,641 1,877 1,897 2,383 486 26%
Universities 4,889 5,109 5,428 6,350 922 17%
Total 9,354 10,230 10,634 13,154 2,520 24%
China: FSV by sector (*)
2014 YTD 2015 YTD 2016 YTD 2017 YTDChange
Number
Change
Percentage
Schools 308 380 388 506 118 30%
ITP 219 247 279 333 54 19%
PTE 427 571 570 705 135 24%
Universities 564 537 636 667 31 5%
Total 1,518 1,735 1,873 2,211 338 18%
China: TSV by region
Region 2014 YTD 2015 YTD 2016 YTD 2017 YTD
Change
Number
Change
Percentage
Auckland 6,069 6,754 6,947 8,655 1,708 25%
Canterbury 893 1,037 1,071 1,323 252 24%
Waikato 762 709 817 962 145 18%
Wellington 632 721 796 955 159 20%
Otago 434 408 465 476 11 2%
Other 564 601 538 786 248 46%
Total 9,354 10,230 10,634 13,157 2,523 24%
China: TSV approved in 2014-2017
China: FSV approved in 2014-2017
China: Cumulative FSV and RSV
-
200
400
600
800
1,000
1,200
-
1,000
2,000
3,000
4,000
5,000
6,000
7,000
8,000
2014 2015 2016 Average 2017
-
2,000
4,000
6,000
8,000
10,000
12,000
14,000
FSV RSV
(*) Please note that numbers by sector may not always add up to the same as
the total because sector is not always stated.
Changes are from the YTD 2016 to the YTD 2017
• TSV increased by 24% (+2,523) from the YTD 2016 to the YTD 2017.
• RSV increased across all sectors, especially the schools(+47%, +625) and universities(+19%, +891) sectors.
• The increase in FSV was led by the schools (+30%, +118) and PTE (+24%, +135) sectors.
• VSV for China increased 18% (+3,704) from 1 April 2017 compared to 1 April 2016, and now exceed 23,000.
12
India March 2017
In brief India: TSV by sector (*)
YTD FSV RSV TSV2014 YTD 2015 YTD 2016 YTD 2017 YTD
Change
Number
Change
Percentage
Visas 2,173 2,300 4,473 Schools 19 31 27 33 6 22%
Change No. 483- 584 101 ITP 936 1,675 1,721 2,005 284 17%
Change Percent -18% 34% 2% PTE 3,033 3,097 2,158 1,788 370- -17%
Universities 437 398 465 647 182 39%
Total 4,425 5,201 4,371 4,473 102 2%
India: FSV by sector (*)
2014 YTD 2015 YTD 2016 YTD 2017 YTDChange
Number
Change
Percentage
Schools 7 19 19 11 8- -42%
ITP 592 1,234 1,157 1,210 53 5%
PTE 2,059 2,063 1,210 562 648- -54%
Universities 242 228 270 390 120 44%
Total 2,900 3,544 2,656 2,173 483- -18%
India: TSV by region
Region 2014 YTD 2015 YTD 2016 YTD 2017 YTD
Change
Number
Change
Percentage
Auckland 3,081 3,526 2,666 2,743 77 3%
Canterbury 396 392 436 402 34- -8%
Bay of Plenty 358 446 401 340 61- -15%
Wellington 152 188 198 238 40 20%
Waikato 134 195 194 280 86 44%
Other 304 454 477 470 7- -1%
Total 4,425 5,201 4,372 4,473 101 2%
India: TSV approved in 2014-2017
India: FSV approved in 2014-2017
India: Cumulative FSV and RSV
-
200
400
600
800
1,000
1,200
1,400
1,600
1,800
-
500
1,000
1,500
2,000
2,500
3,000
2014 2015 2016 Average 2017
-
1,000
2,000
3,000
4,000
5,000
6,000
2013YTD
2014YTD
2015YTD
2016YTD
2017YTD
Averageof
previous3 years
FSV RSV
(*) Please note that numbers by sector may not always add up to the same as
the total because sector is not always stated.
Changes are from the YTD 2016 to the YTD 2017
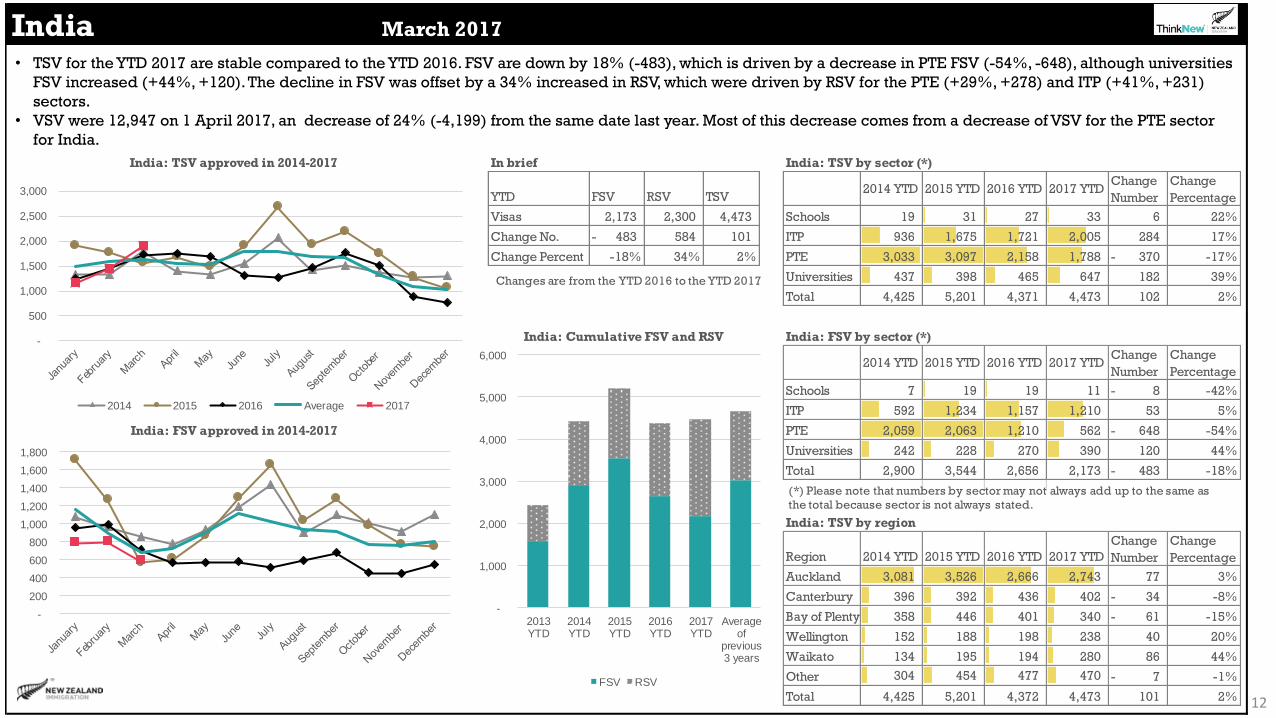
• TSV for the YTD 2017 are stable compared to the YTD 2016. FSV are down by 18% (-483), which is driven by a decrease in PTE FSV (-54%, -648), although universities
FSV increased (+44%, +120). The decline in FSV was offset by a 34% increased in RSV, which were driven by RSV for the PTE (+29%, +278) and ITP (+41%, +231)
sectors.
• VSV were 12,947 on 1 April 2017, an decrease of 24% (-4,199) from the same date last year. Most of this decrease comes from a decrease of VSV for the PTE sector
for India.

13
Japan March 2017
In brief Japan: TSV by sector (*)
YTD FSV RSV TSV2014 YTD 2015 YTD 2016 YTD 2017 YTD
Change
Number
Change
Percentage
Visas 709 574 1,283 Schools 556 551 477 556 79 17%
Change No. 11- 78 67 ITP 75 63 78 53 25- -32%
Change Percent -2% 16% 6% PTE 382 387 378 361 17- -4%
Universities 310 287 274 313 39 14%
Total 1,323 1,288 1,207 1,283 76 6%
Japan: FSV by sector (*)
2014 YTD 2015 YTD 2016 YTD 2017 YTDChange
Number
Change
Percentage
Schools 162 191 208 221 13 6%
ITP 46 33 61 23 38- -62%
PTE 299 310 314 304 10- -3%
Universities 118 133 128 161 33 26%
Total 625 667 711 709 2- 0%
Japan: TSV by region
Region 2014 YTD 2015 YTD 2016 YTD 2017 YTD
Change
Number
Change
Percentage
Auckland 577 565 518 541 23 4%
Canterbury 236 241 237 255 18 8%
Manawatu 134 120 91 126 35 38%
Wellington 93 102 101 101 - 0%
Otago 86 77 61 67 6 10%
Other 201 202 208 193 15- -7%
Total 1,327 1,307 1,216 1,283 67 6%
Japan: TSV approved in 2014-2017
Japan: FSV approved in 2014-2017
Japan: Cumulative FSV and RSV
-
100
200
300
400
500
600
-
100
200
300
400
500
600
700
800
2014 2015 2016 Average 2017
-
200
400
600
800
1,000
1,200
1,400
2013YTD
2014YTD
2015YTD
2016YTD
2017YTD
Averageof
previous3 years
FSV RSV
(*) Please note that numbers by sector may not always add up to the same as
the total because sector is not always stated.
Changes are from the YTD 2016 to the YTD 2017
• TSV for the YTD 2017 are increased by 6% (+67) compared to the YTD 2016. The ITP and PTE sectors have declined in the YTD 2017 compared to the YTD 2016, while
the schools and universities sectors have increased.
• VSV were 2,895 on 1 April 2017, an increase of 4% (+100) over the same date last year.

14
Korea March 2017
In brief Korea: TSV by sector (*)
YTD FSV RSV TSV2014 YTD 2015 YTD 2016 YTD 2017 YTD
Change
Number
Change
Percentage
Visas 610 1,282 1,892 Schools 1,021 896 706 935 229 32%
Change No. 48 180 228 ITP 101 99 98 123 25 26%
Change Percent 9% 16% 14% PTE 541 514 516 480 36- -7%
Universities 525 383 344 354 10 3%
Total 2,188 1,892 1,664 1,892 228 14%
Korea: FSV by sector (*)
2014 YTD 2015 YTD 2016 YTD 2017 YTDChange
Number
Change
Percentage
Schools 261 245 202 253 51 25%
ITP 32 38 39 43 4 10%
PTE 286 264 294 283 11- -4%
Universities 53 31 27 31 4 15%
Total 632 578 562 610 48 9%
Korea: TSV by region
Region 2014 YTD 2015 YTD 2016 YTD 2017 YTD
Change
Number
Change
Percentage
Auckland 1,506 1,300 1,139 1,205 66 6%
Bay of Plenty 159 164 159 254 95 60%
Canterbury 181 141 108 119 11 10%
Waikato 102 74 54 59 5 9%
Wellington 74 57 44 65 21 48%
Other 166 156 160 190 30 19%
Total 2,188 1,892 1,664 1,892 228 14%
Korea: TSV approved in 2014-2017
Korea: FSV approved in 2014-2017
Korea: Cumulative FSV and RSV
-
50
100
150
200
250
-
100
200
300
400
500
600
700
800
900
1,000
2014 2015 2016 Average 2017
-
500
1,000
1,500
2,000
2,500
2013YTD
2014YTD
2015YTD
2016YTD
2017YTD
Averageof
previous3 years
FSV RSV
(*) Please note that numbers by sector may not always add up to the same as
the total because sector is not always stated.
Changes are from the YTD 2016 to the YTD 2017
• TSV for 2017 are up 14%(+ 228) compared to the YTD 2016. This is in contrast to the general trend for the Korea market, which has been declining for a number of
years due to less than favourable economic conditions, coupled with an increase in the quality of Korean education.
• FSV from Korea have decreased for the PTE sector and increased for the schools sector. Most of the RSV increase is in the schools sector.
• There were 3,385 VSV on April 1 2017, which was an 11% increase compared to the same date last year (+322).

15
South East Asia March 2017
In brief South East Asia: TSV by sector (*)
YTD FSV RSV TSV2014 YTD 2015 YTD 2016 YTD 2017 YTD
Change
Number
Change
Percentage
Visas 1,433 2,277 3,710 Schools 699 852 661 822 161 24%
Change No. 279 344 623 ITP 282 265 286 342 56 20%
Change Percent 24% 18% 20% PTE 743 852 701 892 191 27%
Universities 1,692 1,521 1,433 1,650 217 15%
Total 3,416 3,490 3,081 3,706 625 20%
South East Asia: Cumulative FSV and RSV South East Asia: FSV by sector (*)
2014 YTD 2015 YTD 2016 YTD 2017 YTDChange
Number
Change
Percentage
Schools 210 281 193 222 29 15%
ITP 100 104 130 142 12 9%
PTE 483 597 472 555 83 18%
Universities 372 349 356 513 157 44%
Total 1,165 1,331 1,151 1,432 281 24%
South East Asia: TSV by region
Region 2014 YTD 2015 YTD 2016 YTD 2017 YTD
Change
Number
Change
Percentage
Auckland 1,629 1,698 1,463 1,873 410 28%
Wellington 452 362 363 449 86 24%
Canterbury 355 388 356 398 42 12%
Otago 377 401 332 363 31 9%
Manawatu 211 247 171 171 - 0%
Other 395 399 402 456 54 13%
Total 3,419 3,495 3,087 3,710 623 20%
South East Asia: TSV approved in 2014-2017
South East Asia: FSVs approved in 2014-2017
0
100
200
300
400
500
600
700
0
200
400
600
800
1000
1200
1400
1600
2014 2015 2016 3 yr Av 2017
-
500
1,000
1,500
2,000
2,500
3,000
3,500
4,000
2013
YTD
2014
YTD
2015
YTD
2016
YTD
2017
YTD
Average
of
previous
3 years
FSV RSV
(*) Please note that numbers by sector may not always add up to the same as the
total because sector is not always stated.
Changes are from the YTD 2016 to the YTD 2017
• TSV for the YTD 2017 are up 20%(+ 623) compared to the YTD 2016.
• The main contributors to this increase were Viet Nam (+35%, +187) and Thailand (+17%, +152). The increase was across all sectors, but the universities dominated
for Viet Nam and for Thailand, schools and universities showed TSV increases.

16
Malaysia March 2017
In brief Malaysia: TSV by sector (*)
YTD FSV RSV TSV2014 YTD 2015 YTD 2016 YTD 2017 YTD
Change
Number
Change
Percentage
Visas 217 502 719 Schools 43 47 43 46 3 7%
Change No. 16- 38 22 ITP 50 38 39 63 24 62%
Change Percent -7% 8% 3% PTE 34 36 40 53 13 33%
Universities 648 572 573 557 16- -3%
Total 775 693 695 719 24 3%
Malaysia: FSV by sector (*)
2014 YTD 2015 YTD 2016 YTD 2017 YTDChange
Number
Change
Percentage
Schools 16 15 16 12 4- -25%
ITP 11 11 13 24 11 85%
PTE 18 22 21 28 7 33%
Universities 114 113 181 153 28- -15%
Total 159 161 231 217 14- -6%
Malaysia: TSV by region
Region 2014 YTD 2015 YTD 2016 YTD 2017 YTD
Change
Number
Change
Percentage
Auckland 288 268 272 296 24 9%
Otago 187 190 151 158 7 5%
Canterbury 101 96 117 115 2- -2%
Wellington 88 47 71 52 19- -27%
Waikato 46 43 50 40 10- -20%
Other 66 51 36 58 22 61%
Total 776 695 697 719 22 3%
Malaysia: TSV approved in 2014-2017
Malaysia: FSV approved in 2014-2017
Malaysia: Cumulative FSV and RSV
-
20
40
60
80
100
120
140
160
-
50
100
150
200
250
300
350
400
2014 2015 2016 Average 2017
-
100
200
300
400
500
600
700
800
900
2013YTD
2014YTD
2015YTD
2016YTD
2017YTD
Averageof
previous3 years
FSV RSV
(*) Please note that numbers by sector may not always add up to the same as
the total because sector is not always stated.
Changes are from the YTD 2016 to the YTD 2017
• TSV for the YTD 2017 were stable(+3%, +22) compared to the YTD 2016. There was a drop in FSV for the universities sector (-14%, -24).
• There were 1,576 VSV on 1 April 2017, which is 13% (+184) more than the same date in 2016.

17
Indonesia March 2017
In brief Indonesia: TSV by sector (*)
YTD FSV RSV TSV2014 YTD 2015 YTD 2016 YTD 2017 YTD
Change
Number
Change
Percentage
Visas 138 191 329 Schools 12 14 20 23 3 15%
Change No. 36 35 71 ITP 19 21 40 45 5 13%
Change Percent 35% 22% 28% PTE 51 53 60 75 15 25%
Universities 157 154 138 186 48 35%
Total 239 242 258 329 71 28%
Indonesia: FSV by sector (*)
2014 YTD 2015 YTD 2016 YTD 2017 YTDChange
Number
Change
Percentage
Schools 4 6 6 9 3 50%
ITP 7 11 20 19 1- -5%
PTE 22 22 36 38 2 6%
Universities 49 47 40 72 32 80%
Total 82 86 102 138 36 35%
Indonesia: TSV by region
Region 2014 YTD 2015 YTD 2016 YTD 2017 YTD
Change
Number
Change
Percentage
Auckland 139 137 127 176 49 39%
Wellington 31 30 29 37 8 28%
Canterbury 25 25 21 32 11 52%
Manawatu 19 23 34 30 4- -12%
Otago 12 12 12 24 12 100%
Other 13 15 35 30 5- -14%
Total 239 242 258 329 71 28%
Indonesia: TSV approved in 2014-2017
Indonesia: FSV approved in 2014-2017
Indonesia: Cumulative FSV and RSV
-
10
20
30
40
50
60
70
80
90
-
20
40
60
80
100
120
140
2014 2015 2016 Average 2017
-
50
100
150
200
250
300
350
2013YTD
2014YTD
2015YTD
2016YTD
2017YTD
Averageof
previous3 years
FSV RSV
(*) Please note that numbers by sector may not always add up to the same as
the total because sector is not always stated.
Changes are from the YTD 2016 to the YTD 2017
• TSV increased by 28% (+71) in the YTD 2017 compared to the YTD 2016. This increase has been focused on the universities sector.
• There were 923 VSV on March 1 2017, an increase of 40% (+ 262) on the same date last year.

18
Thailand March 2017
In brief Thailand: TSV by sector (*)
YTD FSV RSV TSV2014 YTD 2015 YTD 2016 YTD 2017 YTD
Change
Number
Change
Percentage
Visas 339 699 1,038 Schools 516 657 485 546 61 13%
Change No. 44 108 152 ITP 56 37 37 22 15- -41%
Change Percent 15% 18% 17% PTE 266 216 194 272 78 40%
Universities 209 183 170 198 28 16%
Total 1,047 1,093 886 1,038 152 17%
Thailand: FSV by sector (*)
2014 YTD 2015 YTD 2016 YTD 2017 YTDChange
Number
Change
Percentage
Schools 155 221 137 139 2 1%
ITP 18 3 9 2 7- -78%
PTE 196 137 134 172 38 28%
Universities 47 23 15 26 11 73%
Total 416 384 295 339 44 15%
Thailand: TSV by region
Region 2014 YTD 2015 YTD 2016 YTD 2017 YTD
Change
Number
Change
Percentage
Auckland 497 500 423 551 128 30%
Canterbury 131 142 125 135 10 8%
Wellington 77 71 65 78 13 20%
Otago 70 83 69 69 - 0%
Manawatu 69 112 34 31 3- -9%
Other 203 185 170 174 4 2%
Total 1,047 1,093 886 1,038 152 17%
Thailand: TSV approved in 2014-2017
Thailand: FSV approved in 2014-2017
Thailand: Cumulative FSV and RSV
-
20
40
60
80
100
120
140
160
180
-
100
200
300
400
500
600
2014 2015 2016 Average 2017
-
200
400
600
800
1,000
1,200
2013YTD
2014YTD
2015YTD
2016YTD
2017YTD
Averageof
previous3 years
FSV RSV
(*) Please note that numbers by sector may not always add up to the same as
the total because sector is not always stated.
Changes are from the YTD 2016 to the YTD 2017
• TSV for Thailand for the YTD 2017 have increased by 17 %(+ 12) compared to the YTD 2016. The schools and universities sectors have both had increases in
TSV for the YTD 2017. Most of this increase has been in the Auckland region.
• VSV for 1 March 2017 were 2,087, a 9% (+ 170) increase from the same day in 2016.

19
Viet Nam March 2017
In brief Viet Nam: TSV by sector (*)
YTD FSV RSV TSV2014 YTD 2015 YTD 2016 YTD 2017 YTD
Change
Number
Change
Percentage
Visas 267 459 726 Schools 78 70 60 116 56 93%
Change No. 143 44 187 ITP 71 67 76 89 13 17%
Change Percent 115% 11% 35% PTE 121 112 122 158 36 30%
Universities 391 324 281 360 79 28%
Total 661 573 539 723 184 34%
Viet Nam: FSV by sector (*)
2014 YTD 2015 YTD 2016 YTD 2017 YTDChange
Number
Change
Percentage
Schools 16 17 16 32 16 100%
ITP 18 13 24 27 3 13%
PTE 29 33 43 69 26 60%
Universities 80 67 41 139 98 239%
Total 143 130 124 267 143 115%
Viet Nam: TSV by region
Region 2014 YTD 2015 YTD 2016 YTD 2017 YTD
Change
Number
Change
Percentage
Auckland 317 272 269 374 105 39%
Wellington 177 145 132 180 48 36%
Manawatu 46 43 43 45 2 5%
Canterbury 47 41 28 37 9 32%
Otago 22 25 19 22 3 16%
Other 52 47 48 68 20 42%
Total 661 573 539 726 187 35%
Viet Nam: TSV approved in 2014-2017
Viet Nam: FSV approved in 2014-2017
Viet Nam: Cumulative FSV and RSV
-
20
40
60
80
100
120
140
-
50
100
150
200
250
300
350
2014 2015 2016 Average 2017
-
100
200
300
400
500
600
700
800
2013YTD
2014YTD
2015YTD
2016YTD
2017YTD
Averageof
previous3 years
FSV RSV
(*) Please note that numbers by sector may not always add up to the same as
the total because sector is not always stated.
Changes are from the YTD 2016 to the YTD 2017
• TSV for Viet Nam have increased by 35%(+187 ) for the YTD 2017 when compared to the YTD 2016. Most of this increase was in Auckland and Wellington.
• FSV for the universities, and PTE sectors have increased.
• VSV for 1 April 2017 were 1,550, an increase for 23% (+287) since the same day in 2016.

20
Philippines March 2017
In brief Philippines: TSV by sector (*)
YTD FSV RSV TSV2014 YTD 2015 YTD 2016 YTD 2017 YTD
Change
Number
Change
Percentage
Visas 312 127 439 Schools 15 18 16 18 2 13%
Change No. 14 59 73 ITP 59 80 71 92 21 30%
Change Percent 5% 87% 20% PTE 237 383 240 273 33 14%
Universities 30 34 35 55 20 57%
Total 341 515 362 438 76 21%
Philippines: FSV by sector (*)
2014 YTD 2015 YTD 2016 YTD 2017 YTDChange
Number
Change
Percentage
Schools 7 6 6 2 4- -67%
ITP 33 56 56 60 4 7%
PTE 209 349 214 222 8 4%
Universities 11 18 21 27 6 29%
Total 260 429 297 311 14 5%
Philippines: TSV by region
Region 2014 YTD 2015 YTD 2016 YTD 2017 YTD
Change
Number
Change
Percentage
Auckland 257 374 238 279 41 17%
Bay of Plenty 20 41 42 52 10 24%
Canterbury 16 48 35 41 6 17%
Wellington 13 19 14 20 6 43%
Waikato 14 11 12 11 1- -8%
Other 23 25 25 36 11 44%
Total 343 518 366 439 73 20%
Philippines: TSV approved in 2014-2017
Philippines: FSV approved in 2014-2017
Philippines: Cumulative FSV and RSV
-
50
100
150
200
250
300
350
400
450
500
-
50
100
150
200
250
300
350
400
450
500
2014 2015 2016 Average 2017
-
100
200
300
400
500
600
2013YTD
2014YTD
2015YTD
2016YTD
2017YTD
Averageof
previous3 years
FSV RSV
(*) Please note that numbers by sector may not always add up to the same as
the total because sector is not always stated.
Changes are from the YTD 2016 to the YTD 2017
• TSV for the Philippines have increased by 20% (+ 73) in the YTD 2017 compared to the YTD 2016. Most of this increase is from RSV which went from 68 in 2016 to
127 in 2017, an 87% increase, which was spread out across the PTE, ITP and universities sectors.
• VSV on April 1 2017 are 1,736, a decrease of 25% (-591) from the same date in 2016, due to a decline in VSV for PTE students(-40%, -725). VSV for PTE students
for this market peaked in March 2016 and has been declining since then .
21
Latin America March 2017
In brief Latin America: TSV by sector (*)
YTD FSV RSV TSV2014 YTD 2015 YTD 2016 YTD 2017 YTD
Change
Number
Change
Percentage
Visas 1,351 289 1,640 Schools 433 246 164 327 163 99%
Change No. 457 120 577 ITP 29 39 44 61 17 39%
Change Percent 51% 71% 54% PTE 368 628 722 1,086 364 50%
Universities 126 225 102 147 45 44%
Total 956 1,138 1,032 1,621 589 57%
Latin America: Cumulative FSV and RSV Latin America: FSV by sector (*)
2014 YTD 2015 YTD 2016 YTD 2017 YTDChange
Number
Change
Percentage
Schools 405 222 150 309 159 106%
ITP 18 20 26 35 9 35%
PTE 317 531 627 902 275 44%
Universities 74 137 60 86 26 43%
Total 814 910 863 1,332 469 54%
Latin America: TSV by region
Region 2014 YTD 2015 YTD 2016 YTD 2017 YTD
Change
Number
Change
Percentage
Auckland 534 746 715 1,072 357 50%
Canterbury 134 72 71 135 64 90%
Southland 21 70 50 129 79 158%
Wellington 105 96 45 98 53 118%
Bay of Plenty 27 52 27 56 29 107%
Other 172 137 155 150 5- -3%
Total 993 1,173 1,063 1,640 577 54%
Latin America: TSV approved in 2014-2017
Latin America: FSVs approved in 2014-2017
0
100
200
300
400
500
600
700
0
100
200
300
400
500
600
700
800
2014 2015 2016 3 yr Av 2017
-
200
400
600
800
1,000
1,200
1,400
1,600
1,800
2013
YTD
2014
YTD
2015
YTD
2016
YTD
2017
YTD
Average
of
previous
3 years
FSV RSV
(*) Please note that numbers by sector may not always add up to the same as the
total because sector is not always stated.
Changes are from the YTD 2016 to the YTD 2017
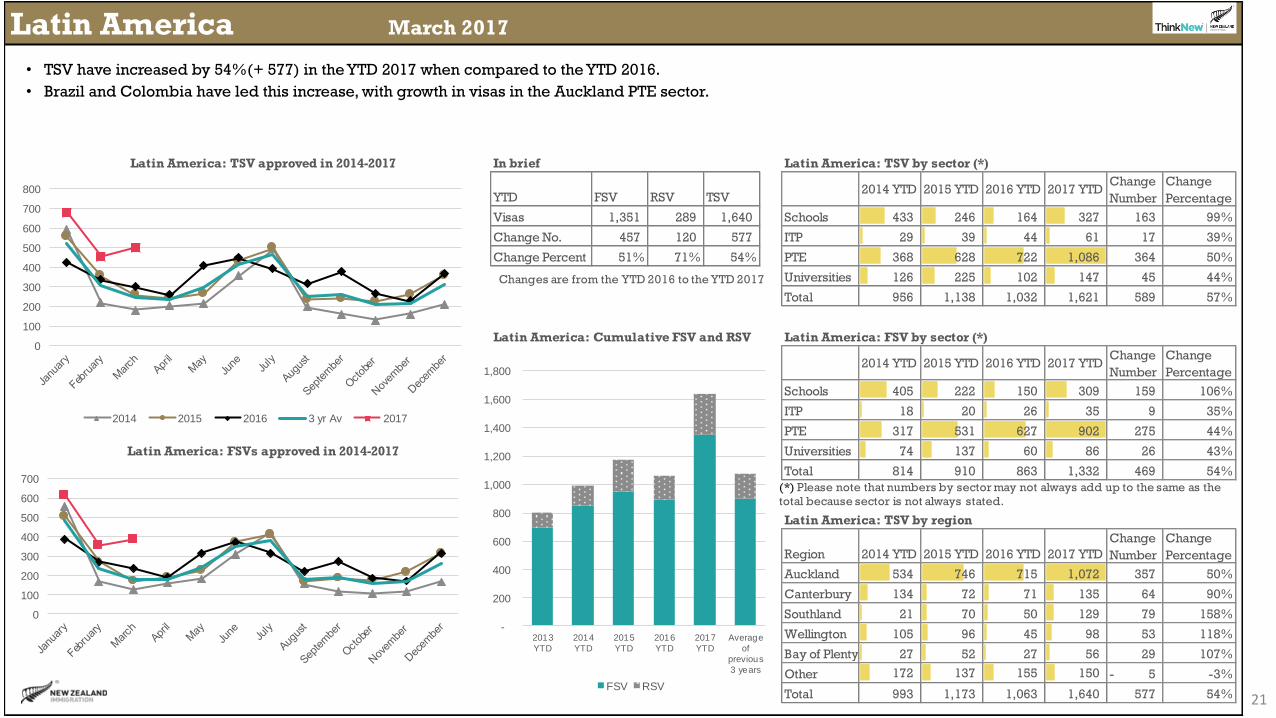
• TSV have increased by 54%(+ 577) in the YTD 2017 when compared to the YTD 2016.
• Brazil and Colombia have led this increase, with growth in visas in the Auckland PTE sector.

22
Brazil March 2017
In brief Brazil: TSV by sector (*)
YTD FSV RSV TSV2014 YTD 2015 YTD 2016 YTD 2017 YTD
Change
Number
Change
Percentage
Visas 624 126 750 Schools 287 161 129 208 79 61%
Change No. 179 51 230 ITP 14 12 17 24 7 41%
Change Percent 40% 68% 44% PTE 157 297 338 477 139 41%
Universities 57 124 25 37 12 48%
Total 515 594 509 746 237 47%
Brazil: FSV by sector (*)
2014 YTD 2015 YTD 2016 YTD 2017 YTDChange
Number
Change
Percentage
Schools 281 152 123 200 77 63%
ITP 7 5 9 16 7 78%
PTE 136 261 290 391 101 35%
Universities 42 73 12 13 1 8%
Total 466 491 434 620 186 43%
Brazil: TSV by region
Region 2014 YTD 2015 YTD 2016 YTD 2017 YTD
Change
Number
Change
Percentage
Auckland 250 364 339 467 128 38%
Canterbury 61 38 41 77 36 88%
Wellington 56 45 22 36 14 64%
Southland 15 49 24 56 32 133%
Bay of Plenty 18 34 13 36 23 177%
Other 127 76 81 78 3- -4%
Total 527 606 520 750 230 44%
Brazil: TSV approved in 2014-2017
Brazil: FSV approved in 2014-2017
Brazil: Cumulative FSV and RSV
-
50
100
150
200
250
300
350
400
-
50
100
150
200
250
300
350
400
2014 2015 2016 Average 2017
-
100
200
300
400
500
600
700
800
2013YTD
2014YTD
2015YTD
2016YTD
2017YTD
Averageof
previous3 years
FSV RSV
(*) Please note that numbers by sector may not always add up to the same as
the total because sector is not always stated.
Changes are from the YTD 2016 to the YTD 2017
• TSV for the YTD 2017 are up 44% (+230) compared to the YTD 2016. This is due to increased FSV in the schools and PTE sectors.
• VSV for 1 April 2017 were 1,278, a 23% (+ 238) increase from the same date in 2016.
23
Chile March 2017
In brief Chile: TSV by sector (*)
YTD FSV RSV TSV2014 YTD 2015 YTD 2016 YTD 2017 YTD
Change
Number
Change
Percentage
Visas 228 27 255 Schools 111 33 12 86 74 617%
Change No. 115 14 129 ITP 3 8 7 12 5 71%
Change Percent 102% 108% 102% PTE 58 44 87 138 51 59%
Universities 15 14 15 15 - 0%
Total 187 99 121 251 130 107%
Chile: FSV by sector (*)
2014 YTD 2015 YTD 2016 YTD 2017 YTDChange
Number
Change
Percentage
Schools 105 29 12 82 70 583%
ITP 2 1 5 2 3- -60%
PTE 54 40 82 130 48 59%
Universities 8 7 9 10 1 11%
Total 169 77 108 224 116 107%
Chile: TSV by region
Region 2014 YTD 2015 YTD 2016 YTD 2017 YTD
Change
Number
Change
Percentage
Auckland 98 58 77 152 75 97%
Canterbury 41 3 2 27 25 1250%
Wellington 32 7 5 27 22 440%
Bay of Plenty 5 15 12 10 2- -17%
Southland 4 4 3 15 12 400%
Other 11 21 27 24 3- -11%
Total 191 108 126 255 129 102%
Chile: TSV approved in 2014-2017
Chile: FSV approved in 2014-2017
Chile: Cumulative FSV and RSV
-
20
40
60
80
100
120
140
160
-
20
40
60
80
100
120
140
160
2014 2015 2016 Average 2017
-
50
100
150
200
250
300
2013YTD
2014YTD
2015YTD
2016YTD
2017YTD
Averageof
previous3 years
FSV RSV
(*) Please note that numbers by sector may not always add up to the same as
the total because sector is not always stated.
Changes are from the YTD 2016 to the YTD 2017
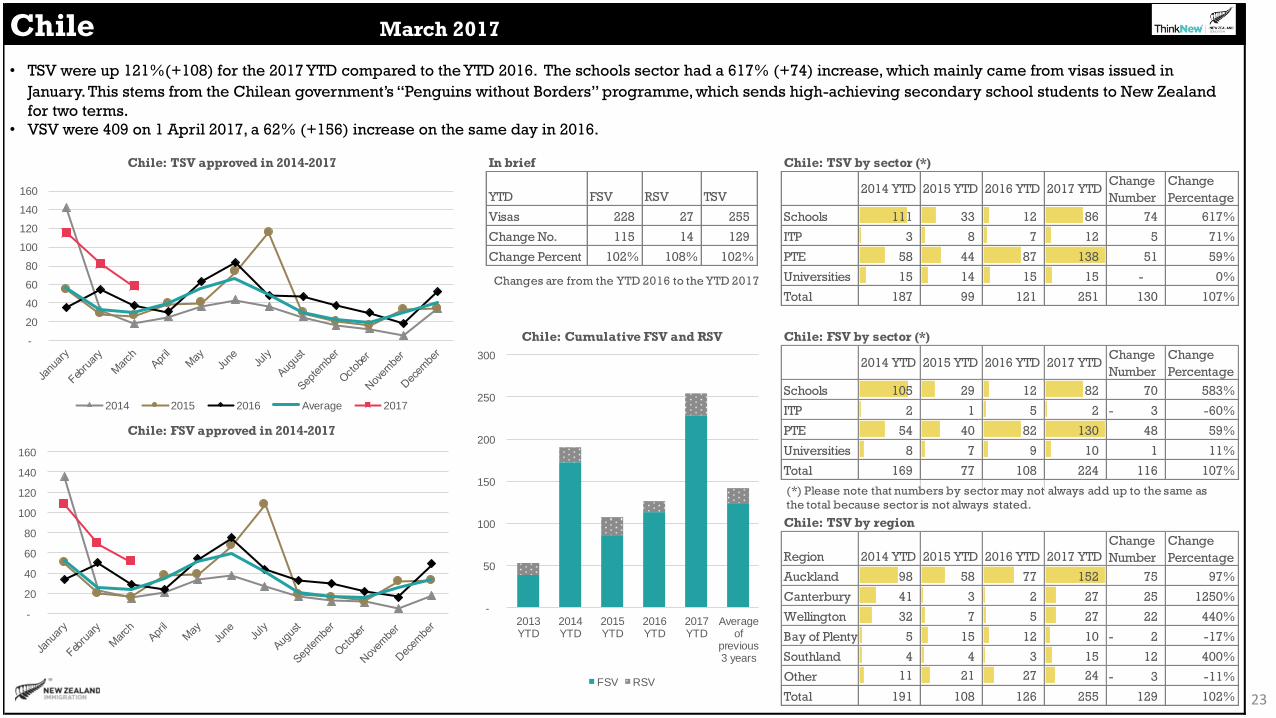
• TSV were up 121%(+108) for the 2017 YTD compared to the YTD 2016. The schools sector had a 617% (+74) increase, which mainly came from visas issued in
January. This stems from the Chilean government’s “Penguins without Borders” programme, which sends high-achieving secondary school students to New Zealand
for two terms.
• VSV were 409 on 1 April 2017, a 62% (+156) increase on the same day in 2016.

24
Colombia March 2017
In brief Colombia: TSV by sector (*)
YTD FSV RSV TSV2014 YTD 2015 YTD 2016 YTD 2017 YTD
Change
Number
Change
Percentage
Visas 286 85 371 Schools 6 11 3 3 - 0%
Change No. 96 43 139 ITP 4 10 8 11 3 38%
Change Percent 51% 102% 60% PTE 111 225 199 315 116 58%
Universities 20 33 22 42 20 91%
Total 141 279 232 371 139 60%
Colombia: FSV by sector (*)
2014 YTD 2015 YTD 2016 YTD 2017 YTDChange
Number
Change
Percentage
Schools 5 11 3 3 - 0%
ITP 3 5 3 6 3 100%
PTE 92 185 171 247 76 44%
Universities 10 21 13 30 17 131%
Total 110 222 190 286 96 51%
Colombia: TSV by region
Region 2014 YTD 2015 YTD 2016 YTD 2017 YTD
Change
Number
Change
Percentage
Auckland 114 225 187 294 107 57%
Canterbury 19 20 15 18 3 20%
Wellington 7 18 10 24 14 140%
Southland 1 13 12 25 13 108%
Waikato 3 - 3 3 - 0%
Other 4 3 5 7 2 40%
Total 148 279 232 371 139 60%
Colombia: TSV approved in 2014-2017
Colombia: FSV approved in 2014-2017
Colombia: Cumulative FSV and RSV
-
20
40
60
80
100
120
-
20
40
60
80
100
120
140
2014 2015 2016 Average 2017
-
50
100
150
200
250
300
350
400
2013YTD
2014YTD
2015YTD
2016YTD
2017YTD
Averageof
previous3 years
FSV RSV
(*) Please note that numbers by sector may not always add up to the same as
the total because sector is not always stated.
Changes are from the YTD 2016 to the YTD 2017
• TSV increased by 60% (+139) for the YTD 2017. The main contributor was PTE FSV(+44%, +76).
• VSV were 747 on April 1 2017, an increase of 33% (+184) compared to the same day in 2016.

25
USA March 2017
In brief USA: TSV by sector (*)
YTD FSV RSV TSV2014 YTD 2015 YTD 2016 YTD 2017 YTD
Change
Number
Change
Percentage
Visas 864 151 1,015 Schools 27 21 17 27 10 59%
Change No. 271 14 285 ITP 22 22 16 15 1- -6%
Change Percent 46% 10% 39% PTE 20 22 16 32 16 100%
Universities 701 946 674 934 260 39%
Total 770 1,011 723 1,008 285 39%
USA: FSV by sector (*)
2014 YTD 2015 YTD 2016 YTD 2017 YTDChange
Number
Change
Percentage
Schools 8 11 9 13 4 44%
ITP 11 15 7 10 3 43%
PTE 16 15 13 26 13 100%
Universities 564 831 557 808 251 45%
Total 599 872 586 857 271 46%
USA: TSV by region
Region 2014 YTD 2015 YTD 2016 YTD 2017 YTD
Change
Number
Change
Percentage
Auckland 224 320 232 363 131 56%
Otago 209 272 186 292 106 57%
Wellington 142 174 136 158 22 16%
Canterbury 109 141 96 119 23 24%
Manawatu 40 65 36 40 4 11%
Other 47 46 44 43 1- -2%
Total 771 1,018 730 1,015 285 39%
USA: TSV approved in 2014-2017
USA: FSV approved in 2014-2017
USA: Cumulative FSV and RSV
-
100
200
300
400
500
600
700
800
-
100
200
300
400
500
600
700
800
900
2014 2015 2016 Average 2017
-
200
400
600
800
1,000
1,200
2013YTD
2014YTD
2015YTD
2016YTD
2017YTD
Averageof
previous3 years
FSV RSV
(*) Please note that numbers by sector may not always add up to the same as
the total because sector is not always stated.
Changes are from the YTD 2016 to the YTD 2017
• TSV increased by 46%(+ 244) for the YTD 2017 compared to YTD 2016. The main contributor was universities FSVs(+46%, +271). This appears to be a genuine
increase in students rather than processing issues.
• VSV were 1,910 on April 1 2017, which was an increase of 13% (+226) compared to the same day in 2016.
26
Europe March 2017
In brief Europe: TSV by sector (*)
YTD FSV RSV TSV2014 YTD 2015 YTD 2016 YTD 2017 YTD
Change
Number
Change
Percentage
Visas 840 447 1,287 Schools 267 248 244 277 33 14%
Change No. 53 33 86 ITP 143 154 118 129 11 9%
Change Percent 7% 8% 7% PTE 298 290 298 283 15- -5%
Universities 534 490 502 567 65 13%
Total 1,242 1,182 1,162 1,256 94 8%
Europe: Cumulative FSV and RSV Europe: FSV by sector (*)
2014 YTD 2015 YTD 2016 YTD 2017 YTDChange
Number
Change
Percentage
Schools 183 160 193 199 6 3%
ITP 76 73 75 75 - 0%
PTE 211 204 218 197 21- -10%
Universities 245 233 262 338 76 29%
Total 715 670 748 809 61 8%
Europe: TSV by region
Region 2014 YTD 2015 YTD 2016 YTD 2017 YTD
Change
Number
Change
Percentage
Auckland 638 585 545 615 70 13%
Otago 111 96 109 133 24 22%
Wellington 101 112 110 129 19 17%
Canterbury 105 110 119 118 1- -1%
Waikato 115 111 115 86 29- -25%
Other 191 208 203 206 3 1%
Total 1,261 1,222 1,201 1,287 86 7%
Europe: TSV approved in 2014-2017
Europe: FSVs approved in 2014-2017
0
200
400
600
800
1000
1200
0
200
400
600
800
1000
1200
2014 2015 2016 3 yr Av 2017
-
200
400
600
800
1,000
1,200
1,400
1,600
2013
YTD
2014
YTD
2015
YTD
2016
YTD
2017
YTD
Average
of
previous
3 years
FSV RSV
(*) Please note that numbers by sector may not always add up to the same as the
total because sector is not always stated.
Changes are from the YTD 2016 to the YTD 2017
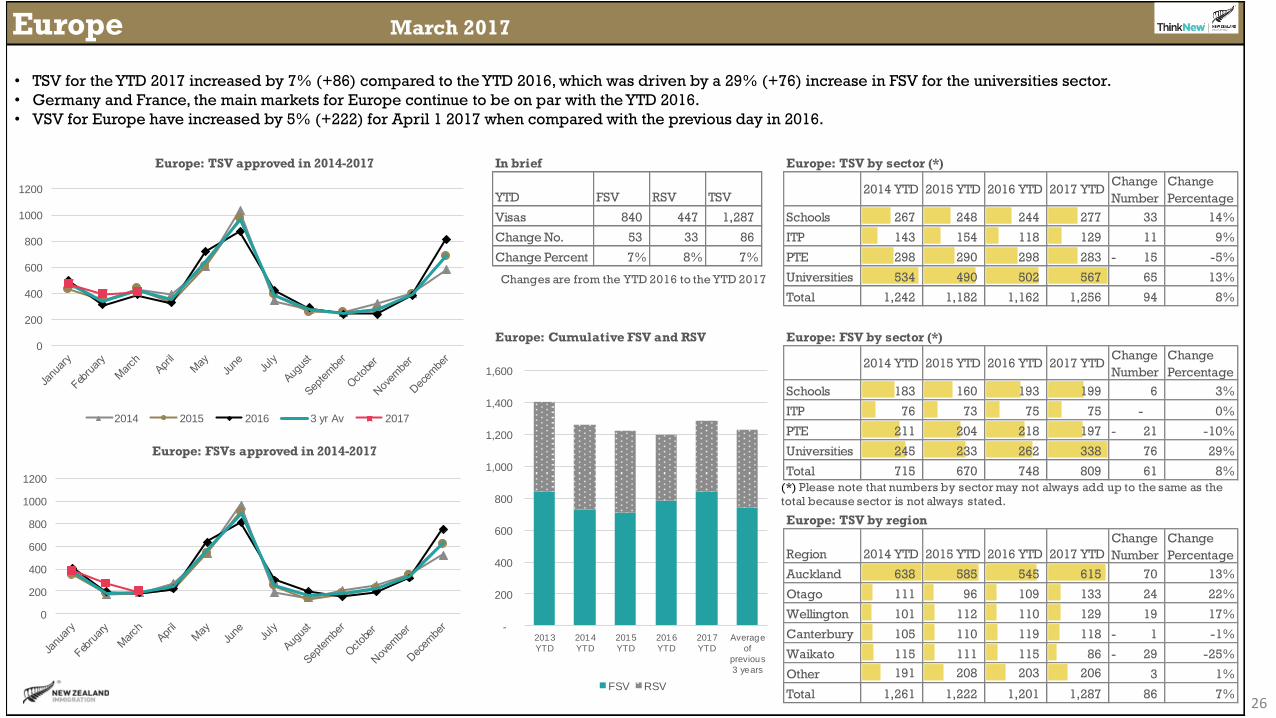
• TSV for the YTD 2017 increased by 7% (+86) compared to the YTD 2016, which was driven by a 29% (+76) increase in FSV for the universities sector.
• Germany and France, the main markets for Europe continue to be on par with the YTD 2016.
• VSV for Europe have increased by 5% (+222) for April 1 2017 when compared with the previous day in 2016.
27
Middle East March 2017
In brief Middle East: TSV by sector (*)
YTD FSV RSV TSV2014 YTD 2015 YTD 2016 YTD 2017 YTD
Change
Number
Change
Percentage
Visas 108 441 549 Schools 27 28 24 29 5 21%
Change No. 40- 62- 102- ITP 195 151 73 68 5- -7%
Change Percent -27% -12% -16% PTE 242 208 114 78 36- -32%
Universities 578 497 439 374 65- -15%
Total 1,042 884 650 549 101- -16%
Middle East: Cumulative FSV and RSV Middle East: FSV by sector (*)
2014 YTD 2015 YTD 2016 YTD 2017 YTDChange
Number
Change
Percentage
Schools 6 9 5 2 3- -60%
ITP 44 8 8 8 - 0%
PTE 66 66 58 54 4- -7%
Universities 91 52 77 44 33- -43%
Total 207 135 148 108 40- -27%
Middle East: TSV by region
Region 2014 YTD 2015 YTD 2016 YTD 2017 YTD
Change
Number
Change
Percentage
Auckland 604 541 393 307 86- -22%
Waikato 133 141 80 95 15 19%
Otago 96 66 63 54 9- -14%
Canterbury 45 41 37 36 1- -3%
Wellington 79 43 38 28 10- -26%
Other 91 61 40 29 11- -28%
Total 1,048 893 651 549 102- -16%
Middle East: TSV approved in 2014-2017
Middle East: FSVs approved in 2014-2017
0
20
40
60
80
100
120
0
100
200
300
400
500
600
2014 2015 2016 3 yr Av 2017
-
200
400
600
800
1,000
1,200
2013
YTD
2014
YTD
2015
YTD
2016
YTD
2017
YTD
Average
of
previous
3 years
FSV RSV
(*) Please note that numbers by sector may not always add up to the same as the
total because sector is not always stated.
Changes are from the YTD 2016 to the YTD 2017
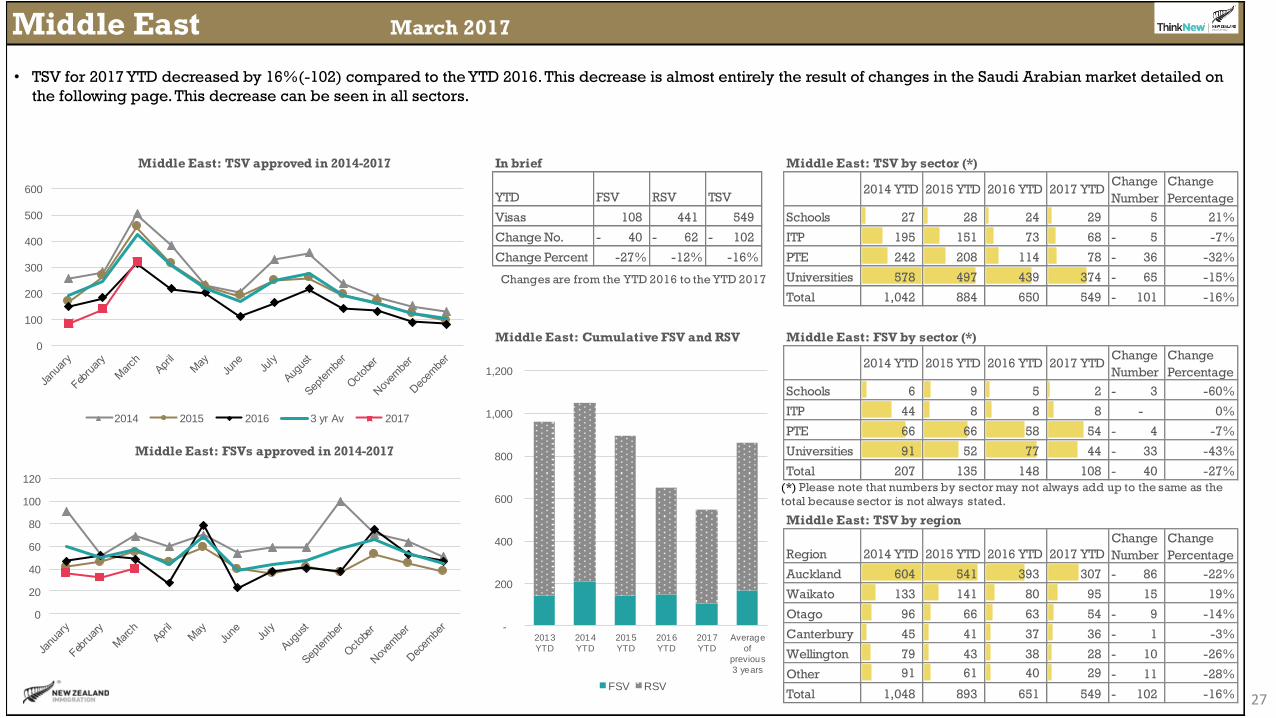
• TSV for 2017 YTD decreased by 16%(-102) compared to the YTD 2016. This decrease is almost entirely the result of changes in the Saudi Arabian market detailed on
the following page. This decrease can be seen in all sectors.

28
Saudi Arabia March 2017
In brief Saudi Arabia: TSV by sector (*)
YTD FSV RSV TSV2014 YTD 2015 YTD 2016 YTD 2017 YTD
Change
Number
Change
Percentage
Visas 49 261 310 Schools 22 28 22 27 5 23%
Change No. 21- 84- 105- ITP 183 144 65 60 5- -8%
Change Percent -30% -24% -25% PTE 225 200 105 57 48- -46%
Universities 358 315 223 166 57- -26%
Total 788 687 415 310 105- -25%
Saudi Arabia: FSV by sector (*)
2014 YTD 2015 YTD 2016 YTD 2017 YTDChange
Number
Change
Percentage
Schools 5 9 4 1 3- -75%
ITP 43 6 4 4 - 0%
PTE 60 63 50 38 12- -24%
Universities 36 19 12 6 6- -50%
Total 144 97 70 49 21- -30%
Saudi Arabia: TSV by region
Region 2014 YTD 2015 YTD 2016 YTD 2017 YTD
Change
Number
Change
Percentage
Auckland 486 458 293 210 83- -28%
Waikato 97 104 42 46 4 10%
Otago 66 41 30 19 11- -37%
Wellington 57 35 16 15 1- -6%
Manawatu 34 27 16 12 4- -25%
Other 51 26 18 8 10- -56%
Total 791 691 415 310 105- -25%
Saudi Arabia: TSV approved in 2014-2017
Saudi Arabia: FSV approved in 2014-2017
Saudi Arabia: Cumulative FSV and RSV
-
10
20
30
40
50
60
70
80
-
50
100
150
200
250
300
350
400
2014 2015 2016 Average 2017
-
100
200
300
400
500
600
700
800
900
2013YTD
2014YTD
2015YTD
2016YTD
2017YTD
Averageof
previous3 years
FSV RSV
(*) Please note that numbers by sector may not always add up to the same as
the total because sector is not always stated.
Changes are from the YTD 2016 to the YTD 2017
• TSV for the YTD 2017 decreased by 25% (-105) compared to the YTD 2016. This is due to restrictions to the Saudi Arabian government’s scholarships programme,
which enabled many Saudi Arabians to come to New Zealand for study.
• VSV were 615 on 1 April 2017, a 23% decrease (-185) compared to the same day in 2016.

Trends by sector

30
Primary March 2017
In Brief Primary: TSV by country
YTD FSV RSV TSV 2014 YTD 2015 YTD 2016 YTD 2017 YTD Chg No. Chg %
Visas 81 122 203 Korea 92 73 47 84 37 79%
Change No. 24 56 80 China 17 25 32 71 39 122%
Change Percent 42% 85% 65% Japan 24 18 21 14 7- -33%
Thailand 9 7 7 7 - 0%
Malaysia 4 7 2 - 2- -100%
Primary: Cumulative FSV and RSV Other 20 29 14 27 13 93%
Total 166 159 123 203 80 65%
Primary: FSV by country
2014 YTD 2015 YTD 2016 YTD 2017 YTD Chg No. Chg %
Korea 52 46 18 30 12 67%
China 11 11 18 36 18 100%
Japan 9 4 11 3 8- -73%
Thailand 6 5 1 1 - 0%
Canada - - - 4 4
Other 14 21 9 7 2- -22%
Total 92 87 57 81 24 42%
Primary: TSV by region
Region 2014 YTD 2015 YTD 2016 YTD 2017 YTD Chg No. Chg %
Auckland 61 67 53 86 33 62%
Bay of Plenty 30 31 25 45 20 80%
Canterbury 33 27 13 26 13 100%
Waikato 18 7 6 16 10 167%
Wellington 8 8 8 11 3 38%
Other 16 19 18 19 1 6%
Total 166 159 123 203 80 65%
Primary: FSV approved in 2013-2017
Primary: TSV approved in 2013-2017
-
5
10
15
20
25
30
35
40
45
-
20
40
60
80
100
120
2014 2015 2016 Average 3y 2017
-
50
100
150
200
250
2013YTD
2014YTD
2015YTD
2016YTD
2017YTD
Averageof
previous3 years
FSV RSV
Changes are from the YTD 2016 to the YTD 2017
• TSV for the primary school sector have increased by 65% for the YTD 2017 compared to the YTD 2016. There were increases TSV for China (+122%, +39) and
Korea (+79%, +37)
• VSV were 567 on 1 April 2017, a 50%(+190) increase on the same day in compared to 1 April 2016.

31
Intermediate March 2017
In Brief Intermediate: TSV by country
YTD FSV RSV TSV 2014 YTD 2015 YTD 2016 YTD 2017 YTD Chg No. Chg %
Visas 94 126 220 Korea 119 93 74 96 22 30%
Change No. 32 42 74 China 21 29 33 75 42 127%
Change Percent 52% 50% 51% Japan 8 8 7 10 3 43%
Thailand 2 6 7 10 3 43%
Taiwan 4 1 8 9 1 13%
Intermediate: Cumulative FSV and RSV Other 13 14 17 20 3 18%
Total 167 151 146 220 74 51%
Intermediate: FSV by country
2014 YTD 2015 YTD 2016 YTD 2017 YTD Chg No. Chg %
Korea 60 42 33 47 14 42%
China 10 12 14 33 19 136%
Japan 1 1 2 4 2 100%
Thailand 1 - 1 3 2 200%
Taiwan 2 - 2 - 2- -100%
Other 6 8 10 7 3- -30%
Total 80 63 62 94 32 52%
Intermediate: TSV by region
Region 2014 YTD 2015 YTD 2016 YTD 2017 YTD Chg No. Chg %
Auckland 116 95 92 150 58 63%
Bay of Plenty 23 28 35 41 6 17%
Canterbury 14 9 6 9 3 50%
Waikato 5 6 4 7 3 75%
Hawke's Bay 3 4 3 4 1 33%
Other 6 9 6 9 3 50%
Total 167 151 146 220 74 51%
Intermediate: FSV approved in 2013-2017
Intermediate: TSV approved in 2013-2017
-
5
10
15
20
25
30
35
40
45
-
10
20
30
40
50
60
70
80
90
100
2014 2015 2016 Average 3y 2017
-
50
100
150
200
250
2013YTD
2014YTD
2015YTD
2016YTD
2017YTD
Averageof
previous3 years
FSV RSV
Changes are from the YTD 2016 to the YTD 2017
• TSV for the intermediate school sector increased by 51%(+74) for the YTD 2017 compared to the YTD 2016. The main increase was for China (+127%, 42).
• VSV were 408 on 1 April 2017, a 9% (+ 34) increase on the same day in 2016.

32
Secondary March 2017
In Brief Secondary: TSV by country
YTD FSV RSV TSV 2014 YTD 2015 YTD 2016 YTD 2017 YTD Chg No. Chg %
Visas 1,686 3,814 5,500 China 1,284 1,520 1,641 2,303 662 40%
Change No. 271 1,044 1,315 Korea 810 730 585 755 170 29%
Change Percent 19% 38% 31% Thailand 505 644 471 529 58 12%
Japan 524 525 449 532 83 18%
Brazil 285 158 128 203 75 59%
Secondary: Cumulative FSV and RSV Other 1,134 1,066 911 1,178 267 29%
Total 4,542 4,643 4,185 5,500 1,315 31%
Secondary: FSV by country
2014 YTD 2015 YTD 2016 YTD 2017 YTD Chg No. Chg %
China 287 357 356 437 81 23%
Japan 152 186 195 214 19 10%
Brazil 280 152 122 197 75 61%
Korea 149 157 151 176 25 17%
Thailand 148 216 135 135 - 0%
Other 489 451 456 527 71 16%
Total 1,505 1,519 1,415 1,686 271 19%
Secondary: TSV by region
Region 2014 YTD 2015 YTD 2016 YTD 2017 YTD Chg No. Chg %
Auckland 2,539 2,668 2,548 3,209 661 26%
Canterbury 437 423 429 544 115 27%
Wellington 313 285 204 362 158 77%
Bay of Plenty 226 253 221 331 110 50%
Waikato 252 233 188 269 81 43%
Other 775 781 595 785 190 32%
Total 4,542 4,643 4,185 5,500 1,315 31%
Secondary: FSV approved in 2013-2017
Secondary: TSV approved in 2013-2017
-
200
400
600
800
1,000
1,200
1,400
-
500
1,000
1,500
2,000
2,500
2014 2015 2016 Average 3y 2017
-
1,000
2,000
3,000
4,000
5,000
6,000
2013YTD
2014YTD
2015YTD
2016YTD
2017YTD
Averageof
previous3 years
FSV RSV
Changes are from the YTD 2016 to the YTD 2017
• The secondary schools sector showed a 31%(+1,315) increase in TSV for the YTD 2017, with RSV increasing by 38%(+1,044) and FSV increasing by 19% (+271)
compared to the YTD 2016. FSV increased for China (+23%, +81), Brazil (+61%, +75), and Chile (+720%,+72), while RSV increases were for China (45%,+581)
and Korea (+33%, +145).
• VSV for secondary school students were 11,404 on 1 April 2017, which was a 17% (+1,644) increase on the same date last year.
33
PTE March 2017
In Brief PTE: TSV by country
YTD FSV RSV TSV 2014 YTD 2015 YTD 2016 YTD 2017 YTD Chg No. Chg %
Visas 3,839 4,115 7,954 India 3,033 3,097 2,158 1,788 370- -17%
Change No. 201- 885 684 China 1,641 1,877 1,897 2,383 486 26%
Change Percent -5% 27% 9% Korea 541 514 516 480 36- -7%
Japan 382 387 378 361 17- -4%
Brazil 157 297 338 477 139 41%
PTE: Cumulative FSV and RSV Other 2,059 2,246 1,983 2,465 482 24%
Total 7,813 8,418 7,270 7,954 684 9%
PTE: FSV by country
2014 YTD 2015 YTD 2016 YTD 2017 YTD Chg No. Chg %
India 2,059 2,063 1,210 562 648- -54%
China 427 571 570 705 135 24%
Japan 299 310 314 304 10- -3%
Brazil 136 261 290 391 101 35%
Korea 286 264 294 283 11- -4%
Other 1,233 1,445 1,362 1,594 232 17%
Total 4,440 4,914 4,040 3,839 201- -5%
PTE: TSV by region
Region 2014 YTD 2015 YTD 2016 YTD 2017 YTD Chg No. Chg %
Auckland 6,162 6,631 5,758 6,220 462 8%
Canterbury 657 698 593 681 88 15%
Bay of Plenty 252 271 214 219 5 2%
Manawatu 181 182 121 149 28 23%
Wellington 155 173 134 206 72 54%
Other 406 463 450 479 29 6%
Total 7,813 8,418 7,270 7,954 684 9%
PTE: FSV approved in 2013-2017
PTE: TSV approved in 2013-2017
-
500
1,000
1,500
2,000
2,500
-
500
1,000
1,500
2,000
2,500
3,000
3,500
4,000
4,500
2014 2015 2016 Average 3y 2017
-
1,000
2,000
3,000
4,000
5,000
6,000
7,000
8,000
9,000
2013YTD
2014YTD
2015YTD
2016YTD
2017YTD
Averageof
previous3 years
FSV RSV
Changes are from the YTD 2016 to the YTD 2017
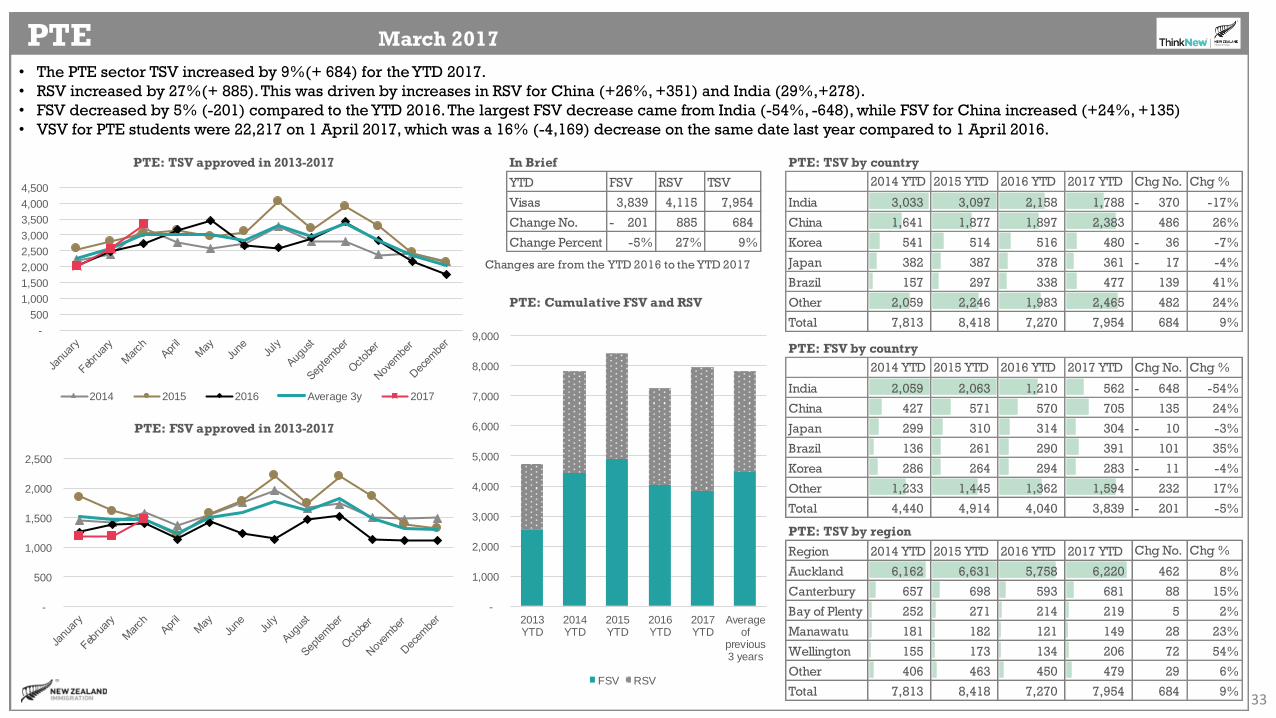
• The PTE sector TSV increased by 9%(+ 684) for the YTD 2017.
• RSV increased by 27%(+ 885). This was driven by increases in RSV for China (+26%, +351) and India (29%,+278).
• FSV decreased by 5% (-201) compared to the YTD 2016. The largest FSV decrease came from India (-54%, -648), while FSV for China increased (+24%, +135)
• VSV for PTE students were 22,217 on 1 April 2017, which was a 16% (-4,169) decrease on the same date last year compared to 1 April 2016.

34
ITP March 2017
In Brief ITP: TSV by country
YTD FSV RSV TSV 2014 YTD 2015 YTD 2016 YTD 2017 YTD Chg No. Chg %
Visas 2,104 3,184 5,288 India 936 1,675 1,721 2,005 284 17%
Change No. 90 712 802 China 1,502 1,670 1,603 1,972 369 23%
Change Percent 4% 29% 18% Korea 101 99 98 123 25 26%
Sri Lanka 60 69 82 116 34 41%
Saudi Arabia 183 144 65 60 5- -8%
ITP: Cumulative FSV and RSV Other 895 930 917 1,012 95 10%
Total 3,677 4,587 4,486 5,288 802 18%
ITP: FSV by country
2014 YTD 2015 YTD 2016 YTD 2017 YTD Chg No. Chg %
India 592 1,234 1,157 1,210 53 5%
China 219 247 279 333 54 19%
Sri Lanka 30 38 57 82 25 44%
Philippines 33 56 56 60 4 7%
Japan 46 33 61 23 38- -62%
Other 375 380 404 396 8- -2%
Total 1,295 1,988 2,014 2,104 90 4%
ITP: TSV by region
Region 2014 YTD 2015 YTD 2016 YTD 2017 YTD Chg No. Chg %
Auckland 1,660 2,154 1,838 2,401 563 31%
Waikato 408 489 475 575 100 21%
Canterbury 382 455 468 435 33- -7%
Wellington 276 348 419 498 79 19%
Bay of Plenty 323 365 374 370 4- -1%
Other 628 776 912 1,009 97 11%
Total 3,677 4,587 4,486 5,288 802 18%
ITP: FSV approved in 2013-2017
ITP: TSV approved in 2013-2017
-
200
400
600
800
1,000
1,200
-
500
1,000
1,500
2,000
2,500
2014 2015 2016 Average 3y 2017
-
1,000
2,000
3,000
4,000
5,000
6,000
2013YTD
2014YTD
2015YTD
2016YTD
2017YTD
Averageof
previous3 years
FSV RSV
Changes are from the YTD 2016 to the YTD 2017
• The ITP sector showed a 18% (+802) increase in TSV for the YTD 2017. RSV increased by 29% (+ 712) and FSV were flat (+4%, +90) compared to the YTD 2016.
The increase in RSV comes from China (+24%, +315) and India (+41%, +231).
• VSV were 10,930 on 1 April 2017, which was a 4% (+439) increase compared to 1 April 2016.

35
Universities March 2017
In Brief Universities: TSV by country
YTD FSV RSV TSV 2014 YTD 2015 YTD 2016 YTD 2017 YTD Chg No. Chg %
Visas 3,480 9,089 12,569 China 4,889 5,109 5,428 6,350 922 17%
Change No. 708 1,088 1,796 USA 701 946 674 934 260 39%
Change Percent 26% 14% 17% Malaysia 648 572 573 557 16- -3%
India 437 398 465 647 182 39%
Korea 525 383 344 354 10 3%
Universities: Cumulative FSV and RSV Other 3,693 3,495 3,289 3,727 438 13%
Total 10,893 10,903 10,773 12,569 1,796 17%
Universities: FSV by country
2014 YTD 2015 YTD 2016 YTD 2017 YTD Chg No. Chg %
USA 564 831 557 808 251 45%
China 564 537 636 667 31 5%
India 242 228 270 390 120 44%
Malaysia 114 113 181 153 28- -15%
Japan 118 133 128 161 33 26%
Other 1,023 994 1,000 1,301 301 30%
Total 2,625 2,836 2,772 3,480 708 26%
Universities: TSV by region
Region 2014 YTD 2015 YTD 2016 YTD 2017 YTD Chg No. Chg %
Auckland 5,696 5,783 5,636 6,762 1,126 20%
Otago 1,308 1,303 1,188 1,374 186 16%
Canterbury 1,175 1,191 1,306 1,536 230 18%
Wellington 1,267 1,221 1,246 1,353 107 9%
Waikato 872 782 874 955 81 9%
Other 575 623 523 589 66 13%
Total 10,893 10,903 10,773 12,569 1,796 17%
Universities: FSV approved in 2013-2017
Universities: TSV approved in 2013-2017
-
500
1,000
1,500
2,000
2,500
-
1,000
2,000
3,000
4,000
5,000
6,000
7,000
2014 2015 2016 Average 3y 2017
-
2,000
4,000
6,000
8,000
10,000
12,000
14,000
2013YTD
2014YTD
2015YTD
2016YTD
2017YTD
Averageof
previous3 years
FSV RSV
Changes are from the YTD 2016 to the YTD 2017
• The universities sector showed a 17%(+ 1,796) increase in TSV for the YTD 2017
• FSV in the universities sector grew by 26% (+708) compared to the YTD 2016. This growth came from increased FSV for India (+44%, +120) and the USA (+45%,
+251). All regions with universities had increases, especially the Auckland (+28%, +338), Otago (+42%,+153), and Waikato(+40%,+99) regions.
• VSV for universities were 21,413 on 1 April 2017, which was a 14% (+2,679) increase on the same date last year compared to 1 April 2016.
Trends by region

A note about regional data
Due to data improvement processes within Immigration New Zealand, there have been some
changes to region-based data for visas.
Numbers in these slides may have changed from slides previously produced.
This data should be treated with caution, therefore the number and percentage changes should
be considered approximates.
37

38
Auckland March 2017
In brief Auckland: TSV by sector (*)
YTD FSV RSV TSV2014 YTD 2015 YTD 2016 YTD 2017 YTD
Change
Number
Change
Percentage
Visas 6,349 12,490 18,839 Schools 2,716 2,830 2,693 3,445 752 28%
Change No. 462 2,447 2,909 ITP 1,660 2,154 1,838 2,401 563 31%
Change Percent 8% 24% 18% PTE 6,162 6,631 5,758 6,220 462 8%
Universities 5,696 5,783 5,636 6,762 1,126 20%
Total 16,234 17,398 15,925 18,828 2,903 18%
Auckland: FSV by sector (*)
2014 YTD 2015 YTD 2016 YTD 2017 YTDChange
Number
Change
Percentage
Schools 798 872 787 934 147 19%
ITP 510 930 827 992 165 20%
PTE 3,388 3,799 3,048 2,859 189- -6%
Universities 1,196 1,235 1,220 1,558 338 28%
Total 5,892 6,836 5,882 6,343 461 8%
Auckland: TSV by market
Country 2014 YTD 2015 YTD 2016 YTD 2017 YTD
Change
Number
Change
Percentage
China 6,069 6,754 6,947 8,655 1,708 25%
India 3,081 3,526 2,666 2,743 77 3%
Korea 1,506 1,300 1,139 1,205 66 6%
Japan 577 565 518 541 23 4%
Thailand 497 500 423 551 128 30%
Other 4,516 4,760 4,237 5,144 907 21%
Total 16,246 17,405 15,930 18,839 2,909 18%
Auckland: TSV approved in 2014-2017
Auckland: FSV approved in 2014-2017
Auckland: Cumulative FSV and RSV
0
2,000
4,000
6,000
8,000
10,000
12,000
14,000
16,000
18,000
20,000
2013YTD
2014YTD
2015YTD
2016YTD
2017YTD
Averageof
previous3 years
FSV RSV
0
1,000
2,000
3,000
4,000
5,000
6,000
7,000
8,000
9,000
2014 2015 2016 3 yr average 2017
0
500
1,000
1,500
2,000
2,500
3,000
3,500
Changes are from the YTD 2016 to the YTD 2017
(*) Please note that numbers by sector may not always add up to the same as the
total because sector is not always stated.
• Auckland, New Zealand’s most popular international education destination, was up 18% in the YTD 2017 TSV compared to the YTD 2016.
• There was an increase in FSV for the universities (+28%, +338), schools (+19%, +147), and ITP (+20%, +165) sectors. The PTE sector FSV (-6%, -189) declined.
• VSV for Auckland was stable on 1 April 2017, declining by 0.4% (-174) since April 1 2016 to reach 40,878. There was a decline in VSV for PTE, which was offset by
an increase in VSV for universities.
39
Bay of Plenty March 2017
In brief Bay of Plenty: TSV by sector (*)
YTD FSV RSV TSV2014 YTD 2015 YTD 2016 YTD 2017 YTD
Change
Number
Change
Percentage
Visas 465 548 1,013 Schools 279 312 281 417 136 48%
Change No. 28- 166 138 ITP 323 365 374 370 4- -1%
Change Percent -6% 43% 16% PTE 252 271 214 219 5 2%
Universities 7 5 6 7 1 17%
Total 861 953 875 1,013 138 16%
Bay of Plenty: FSV by sector (*)
2014 YTD 2015 YTD 2016 YTD 2017 YTDChange
Number
Change
Percentage
Schools 106 123 113 157 44 39%
ITP 172 195 239 196 43- -18%
PTE 153 170 137 108 29- -21%
Universities 2 1 4 4 - 0%
Total 433 489 493 465 28- -6%
Bay of Plenty: TSV by market
Country 2014 YTD 2015 YTD 2016 YTD 2017 YTD
Change
Number
Change
Percentage
India 358 446 401 340 61- -15%
Korea 159 164 159 254 95 60%
China 65 45 55 91 36 65%
Japan 53 52 52 52 - 0%
Philippines 20 41 42 52 10 24%
Other 207 205 166 224 58 35%
Total 862 953 875 1,013 138 16%
Bay of Plenty: TSV approved in 2014-2017
Bay of Plenty: FSV approved in 2014-2017
Bay of Plenty: Cumulative FSV and RSV
0
200
400
600
800
1,000
1,200
2013YTD
2014YTD
2015YTD
2016YTD
2017YTD
Averageof
previous3 years
FSV RSV
0
50
100
150
200
250
300
350
400
450
2014 2015 2016 3 yr average 2017
0
50
100
150
200
250
300
Changes are from the YTD 2016 to the YTD 2017
(*) Please note that numbers by sector may not always add up to the same as the
total because sector is not always stated.
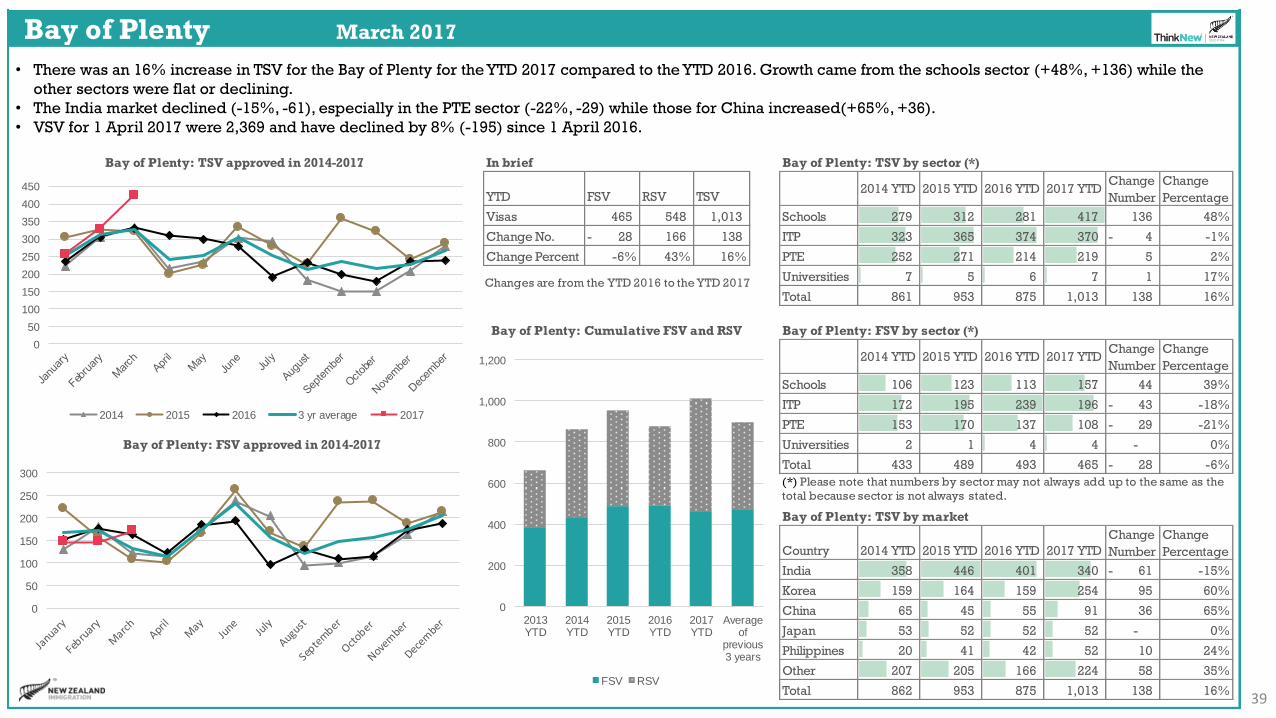
• There was an 16% increase in TSV for the Bay of Plenty for the YTD 2017 compared to the YTD 2016. Growth came from the schools sector (+48%, +136) while the
other sectors were flat or declining.
• The India market declined (-15%, -61), especially in the PTE sector (-22%, -29) while those for China increased(+65%, +36).
• VSV for 1 April 2017 were 2,369 and have declined by 8% (-195) since 1 April 2016.

40
Canterbury March 2017
In brief Canterbury: TSV by sector (*)
YTD FSV RSV TSV2014 YTD 2015 YTD 2016 YTD 2017 YTD
Change
Number
Change
Percentage
Visas 1,118 2,113 3,231 Schools 484 459 448 579 131 29%
Change No. 2- 417 415 ITP 382 455 468 435 33- -7%
Change Percent 0% 25% 15% PTE 657 698 593 681 88 15%
Universities 1,175 1,191 1,306 1,536 230 18%
Total 2,698 2,803 2,815 3,231 416 15%
Canterbury: FSV by sector (*)
2014 YTD 2015 YTD 2016 YTD 2017 YTDChange
Number
Change
Percentage
Schools 185 172 158 235 77 49%
ITP 143 165 190 131 59- -31%
PTE 422 406 391 337 54- -14%
Universities 329 374 381 415 34 9%
Total 1,079 1,117 1,120 1,118 2- 0%
Canterbury: TSV by market
Country 2014 YTD 2015 YTD 2016 YTD 2017 YTD
Change
Number
Change
Percentage
China 893 1,037 1,071 1,323 252 24%
India 396 392 436 402 34- -8%
Japan 236 241 237 255 18 8%
Korea 181 141 108 119 11 10%
Thailand 131 142 125 135 10 8%
Other 865 853 839 997 158 19%
Total 2,702 2,806 2,816 3,231 415 15%
Canterbury: TSV approved in 2014-2017
Canterbury: FSV approved in 2014-2017
Canterbury: Cumulative FSV and RSV
0
500
1,000
1,500
2,000
2,500
3,000
3,500
2013YTD
2014YTD
2015YTD
2016YTD
2017YTD
Averageof
previous3 years
FSV RSV
0
200
400
600
800
1,000
1,200
1,400
1,600
2014 2015 2016 3 yr average 2017
0
100
200
300
400
500
600
700
Changes are from the YTD 2016 to the YTD 2017
(*) Please note that numbers by sector may not always add up to the same as the
total because sector is not always stated.
• There has been an 16\5% increase in TSV in the 2017 YTD compared to the YTD 2016. This is driven by an increase in RSV across all sectors. FSV were flat. The
increase in FSV for the universities (+9%, +34) and schools (+49%, +77) sectors were balanced by decreased FSV for ITP (- 31%, -59) and PTE (-14%, -54) sectors.
• The number of VSV for Canterbury on April 1 2017 was 6,611, which is stable compared to 1 April 2016 (+3%, +181).
41
Hawke's Bay March 2017
In brief Hawke's Bay: TSV by sector (*)
YTD FSV RSV TSV2014 YTD 2015 YTD 2016 YTD 2017 YTD
Change
Number
Change
Percentage
Visas 125 179 304 Schools 130 112 96 110 14 15%
Change No. 57- 69 12 ITP 93 107 111 148 37 33%
Change Percent -31% 63% 4% PTE 37 54 85 46 39- -46%
Universities - - - - -
Total 260 273 292 304 12 4%
Hawke's Bay: FSV by sector (*)
2014 YTD 2015 YTD 2016 YTD 2017 YTDChange
Number
Change
Percentage
Schools 48 43 55 28 27- -49%
ITP 45 56 61 78 17 28%
PTE 26 40 66 19 47- -71%
Universities - - - - -
Total 119 139 182 125 57- -31%
Hawke's Bay: TSV by market
Country 2014 YTD 2015 YTD 2016 YTD 2017 YTD
Change
Number
Change
Percentage
India 39 73 84 90 6 7%
China 48 48 40 68 28 70%
Japan 36 34 47 34 13- -28%
Thailand 20 19 12 17 5 42%
Korea 9 14 5 14 9 180%
Other 108 85 104 81 23- -22%
Total 260 273 292 304 12 4%
Hawke's Bay: TSV approved in 2014-2017
Hawke's Bay: FSV approved in 2014-2017
Hawke's Bay: Cumulative FSV and RSV
0
50
100
150
200
250
300
350
2013YTD
2014YTD
2015YTD
2016YTD
2017YTD
Averageof
previous3 years
FSV RSV
0
20
40
60
80
100
120
140
2014 2015 2016 3 yr average 2017
0
10
20
30
40
50
60
70
80
Changes are from the YTD 2016 to the YTD 2017
(*) Please note that numbers by sector may not always add up to the same as the
total because sector is not always stated.
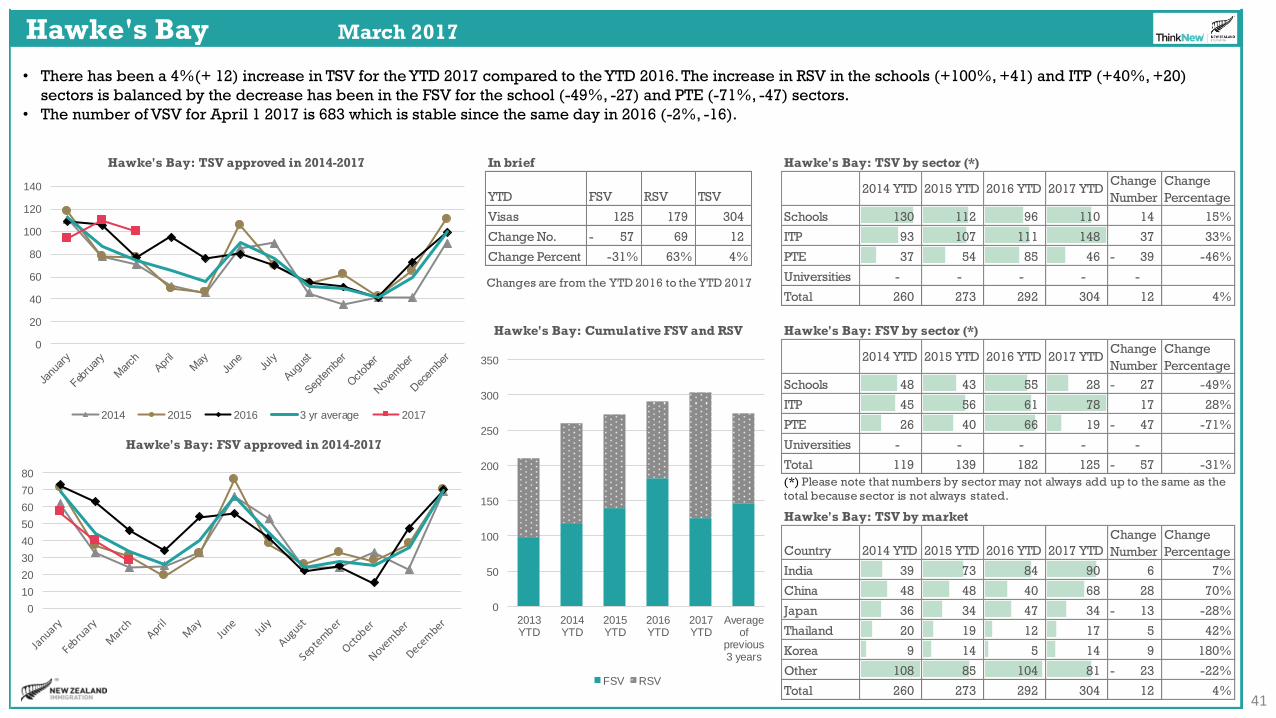
• There has been a 4%(+ 12) increase in TSV for the YTD 2017 compared to the YTD 2016. The increase in RSV in the schools (+100%, +41) and ITP (+40%, +20)
sectors is balanced by the decrease has been in the FSV for the school (-49%, -27) and PTE (-71%, -47) sectors.
• The number of VSV for April 1 2017 is 683 which is stable since the same day in 2016 (-2%, -16).

42
Manawatu March 2017
In brief Manawatu: TSV by sector (*)
YTD FSV RSV TSV2014 YTD 2015 YTD 2016 YTD 2017 YTD
Change
Number
Change
Percentage
Visas 371 648 1,019 Schools 175 213 133 190 57 43%
Change No. 25 138 163 ITP 59 48 91 98 7 8%
Change Percent 7% 27% 19% PTE 181 182 121 149 28 23%
Universities 559 602 511 582 71 14%
Total 974 1,045 856 1,019 163 19%
Manawatu: FSV by sector (*)
2014 YTD 2015 YTD 2016 YTD 2017 YTDChange
Number
Change
Percentage
Schools 74 98 64 58 6- -9%
ITP 18 20 52 39 13- -25%
PTE 146 133 94 111 17 18%
Universities 118 158 136 163 27 20%
Total 356 409 346 371 25 7%
Manawatu: TSV by market
Country 2014 YTD 2015 YTD 2016 YTD 2017 YTD
Change
Number
Change
Percentage
China 263 300 267 314 47 18%
Japan 134 120 91 126 35 38%
India 64 69 74 106 32 43%
Thailand 69 112 34 31 3- -9%
USA 40 65 36 40 4 11%
Other 404 380 354 402 48 14%
Total 974 1,046 856 1,019 163 19%
Manawatu: TSV approved in 2014-2017
Manawatu: FSV approved in 2014-2017
Manawatu: Cumulative FSV and RSV
0
200
400
600
800
1,000
1,200
2013YTD
2014YTD
2015YTD
2016YTD
2017YTD
Averageof
previous3 years
FSV RSV
0
100
200
300
400
500
600
2014 2015 2016 3 yr average 2017
0
20
40
60
80
100
120
140
160
180
200
Changes are from the YTD 2016 to the YTD 2017
(*) Please note that numbers by sector may not always add up to the same as the
total because sector is not always stated.
• TSV have increased by 19%(+ 163) in the YTD 2017 compared to the YTD 2016, led by a TSV increase in the universities sector (+14%, +71). FSV for the ITP sector
have decreased, while both FSV and RSV have increased for the schools and universities sectors.
• There were 2,246 VSV for this region on 1 April 2017, which is an increase of 9%(+ 188) since the same day in 2016.

43
Nelson March 2017
In brief Nelson: TSV by sector (*)
YTD FSV RSV TSV2014 YTD 2015 YTD 2016 YTD 2017 YTD
Change
Number
Change
Percentage
Visas 120 184 304 Schools 100 118 110 120 10 9%
Change No. 24- 32 8 ITP 67 141 167 157 10- -6%
Change Percent -17% 21% 3% PTE 29 14 19 27 8 42%
Universities 4 12 - - -
Total 200 285 296 304 8 3%
Nelson: FSV by sector (*)
2014 YTD 2015 YTD 2016 YTD 2017 YTDChange
Number
Change
Percentage
Schools 44 47 58 42 16- -28%
ITP 37 100 70 58 12- -17%
PTE 18 11 16 20 4 25%
Universities - - - - -
Total 99 158 144 120 24- -17%
Nelson: TSV by market
Country 2014 YTD 2015 YTD 2016 YTD 2017 YTD
Change
Number
Change
Percentage
India 22 83 95 54 41- -43%
China 15 29 23 76 53 230%
Thailand 24 32 32 32 - 0%
Japan 28 27 35 31 4- -11%
Korea 17 10 16 16 - 0%
Other 94 104 95 95 - 0%
Total 200 285 296 304 8 3%
Nelson: TSV approved in 2014-2017
Nelson: FSV approved in 2014-2017
Nelson: Cumulative FSV and RSV
0
50
100
150
200
250
300
350
2013YTD
2014YTD
2015YTD
2016YTD
2017YTD
Averageof
previous3 years
FSV RSV
0
20
40
60
80
100
120
140
160
180
2014 2015 2016 3 yr average 2017
0
20
40
60
80
100
120
140
160
Changes are from the YTD 2016 to the YTD 2017
(*) Please note that numbers by sector may not always add up to the same as the
total because sector is not always stated.
• There has been a 3% increase in TSV in Nelson the YTD 2017 compared to the YTD 2016.
• There has been an increase in TSV for China (+230%, +53) and a decrease for TSV for India (-43%, -41).
• There were 827 VSV for this region on 1 April 2017, which is an decrease of 5%(-42) since the same day in 2016.
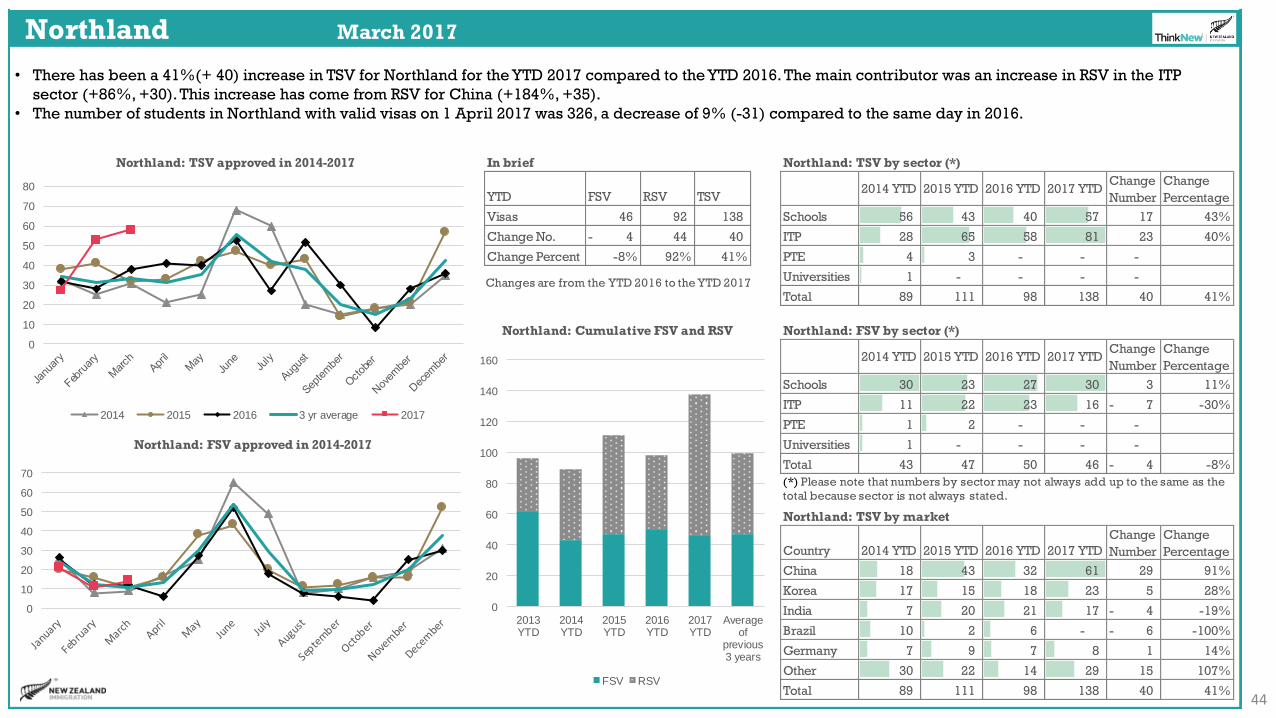
44
Northland March 2017
In brief Northland: TSV by sector (*)
YTD FSV RSV TSV2014 YTD 2015 YTD 2016 YTD 2017 YTD
Change
Number
Change
Percentage
Visas 46 92 138 Schools 56 43 40 57 17 43%
Change No. 4- 44 40 ITP 28 65 58 81 23 40%
Change Percent -8% 92% 41% PTE 4 3 - - -
Universities 1 - - - -
Total 89 111 98 138 40 41%
Northland: FSV by sector (*)
2014 YTD 2015 YTD 2016 YTD 2017 YTDChange
Number
Change
Percentage
Schools 30 23 27 30 3 11%
ITP 11 22 23 16 7- -30%
PTE 1 2 - - -
Universities 1 - - - -
Total 43 47 50 46 4- -8%
Northland: TSV by market
Country 2014 YTD 2015 YTD 2016 YTD 2017 YTD
Change
Number
Change
Percentage
China 18 43 32 61 29 91%
Korea 17 15 18 23 5 28%
India 7 20 21 17 4- -19%
Brazil 10 2 6 - 6- -100%
Germany 7 9 7 8 1 14%
Other 30 22 14 29 15 107%
Total 89 111 98 138 40 41%
Northland: TSV approved in 2014-2017
Northland: FSV approved in 2014-2017
Northland: Cumulative FSV and RSV
0
20
40
60
80
100
120
140
160
2013YTD
2014YTD
2015YTD
2016YTD
2017YTD
Averageof
previous3 years
FSV RSV
0
10
20
30
40
50
60
70
80
2014 2015 2016 3 yr average 2017
0
10
20
30
40
50
60
70
Changes are from the YTD 2016 to the YTD 2017
(*) Please note that numbers by sector may not always add up to the same as the
total because sector is not always stated.
• There has been a 41%(+ 40) increase in TSV for Northland for the YTD 2017 compared to the YTD 2016. The main contributor was an increase in RSV in the ITP
sector (+86%, +30). This increase has come from RSV for China (+184%, +35).
• The number of students in Northland with valid visas on 1 April 2017 was 326, a decrease of 9% (-31) compared to the same day in 2016.

45
Otago March 2017
In brief Otago: TSV by sector (*)
YTD FSV RSV TSV2014 YTD 2015 YTD 2016 YTD 2017 YTD
Change
Number
Change
Percentage
Visas 666 1,117 1,783 Schools 195 193 143 225 82 57%
Change No. 167 79 246 ITP 132 131 202 179 23- -11%
Change Percent 33% 8% 16% PTE 7 11 4 5 1 25%
Universities 1,308 1,303 1,188 1,374 186 16%
Total 1,642 1,638 1,537 1,783 246 16%
Otago: FSV by sector (*)
2014 YTD 2015 YTD 2016 YTD 2017 YTDChange
Number
Change
Percentage
Schools 63 59 71 87 16 23%
ITP 24 40 61 57 4- -7%
PTE 2 7 2 4 2 100%
Universities 405 449 365 518 153 42%
Total 494 555 499 666 167 33%
Otago: TSV by market
Country 2014 YTD 2015 YTD 2016 YTD 2017 YTD
Change
Number
Change
Percentage
China 434 408 465 476 11 2%
USA 209 272 186 292 106 57%
Malaysia 187 190 151 158 7 5%
Japan 86 77 61 67 6 10%
Thailand 70 83 69 69 - 0%
Other 658 608 605 721 116 19%
Total 1,644 1,638 1,537 1,783 246 16%
Otago: TSV approved in 2014-2017
Otago: FSV approved in 2014-2017
Otago: Cumulative FSV and RSV
0
200
400
600
800
1,000
1,200
1,400
1,600
1,800
2,000
2013YTD
2014YTD
2015YTD
2016YTD
2017YTD
Averageof
previous3 years
FSV RSV
0
100
200
300
400
500
600
700
800
900
2014 2015 2016 3 yr average 2017
0
50
100
150
200
250
300
350
400
450
500
Changes are from the YTD 2016 to the YTD 2017
(*) Please note that numbers by sector may not always add up to the same as the
total because sector is not always stated.
• TSV have increased by 16%(+ 246) for the YTD 2017 compared to the YTD 2016. The TSV increase was in the universities sector (+16%, +186), with most of the
increase coming from FSV for students from the USA (+60%, +108). The increase for schools mainly came from RSV.
• The number of students in Otago with valid visas on 1 April 2017was 3,117 was stable , increasing by 1% (+37) compared to the same day in 2016.

46
Southland March 2017
In brief Southland: TSV by sector (*)
YTD FSV RSV TSV2014 YTD 2015 YTD 2016 YTD 2017 YTD
Change
Number
Change
Percentage
Visas 303 237 540 Schools 89 93 62 76 14 23%
Change No. 83 67 150 ITP 203 229 224 303 79 35%
Change Percent 38% 39% 38% PTE 69 104 98 161 63 64%
Universities 4 4 6 - 6- -100%
Total 365 430 390 540 150 38%
Southland: FSV by sector (*)
2014 YTD 2015 YTD 2016 YTD 2017 YTDChange
Number
Change
Percentage
Schools 45 44 22 28 6 27%
ITP 83 111 108 125 17 16%
PTE 51 88 85 150 65 76%
Universities 3 3 5 - 5- -100%
Total 182 246 220 303 83 38%
Southland: TSV by market
Country 2014 YTD 2015 YTD 2016 YTD 2017 YTD
Change
Number
Change
Percentage
China 120 100 86 121 35 41%
Thailand 60 56 53 36 17- -32%
India 46 66 41 47 6 15%
Brazil 15 49 24 56 32 133%
Korea 22 28 41 50 9 22%
Other 102 131 145 230 85 59%
Total 365 430 390 540 150 38%
Southland: TSV approved in 2014-2017
Southland: FSV approved in 2014-2017
Southland: Cumulative FSV and RSV
0
100
200
300
400
500
600
2013YTD
2014YTD
2015YTD
2016YTD
2017YTD
Averageof
previous3 years
FSV RSV
0
20
40
60
80
100
120
140
160
180
200
2014 2015 2016 3 yr average 2017
0
20
40
60
80
100
120
140
Changes are from the YTD 2016 to the YTD 2017
(*) Please note that numbers by sector may not always add up to the same as the
total because sector is not always stated.
• TSV have increased by 38%(+ 150) for the YTD 2017 compared to the YTD 2016, driven by an increase in FSV(+38%, +83) particularly for the PTE (+65%, +76%)
sector, which was driven by an increase in FSV for Brazil.
• Southland has 1,115 VSV on 1 April 2017, an increase of 42%(+ 329) since the same date last year.
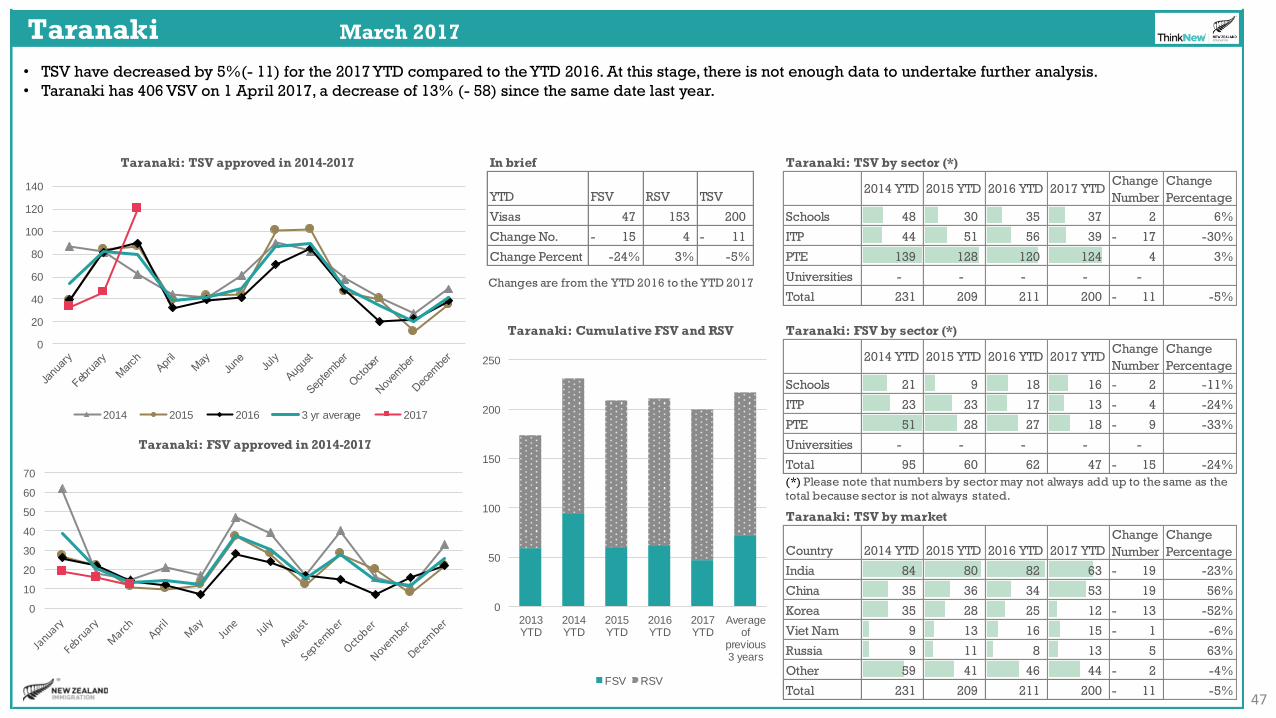
47
Taranaki March 2017
In brief Taranaki: TSV by sector (*)
YTD FSV RSV TSV2014 YTD 2015 YTD 2016 YTD 2017 YTD
Change
Number
Change
Percentage
Visas 47 153 200 Schools 48 30 35 37 2 6%
Change No. 15- 4 11- ITP 44 51 56 39 17- -30%
Change Percent -24% 3% -5% PTE 139 128 120 124 4 3%
Universities - - - - -
Total 231 209 211 200 11- -5%
Taranaki: FSV by sector (*)
2014 YTD 2015 YTD 2016 YTD 2017 YTDChange
Number
Change
Percentage
Schools 21 9 18 16 2- -11%
ITP 23 23 17 13 4- -24%
PTE 51 28 27 18 9- -33%
Universities - - - - -
Total 95 60 62 47 15- -24%
Taranaki: TSV by market
Country 2014 YTD 2015 YTD 2016 YTD 2017 YTD
Change
Number
Change
Percentage
India 84 80 82 63 19- -23%
China 35 36 34 53 19 56%
Korea 35 28 25 12 13- -52%
Viet Nam 9 13 16 15 1- -6%
Russia 9 11 8 13 5 63%
Other 59 41 46 44 2- -4%
Total 231 209 211 200 11- -5%
Taranaki: TSV approved in 2014-2017
Taranaki: FSV approved in 2014-2017
Taranaki: Cumulative FSV and RSV
0
50
100
150
200
250
2013YTD
2014YTD
2015YTD
2016YTD
2017YTD
Averageof
previous3 years
FSV RSV
0
20
40
60
80
100
120
140
2014 2015 2016 3 yr average 2017
0
10
20
30
40
50
60
70
Changes are from the YTD 2016 to the YTD 2017
(*) Please note that numbers by sector may not always add up to the same as the
total because sector is not always stated.
• TSV have decreased by 5%(- 11) for the 2017 YTD compared to the YTD 2016. At this stage, there is not enough data to undertake further analysis.
• Taranaki has 406 VSV on 1 April 2017, a decrease of 13% (- 58) since the same date last year.
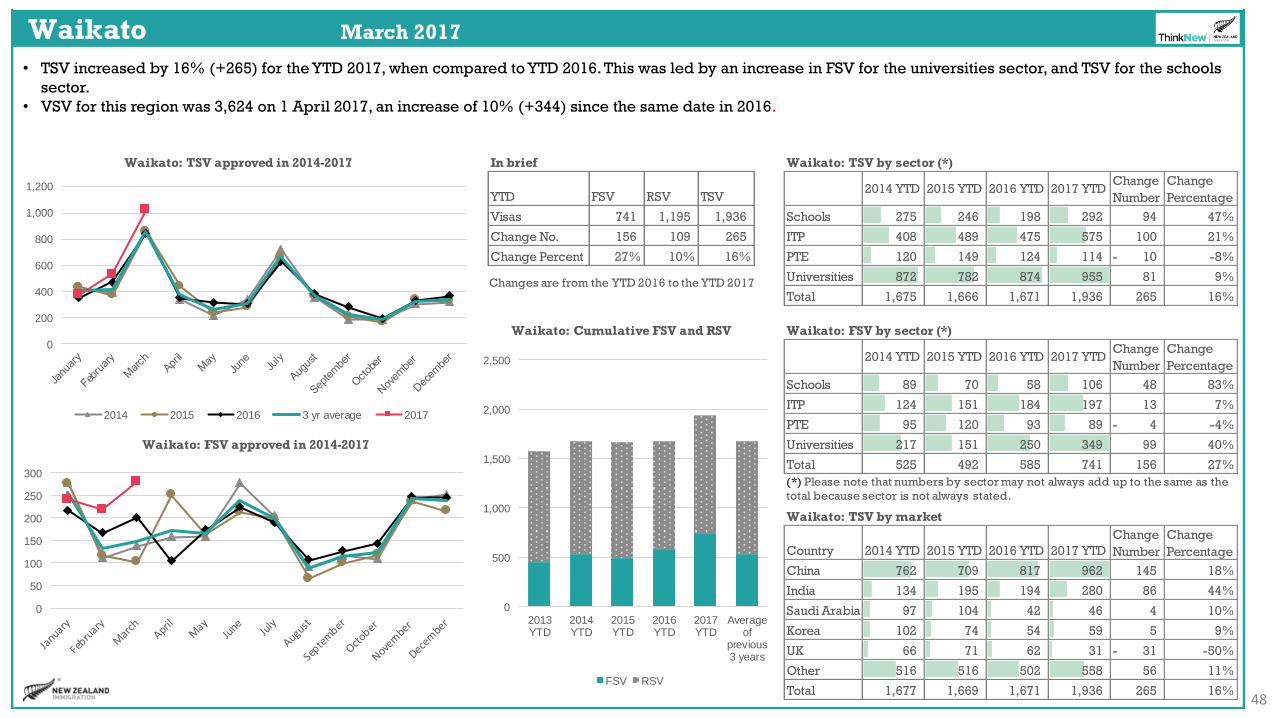
48
Waikato March 2017
In brief Waikato: TSV by sector (*)
YTD FSV RSV TSV2014 YTD 2015 YTD 2016 YTD 2017 YTD
Change
Number
Change
Percentage
Visas 741 1,195 1,936 Schools 275 246 198 292 94 47%
Change No. 156 109 265 ITP 408 489 475 575 100 21%
Change Percent 27% 10% 16% PTE 120 149 124 114 10- -8%
Universities 872 782 874 955 81 9%
Total 1,675 1,666 1,671 1,936 265 16%
Waikato: FSV by sector (*)
2014 YTD 2015 YTD 2016 YTD 2017 YTDChange
Number
Change
Percentage
Schools 89 70 58 106 48 83%
ITP 124 151 184 197 13 7%
PTE 95 120 93 89 4- -4%
Universities 217 151 250 349 99 40%
Total 525 492 585 741 156 27%
Waikato: TSV by market
Country 2014 YTD 2015 YTD 2016 YTD 2017 YTD
Change
Number
Change
Percentage
China 762 709 817 962 145 18%
India 134 195 194 280 86 44%
Saudi Arabia 97 104 42 46 4 10%
Korea 102 74 54 59 5 9%
UK 66 71 62 31 31- -50%
Other 516 516 502 558 56 11%
Total 1,677 1,669 1,671 1,936 265 16%
Waikato: TSV approved in 2014-2017
Waikato: FSV approved in 2014-2017
Waikato: Cumulative FSV and RSV
0
500
1,000
1,500
2,000
2,500
2013YTD
2014YTD
2015YTD
2016YTD
2017YTD
Averageof
previous3 years
FSV RSV
0
200
400
600
800
1,000
1,200
2014 2015 2016 3 yr average 2017
0
50
100
150
200
250
300
Changes are from the YTD 2016 to the YTD 2017
(*) Please note that numbers by sector may not always add up to the same as the
total because sector is not always stated.
• TSV increased by 16% (+265) for the YTD 2017, when compared to YTD 2016. This was led by an increase in FSV for the universities sector, and TSV for the schools
sector.
• VSV for this region was 3,624 on 1 April 2017, an increase of 10% (+344) since the same date in 2016.

49
Wellington March 2017
In brief Wellington: TSV by sector (*)
YTD FSV RSV TSV2014 YTD 2015 YTD 2016 YTD 2017 YTD
Change
Number
Change
Percentage
Visas 937 1,496 2,433 Schools 321 293 212 373 161 76%
Change No. 155 257 412 ITP 276 348 419 498 79 19%
Change Percent 20% 21% 20% PTE 155 173 134 206 72 54%
Universities 1,267 1,221 1,246 1,353 107 9%
Total 2,019 2,035 2,011 2,430 419 21%
Wellington: FSV by sector (*)
2014 YTD 2015 YTD 2016 YTD 2017 YTDChange
Number
Change
Percentage
Schools 171 102 102 139 37 36%
ITP 105 173 180 199 19 11%
PTE 86 110 81 124 43 53%
Universities 354 465 411 473 62 15%
Total 716 850 774 935 161 21%
Wellington: TSV by market
Country 2014 YTD 2015 YTD 2016 YTD 2017 YTD
Change
Number
Change
Percentage
China 632 721 796 955 159 20%
India 152 188 198 238 40 20%
Viet Nam 177 145 132 180 48 36%
USA 142 174 136 158 22 16%
Japan 93 102 101 101 - 0%
Other 825 708 658 801 143 22%
Total 2,021 2,038 2,021 2,433 412 20%
Wellington: TSV approved in 2014-2017
Wellington: FSV approved in 2014-2017
Wellington: Cumulative FSV and RSV
0
500
1,000
1,500
2,000
2,500
3,000
2013YTD
2014YTD
2015YTD
2016YTD
2017YTD
Averageof
previous3 years
FSV RSV
0
200
400
600
800
1,000
1,200
2014 2015 2016 3 yr average 2017
0
100
200
300
400
500
600
Changes are from the YTD 2016 to the YTD 2017
(*) Please note that numbers by sector may not always add up to the same as the
total because sector is not always stated.
• There was a 20%(+412) increase in TSV, led by increased FSV in the universities sector. The schools sector has also increased, but most of this increase was RSV.
• The biggest increase in FSV was from Viet Nam (+142%, +44), while the biggest RSV increase was for China (+22%, +147).
• VSV for this region were 4,761 for 1 April 2017, an increase of 14%(+ 597) from the same date in 2016.