Outlooks for flare reduction in Nigeria - Accueil | AFD for flare... · Outlooks for flare...
65
NOTES TECHNIQUES TECHNICAL REPORTS SEPTEMBER 2017 No. 34 Outlooks for flare reduction in Nigeria Author Antoine JAILLET (AFD) Coordination Jean LAURENT (AFD) Country Nigeria Key words Gas flaring, Oil and gas Industry, Climate AFD, 5 rue Roland Barthes, 75598 Paris cedex 12, France ̶ +33 1 53 44 31 31 ̶ +33 1 53 44 39 57 AFDlib@afd.fr ̶ http://librairie.afd.fr
Transcript of Outlooks for flare reduction in Nigeria - Accueil | AFD for flare... · Outlooks for flare...

NOTES TECHNIQUES TECHNICAL REPORTS
SEPTEMBER 2017
No. 34
Outlooks for flare reduction in Nigeria
Author Antoine JAILLET (AFD) Coordination Jean LAURENT (AFD)
Country Nigeria
Key words
Gas flaring, Oil and gas Industry, Climate
AFD, 5 rue Roland Barthes, 75598 Paris cedex 12, France ̶ +33 1 53 44 31 31 ̶ +33 1 53 44 39 57
[email protected] ̶ http://librairie.afd.fr

Contents
Authors
Antoine JAILLET, under the supervision of Jean LAURENT
Original Language
English
ISSN
2492-2838
Copyright
2nd quarter 2017
Disclaimer
The views and opinions expressed in this report are those of the authors and do not necessarily reflect the position of Agence Française de Développement.
Les Notes techniques sont téléchargeables sur le site de l’AFD : https://www.afd.fr/
1 | TECHNICAL REPORTS – No.34 – SEPTEMBER 2017

Contents
Contents
Contents ................................................................................................................................. 1
Table of figures ...................................................................................................................... 3
Table of Abbreviations and Acronyms ............................................................................... 4
Executive summary ............................................................................................................... 5
Gas flaring in Nigeria: a high stakes game ............................................................ 6 1.1.1. General considerations about gas flaring in Nigeria ......................................... 6 1.2. Flaring in Nigeria: wasting a valuable and abundant resource ......................... 7 1.3. Consequences of gas flaring ........................................................................... 9
Challenges facing flare reduction ......................................................................... 10 2.2.1. The legal and regulatory framework ............................................................... 10 2.2. A weak implementation of political initiatives.................................................. 11 2.3. Navigating the Nigerian gas market ............................................................... 11 2.4. Low incentives for the oil & gas sector ........................................................... 12 2.5. Security issues .............................................................................................. 13
Outlooks and solutions for flare reduction in Nigeria ........................................ 13 3.3.1. Lessons from other flare reduction programmes ............................................ 13 3.2. A strengthened political commitment ............................................................. 14 3.3. Towards a reduction of militancy in the Niger Delta ....................................... 14 3.4. Implementing new regulation ......................................................................... 14 3.5. Technical solutions ........................................................................................ 16
A Strategy for AFD .................................................................................................. 18 4.4.1. Developmental institutions involvement in Nigerian gas flaring ...................... 18 4.2. AFD’s rationale .............................................................................................. 19 4.3. Possibilities for AFD Group intervention ......................................................... 20 4.4. Conditions for project identification ................................................................ 21 4.5. Watching short and medium term evolutions ................................................. 23
Appendix .............................................................................................................................. 25
Overview of gas flaring in Nigeria ......................................................................... 25 1.1.1. Historical trends for gas flaring ...................................................................... 25 1.2. Recent trends in gas flaring ........................................................................... 26 1.3. Current situation ............................................................................................ 27 1.4. Geographical localization of flares ................................................................. 29 1.5. Key takeaways .............................................................................................. 30
Environmental impacts of gas flaring ................................................................... 31 2.2.1. Climate Change ............................................................................................. 31 2.2. Local environmental impacts ......................................................................... 31 2.3. Impact for local populations ........................................................................... 32 2.4. Second order effect ....................................................................................... 33
Nigerian Associated Gas Legal Review ................................................................ 34 3.3.1. Associated Gas policies and relevant gas policies ......................................... 34 3.2. Environmental Regulations ............................................................................ 36
The need for domestic gas market development ................................................ 37 4.4.1. The power sector: a natural end market? ....................................................... 37 4.2. Developing other solutions............................................................................. 37
2 | TECHNICAL REPORTS – No.34 – SEPTEMBER 2017

Contents
Country case studies .............................................................................................. 38 5.5.1. Angola ........................................................................................................... 38 5.2. Kazakhstan .................................................................................................... 38 5.3. Norway .......................................................................................................... 39 5.4. Canada (Alberta) ........................................................................................... 39
Legislation under review ........................................................................................ 41 6.6.1. The Petroleum Industry Governance Bill (PIGB) ............................................ 41 6.2. Gas Flaring (Prohibition and Punishment) Bill (2016) ..................................... 44 6.3. National Petroleum Fiscal Policy (Petroleum Industry Reform Bill) ................ 45
National Gas Flare Commercialization Programme ............................................ 50 7.7.1. Introduction .................................................................................................... 50 7.2. Fixing the market and licensing process ........................................................ 50 7.3. Structuring the market ................................................................................... 51 7.4. Improve monitoring and enforcement ............................................................ 51
Technical solutions for flare reduction ................................................................ 53 8.8.1. Gas from the flare: captive utilization projects ................................................ 53 8.2. Developing a domestic gas market and infrastructure .................................... 55
Project case studies ............................................................................................... 58 9.
Prior publications in the collection ................................................................................... 61
What is AFD ......................................................................................................................... 64
TABLE OF FIGURES
Figure 1: Evolution of flared volumes and legislation ............................................................. 7 Figure 2: Map of flare concentration with number of flares per area ...................................... 8 Figure 3: Distribution of flares by volume ............................................................................... 9 Figure 4: Gas market structure .........................................................................................12 Figure 5: Summary of usable techniques for flare monetization ....................................17 Figure 6: gas production and flaring in Nigeria since 1965 ...................................................25 Figure 7: Gas (associated and non-associated) production and flaring since 2001 ...............26 Figure 8: Breakdown of gas utilization ..................................................................................27 Figure 9: Gas utilization ........................................................................................................27 Figure 10: Distribution of flaring among stakeholders ...........................................................28 Figure 11: Distribution of flaring among flare categories sorted by volume ...........................28 Figure 12: Distribution of flares among categories and stakeholder ......................................29 Figure 13: Heatmap of flaring and number of flares per block ...............................................29 Figure 14: Price based royalties for oil production ................................................................48 Figure 17: Nigerian Hydrocarbon Tax rates ..........................................................................48
3 | TECHNICAL REPORTS – No.34 – SEPTEMBER 2017

TABLE OF ABBREVIATIONS AND ACRONYMS
AFD Agence Française de Développement
CNG Compressed Natural Gas
DPR Department of Petroleum Resources
DSO Domestic Supply Obligation
GACN Gas Aggregation Company of Nigeria
GCF Green Climate Fund
GGFR Global Gas Flaring Reduction
GTL Gas to Liquids
IOC International Oil Company
INDC Intended Nationally Determined Contribution
LNG Liquefied Natural Gas
LPG Liquefied Petroleum Gas
MPR Ministry of Petroleum Resources
NGFCP National Gas Flare Commercialization Program
NGL Natural Gas Liquids
NLNG Nigerian Liquefied Natural Gas
NNPC Nigerian National Petroleum Company
PIGB Petroleum Industry Governance Bill
PPPRA Petroleum Products Pricing Regulatory Agency
scf Standard Cubic Feet 1 mscf= 1 000 scf 1 mmscf = 1 000 000 scf 1 tscf= 1 trillion scf
4 | TECHNICAL REPORTS – No.34 – SEPTEMBER 2017

Executive summary
Executive summary
In 2015, 350 trillions of cubic feet (tnscf) of gas were flared in Nigeria, amounting to 12% of the overall gas production for an estimated economic loss of more than US$1 bn of gas.
Beyond the economic waste, gas flaring has a significant climate impact with more than 48 Mt of CO2 emitted in 2010 i.e. more than 15% of Nigeria’s greenhouse gas emissions and impacts negatively health and crop productivity of local communities.
The practice of flaring (i.e. combustion of gas associated with oil production) is not new in Nigeria and has been plaguing the oil industry since the beginning of production in the 1950s’. Although some progress has been achieved since then, significant efforts remain to be undertaken to reach the objective of the Nigerian government to end gas flaring by 2030 as per its INDC (Intended Nationally Determined Contribution) pledged during the COP21.
In spite of significant issues obstructing the development of a gas market and infrastructures necessary to enable commercialization of associated gas (such as the regulatory structure, the lack of end markets and the weak financial health of local oil players), there is positive outlook for flare reduction in Nigeria. Indeed, the renewed commitment of the Nigerian government expressed at the Paris Conference gives hope that positive change should occur, namely in the form of a new legislative framework for the oil and gas industry, which could translate into more favourable terms for gas production and a stronger regulation. Furthermore, the Ministry of Petroleum Resources launched in December 2016 the National Gas Flare Commercialization Programme, aiming at fostering investment in gas flaring reduction projects for the private sector and unlocking stranded gas by fostering the deployment of new flaring capture processes in Nigeria. In this context, there is opportunity for AFD Group (but also others donors) to support initiatives for flaring reduction by mobilizing financial resources in support of the private sector. Instruments mobilized could take the form of green climate finance, direct concessional or commercial loans or lines of credit for the banking sector.
5 | TECHNICAL REPORTS – No.34 – SEPTEMBER 2017

Executive summary
GAS FLARING IN NIGERIA: A HIGH STAKES GAME 1.
1.1. GENERAL CONSIDERATIONS ABOUT GAS FLARING IN NIGERIA
Definition Gas is often found in association with petroleum in geological deposits and gets extracted as a by-product of oil.
Gas flaring designates the practice of burning gas at a flare stack. This controversial practice is undertaken for two reasons: routinely, to dispose of the associated gas when it is not deemed profitable to commercialize; or for safety measures, in response to surges of gas pressure. The former is responsible for the vast majority of volumes flared.
Gas flaring: an issue of economics
The decision to flare gas is mainly a question of economics. Several factors can impact it:
- Small and variable quantities of gas may make investments more difficult to amortize; - A low gas pressure at the wellhead may make conditioning of the gas for
transportation (pipeline mainly) more costly; - Remoteness of sites may require building infrastructures to commercialize the gas.
A combination of those factors usually makes associated gas utilization projects difficult to implement. Furthermore, there may be a lack of willingness of oil producers to mobilize funds to monetize what is essentially seen as a low value by-product compared to oil.
It also has to be mentioned that in older oil fields, setting up gas flare reduction projects may prove more challenging than on new fields.
Overview of the oil and gas sector
Governance of the sector There are three main government organizations that monitor the oil and gas sector:
- The Department of Petroleum Resources (DPR), the independent regulator which implements the legislation;
- The Ministry of Petroleum Resources (MPR), responsible for drafting oil and gas laws;
- The Nigerian National Petroleum Company (NNPC), which manages the government’s stakes in joint ventures with International Oil Companies (IOCs). It is an integrated oil company, involved in production, processing and domestic and overseas marketing of the oil.
Stakeholders The Nigerian oil and gas industry is composed of both international and local players. While the productions of oil was historically dominated by IOCs (for the most part in joint venture with the NNPC), in the last decade, Nigerian local content laws and divestment of IOCs from onshore oil blocks fostered local oil companies development.
6 | TECHNICAL REPORTS – No.34 – SEPTEMBER 2017
Executive summary
As of today, IOCs are responsible for 59% of oil production over a total of 796 million barrels per year, as well as 74% of gas production over a total of 2.9 trillion standard cubic feet (tn scf)1.
1.2. FLARING IN NIGERIA: WASTING A VALUABLE AND ABUNDANT RESOURCE
See Appendix 1: Overview of Gas flaring in Nigeria
Underused or wasted resources With proven reserves of 188 tscf of gas, Nigeria holds the 9th largest gas reserve in the world and is the largest holder of proven natural gas reserves in Africa2. However, with current production of around 3 tscf, those reserves are mostly underused, in the contrary to oil. Today, around 85% of the gas produced is associated gas.
Success and failures in Nigerian flare reduction
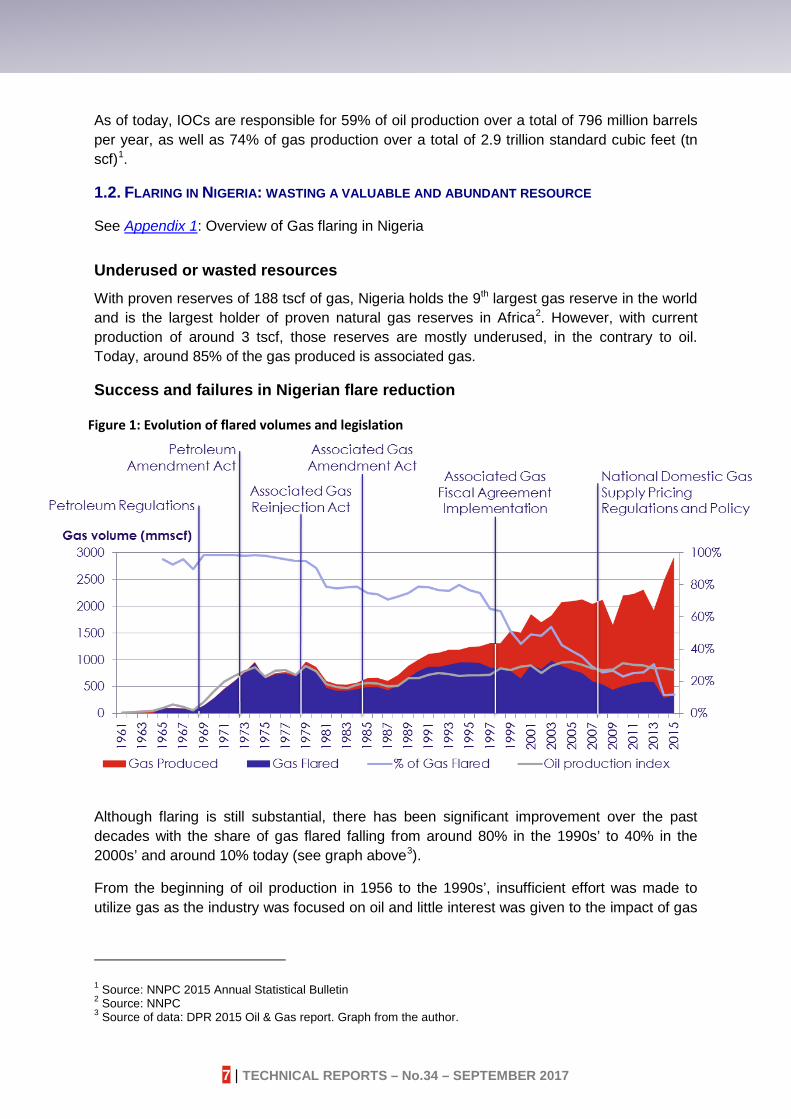
Although flaring is still substantial, there has been significant improvement over the past decades with the share of gas flared falling from around 80% in the 1990s’ to 40% in the 2000s’ and around 10% today (see graph above3).
From the beginning of oil production in 1956 to the 1990s’, insufficient effort was made to utilize gas as the industry was focused on oil and little interest was given to the impact of gas
1 Source: NNPC 2015 Annual Statistical Bulletin 2 Source: NNPC 3 Source of data: DPR 2015 Oil & Gas report. Graph from the author.
Figure 1: Evolution of flared volumes and legislation
7 | TECHNICAL REPORTS – No.34 – SEPTEMBER 2017

Executive summary
flaring. The coercive regulation (relying on fines and prohibition) that was passed had scant effect on gas flaring due to a weak policy implementation.
On the contrary, the new fiscal measures implemented in the 1990s’ with a switch to incentives provided a more favourable framework for associated gas production and favoured investment in flare-down projects. These measures coincided with an increased awareness of the harm caused by gas flaring which pushed IOCs to start acting on the issue, for fear of reputational damage.
As a result, the 2000s’ saw great improvements with the implementation of past endeavours, which were reinforced by the involvement of multilaterals such as the World Bank with the GGFR (Global Gas Flaring Reduction). The decrease of gas flaring was also favoured by a decline of older oil fields, the implementation of gas utilization plans for new fields’ development and a relative decline in production due to a lack of investments.
Current situation In 2015, around 350 billion standard cubic feet (bscf) of gas were flared, distributed over 183 flares. These volumes represent 12% of Nigeria’s gas production and enough gas to produce 3.5 GW of power, which is Nigeria’s average available power.
Nowadays, gas flaring is almost evenly distributed between IOCs and local companies, with the former being responsible for around 50% of volumes flared and the latter for around 45%.
By comparison, IOCs are also producing 73% of the gas and 60% of the oil in Nigeria.
Flare location As described on Fig. 24 below, flares are mainly concentrated in the Niger Delta, in the regions of Edo, Rivers, Delta and Bayelsa states, and off the costs of Ondo and Akwa Ibom states. Flares are more or less evenly distributed between onshore and offshore fields.
4 Source of data: Gas Flare Tracker, Stakeholder Democracy Network. Graph from the author
3 mmscf/d
2.5 mmscf/d
2 mmscf/d
1.5 mmscf/d
1 mmscf/d
0.5 mmscf/d
0 mmscf/d
Figure 2: Map of flare concentration with number of flares per area
8 | TECHNICAL REPORTS – No.34 – SEPTEMBER 2017

Executive summary
Flare distribution by size Fig. 3 below depicts the number and volumes of flares aggregated per category, each category being aggregating flares according to the volume of gas flared (higher than 15 mmscf/day, between 15 mmscf/day and 5 mmscf/day, etc.).
It appears that larger flares (higher than 15 mmscf/day) as a category, although in small numbers, are responsible for a large share of the volumes burnt. For smaller volume categories, the number of flares within each category increases while the aggregated volumes decrease until 1.5mmscf/day. Lower volume flares account for an almost negligible share of the total5.
As a result, it seems that a number of low hanging fruits remain to be seized and that effective flare reduction policy should primarily target high volume flares to ensure fast and efficient flare down.
Those larger flares (>15mmscf/d) are predominantly the responsibility of local companies (65% of volumes for this category), while medium flares (>5 mmscf/d) are mainly caused by IOCs (67%).
1.3. CONSEQUENCES OF GAS FLARING
Economic loss The gross economic loss caused by gas flaring, at the current regulated price of US$2.90/mscf, has amounted to about US$ 1bn for the year 2015. Further economic loss could include:
- Lack of fiscal revenue because of the non-implementation of the $3.5/mscf penalty; - The opportunity loss for downstream sector development (in power or gas based
industries) and gas use by households.
5 Source of data: NNPC 2015 Annual Statistical Bulletin. Graph from the author.
020406080100120140160180
0
10
20
30
40
50
60
70
>15 mmscf/d >5 mmscf/d >1.5 mmscf/d > 0.5mmscf/d
< 0.5mmscf/d
in mmscf per day
Number of flares
Number Volumes
Figure 3: Distribution of flares by volume
9 | TECHNICAL REPORTS – No.34 – SEPTEMBER 2017
Executive summary
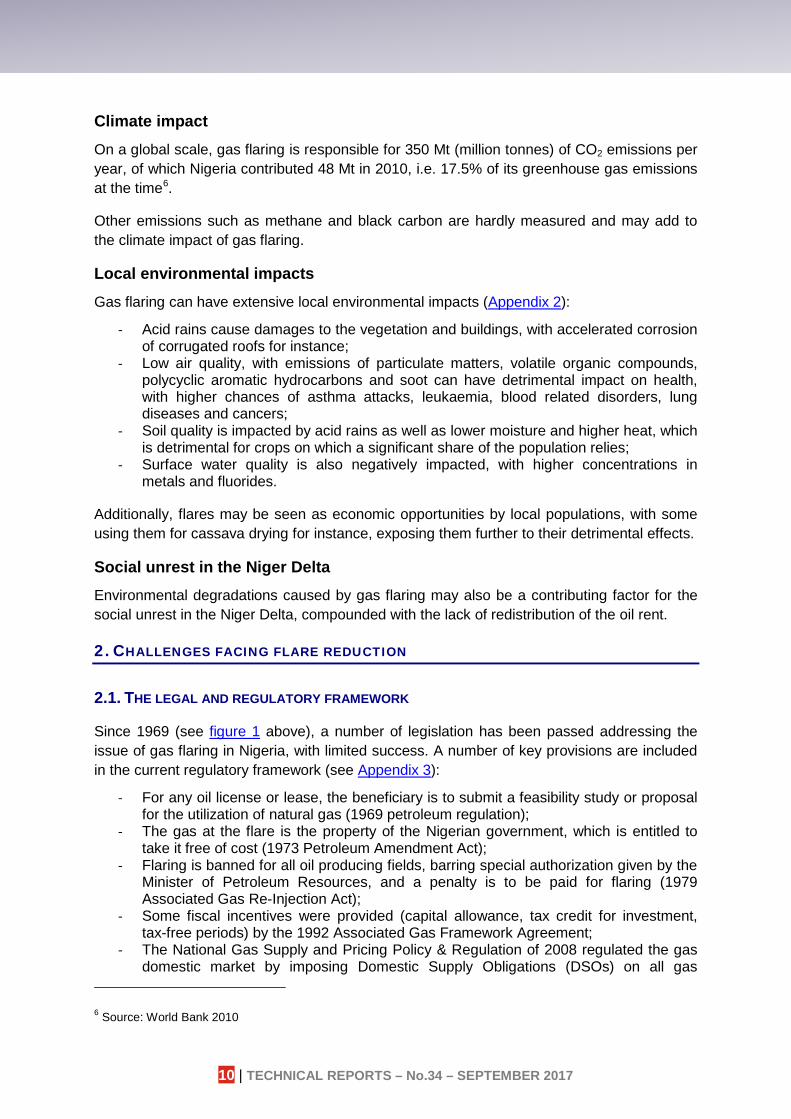
Climate impact
On a global scale, gas flaring is responsible for 350 Mt (million tonnes) of CO2 emissions per year, of which Nigeria contributed 48 Mt in 2010, i.e. 17.5% of its greenhouse gas emissions at the time6.
Other emissions such as methane and black carbon are hardly measured and may add to the climate impact of gas flaring.
Local environmental impacts
Gas flaring can have extensive local environmental impacts (Appendix 2):
- Acid rains cause damages to the vegetation and buildings, with accelerated corrosion of corrugated roofs for instance;
- Low air quality, with emissions of particulate matters, volatile organic compounds, polycyclic aromatic hydrocarbons and soot can have detrimental impact on health, with higher chances of asthma attacks, leukaemia, blood related disorders, lung diseases and cancers;
- Soil quality is impacted by acid rains as well as lower moisture and higher heat, which is detrimental for crops on which a significant share of the population relies;
- Surface water quality is also negatively impacted, with higher concentrations in metals and fluorides.
Additionally, flares may be seen as economic opportunities by local populations, with some using them for cassava drying for instance, exposing them further to their detrimental effects.
Social unrest in the Niger Delta Environmental degradations caused by gas flaring may also be a contributing factor for the social unrest in the Niger Delta, compounded with the lack of redistribution of the oil rent.
CHALLENGES FACING FLARE REDUCTION 2.
2.1. THE LEGAL AND REGULATORY FRAMEWORK
Since 1969 (see figure 1 above), a number of legislation has been passed addressing the issue of gas flaring in Nigeria, with limited success. A number of key provisions are included in the current regulatory framework (see Appendix 3):
- For any oil license or lease, the beneficiary is to submit a feasibility study or proposal for the utilization of natural gas (1969 petroleum regulation);
- The gas at the flare is the property of the Nigerian government, which is entitled to take it free of cost (1973 Petroleum Amendment Act);
- Flaring is banned for all oil producing fields, barring special authorization given by the Minister of Petroleum Resources, and a penalty is to be paid for flaring (1979 Associated Gas Re-Injection Act);
- Some fiscal incentives were provided (capital allowance, tax credit for investment, tax-free periods) by the 1992 Associated Gas Framework Agreement;
- The National Gas Supply and Pricing Policy & Regulation of 2008 regulated the gas domestic market by imposing Domestic Supply Obligations (DSOs) on all gas
6 Source: World Bank 2010
10 | TECHNICAL REPORTS – No.34 – SEPTEMBER 2017

Executive summary
producers and setting up a pricing framework. It was enacted jointly with a US$ 3.5/mscf penalty on flaring.
2.2. A WEAK IMPLEMENTATION OF POLITICAL INITIATIVES
The limited results from past policies, and in particular fines, can be mostly explained by a weak implementation of the policies announced. As such, authorizations to flare are regularly given to oil producers (25% of the volumes), flare out targets set out by the government were regularly pushed back while penalties remained unapplied or largely undervalued (10₦/mscf actual penalty).
Similarly, the recommendations from the National Flare Reduction Committee, set up in 2007 under the aegis of the World Bank’s GGFR and composed of all parties involved in gas flaring reduction (both public and private), were not followed and the task force’s terms of reference did not get renewed.
Reasons for a somewhat limited involvement of the government may be primarily the will not to disrupt oil production by enforcing coercive legislation.
2.3. NAVIGATING THE NIGERIAN GAS MARKET See Appendix 4.
The Nigerian gas market is heavily regulated:
- Oil and gas companies have to comply with Domestic Supply Obligations (DSOs) to sell part of their production to the domestic sector, and to specific industrial sectors. The DSOs only apply to wet gas produced at oil and gas fields;
- The pricing is regulated according to the industry supplied and their perceived strategic importance by the Federal Government. Power sector price is now at US$2.9/mscf.;
- The Gas Aggregation Company of Nigeria (GACN) serves as an intermediary to gas sale agreement. It aggregates the supply of gas from oil and gas companies and then pays them according to the sector supplied.
There is no single regulator for the gas market, with the National Gas Company, GACN, Department of Petroleum Resources (DPR) and Petroleum Products Pricing Regulatory Agency (PPPRA) having stakes in gas market regulations.
Although the market structure seems rigid as it is, it may be possible to bypass GACN.
11 | TECHNICAL REPORTS – No.34 – SEPTEMBER 2017

Executive summary
Figure 4: Gas market structure
2.4. LOW INCENTIVES FOR THE OIL & GAS SECTOR
The oil and gas sector has also had little incentive to harness the associated gas produced.
A lack of infrastructures Historically, as the industry has been focused on oil rather than gas, little had been done to develop the non-associated gas fields and thus gas transportation and processing infrastructures, which could boost associated gas utilization, are lacking. A better development of pipeline infrastructures could provide incentive to aggregate gas that would otherwise be flared.
This problem was supposed to be addressed in the 2008 Gas Master Plan’s gas infrastructure blueprint but little of the expected pipeline network was actually constructed.
A lack of end markets for the gas Thanks to their participation in the Nigerian LNG project, a few IOCs, namely Shell, ENI and Total, have the possibility to export their gas out of Nigeria, hence finding reliable off-takers.
Other oil and gas companies have to rely on the domestic market for commercialization of their gas. However, in spite of the government’s will to develop the use of gas for power production, because of structural deficiencies, the power sector (which represents around 80% of the use of gas) is not able to offtake contracted amount of gas and pay gas bills. The inability to secure reliable offtake agreements is thus one of the reasons explaining the poor development of associated gas in Nigeria.
As a result, it may be interesting to prioritize captive projects that may have a more straightforward and steady revenue stream.
12 | TECHNICAL REPORTS – No.34 – SEPTEMBER 2017
Executive summary
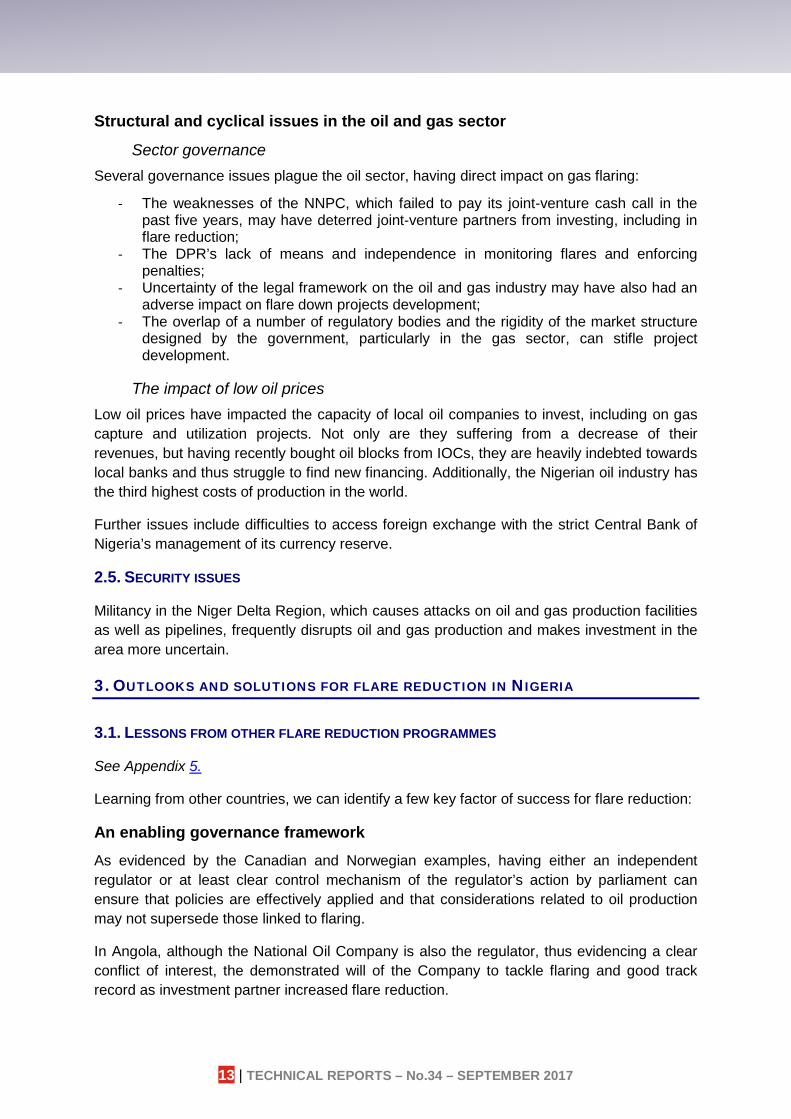
Structural and cyclical issues in the oil and gas sector
Sector governance Several governance issues plague the oil sector, having direct impact on gas flaring:
- The weaknesses of the NNPC, which failed to pay its joint-venture cash call in the past five years, may have deterred joint-venture partners from investing, including in flare reduction;
- The DPR’s lack of means and independence in monitoring flares and enforcing penalties;
- Uncertainty of the legal framework on the oil and gas industry may have also had an adverse impact on flare down projects development;
- The overlap of a number of regulatory bodies and the rigidity of the market structure designed by the government, particularly in the gas sector, can stifle project development.
The impact of low oil prices Low oil prices have impacted the capacity of local oil companies to invest, including on gas capture and utilization projects. Not only are they suffering from a decrease of their revenues, but having recently bought oil blocks from IOCs, they are heavily indebted towards local banks and thus struggle to find new financing. Additionally, the Nigerian oil industry has the third highest costs of production in the world.
Further issues include difficulties to access foreign exchange with the strict Central Bank of Nigeria’s management of its currency reserve.
2.5. SECURITY ISSUES
Militancy in the Niger Delta Region, which causes attacks on oil and gas production facilities as well as pipelines, frequently disrupts oil and gas production and makes investment in the area more uncertain.
OUTLOOKS AND SOLUTIONS FOR FLARE REDUCTION IN NIGERIA 3.
3.1. LESSONS FROM OTHER FLARE REDUCTION PROGRAMMES
See Appendix 5.
Learning from other countries, we can identify a few key factor of success for flare reduction:
An enabling governance framework As evidenced by the Canadian and Norwegian examples, having either an independent regulator or at least clear control mechanism of the regulator’s action by parliament can ensure that policies are effectively applied and that considerations related to oil production may not supersede those linked to flaring.
In Angola, although the National Oil Company is also the regulator, thus evidencing a clear conflict of interest, the demonstrated will of the Company to tackle flaring and good track record as investment partner increased flare reduction.
13 | TECHNICAL REPORTS – No.34 – SEPTEMBER 2017
Executive summary
Taking it one step at a time
Kazakhstan is a clear example of why enacting unrealistic goals and flare-out deadlines can be ineffective, as evidenced by the strong reaction from industry stakeholders.
On the other hand, the tough regulations enacted in Norway have been made applicable by a previous reduction of flaring, which was fostered by a more favourable industry structure, incentives for exports as well as a carbon tax.
Developing a regulatory environment fostering flare reduction
As a result, rather than enacting tough regulations from the start, careful consideration should be given to programmes controlling flare measurements and providing incentives for flare reduction that do not overcrowd other projects (Alberta’s royalty credit is a positive example of such a scheme).
Developing infrastructures Infrastructures are often seen as a key aspect of flare reduction: the Norwegian network, which enabled domestic and international transport of the gas, favoured associated gas utilization. In the same way, Alberta’s regulatory body for natural resources is carefully monitoring pipelines monopolies to ensure equitable access to the infrastructure.
However, in the case of Nigeria, security issues compounded with the shortcomings of the pipeline network may rather call for a deconcentration of the means of transport for the gas.
3.2. A STRENGTHENED POLITICAL COMMITMENT
During the COP21, the government of Nigeria solemnly took the decision to end gas flaring by 2020, which was translated into its INDCs and a participation in the Zero Routine Flaring by 2030 initiative led by the World Bank.
This commitment has been illustrated by the government’s will to pass a new regulatory framework.
3.3. TOWARDS A REDUCTION OF MILITANCY IN THE NIGER DELTA
After a series of harsh measures that sparked new attacks, the presidency displayed a will to alleviate tensions in the Niger Delta Region. This was exemplified by the numerous visits undertaken by Vice-President, and then acting president, Osinbajo in the beginning of the year 2017. The decrease of pipeline sabotage seems also to indicate relative respite in attacks despite series of serious strikes on oil facilities towards the end of 2016.
3.4. IMPLEMENTING NEW REGULATION See Appendix 6 & 7.
Two key policies are set to be enacted, with expected positive impact on flaring reduction:
The National Gas Flare Commercialization Programme (NGFCP)
14 | TECHNICAL REPORTS – No.34 – SEPTEMBER 2017

Executive summary
This programme is aiming to create a framework to open tenders for third party investors to take the gas at the flare and commercialize it in the domestic market. Every gas flarer would be required to provide data and open their flare for bidding except for flares that are undergoing projects that may be completed before NGFCP ones. Investors are expected to be gas commercialization companies, midstream companies or industrial players willing to integrate gas supply. The tender process from data submission from oil producers to award of the flare concessions should take around one year and a half.
It is estimated that the Programme could target from 50 to 80% of volumes flared i.e. around 50 flare sites.
The NGFCP could also provide strong incentives for oil producers to implement current flaring down projects faster, lest they have their gas taken from them.
A request for technical assistance was launched by the MPR in order to provide technical advisers to the programme. Advisers duty bill include: providing a legal framework, advising investors on project bankability, working on the economics of the Programme and technical aspects and establishing and maintaining a data room. The programme is supported by USAID and the World Bank (through the Global Gas Flaring Reduction Partnership).
Other goals for this technical assistance could be, at a later stage, to design a LPG programme and identify pilot projects in the frame of this project.
The Petroleum Industry Governance Bill The Petroleum Industry Governance Bill should reform the DPR and other regulatory bodies to create a unified, independent and stronger regulator that should have the adequate means to enforce flaring regulation. Furthermore, the reforming of the NNPC should solve joint-ventures cash-call issues and foster new investments, some of which may be directed towards flaring down.
Other bills
Gas flaring prohibition and punishment bill (2017) This Bill is mainly drawn from the same bill passed in 2009 and is currently in second lecture at the parliament. A number of the provisions of the bill are seemingly those of the NGFCP, however, it was originated from a member of parliament rather than the government. Coordination with the ministry of petroleum on the NGFCP for the bill is unknown.
Petroleum Industry Reform Bill It is the second stage of the late Petroleum Industry Bill and is unlikely to be passed before the end of the current legislature. It provides a more favourable framework for stand-alone gas operations and shifts the current fiscal framework from taxes to royalties in a bid to increase industry cost efficiency.
The repelling of the Associated Gas Fiscal Agreement will end the possibility of oil producers to back gas investments on oil expenses to lower their tax burden and may be one of the reasons explaining why IOCs are willing to use third-party investors instead of financing their own projects.
15 | TECHNICAL REPORTS – No.34 – SEPTEMBER 2017
Executive summary
3.5. TECHNICAL SOLUTIONS See Appendix 8 & 9.
Most technical solutions advocated by the Nigerian government are targeting small scale flares. This follows the statement made by the Ministry of Petroleum Resources and the NNPC that small flares are the main priority for flare reduction. Most of the technical solutions introduced below are thus adapted to small volumes and isolated flares.
On-site processing
Micro-turbines Micro turbines can be used to produce power, either for on-site use or off-grid distribution.
Their capacity ranges from 100kw to more than 20 MW, i.e. approximately 25 mscf/day to 500 mscf/day, and little pre-treatment of the gas is necessary. These solutions are modular and flexible.
They offer low-cost solutions for flare reduction and a positive social impact if used to supply power to communities; however, the issue of pricing mechanism would need to be solved.
Gas to Liquids (GTL) Most GTL processing facilities are of large scale. However, efforts are being undertaken to develop mini-GTL processes that would be miniaturized and skid mounted facilities, able to be quickly assembled and adaptable to gas productions of less than 1 mmscf to 50 mmscf per day.
One of the issues of GTL is that it mostly uses methane and leaves out heavier hydrocarbons.
Liquefied Petroleum Gas (LPG) LPG can also be produced from the gas taken at the flare, using the heavier hydrocarbon (propane and butane). It is produced by separating those hydrocarbons from the rest of the gas. LPG recovery is mostly done at large scale processing plant. It could also be a by-product of liquefaction plants for LNG.
Development of LPG benefits from strong support from the Ministry of Petroleum Resources but is constrained by a high entry cost for consumers and inadequate facilities.
Gas transportation
Pipelines Nigeria disposes of a network of oil and gas pipeline that remains largely incomplete. Given high costs, pipelines may not be adapted for a vast majority of low volume flares.
Liquefied Natural Gas (LNG) Mini-LNG plants can be used to cope with inexistent pipeline infrastructures. Less capital intensive, they are more adapted to smaller gas volume (around 5mmscf/day) and quicker to implement.
16 | TECHNICAL REPORTS – No.34 – SEPTEMBER 2017

Executive summary
Liquefying the gas greatly diminishes the volume taken and thus fits for road transportation over long distances. Regasification facilities are necessary at the end point for use.
Compressed Natural Gas (CNG) A solution to link stranded gas flaring sites to pipeline network could be to use CNG. Contrary to LNG, it requires little pre-treatment and is thus more easily adaptable and adequate for small flares. However, compression ratio is lesser than that of LNG, making it more suitable for short distances (less than 100 miles for flare gas) and small volumes (up to c.2mmscf/day).
Developing gas demand As underlined above, commercialization of flared gas in Nigeria is hindered by the lack of reliable end-market. As a result, close attention should be given to projects having credible offtakers and contributing to the development of the gas market.
Furthermore, the utilization of the gas is crucial when considering the overall carbon impact of the project.
Gas to power Most of the gas demand is driven by power plants. Although they, on theory, offer vast demand capable of dealing with gas volumes produced, the power sector has proven to be uncertain at the moment.
As a result, offtake from credible independent power projects based on gas are unlikely to materialize in the near future. Attention could, however, be given to projects having stable offtakes and being connected or close to the grid and pipeline network.
Figure 5: Summary of usable techniques for flare monetization
17 | TECHNICAL REPORTS – No.34 – SEPTEMBER 2017

Executive summary
Gas switch To face a dwindling power supply, some industries have decided to invest in captive gas-fired power plants. Captive power generation from gas could also be contemplated on the scale of industrial parks. Given the relatively low quantity of gas necessary for such projects, mini-LNG and CNG projects rather than pipeline would be most relevant. Furthermore, dealing with industries would allow for over-the-counter agreements to be struck between suppliers and buyers with competitive gas prices for flare commercialization (could be on the scale of 10-15$/mscf).
CNG and mini-LNG project developers have been receiving expression of interest from industries for gas supply contracts directed at gas switch projects.
Gas based industries Gas based industries such as fertilizers and methanol may also prove to be a reliable offtake source. Pricing is however heavily regulated and the current US0.9$ per mscf could be unprofitable. Moreover, the large volumes necessary for such projects (on the order of 100s of mscf/day) may not fit gas flaring reduction projects that would require aggregation of several flare sites to reach the desired quantities.
A POTENTIAL STRATEGY FOR AFD 4.
4.1. DEVELOPMENTAL INSTITUTIONS INVOLVEMENT IN NIGERIAN GAS FLARING
A lack of coordination and information sharing There has overall been a lack of coordination and information sharing amongst development institutions (excluding the National Flare Reduction Committee), with individual initiatives rarely achieving significant outcomes and often being short lived. While a good number of bilateral organization have undertaken flare reduction programme of their own, little remain of the work that they previously did.
This is partly due to the absence of a donor that could endorse the role of leader and the lack of will of the MPR to structure a group for its NGFCP.
Norwegian government7
The Norwegian government through its Petroleum Directorate decided in 2007 to assist the Nigerian government in reducing its flaring emissions and reaching its 2008 flare-out target.
This had, as a consequence, the creation of the Nigerian Flare Reduction Committee. This multi-stakeholder published a report in 2011 giving a set of recommendations to the ministry of petroleum resources to achieve flare-out by 2012 (which was the new deadline).
7 http://www.npd.no/en/news/News/2007/Helping-Nigeria-to-reduce-gas-flaring/ https://www.energy-pedia.com/news/nigeria/norway-to-help-cut-down-on-gas-flaring-and-oil-spill
18 | TECHNICAL REPORTS – No.34 – SEPTEMBER 2017

Executive summary
The committee’s recommendations were not really taken into account and its terms of reference were not renewed.
The Norwegian government is not involved anymore in flare reduction in Nigeria.
World Bank’s GGFR The World Bank’s GGFR has been involved in the Nigerian Flare Reduction Committee alongside with the Norwegian government. Since then, GGFR has been monitoring the evolution of the situation in Nigeria and providing advisory to the MPR, notably concerning the National Gas Flare Commercialization Programme to which the GGFR is willing to participate.
As a public private partnership, the GGFR disposes of funds that could be leveraged to support flare reduction in Nigeria.
Other donors
USAID USAID has been involved in flare reduction, providing mainly grants for technical assistance. The McKinsey study on which the NGFCP is based was financed by USAID.
Environment Canada Environment Canada has been willing to provide assistance to reduce flaring outside of Canada, targeting specifically Mexico and Nigeria. However, given the little opportunities identified in Nigeria, they may consider redirecting their funding to other countries.
One of their preferred instruments could be carbon finance.
EU delegation The EU delegation has expressed interest in participating in regulatory reform of the oil and gas sector to achieve greater flare reduction and gas commercialization in Nigeria.
DFID The DFID through its Nigerian Infrastructure Advisory Facility tackled the issue of flaring as a way to enhance gas supply to the power industry. Little outcomes were achieved and the subject was abandoned in favour of other issues.
USTDA The USTDA is also willing to intervene on gas flaring by providing funding to project developers using US technologies to monetize associated gas. A pipeline of small and large scale power projects is under appraisal.
4.2. AFD’S RATIONALE
Accounting for around 50% of its portfolio, climate action is one of the focal points of the AFD Group in the world but also in Nigeria. As such, supporting the Federal Government in achieving flare out, as per its Intended Nationally Determined Contributions defined at the COP21, is one of the AFD’s priorities in the country.
19 | TECHNICAL REPORTS – No.34 – SEPTEMBER 2017

Executive summary
Furthermore, through its involvement in the Zero Routine Flaring by 2030 initiative, the AFD Group is committed to support flaring reduction all around the world. This commitment is illustrated in its gas policy, as commercialization of flared gas is one of the preferred means of action of the AFD. As a result, a focus on climate impact should be given to flare reduction projects sponsored by AFD. More than the avoidance of flaring, attention shall be given to the uses of the gas.
This technical report marks the first contribution of AFD to the sector.
4.3. POSSIBILITIES FOR AFD GROUP INTERVENTION
Means of action
Technical assistance At the moment, engaging in a technical assistance with the Ministry of Petroleum Resources seems unlikely as it would not match AFD’s means in terms of funding availability, which is heavily inclined toward loans instead of grants.
However, in the medium-term, AFD group might look into opportunities to finance pilot projects for NGFCP or a LPG programme in support of LPG projects.
Project identification As NGFCP projects are yet to see the light of day, AFD group would prioritize, in the short term, projects identified outside of this framework. Due to their easier access to foreign markets and to forex, attention should be given to projects originating from IOCs flares and open to third party investors, although quick progress seems unlikely at this stage.
Given general issues of the domestic gas sector, identification of a project will need to be based on a holistic approach of the value-chain from gas capture to offtake.
Dialogue with other development institutions Given the lack of cooperation in the sector, efforts should also be undertaken to coordinate AFD’s intervention together with other donor institutions.
In this regard, there may be possibilities of cooperation with USTDA by providing financing for projects which benefited from USTDA funding for feasibility studies and technical assistance.
Challenges related to project identification
Structural issues Current economic conditions, including the fall of oil prices and the difficult access to foreign exchange, as well as over-exposure of local banks to the oil sector, could provide a challenging environment for new gas projects.
Furthermore, the structure of the gas market as it is, with DSOs and the Gas Aggregation Company, could provide difficult conditions for domestic commercialization projects that will
20 | TECHNICAL REPORTS – No.34 – SEPTEMBER 2017

Executive summary
need to be taken into consideration. In this context, AFD is likely to prioritize projects operating in over-the-counter markets.
Lack of credible projects Few of the technical solutions described in this report have been experimented in Nigeria, and even less so on flare capture projects.
Furthermore, specific attention will need to be given to the capacity of project developers to carry out such projects; only a few have a track record in project related to the gas sector (mostly on CNG for industry) and they seldom have experience in structuring project finance and more specifically appealing to development funds.
Viable solutions As of today, the technologies that appear to be the most suitable are mini-LNG and CNG to industries for on-site power generation as they are the ones providing the most straightforward economics. Other projects such as GTL and gas-to-power could be considered; on-site power generation could be very profitable for oil producer by allowing them to replace diesel generator; GTL projects and off-grid gas generation are, however, more challenging to implement with the lack of tried and tested commercial structures.
MINI-LNG CNG GTL (METHANOL) GAS-TO-POWER
State of the art
- A few projects undertaken or ongoing for the power sector and industry;
- No application for gas flaring yet.
- A number of projects already undertaken for gas switch in industry;
- No application for gas flaring yet.
- GTL methanol technology not experimented in Nigeria;
- Cookstove project ongoing (project Gaïa), agreement struck with Forte oil for distribution
- Projects contemplated by several stakeholders, including Shell.
Conditions of success
- Ability to strike over-the-counter agreements with industrial players.
- Developing the GTL technology in Nigeria.
- Few barriers for on-site power production;
- For on-site production and off-grid power supply, an economic model needs to be found.
4.4. CONDITIONS FOR PROJECT IDENTIFICATION
Financial instruments A number of non-sovereign financial tools could be mobilized for gas flaring reduction projects. These instruments could mainly be leveraged for pilot projects and may not be able to support extensive project pipelines.
AFD SUNREF credit facility for Nigeria See Appendix 10.
21 | TECHNICAL REPORTS – No.34 – SEPTEMBER 2017
Executive summary
This US$70 mios credit facility will target renewable energy and energy efficiency projects (medium to small scale: under US$10 mios) and provide concessional financing, together with a dedicated technical assistance programme to the banks for project analysis and to private sponsors for financial structuration, but also with investment grant (US$10 mios envelop) given to project developers.
Gas flaring projects will be eligible provided that they comply with the energy efficiency criterion. A minimum of 20% energy savings is required for energy efficiency projects.
This facility should be available by early 2018.
In the framework of the NGFCP, the Ministry of Petroleum is advised to design and promote a similar program for larger projects, with the financing resources of the green climate fund (through AFD or another accredited institution).
Africa Finance Corporation (AFC) AFC mobilizes a dedicated climate credit facility for loans amounting from €5 mios to €60 mios and tenors starting from 14 years.
In the same way as for local banks’ credit facilities, projects to be financed would be appraised through the bank’s own process and under stringent environmental criteria.
Projects targeted are those having a positive climate impact, with an initial focus on power generation.
This facility should be available by end 2017.
Commercial loans (Proparco) On the other hand, commercially viable projects could also be financed by Proparco, AFD Group’s subsidiary in charge of the private sector, at commercial conditions and in USD or Euro.
Blending and Green Climate Fund Subject to availability of relevant investment opportunities, blending of AFD loans and third-party subsidies could be possible. In the case of the Green Climate Fund (GCF), a potential pipeline of projects coupled with government programmes aiming at fostering project development could be eligible to AFD loans and GCF subsidies. Those loans would be attributed to projects with low commercial value but providing significant positive social and environmental impacts that could be subsidized through a lower interest rate.
However, the transformational impact of such a programme, necessary to mobilize GCF funding, seems difficult to demonstrate at the moment.
Eligibility for AFD financing
Three criteria are crucial in unlocking AFD financing according to the type of instrument targeted: energy efficiency, carbon footprint and environmental or social co-benefit.
Energy efficiency & Carbon footprint
22 | TECHNICAL REPORTS – No.34 – SEPTEMBER 2017
Executive summary
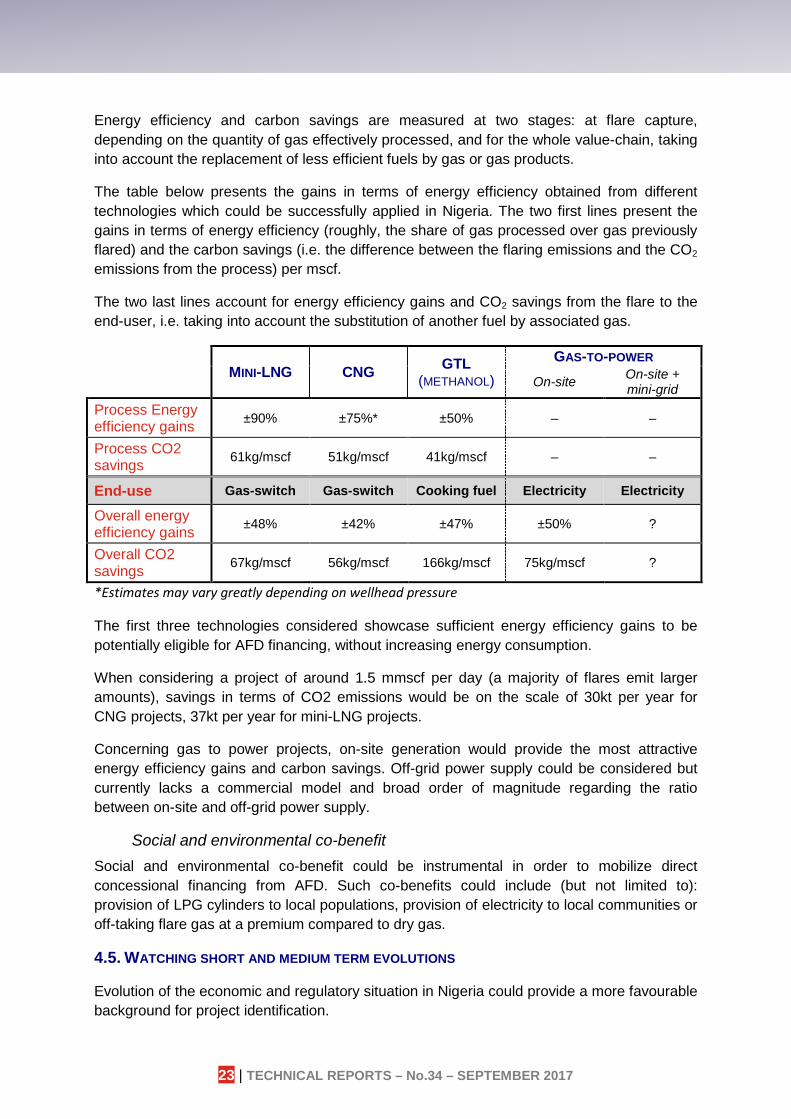
Energy efficiency and carbon savings are measured at two stages: at flare capture, depending on the quantity of gas effectively processed, and for the whole value-chain, taking into account the replacement of less efficient fuels by gas or gas products.
The table below presents the gains in terms of energy efficiency obtained from different technologies which could be successfully applied in Nigeria. The two first lines present the gains in terms of energy efficiency (roughly, the share of gas processed over gas previously flared) and the carbon savings (i.e. the difference between the flaring emissions and the CO2 emissions from the process) per mscf.
The two last lines account for energy efficiency gains and CO2 savings from the flare to the end-user, i.e. taking into account the substitution of another fuel by associated gas.
MINI-LNG CNG GTL (METHANOL)
GAS-TO-POWER
On-site On-site + mini-grid
Process Energy efficiency gains ±90% ±75%* ±50% – –
Process CO2 savings 61kg/mscf 51kg/mscf 41kg/mscf – –
End-use Gas-switch Gas-switch Cooking fuel Electricity Electricity
Overall energy efficiency gains ±48% ±42% ±47% ±50% ?
Overall CO2 savings 67kg/mscf 56kg/mscf 166kg/mscf 75kg/mscf ?
*Estimates may vary greatly depending on wellhead pressure
The first three technologies considered showcase sufficient energy efficiency gains to be potentially eligible for AFD financing, without increasing energy consumption.
When considering a project of around 1.5 mmscf per day (a majority of flares emit larger amounts), savings in terms of CO2 emissions would be on the scale of 30kt per year for CNG projects, 37kt per year for mini-LNG projects.
Concerning gas to power projects, on-site generation would provide the most attractive energy efficiency gains and carbon savings. Off-grid power supply could be considered but currently lacks a commercial model and broad order of magnitude regarding the ratio between on-site and off-grid power supply.
Social and environmental co-benefit Social and environmental co-benefit could be instrumental in order to mobilize direct concessional financing from AFD. Such co-benefits could include (but not limited to): provision of LPG cylinders to local populations, provision of electricity to local communities or off-taking flare gas at a premium compared to dry gas.
4.5. WATCHING SHORT AND MEDIUM TERM EVOLUTIONS
Evolution of the economic and regulatory situation in Nigeria could provide a more favourable background for project identification.
23 | TECHNICAL REPORTS – No.34 – SEPTEMBER 2017

Executive summary
Short term
In the short term, attention should be directed towards the passing of the PIGB and monitoring of the effects it could have on investments in the oil and gas sector.
Clarification of the NGFCP (concerning pricing of the gas offtaken from the oil producer for instance) and the eventual feasibility of such a programme could give clearer perspectives for gas flaring project developers. Furthermore, the NGFCP, should it be successful, could provide a framework for project developers allowing them to build the capacity necessary to attract foreign or development financing.
Lastly, improvement of access to foreign exchange could boost local investment in oil and gas (for which most of the equipment is imported).
Medium term In the medium term, two main aspects should be tracked:
- A rise of petroleum products prices could give more financial space to local oil companies to invest, including on flaring down projects;
- A significant decrease of militant attacks on pipelines in the Niger Delta, compounded with a development of key infrastructures could ease gas commercialization.
A number of other aspects should also be monitored, albeit more speculative in their nature:
- Reform of the fiscal framework for oil and gas, favouring investments in gas projects; - Reform of the framework for domestic commercialization of gas; - Improvement of liquidity in the power sector.
Keeping up with improvements: the need to structure an instrument? Such improvements, provided they do occur, could leverage a significant pipeline of projects. A few factors and demands expressed by potential project developers weigh in favour of structuring a new AFD financing instrument to meet the financing needs:
- Relatively small size of investments per projects (from a US$2 to 80 mios); - A large number of potential projects (according to the ambitions of the NGFCP,
around 50 projects); - A need for dollar and naira loans; - A long maturity; - Affordable interest rates compared to the ones provided by the local banking sector.
These conditions would pledge for the setting up of a dedicated line of credit with local banks, which would allow for more flexibility, shorter appraisal delays and the ability to deal with greater number of projects than currently existing instruments (may it be AFD/Proparco direct non-sovereign financing or SUNREF/AFC lines of credit).
24 | TECHNICAL REPORTS – No.34 – SEPTEMBER 2017

Appendix
Appendix
OVERVIEW OF GAS FLARING IN NIGERIA 1.
1.1. HISTORICAL TRENDS FOR GAS FLARING
Figure 6: gas production and flaring in Nigeria since 1965
Historical trends show a gradual decrease of the share of gas flared by regard to total gas produced. The evolution of the oil production index shows that gas flared and oil production seem to be correlated. However, in the 1990’s, the increase of gas flared seems to be disconnected from an increase in oil production.
Another change of trend can be noticed around the year 2005 with a decrease of gas flared while oil production remained stable. It can thus be conjectured that gas flaring reduction from that point on was mainly driven by a decrease of flare intensity (the ratio of gas flared to oil produced).
0%10%20%30%40%50%60%70%80%90%100%
0
500
1000
1500
2000
2500
3000
1965 1970 1975 1980 1985 1990 1995 2000 2005 2010 2015Gas Produced Gas Flared% of Gas Flared Oil production index
Source : NNPC 2015 & 2006 Annual Statistical Bulletin
Gas (million mscf)
25 | TECHNICAL REPORTS – No.34 – SEPTEMBER 2017
Appendix
1.2. RECENT TRENDS IN GAS FLARING
Table 1: Evolution of gas flaring in Nigeria over time: 8
2002 2003 2004 2005 2006 2007 2008 YoY decrease of flaring (%) -8,0% -13,0% 6,3% -5,4% 1,9% -0,5% -17,9%
Compound Average Reduction Rate (%) -8,0% -10,5% -5,2% -5,3% -3,9% -3,3% -5,6%
2009 2010 2011 2012 2013 2014 2015 YoY decrease of flaring (%) -20,0% 1,6% -7,5% -7,7% -8,0% -8,0% -15,2%
Compound Average Reduction Rate (%) -7,5% -6,5% -6,6% -6,7% -6,8% -6,9% -7,5%
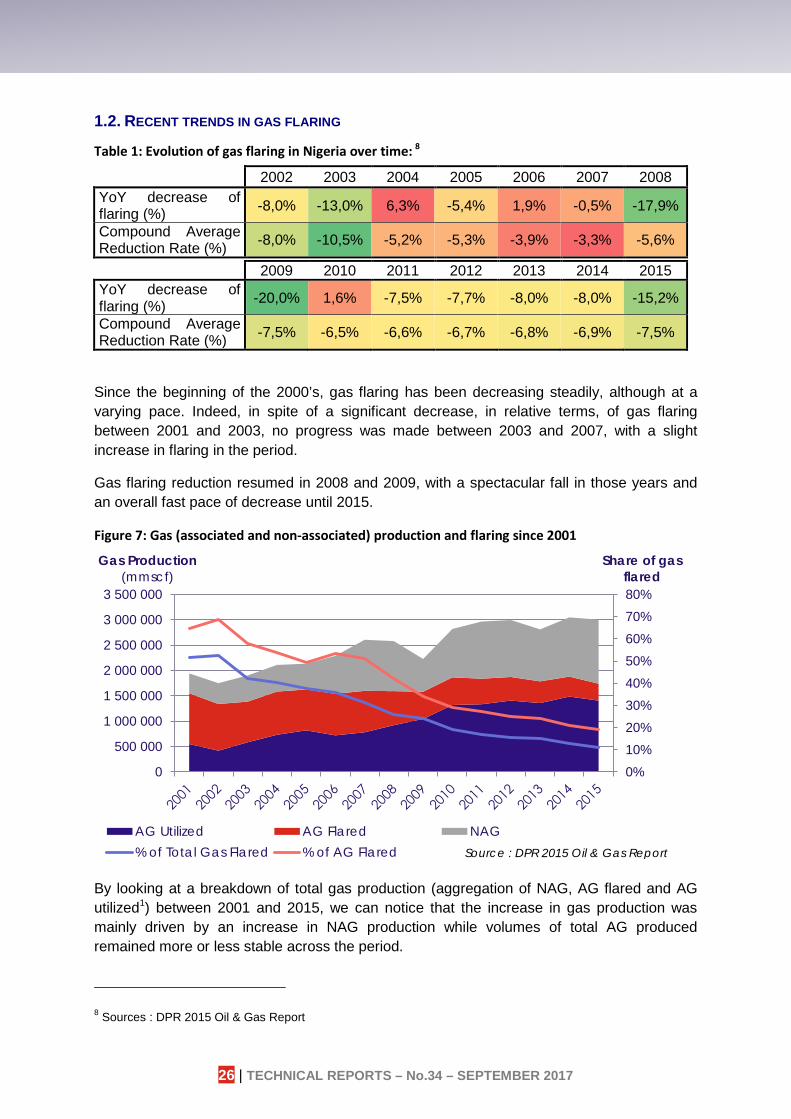
Since the beginning of the 2000’s, gas flaring has been decreasing steadily, although at a varying pace. Indeed, in spite of a significant decrease, in relative terms, of gas flaring between 2001 and 2003, no progress was made between 2003 and 2007, with a slight increase in flaring in the period.
Gas flaring reduction resumed in 2008 and 2009, with a spectacular fall in those years and an overall fast pace of decrease until 2015.
Figure 7: Gas (associated and non-associated) production and flaring since 2001
By looking at a breakdown of total gas production (aggregation of NAG, AG flared and AG utilized1) between 2001 and 2015, we can notice that the increase in gas production was mainly driven by an increase in NAG production while volumes of total AG produced remained more or less stable across the period.
8 Sources : DPR 2015 Oil & Gas Report
0%10%20%30%40%50%60%70%80%
0
500 000
1 000 000
1 500 000
2 000 000
2 500 000
3 000 000
3 500 000
Share of gas flared
Gas Production (mmscf)
AG Utilized AG Flared NAG% of Total Gas Flared % of AG Flared Source : DPR 2015 Oil & Gas Report
26 | TECHNICAL REPORTS – No.34 – SEPTEMBER 2017

Appendix
We can thus see that the decrease of volumes flared were not caused by a decrease in AG production but rather by an increase of the share of AG utilized, except in 2006. Data from the NNPC also showed that oil production remained stable across the period.
Figure 8: Breakdown of gas utilization
In 2015, 19% of AG was still flared, compared to 64.5% in 2001.
The breakdown of total gas utilization indicates an almost perfect correlation between NAG and NLNG, which should indicate that the almost entirety of NAG produced is commercialized through NLNG. Such considerations should be taken with caution and may just indicate that for DPR, all gas exported through NLNG is NAG.
Greater AG utilization seems thus to have been driven mainly by an increase in re-injection and more weakly by an increase in domestic sales.
1.3. CURRENT SITUATION
Figure 9: Gas utilization
0
500 000
1 000 000
1 500 000
2 000 000
2 500 000
3 000 000
3 500 000in mmscf
Total Gas Flared Fuel Gas Gas Lift Re-Injection(NGL/LPG) Domestic Sales NLNG (Export)
Source : DPR 2015 Oil & Gas report
Fuel Gas 5%
Gas Lift 3%
Re-Injection 25% NGL/LPG
3%
Domestic Sales 15%
NLNG (Export)
38%
Gas Flared 11%
2015 data, total of 3 003 179 mmscf
Source : DPR 2015 oil & Gas Report
27 | TECHNICAL REPORTS – No.34 – SEPTEMBER 2017
Appendix
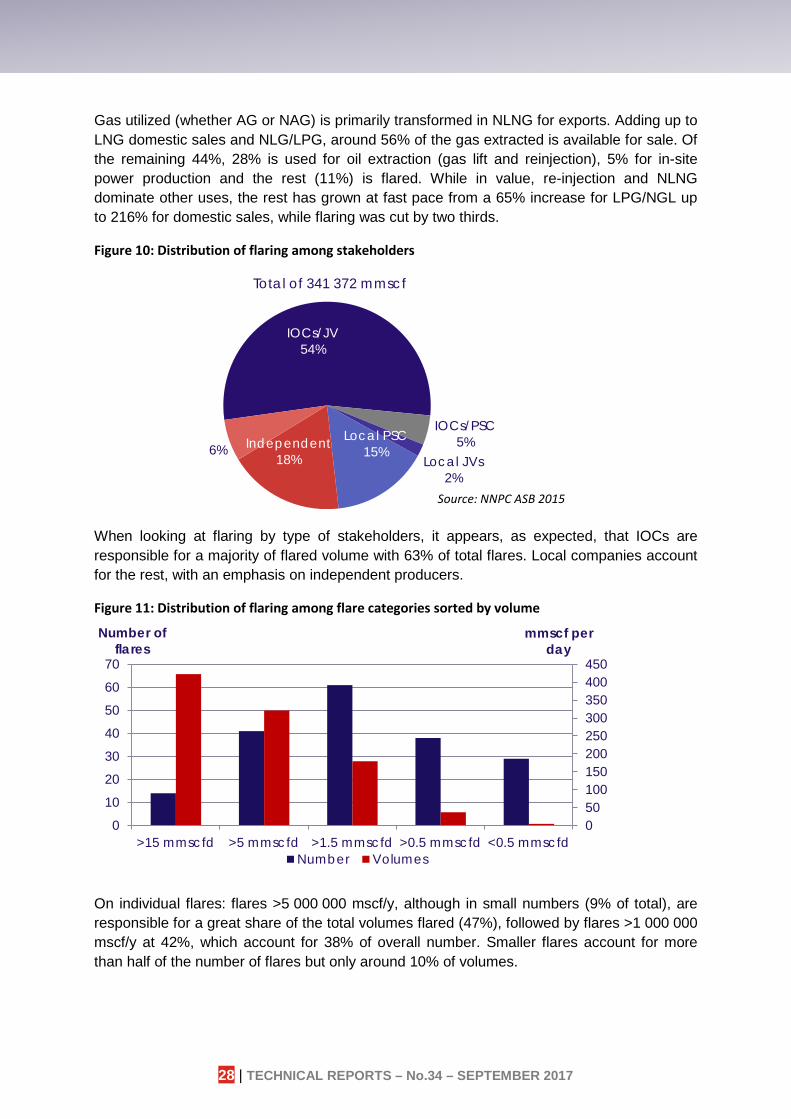
Gas utilized (whether AG or NAG) is primarily transformed in NLNG for exports. Adding up to LNG domestic sales and NLG/LPG, around 56% of the gas extracted is available for sale. Of the remaining 44%, 28% is used for oil extraction (gas lift and reinjection), 5% for in-site power production and the rest (11%) is flared. While in value, re-injection and NLNG dominate other uses, the rest has grown at fast pace from a 65% increase for LPG/NGL up to 216% for domestic sales, while flaring was cut by two thirds.
Figure 10: Distribution of flaring among stakeholders
When looking at flaring by type of stakeholders, it appears, as expected, that IOCs are responsible for a majority of flared volume with 63% of total flares. Local companies account for the rest, with an emphasis on independent producers.
Figure 11: Distribution of flaring among flare categories sorted by volume
On individual flares: flares >5 000 000 mscf/y, although in small numbers (9% of total), are responsible for a great share of the total volumes flared (47%), followed by flares >1 000 000 mscf/y at 42%, which account for 38% of overall number. Smaller flares account for more than half of the number of flares but only around 10% of volumes.
IOCs/JV 54%
IOCs/PSC 5%
Local JVs 2%
Local PSC 15% Independent
18%
6%
Total of 341 372 mmscf
Source: NNPC ASB 2015
050100150200250300350400450
0
10
20
30
40
50
60
70
>15 mmscfd >5 mmscfd >1.5 mmscfd >0.5 mmscfd <0.5 mmscfd
mmscf per day
Number of flares
Number Volumes
28 | TECHNICAL REPORTS – No.34 – SEPTEMBER 2017

Appendix
Figure 12: Distribution of flares among categories and stakeholder
When examining which kind of stakeholder is responsible in each category of flares, it appears that local companies are responsible for the greater volume of gas flared by flares > 5 000 000 mscf, while IOCs are responsible for a majority of volumes gas burnt by >1 000 000 mscf flares.
As such, local companies with high volumes flares seem to be the most straightforward target to achieve.
1.4. GEOGRAPHICAL LOCALIZATION OF FLARES
According to data from the Gas Flare Tracker initiative, flares are mainly concentrated in the Niger Delta, in the regions of Edo, Rivers, Delta and Bayelsa States, and in the waters off the Ondo and Akwa Ibom States. Other flares are also located in the mainland, although in a scarcer fashion.
Figure 13: Heatmap of flaring and number of flares per block
050100150200250300350400450
010203040506070
Num
ber
Vol
umes
Num
ber
Vol
umes
Num
ber
Vol
umes
Num
ber
Vol
umes
Num
ber
Vol
umes
>15mmscfd
>5mmscfd
>1.5mmscfd
>0.5mmscfd
<0.5mmscfd
Volumes (mmscf/day)
Number of flares
Marginal
Local
IOCs
3 mmscf/d
2.5 mmscf/d
2 mmscf/d
1.5 mmscf/d
1 mmscf/d
0.5 mmscf/d
0 mmscf/d
29 | TECHNICAL REPORTS – No.34 – SEPTEMBER 2017

Appendix
1.5. KEY TAKEAWAYS
Historical trends
There is a rather strong correlation between gas flaring against oil production, indicating that most of the gas was flared until the 1990’s. Afterward, gas flaring and oil production started to diverge, with flared volumes increasing more quickly than oil production. This trend stopped in the 2000’s with a significant decrease, in the face of stable oil volumes while gas production soared.
Breakdown of gas production While gas production increase was mostly explained by development of non-associated gas fields, which were in all likelihood exported through NLNG, utilization of associated gas grew significantly, primarily via reinjection methods and also through an increase of domestic sales.
Flaring responsibilities
It appears that nowadays, flaring is mainly done by IOCs, responsible for about 60% of volumes, followed by independent local companies (20%), other local companies under contract with the NNPC (10%) and marginal fields (7%).
A significant share of those volumes are flared by a few massive flare sites (>5 000 000 mscf), primarily owned by local companies. The bulk of IOCs’ flare are realized in smaller (>1 000 000 mscf) flare sites which account for a greater number of shares. Other smaller flares are, at this stage, not significant.
Geographical localization Most onshore flares are based in the Delta, Edo, Bayelsa and Rivers States while offshore ones are located off the cost of Ondo, Delta and Akwa Ibom States.
Opportunities for AFD At a glance it seems that the projects presenting the better opportunity for AFD group to finance would be high volume flares owned by local companies which would present the best profitability and impact. Prioritizing on-shore projects would also maximize mitigation of environmental and social impacts linked to gas flaring.
30 | TECHNICAL REPORTS – No.34 – SEPTEMBER 2017

Appendix
ENVIRONMENTAL IMPACTS OF GAS FLARING 2.
2.1. CLIMATE CHANGE
Flaring, through the emission of greenhouse gases (GHG), bears a negative impact on climate change.
Figures from the World Bank indicate that in 2010, gas flaring in Nigeria emitted 48 Mt of CO2 in the atmosphere, i.e. 17.5% of total GHG emissions at the time (including LUCF – Land-Use Change and Forestry).
It was estimated that flaring-out by 2013 could save around 64 Mt of CO2 per year.9
Precise estimate are however lacking.
2.2. LOCAL ENVIRONMENTAL IMPACTS
Acid rain Emissions of sulphur dioxide and nitrogen oxides combine with atmospheric moisture to form sulfuric and nitric acid.
Studies10 found that in flare locations, rainwater pH were consistently under WHO limits (5.6).
This in turn damages vegetation and acidifies water bodies making them inhabitable for fishes and other wildlife.
The extent and reach of those damages are, however, difficult to quantify.
Air quality Other components emitted during flaring can be detrimental for environment and human health such as carbon monoxide (CO).
However, it appears that CO concentrations measured in villages near flare sites11 were complying with US Environmental Protection Agency standards: for gas flare equipped with scrubbers (1 ppm against 9 ppm thresholds, consistent with non-flaring regions); although CO emissions for gas flare without gas scrubber were significantly higher but still below EPA’s threshold.12
Other components produced by gas flaring and associated with incomplete combustion of associated gas include volatile organic compounds (VOCs), polycyclic aromatic hydrocarbons (PAHs) and soot.
9 Ibitoye, 2014, relayed in Nigeria’s INDCs. 10 E.C. Ubani and I.M. Onyejekwe, Environmental impact analyses of gas flaring in the Niger delta region of
Nigeria, American Journal of Scientific and Industrial Research, 2013. 11 No indication was given on distance from the flare. 12 Mishiko Ishisone, Gas Flaring in the Niger Delta: the Potential Benefits of its Reduction on the Local Economy
and Environment, Berkely internal publication, 2004.
31 | TECHNICAL REPORTS – No.34 – SEPTEMBER 2017
Appendix
Concentration of some of those compounds (e.g. benzene, toluene, xylene) taken above the flare site proved to be significantly higher than the daily acceptable intake defined by the US EPA.13
Estimates from Canadian flare measurement show that a 28 mmscf flare would elevate particulate matters concentration by 21µg/m3 and by 2.3µg/m3 for benzene at a 1,325 m distance.14
Soil quality
Locally, soil pH and moisture content were also significantly lower until around 100 meters from the flare point. Temperatures were also consistently higher until 100 from the flare point (+11 up to +16°C). In the same way, bacteria count was significantly lower in the same threshold.
Overall, values close to control were reached at the 200m radius.
Ground water quality
According to Nwankwo and Ogagarue 201115, in their study conducted in the Niger Delta in both flare intensive and minimal flare areas, flaring has a significant impact on water quality; significantly higher concentrations of lead, barium, selenium and cadmium were found in water samples taken from flare zones compared to less flare intensive zones. In most cases, these values did not exceed WHO threshold, except for fluorides.
It was also found that water quality was higher in boreholes compared to surface water, making the former safe for human consumption.
2.3. IMPACT FOR LOCAL POPULATIONS
Exposure of local populations Local populations are exposed to the nefarious effects of gas flaring, particularly the ones closer to the flare sites. Local settlements are as close as 250m from the flare in some sites16 but could actually be closer, with activity being undertaken by the populations near the flare site, such as cassava drying by the flare.
Oil companies argue that economic activity created by oil production prompted installation of local settlement17.
Impact on health Several conditions can be caused by compounds emitted by flares:
13 Ibid. 14 Friends of the Earth, Gas Flaring in Nigeria: a Human Rights, Environmental and Economic Monstruosity, 2005. 15 Nwankwo C. N. and Ogagarue D. O., Effects of gas flaring on surface and ground waters in Delta State Nigeria,
Journal of Geology and Mining Research Vol. 3(5), pp. 131-136, May 2011. 16 Amanze R. Ejiogu, Gas Flaring in Nigeria: Costs and Policy, Energy & Environment Vol. 24, No. 6, 2013. 17 Human Right Watch, The Price of Oil, January 1999.
32 | TECHNICAL REPORTS – No.34 – SEPTEMBER 2017

Appendix
- PAHs and VOCs are proven to cause leukemia, blood related disorders and cancers (according to the US EPA, exposure to 1.0µm/m3 elevates cancer risks over a lifetime by 1:100,00), but also affect the central nervous system;
- Particulate matters and nitrous oxides can cause lung diseases, asthma attacks and respiratory infections.
Gross estimates18 from Friends of the Earth assume that in Bayelsa State alone, particulate matter emissions may be responsible, on a yearly basis, for 49 premature deaths, 4,960 respiratory illnesses among children and 120,000 asthma attacks, while exposure to Benzene may cause 8 additional cases of cancer by year.19
Impact on buildings Local rain accelerates the decay of building materials (corrugated roofs in particular).20
Impact on crops and agriculture Acidification of the soil from nitrogen, carbon and sulphur oxides contribute to depletion of soil nutrients, reducing crop yields21.
Heat emitted by flares could also adversely impact vegetation development and, by extension, crops.
2.4. SECOND ORDER EFFECT
The availability of cooking fuels The unavailability of gas and the customary use of wood and crop residues as cooking fuels present several issues:
- On health, the stoves used for combustion of firewood are not efficient and emit a variety of pollutants such as CO, nitrous oxides, methane or carbon dioxide, when gas stoves produce few pollutants;
- As a result, this can have adverse impacts on the health of the impacted households, with effects varying from respiratory infections, pulmonary diseases, asthma or cancers22;
- An increase of deforestation; - A scarcity of fuel available23.
18 Those estimates are to be taken with caution due to the gross assumptions taken, they nevertheless provide an imperfect but useful picture.
19 Friends of the Earth, Gas Flaring in Nigeria: a Human Rights, Environmental and Economic Monstruosity, 2005. 20 Anslem O. Ajugwo, Negative Effects of Gas Flaring: The Nigerian Experience, Journal of Environment Pollution
and Human Health, 2013. 21 Anslem O. Ajugwo, Negative Effects of Gas Flaring: the Nigerian Experience, Journal of Environmental
Pollution and Human Health, Vol. 1, No. 1, 6-8, 2013. 22 Mishiko Ishisone, Gas Flaring in the Niger Delta: the Potential Benefits of its Reduction on the Local Economy
and Environment, Berkely internal publication, 2004. 23 Stephen C. Nwanya, Climate Change and Energy Implications of Gas Flaring for Nigeria, International Journal
of Low-Carbon Technologies, Volume 6, Issue 3, September 2011.
33 | TECHNICAL REPORTS – No.34 – SEPTEMBER 2017

Appendix
NIGERIAN ASSOCIATED GAS LEGAL REVIEW 3.
3.1. ASSOCIATED GAS POLICIES AND RELEVANT GAS POLICIES
1969 Petroleum (Drilling and Production) Regulations The article 43 of the 1969 Petroleum Regulations defines the rules for making feasibility studies for the utilisation of natural gas: for any oil license or lease, the beneficiary shall submit to the Ministry of Petroleum Resources a feasibility study or proposal for the utilization of any natural gas, associated or not, discovered in the license/lease area.
However, this provision was not seen as mandatory and no penalty was provided for defaulters24.
1973 Petroleum (Amendment) Act
The article 35 of the 1973 Amendment of the Petroleum act gives a right for the Federal Government to take, at the flare, natural gas produced with crude oil, free of cost or at an agreed cost and without payment of royalties.
The price at which natural gas produced by the licensee/lessee should be sold is subject to an agreement with the Federal Government.
A royalty shall be paid by the lessee/licensee for any natural gas extracted.
This decree was not effective due to the lack of infrastructures built to ensure transportation of the natural gas25.
1979 Associated Gas Re-injection Act & Amendment Act The 1979 Associated Gas Re-Injection Act and its amendment contained a number of clauses:
- The obligation for oil producing companies to submit associated gas utilization plans (reinjection or other forms of use) by October 1st 1980;
- A flare-out by January 1st 1984 is provided, applying for all stakeholders except when authorization by the Minister of Petroleum Resources is granted. A waiver from the ministry may authorize flaring under certain conditions at the Minister’s discretion or permit flaring against a fine paid for every 28.317 scm of gas flared;
- In case of non-compliance, concession licenses may be revoked and assets of the company withhold to pay for gas flaring reduction on the specific concession.
January 1st 1985 amendment of the act allowed flaring on the following conditions:
- If more than 75% of the produced gas is utilized; - If the produced gas contains more than 15% impurities (N2, H2S, CO2 etc.); - If caused by a short-term interruption of utilization caused by equipment failure;
24 Source: Dennis Otiotio, Mays 2013, Gas flaring regulation in the oil and gas industry: A Comparative Analysis of Nigeria and Texas Regulations, University of Tulsa College of Law.
25http://www.beg.utexas.edu/energyecon/abuja_07_workshop/NIGERIA%20GAS%20ISSUES%20(Prof.%20Onyekonwu).pdf.
34 | TECHNICAL REPORTS – No.34 – SEPTEMBER 2017

Appendix
- Where ratio of volume of gas produced per day to the distance of the filed from the nearest gas line or possible utilization gas line is less than 50 mscf/km;
- Other cases seemed fit by the minister.
1992 Associated Gas Framework Agreement This agreement introduced fiscal incentives for the production of associated gas, implemented in the Nigeria Petroleum Profits Tax Act, which were extended for non-associated gas.
The article 11 of the Nigeria Petroleum Profits Tax Act contains provisions for commercialization of gas and specifies the cases in which special tax framework may apply.
In practice, companies utilizing associated gas were subject to the following incentives26:
− Capital allowance: 20%/year from 1st to 4th year, 19% for 5th year and 1% in the books − Investment tax credit of 5% − Royalty of 7% on-shore and 5% off-shore − Tax free period of 3 years renewable for additional period of 2 years − Accelerated capital allowances − Import duty exemption on plant machinery and equipment
All measures were then extended to non-associated gas projects.
The National Gas Supply and Pricing Policy & the National Gas Supply and Pricing Regulations 2008 The acts established a Department of Gas Regulation for the regulation of wholesale gas supply and a domestic gas obligation for all petroleum producers to supply gas to domestic consumers (determined by the Department of Gas Regulation)27.
Failure to comply would lead to penalties (amounting to the volumes not supplied28) and no approval for gas export or any other gas project.
A strategic gas pricing framework was introduced on the ability of a strategic grouping of demand sector with:
− Strategic sector (cost of supply pricing model), mainly the power sector or other sectors considered relevant by the Minister for Energy: this regime establishes the lowest cost of supply that will allow a 15% rate of return for the supplier.
− Feedstock sector for export (alternative fuel pricing model or netback product price) which typically encompasses industries utilizing gas as feedstock in the production of value added products for exports or domestic consumption (methanol, GTL, fertilizer…).
− Industrial/Commercial Sectors (end product pricing model) bear the highest price category, making them profitable targets for gas producers29.
26http://www.beg.utexas.edu/energyecon/abuja_07_workshop/NIGERIA%20GAS%20ISSUES%20(Prof.%20Onyekonwu).pdf.
27 http://advisoryng.com/wp-content/uploads/2013/11/2012.02.16.-GAS-SECTOR-REFORMS-CPPA.pdf. 28 http://fr.slideshare.net/OlaleyeAdioMIChemE/a-review-of-the-energy-industry-regulation-in-nigeria-and-some-
implications-for-shell. 29 http://africaoilgasreport.com/2008/04/gas-monetization/nigerias-national-domestic-gas-supply-and-pricing-
policy/.
35 | TECHNICAL REPORTS – No.34 – SEPTEMBER 2017

Appendix
Such endeavours were made in a bid to increase domestic gas utilization from flaring. Prices determined in those schemes were floor prices above which supplier would sell their gas.
Sale of gas to users such as state power plants was deemed uneconomical due to the prices set by the government30.
2008 US$3.5/mscf penalty This penalty was enacted but not followed by oil companies who kept paying the former penalty. There is no sign of enforcement from the FGN.
3.2. ENVIRONMENTAL REGULATIONS
DPR Effluent Limitation Regulations 1991 The law includes measures to limit gaseous emissions (among others) from the Petroleum Exploration and Production Industry at 5000µg of hydrocarbon per cubic meter.
Environmental Guidelines and Standards for the Petroleum Industry 199131 Reasserts the fact that flaring is forbidden but enacts rules in case it should happen, including: pre-treatment of gas; heat radiation, noise level and presence of other equipment at 60m radius; and relative density of the smoke.
EIA Guidelines for E&P Projects 199432 The EIA Guidelines for E&P projects 1994 included measures to mitigate environmental impact of Oil & Gas projects. Following the Decree n°86 of 1992 making Environmental Impact Assessment a prerequisite for the development of oil field and the acquisition of flaring permits, the Guidelines introduced more specific measures for mitigation of gas flaring and venting.
30http://www.beg.utexas.edu/energyecon/abuja_07_workshop/NIGERIA%20GAS%20ISSUES%20(Prof.%20Onyekonwu).pdf
31 http://industrialgames247.blogspot.fr/2016/02/egaspin-gas-flaring-rules.html 32http://documents.worldbank.org/curated/en/590561468765565919/pdf/295540Regulati1aring0no10301public1.p
df
36 | TECHNICAL REPORTS – No.34 – SEPTEMBER 2017

Appendix
THE NEED FOR DOMESTIC GAS MARKET DEVELOPMENT 4.
4.1. THE POWER SECTOR: A NATURAL END MARKET?
As of today, the power sector is the natural end market for gas, with 80%33 of domestic gas supplied to the power sector. Lack of gas is also frequently cited as one of the causes of the low utilization of power production plants (less than 50%).
However, given the present structural difficulty of the power sector, providing gas to power plants is risky for gas producers, with high chances of payment defaults and unreliability of the off-taken volumes.
Furthermore, pipeline attacks due to militancy in the Niger Delta can easily disrupt gas supply making availability of gas uncertain.
4.2. DEVELOPING OTHER SOLUTIONS
In the face of power sector failure, the development of small scale off-grid power plant could be a solution.
Other options should be considered to maximize associated gas utilization possibilities.
Indeed, other gas uses are underdeveloped and lack distribution networks: some infrastructures exist for LPG (Liquid Petroleum Gas) but are widely inadequate, raising safety concerns; other GTL (Gas-to-Liquids) uses, such as methanol, are non-existent and don’t have the necessary market infrastructure in place.
The development of gas based industries through reliable gas contracts and development of gas transport solution could be a possibility and favoured by the use of virtual pipelines34.
33 Source: CSL 2014 Nigerian Power Sector report. 34 Virtual pipelines designate the use of CNG or mini-LNG to truck gas in an almost continuous way, much like
pipelines.
37 | TECHNICAL REPORTS – No.34 – SEPTEMBER 2017

Appendix
COUNTRY CASE STUDIES 5.
5.1. ANGOLA35
Angola is the second largest Sub-Saharan African oil producer after Nigeria.
Although Angola does not have an independent regulatory agency, Sonangol (the national oil company) has been taking positive steps towards flare reduction by promoting associated gas utilization and proving to be a reliable investment partner.
On the other hand, Angola has little regulation regarding flaring, which is scarcely enforced. Although flaring is banned since the 80s, it has been continuously done since then while emissions are not effectively monitored. A few incentives exist, providing tax rebates for gas costs and costs related to providing gas to Sonangol.
Since 2003, flaring has increased from 200 bnscf to 250 bnscf after peaking at 260 bnscf in 2007. On the other hand, the share of gas flared has fallen from 85% to 66% mainly thanks to reinjection36. A new LNG project is predicted to further reduce gas flaring by processing as much 1 bnscf of gas per day37.
5.2. KAZAKHSTAN38
Kazakhstan bears a few common traits with Nigeria:
- The regulator is not independent and is under control from the ministry of petroleum, supervising flaring policy. On the other hand, the ministry of environment is responsible for waiving flaring permits;
- A 2004 law forbade flaring under any circumstance, with little to no delay for implementation and set up flare penalties. As a result, industry stakeholders opposed the law as it was setting an unrealistic and unreachable goal.
Since then, the 2010 Law on Subsoil and Subsoil Use regulated further associated gas utilization. However, to favour domestic market development, all associated gas was to be processed, discouraging reinjection, which is one of the main uses for flare gas in Kazakhstan.
35 http://ccsi.columbia.edu/files/2013/11/Angola-APG-Utilization-Study-May-2014-CCSI.pdf?utm_source=CCSI+Mailing+List&utm_campaign=b781216f2f-July_newsletter_2016&utm_medium=email&utm_term=0_a61bf1d34a-b781216f2f-.
http://www.iberglobal.com/files/2016/angola_eia.pdf. http://ccsi.columbia.edu/files/2014/06/A-policy-framework-for-the-use-of-APG-July-2016-CCSI.pdf. 36 Source : OPEC annual statistical bulletin, 2007, 2012 and 2016. 37 http://www.worldbank.org/en/news/feature/2013/09/20/angola-major-natural-gas-project-to-cut-emissions-from-
flaring. https://www.export.gov/apex/article2?id=Angola-Oil-and-Gas. 38 http://siteresources.worldbank.org/INTGGFR/Resources/578035-1164215415623/3188029-
1324042883839/1_International_Practices_in_Policy_and_Regulation_of_Flaring_and_Venting_in_Upstream_Operations.pdf.
http://www.ebrd.com/downloads/sector/sei/ap-gas-flaring-study-final-report.pdf. http://www.kazenergy.com/images/NationalReport15_English.pdf.
38 | TECHNICAL REPORTS – No.34 – SEPTEMBER 2017

Appendix
Policies still suffer from a weak enforcement with oil producers being fined lesser penalties than they are supposed to. Flaring has seemingly been greatly reduced between 2006 and 2011 according to Kazakhstan’s ministry of oil and gas (from 110 bnscf to 40 bnscf) which is disputed by satellite estimates from the GGFR (210 bnscf down to 150 bnscf).
5.3. NORWAY39
With gas originated from a few large offshore fields and a wide network of pipelines connecting producers to the domestic and international market, Norway disposes of a number of advantages making flare monetization more straightforward.
Furthermore, although not independent, the regulator is dissociated from the national oil company and under the control of the parliament; ensuring efficient delivery of policies. The regulator is also responsible for supervising flare control and measurement systems.
On the regulatory side, gas flaring can only be done under very stringent conditions such as unavoidable technical reasons, emergencies and safety measures. Associated gas utilization has to be taken into account to get field operation approval.
However, to make sure that such a tough regulation is effective, a number of provisions were first taken to ensure that flaring could be reduced to a minimum. Measures included a carbon tax of US$4.5/mscf, a forced merger of pipeline operators to ensure equal access to infrastructures and encouraging exports of gas as the domestic market presented little opportunities (95% of power originating from hydro). Around 0.3% of the gas produced is normally flared.
5.4. CANADA (ALBERTA)40
Alberta is often used as a case study for effective flare out policies.
While Canada as a whole disposes of universal guidelines with clear targets for operators (first, eliminate flaring then reduce it and finally improve flare efficiency), each province has its own regulatory body. In the case of Alberta, the Energy Resource Conservation Board (ERCB) is the independent regulator.
While around 90% of the gas was utilized in the mid-90s, this situation was not deemed acceptable, mainly for economic reasons. To tackle this issue, a multi-stakeholder initiative was launched.
Since then, the focus has been changing from economics to environmental and health issues. However, the framework ensuring efficient flare down stayed in place; it mostly relied
39 http://ccsi.columbia.edu/files/2014/03/Norway-APG-utilization-study-July-2014-CCSI.pdf?utm_source=CCSI+Mailing+List&utm_campaign=b781216f2f-July_newsletter_2016&utm_medium=email&utm_term=0_a61bf1d34a-b781216f2f-
https://www.academia.edu/10598305/Gas_Flaring_and_Regulatory_Policy-Making_in_Oil_Producing_Countries_A_Comparative_Analysis_of_Gas_Reinjection_Policies_in_Nigeria_Norway_and_Britain?auto=download
40 http://siteresources.worldbank.org/EXTGGFR/Resources/canada_cip.pdf http://ccsi.columbia.edu/files/2014/06/Canada-APG-utilization-study-July-2014-
CCSI.pdf?utm_source=CCSI+Mailing+List&utm_campaign=b781216f2f-July_newsletter_2016&utm_medium=email&utm_term=0_a61bf1d34a-b781216f2f-
39 | TECHNICAL REPORTS – No.34 – SEPTEMBER 2017

Appendix
on solving issues linked to the economics of gas flaring by creating a framework to assess profitability of projects while uneconomical projects could be given a waiver on royalty payment to ensure a project net present value superior to CA$ -50k while access to demand was realized through a management of infrastructure access by the ERCB to ensure non-discrimination between producers.
Flaring permits can only be waived when a project’s profitability is proven to be too low and not possible through royalties’ credit. Enforcement and monitoring of flare restrictions are focussed on poor track record fields.
In the last years, the decrease of gas prices and increase of heavy sand oil production caused a surge in gas flaring causing the share of gas flare to decrease to around 94% against 96% in 2005.
40 | TECHNICAL REPORTS – No.34 – SEPTEMBER 2017

Appendix
LEGISLATION UNDER REVIEW 6.
6.1. THE PETROLEUM INDUSTRY GOVERNANCE BILL (PIGB)41
The PIGB in a nutshell
The current Petroleum Industry Governance Bill (PIGB) has undergone its first reading on the 13th of April 2016, second reading on the 2nd of November 2016 and third reading in 15th of May 2017. The third reading was expected before the end of April 2017.
The purpose of the PIGB is to reform the governance of the Petroleum industry in Nigeria.
The Nigeria Petroleum Regulatory Commission (NPRC) reform should result in a stronger, more independent and consistent regulatory body by merging the existent ones.
It should also foster a better factoring of environmental issues through the expansion of the NPRC’s competencies compared to its precursors. The NPRC’s new competencies will also limit the Minister’s own discretionary power, notably concerning the granting of oil licenses and leases.
As a result, there is hope that the weaknesses of the current Department of Petroleum Resources (DPR) should be addressed by the PIGB. However, the revenue structure seems a bit outlandish as the operating expenses shall be covered by a part of the revenue collected by the NPRC, which would, by nature, be cyclical.
Similarly, a number of issues of the Nigerian National Petroleum Company (NNPC) should be tackled by its dismantling.
Revenue structure should be clarified by allowing the successor companies to levy a part of their revenue to face their operating expenses as well as investments, which should limit the development of dubious revenue streams. This revenue structure may, however, need to be further clarified; ring-fencing the various sub-companies might be a good idea for instance.
The issue of cash calls should also be solved by settling previous arrears.
The Nigeria Petroleum Regulatory Commission
Structure
The Nigerian Petroleum Regulatory Commission (NPRC) is to be created by aggregating the Department of Petroleum Resources, the Petroleum Products Pricing Regulating Agency and the Petroleum Inspectorate and shall retain all organization’s power and obligations, as well as assets and liabilities.
The new commission will be governed by a board including representatives from the Ministries of Finance, Petroleum Resources and Environment.
Functions
41 Source : http://www.nassnig.org/document/download/8339, 25/11/2016.
41 | TECHNICAL REPORTS – No.34 – SEPTEMBER 2017

Appendix
General duties: The NPRC’s duties are to enforce policies, laws and regulation regarding all aspects of petroleum operations. Responsibilities encompass monitoring of all activities in the oil and gas sector, from upstream to downstream, including pricing, respect of construction standards, maintaining a data base and monitoring uses of oil and gas reserves.
Responsibilities over the environment Furthermore, the NPRC will have a responsibility concerning the monitoring of all environmental aspects related to the petroleum industry. While former versions of the bill provided that the Commission shall not prejudice overall responsibility of the Ministry of Environment over environmental affairs, this provision was not retained in the final version that was passed by the Senate.
A committee may however be setup in conjunction with the Ministry of Environment in order to enable cooperation.
Bidding processes The NPRC will also be in charge of conducting bid round for award of petroleum exploration or production licenses and provide recommendations to the Minister of Petroleum Resources to grant, amend, renew, extend or revoke said licenses.
Regulation Pursuant to the present act, the NPRC may enact regulations after consultation with the public. The NPRC will also have the possibility to make recommendations to the Minister for any new regulation or policy regarding the oil and gas sector.
Funding Most of the funding for the NPRC should be derived from a levy of 10% of the revenues generated. Those revenues are not detailed but should be mostly composed of royalties, rental, fees and other charges for upstream petroleum operations.
Other sources will include grants and penalties levied by the NPRC.
Ministry of Petroleum Incorporated
The Ministry of Petroleum Incorporated shall be the corporation in charge of holding on behalf of the Ministry of Petroleum Resources (MPR) the commercial entities resulting from the dismantling of the NNPC.
Nigeria Petroleum Assets Management Company
Overview
The Nigeria Petroleum Assets Management Company (NPAMC) will be the company that will be primarily in charge of managing assets that will not require up-front investments. Those
42 | TECHNICAL REPORTS – No.34 – SEPTEMBER 2017

Appendix
assets transferred to the NPAMC will mainly consist in oil blocks contracted under Production Sharing Contracts (PSCs)42 and service contracts.
The shares of the company should be held at 20% by the Bureau of Public Enterprises, 40% by the Ministry of Finance Incorporated and at 40% by the Ministry of Petroleum Incorporated.
Provisions are made for an annual report and annual account to be published every year, with no explicit obligations for an audit of the financial accounts.
The process of designation for board members remains to be established by the Ministry of Petroleum Resources. In any case, a representative of the MPR will be designated as board member.
Funding A portion of the revenues of the NPAMC will be retained to fund operational expenses while the surplus will be spent as dividends for the Federal Government.
In the 6 months following the incorporation of the NPAMC, the Ministry of Petroleum Resources shall present to the Ministry of Budget a request for appropriation of funds necessary to capitalize the NPAMC.
National Petroleum Company
Overview
National Petroleum Company (NPC) will be mostly in charge of managing assets owned and operated by the NNPC. This should include join-venture assets, NNPC’s own operation (under its subsidy NPDC) and other operations such as pipelines.
The shares of the company should be held at 20% by the Bureau of Public Enterprises, at 40% by the Ministry of Petroleum Incorporated and 40% by the Ministry of Finance Incorporated.
Within 5 years, 10% of the shares should be divested and 30% within 10 years.
Funding A portion of the revenues of the National Petroleum Company will be retained to fund all expenses, including operational, cash-call expenses and debt service, while the surplus will be spent as dividends for the Federal Government.
In the 6 months following the incorporation of the National Petroleum Company, MPR shall present to the Ministry of Budget a request for appropriation of funds necessary to capitalize the NPAMC.
42 PSCs are contracts that maintain possession of the asset to the Government of Nigeria while a private company is providing all services necessary for oil exploration and production.
43 | TECHNICAL REPORTS – No.34 – SEPTEMBER 2017

Appendix
6.2. GAS FLARING (PROHIBITION AND PUNISHMENT) BILL (2017)
Current situation
This bill has been passed on second reading at the Senate on the 9th of March 2017. The first reading took place on the 3rd of November 2016. No version of the bill is available yet and all information is taken from third-party accounts.
The Gas Flaring Bill takes a number of provisions from the 2009 eponym bill43.
Prohibiting flaring
This bill sets up a flare out deadline for December 2016.
Flaring will still be authorized but only: in the case of safety procedures or operational constraints, or when gas utilization programme are not economical. The minister of Petroleum Resources shall not have discretionary power to permit flaring outside of those two cases. Permits shall only last for duration of 30 days with possibility of renewal.
Gas utilization plans should be provided and deemed acceptable by the Ministry of Petroleum Resources for an oil or mining license to be delivered. Utilisation programmes shall be in line with the 2008 Gas Master Plan, domestic supply obligations and relevant national policies.
Providing a framework for the National Gas Flare Commercialization Programme?
Some provisions of the bill seem to be preparing for the implementation of the National Gas Flare Commercialization Programme:
• Operators shall provide, within 3 months of the bill being passed into law, feasibility studies, programmes and proposals for the utilization of gas flared. If the gas cannot be commercialized then the field shall be shutdown. Data on the gas shall also be provided to the MPR within the same timeframe.
• From this data, the MPR shall open bid for third-party utilization projects.
Providing incentives and penalties
A number of tax incentives will be deployed, including 5 year tax holidays for infrastructure projects enabling flared gas utilization. Similarly all projects supplying the domestic market will enjoy a 5-year corporate tax exemption. The perimeter of those tax holidays is not clarified.
Penalties shall be based on the international price of gas. Moreover, in case of flaring, an amount equivalent to half of those penalties shall be given back to local governments for community development activities.
43 Source: http://www.lawyard.ng/what-the-gas-flaring-prohibition-bill-will-achieve-jibola-asolo-counsel-at-fmdq-otc-securities-exchange/
44 | TECHNICAL REPORTS – No.34 – SEPTEMBER 2017

Appendix
6.3. NATIONAL PETROLEUM FISCAL POLICY (PETROLEUM INDUSTRY REFORM BILL)
Analysis of the situation
Several issues concerning the current oil and gas fiscal framework have been identified by the Ministry of Petroleum Resources. The current issues are concentrated on Production Sharing Contracts (PSCs), the Associated Gas Fiscal Agreement (AGFA) and the Petroleum Production Tax.
The issue with PSCs PSCs allow the government to contract oil companies (mainly International Oil Companies) to explore oil blocks at their own risks while the government retains concession of the block. If exploration is successful, the oil company may retain part of the oil (cost oil) to cover its cost for production and exploration. Cost recovery through cost oil is capped in a number of countries with limits varying from 40 to 80% for comparable countries. Nigeria is one of the only countries that has a 100% cost recovery.
The remaining oil (profit oil) is shared between the government (royalties) and the oil company. The oil company pays, on top of royalties, a tax on profits.
Royalties have not been progressive enough for PSCs: they were supposed to be re-evaluated once the price of oil exceeded US$20/barrel, which has not been the case. As a result, government revenues from PSCs have been lower than for joint-venture agreements.
Furthermore, the high cost recovery rate may have caused the governments to bear most of cost risks (estimated at 94% by the government).
Additionally, one of the flaws of PSCs, along with joint-venture contracts is that they do not allow for windfall revenues which may help in constituting a sovereign fund that may act as a buffer in case of low oil prices.
The issue with AGFA
The AGFA was conceived to bolster associated gas utilization by introducing new measures such as the authorization to incur gas costs on oil costs, which may in turn lead to tax rebates.
AGFA was later extended to all gas projects.
This had the adverse consequence of decreasing government take on oil projects and incentivizing the construction of gas infrastructures that may not be deemed as necessary by the MPR. Those infrastructures were thus indirectly financed by the government of Nigeria.
Furthermore, such legislation disadvantages gas producers as compared to oil producers as they do not have oil operations against which they could incur gas costs.
The issue with Petroleum Production Tax The high tax rate (85%) meant that there were little incentives for oil producer for cost reduction.
45 | TECHNICAL REPORTS – No.34 – SEPTEMBER 2017

Appendix
Taxes were also difficult to assess and collect mainly because of a struggle to accurately evaluate costs incurred by oil companies.
Capital gains and capital expenditure tax holidays The rent capture through capital gain tax is estimated at 10% by the MPR, which is significantly lower than other African resource-rich countries.
Furthermore, the accumulation of measures allowing for capital expenditure tax holidays and pioneer status for local oil companies increase tax deductions to which the oil companies are eligible.
Those tax holiday losses for the government are estimated at US$21.9 billion from 2014 to 2019.
Other general issues 1. Lack of integrated development planning to minimise cost; 2. Government inability to fund its equity in the joint-venture operations; 3. Gas flare penalties are eligible to qualifying deductions.
Principles of action
Priorities The Petroleum Industry Reform Bill has been drafted with four priorities in mind:
1. Managing efficient revenue collection through a single revenue management authority;
2. Attenuating the impact of the variation of oil prices on the economy and government revenues;
3. Avoiding populist economics and decreasing the government’s involvement in the oil and gas sector;
4. Diversifying revenues away from the upstream to the downstream and oil & gas based industries.
Taking into account the fact that Nigeria is one of the highest cost oil producers in the world, the new fiscal framework will serve as a way to clarify the fiscal framework and incentivize producers to reduce costs in a context of low oil prices (long term price assumption at $45/barrel by the MPR).
As a result, in an effort to boost investor IRR, the option of reducing the government take in oil projects will be explored.
Objectives of the bill Several objectives can be identified throughout the Petroleum Industry Reform Bill:
- Enabling a sound fiscal framework for the oil and gas industry: by uncoupling the gas fiscal framework from oil; rebalancing taxes between onshore, shallow and deepwater oil blocks by decreasing taxes on the former and increasing them on the latter;
- Liberalising (concerning pricing for instance) the oil and gas sector to attract new investors;
- Increasing government revenue while decreasing government intervention in the sector;
46 | TECHNICAL REPORTS – No.34 – SEPTEMBER 2017

Appendix
- Fostering gas exploration and production.
Gas strategy With a potential to significantly contribute to economic development, fiscal focus will be given to the gas industry to foster its expansion.
Development of a viable domestic, regional and export markets will be one of the points of concern, with the development of an integrated infrastructure strategy.
Capacity and competition in the sector should be developed to attract new players in the gas value chain while ensuring commerciality to investments.
To this end, a difference of treatment will have to be made between the various levels of the value chain in favour midstream development. Incentives for upstream development shall also be given.
Changes to the fiscal regime
Fiscal regime for gas Fiscal Incentives will be given for liquefied petroleum gas and other mid-stream gas projects. Liquefied petroleum gas as part of the gas value chain ought to be covered by the gas utilisation incentives intended for midstream projects.
AGFA will be abrogated and midstream and downstream investments will not be recovered from upstream project revenues. Royalties and taxes on gas projects will be reduced.
Gas pricing framework
Power Gas Based Industries Flared Gas Gas for
wholesale Gas for
LNG/CNG Price
(per mscf)* US$2.5 US$0.9 to 3 US$0.25 <US$3** Based on NLNG average
* All prices will be inflation adjusted using the OECD inflation index ** Prices will be depending on the monthly average fuel oil price
Royalties A new royalty scheme will be setup with rates ranging from between 5% to 40%, based on:
- Royalty scale based on daily production, ranging from 5% to 20%; - Royalty scale based on price, ranging from 0% to 20%; - No royalty based on gas price.
47 | TECHNICAL REPORTS – No.34 – SEPTEMBER 2017
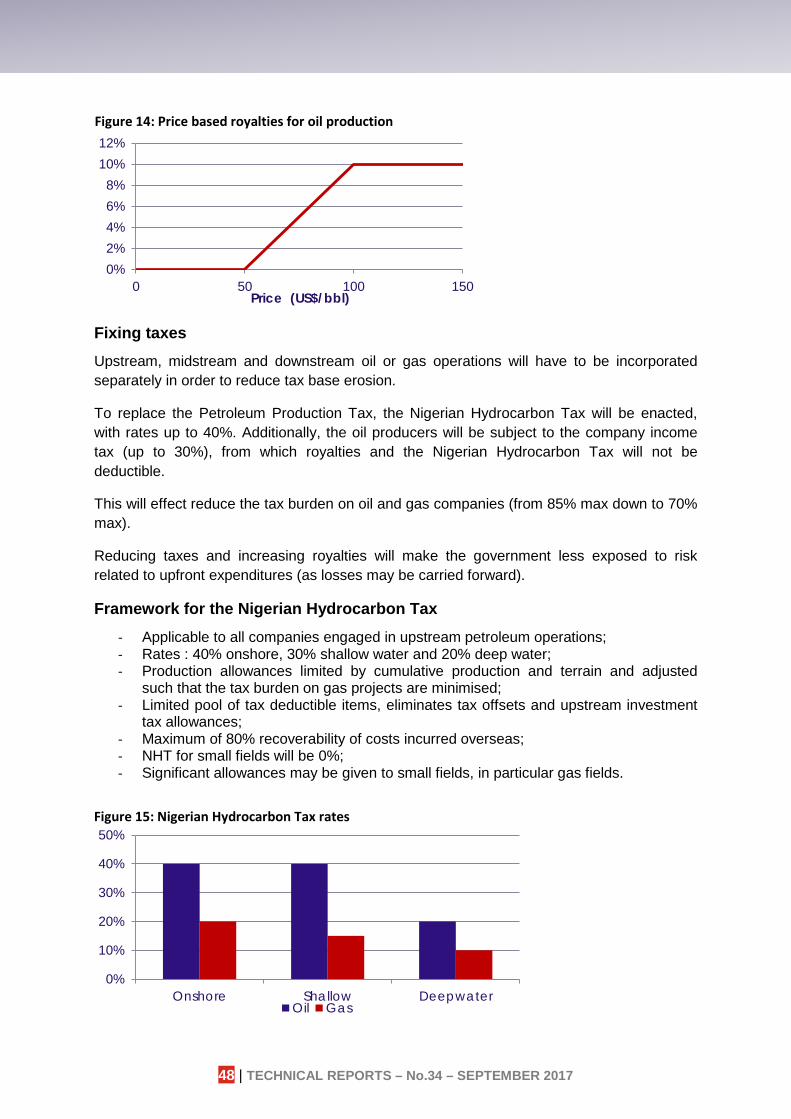
Appendix
Fixing taxes Upstream, midstream and downstream oil or gas operations will have to be incorporated separately in order to reduce tax base erosion.
To replace the Petroleum Production Tax, the Nigerian Hydrocarbon Tax will be enacted, with rates up to 40%. Additionally, the oil producers will be subject to the company income tax (up to 30%), from which royalties and the Nigerian Hydrocarbon Tax will not be deductible.
This will effect reduce the tax burden on oil and gas companies (from 85% max down to 70% max).
Reducing taxes and increasing royalties will make the government less exposed to risk related to upfront expenditures (as losses may be carried forward).
Framework for the Nigerian Hydrocarbon Tax
- Applicable to all companies engaged in upstream petroleum operations; - Rates : 40% onshore, 30% shallow water and 20% deep water; - Production allowances limited by cumulative production and terrain and adjusted
such that the tax burden on gas projects are minimised; - Limited pool of tax deductible items, eliminates tax offsets and upstream investment
tax allowances; - Maximum of 80% recoverability of costs incurred overseas; - NHT for small fields will be 0%; - Significant allowances may be given to small fields, in particular gas fields.
Figure 14: Price based royalties for oil production
0%2%4%6%8%
10%12%
0 50 100 150Price (US$/bbl)
Figure 15: Nigerian Hydrocarbon Tax rates
0%
10%
20%
30%
40%
50%
Onshore Shallow DeepwaterOil Gas
48 | TECHNICAL REPORTS – No.34 – SEPTEMBER 2017
Appendix
Miscellaneous
Capital gain taxes should vary between 10 and 30%.
PSC terms will be reviewed in consistence with the Deep Offshore Act.
A number of uncertainties and inconsistencies
The cap on price based royalties varies from 10 to 20% in various parts of the report; as such it is unknown what would be the exact price mechanism.
The question of government take increase or decrease is actually nebulous with several elements in the bill indicating contradicting evidences.
While volume based royalties are supposed to start at 5%, it seems that producers are exempt of royalties for small volumes of oil or gas (as seen on royalty graphs) which is not clearly explained in the bill.
Key takeaways
This policy is difficult to understand, although the intent of the government seems clear: bringing competitiveness to the oil industry while decreasing government intervention, the effect of the new fiscal framework is not compared with the older one.
Although maximum tax rates are lower, the increase of royalties should mean a decrease of profit from oil companies. While the decrease in profits is evidenced in the bill, investors’ rate of return is predicted to be increasing: the mechanisms at play are not evidenced.
Furthermore, while liberalization of price mechanisms are wished for by the government, no clear timeline is set and determination of prices by government is further planned and clarified in the bill.
Nevertheless, this bill brings forth positive outcomes, in particular concerning gas operations: the new gas fiscal framework should favour stand-alone gas operations. However, there may be concerns about profitability for associated gas operations, which were using (and in some cases abusing) the Associated Gas Fiscal Agreement.
49 | TECHNICAL REPORTS – No.34 – SEPTEMBER 2017

Appendix
NATIONAL GAS FLARE COMMERCIALIZATION PROGRAMME 7.
7.1. INTRODUCTION
The National Gas Flare Commercialization Program is a new scheme unveiled by the Ministry of Petroleum Resources, to enable investors to access flares owned by oil field operators in a bid to increase associated gas utilization.
Objectives This program is structured around 3 objectives:
1. Fixing the market and licensing process; 2. Establishing market infrastructures and providing incentives; 3. Improve monitoring and enforcement.
Stakeholders This program will be built around 3 types of stakeholders:
1. Oil companies which will give access to their flares; 2. Third-party investors who would gain access to the flare and offtake the associated
gas produced; 3. The Federal Government of Nigeria with a role of regulator to ensure smooth delivery
of the program.
Project governance The project will be under the control and responsibility of a steering committee reporting directly to the Minister of State for Petroleum Resources.
A joint implementation team will be established under the oversight of the steering committee. It will be composed of members of the Ministry of Petroleum Resources and Department of Petroleum Resources. The team will be led by a programme manager selected from the private sector.
An advisory team, funded by development agencies, will be setup to assist the implementation team.
7.2. FIXING THE MARKET AND LICENSING PROCESS
This phase is aiming at developing a contracting framework to allow easy access to flares for third-party investors while ensuring acceptable conditions for oil field operators, including a fair pricing scheme to incentivize government, flare investors and operators.
Operators shall provide data on flare sites characteristics to ensure transparency of licensing processes while investors will be screened to ensure they have sufficient capabilities to implement flare-down projects.
Criteria on the back of which investors will be evaluated will include: a technical and financial review, the inclusion of Nigerian content; and host community engagement.
Timeline
50 | TECHNICAL REPORTS – No.34 – SEPTEMBER 2017

Appendix
The initial timeline planned that every oil company not currently undertaking flare-out plans should provide access to data on their flare sites to allow third-party investors to submit bids. Bidding results should be announced in Q2 2017 for project commencement in Q4 2017.
Oil companies having started their own flare-out projects on some oil fields shall be exempted of participation to the licensing process for those specific fields provided they achieve project by Q4 2017. Otherwise they will be forced to submit their flare for the next round of bidding process.
Such a schedule seems overdue as of today. The framework of the programme will likely be set by the end of Q2 2017.
Prices
Prices paid by investors will be determined by three factors:
- Signature bonus based on AG production and reserves, paid to the government - Handling fee fixed and determined on the volume, paid to the well operator - Off-take tariff (per mscf of AG) paid to the government
7.3. STRUCTURING THE MARKET
Financing third-party investors The MPR evaluates financing needs to around US$2 to 3bn and is considering 5 sources of financing to be used:
- Concessional financing from development finance institutions; - Risk sharing guarantees (MIGA and AfDB Risk Guarantee); - FX instruments; - Technology providers financing; - Grants & Technical Assistance.
The programme implementation team would advise investors on what financing they could access.
Facilitating stakeholder relationships The purpose of the programme is to serve as a bridge between flare sites and investors.
The implementation team will also support investors with the following tasks:
- Assisting in connecting operators facilities to that of investors; - Reviewing local gas market potential demand for prospective projects; - Establishing an LPG programme.
Furthermore, the feasibility for a trust fund for host community participation in the programme will be assessed.
7.4. IMPROVE MONITORING AND ENFORCEMENT
Conscious of the hurdles faced by the DPR in the enforcement of flare penalties, with, among others, a reliance on data provided by IOCs, the ministry wants to introduce a more
51 | TECHNICAL REPORTS – No.34 – SEPTEMBER 2017

Appendix
transparent framework for data collection and random auditing from the DPR to ensure a tougher enforcement of the regulation.
The programme team will be responsible for reviewing existing regulation and drafting implementation regulation to enforce the programme.
The possibility of increasing and enforcing a new flaring penalty will also be contemplated.
52 | TECHNICAL REPORTS – No.34 – SEPTEMBER 2017
Appendix
TECHNICAL SOLUTIONS FOR FLARE REDUCTION 8.
8.1. GAS FROM THE FLARE: CAPTIVE UTILIZATION PROJECTS
Micro-turbines A range of micro-turbines exists, allowing the use of gas on site to produce power.
Their capacity ranges from around 100 kW to more than 20 MW, which makes them good solutions for small flares. Furthermore, they may not require pre-treatment of the gas (elimination of sulphur, carbon dioxide or pressurization) before combustion and allow gas to be taken directly from the feed. It can be used for a variety of flares sizes as multiple turbines can be combined.
Modularity and adaptability - Low cost, compact and quick to implement solutions; - Compatible with low volumes flares; - Can take on all the gas directly from the flare.
Marketability - Can be used for off-grid distribution and on-site consumption; - Issues such as pricing schemes for communities for off-grid supply and cooperation
with flare operator for on-site consumption will need to be considered; - For larger scale projects, connection to the grid may be necessary but will then be
facing issues linked to power sector reliability.
Environmental and social impact - Direct and total flare reduction may be achieved, therefore mitigating environmental
impact; - Treatment of the gas before combustion would provide the cleaner combustion,
otherwise emissions from the turbine would have to be monitored; - Possibility of community partial ownership could be explored; - Can enhance access to energy for local communities.
Political context and transparency - Although no clear political support has been given, mini-grid projects are under
development in Nigeria, with help from development institutions; - Captive projects could present the least risks in terms of transparency and corruption.
Gas to Liquids (GTL)
Several gas to liquids technologies have been developed: - The most common one, known as Fischer-Tropsch-Gas-to-Liquids (FT-GTL),
producing naphta and diesel from methane. This process is tried and tested and the most commonly used in the industry. However, this process requires extensive facilities and is quite energy intensive;
- Other technologies bypass the syngas transformation to produce directly synthetic fuel methanol. This technology may, however, manufacture products at a lower efficiency or at a lower stage of processing which may impact marketability. Mini-GTL processes exist that enable miniaturized and skid mounted facilities to be quickly assembled and can be adapted (according to the technology) to gas
53 | TECHNICAL REPORTS – No.34 – SEPTEMBER 2017

Appendix
productions of less than 1 mmscf to 50 mmscf per day. Mini-GTL can use both technologies while large scale facilities are predominantly using FT-GTL.
Modularity and adaptability: - Most solutions are skid mounted, allowing for fast deployment and taking in small
amounts of gas; - Larger solutions using the FT-GTL exist, which could be able to work for larger flares; - Some GTL processes may require treatment of the gas to keep only methane; - Most GTL processes only process methane and not the other, heavier hydrocarbons.
Marketability: Marketability of liquids produced from GTL could be challenging:
- For methanol: local consumption through cooking stove may be possible but would require having the right partnership;
- Synthetic fuel may have to be marketed through the nationwide network and subjected to regulated prices. A GTL facility is operated by Chevron, producing 33k bpd of synthetic fuel which are exported;
- Dimethyl-ether (DME), ethylene or propylene could be directly sold to industries but a market and off-takers would have to be identified.
Environmental and social impact: - For small scale facilities, a point of concern could be the gases that are not
processed (butane and propane can be 40% of the mix); - Large scale may have LPG processing plants, but their larger surface can have
greater local environmental impacts; - Use of methanol for cooking stoves would have a positive environmental and health
impact by decreasing household’s reliance on biomass fuels and kerosene for cooking;
- Production of DME could help develop domestic industries (for producing plastics for instance) and employment.
Political context and transparency: - GTL is not often discussed by the FGN and may only have a weak political support; - If production of synthetic fuel is envisioned, consideration should be given to
transparency of the market processes and reliance on stakeholders such as the NNPC.
Liquefied Petroleum Gas LPG can also be produced from the gas taken at the flare, using the heavier hydrocarbon (propane and butane). It is produced by separating those hydrocarbons from the rest of the gas. Several technologies exist, the mainstream one using cooling of the gas to condensate the heavier part. Other technologies, such as MTR’s membrane, allow for LPG recovery to be done at small scale.
Modularity and adaptability: - Most of the LPG facilities operate on large scales, using extensive facilities for cooling
and LPG recovery (most of Nigerian LPG is produced at NLNG); - New technologies would be able to separate LPG at small scale with skid mounted
facilities taking flares from 1 mmscf to 15 mmscf;
54 | TECHNICAL REPORTS – No.34 – SEPTEMBER 2017
Appendix
- Would only take the heavier hydrocarbons, leaving out methane. Should be envisioned with other solutions to take gas from the flare.
Marketability: - A market exists but is underdeveloped: facilities exist but are not complying with
safety standards (as for 90% of cylinders) which pose serious safety threats that can hamper and setback LPG development;
- Most of the current domestic production is concentrated at Bonny Island and exported;
- LPG could be marketed to households either for cooking or for vehicle fuels. The former would be easier considering little market infrastructure exist for the latter;
- Pricing (including cylinder) would have to be taken into account for wider market penetration and competition against kerosene.
Environmental and social impact: - Use of LPG as cooking fuel would have a positive health and environmental impact
on households relying on biomass; - LPG would provide a use for heavier hydrocarbons not used by other processes.
Political context and transparency: - The MPR is pushing forward to encourage development of LPG market, this could
provide beneficial for both small and large scale projects; - The regulation of the sector is still lacking and should be developed; - Transparency of the marketing processes, off-takers and agreements should be
addressed when structuring a project.
8.2. DEVELOPING A DOMESTIC GAS MARKET AND INFRASTRUCTURE
Pipelines
Nigeria disposes of a network of oil and gas pipelines. However, and in spite of the pipelines clusters envisioned in the Gas Master Plan, it remains quite underdeveloped and prone to attacks. At this stage, it seems difficult to further develop the gas pipeline network further without extensive investments.
Some pipeline connections have been undertaken by the NNPC, such as the OB-3 (Obiafu/Obrikom/Oben) gas pipeline. As such, priority should be given to linking individual facilities if adequate rather than developing new pipeline infrastructures.
Liquefied Natural Gas Mini-LNG plants can be used to supplement inexistent pipeline infrastructures. Being less capital intensive, they are more adapted to smaller gas volume (on the scale of 5 mmscf/day) and quicker to implement.
Liquefying the gas greatly diminishes the volume taken and is thus fit for road transportation over long distances. Regasification facilities are necessary at the end point to either transfer the gas to a pipeline or consume it.
Modularity and adaptability: - Some solutions can be assembled from standard containers blocks but are still
extensive facilities;
55 | TECHNICAL REPORTS – No.34 – SEPTEMBER 2017

Appendix
- May require either large amounts of gas from a substantial flare or gathering gas from several smaller flares to a central location.
Marketability: - The LNG could be marketed internally to consumers connected to a regasification
unit; - Attention should be given to the reliability of the off-takers.
Political context and transparency: - LNG project should supplement shortcomings from the pipeline network and Gas
Master Plan and connect stranded industries while offering more reliable supply. Political support may thus be offered for such projects.
Compressed Natural Gas A solution to link stranded gas flaring sites to pipeline network could be to use CNG.
Contrary to LNG, it requires little pre-treatment of the gas to eliminate impurities and is thus more easily adaptable and adequate for small flares. However, compression ratio is lesser than that of LNG, making it more suitable for short distances (less than 100 miles for flare gas) and small volumes (up to ~2mmscf/day).
Modularity and adaptability: - Solutions fitting in 40ft containers exist, ensuring quick deployment; - Little pre-treatment required; - Adapted to small volumes (up to ~2mmscf/day) and short distances (< 100 miles); - CNG could be less capital intensive and easier to implement than pipeline
connections.
Marketability: - CNG could allow marketing of gas mostly for pipelines or nearby facilities; - Final users could be IPPs or industries.
Environmental and social impact: - Due to the low footprint of the facility, environmental impact could be low.
Gas from power and industries Most of the gas demand is driven by power plants.
If, in theory, they offer vast demand which should have the capacity to offtake volumes produced by the industry, the power sector has proven to be unreliable, with difficulties from distribution companies to collect revenue, and failing power grid and the inability of generating companies to pay gas bills.
As a result, credible Independent Power Projects (IPPs) based on gas are unlikely to materialize in the near future. Attention should, however, be given to projects having stable offtakes and being connected or closed to the grid and pipeline network.
On the other hand, gas based industries may prove to be a more reliable offtake source, with prices varying according to the type of industry and the liability of the gas supplier to the domestic gas supply obligations (DGSOs). Attention should thus be given to energy
56 | TECHNICAL REPORTS – No.34 – SEPTEMBER 2017

Appendix
efficiency projects proposing the use of associated gas, or greenfield projects utilizing gas for power generation or transformation.
Key challenges - Reliability of off-takers; - For industrial projects, energy supply to the industrial plant may have to be secured
from the onset of the project and changing energy source might prove challenging.
57 | TECHNICAL REPORTS – No.34 – SEPTEMBER 2017
Appendix
PROJECT CASE STUDIES 9.
Power projects
ENI’s Kwale Okpai project In 2005, ENI completed the construction of the 480MW Kwale Okpai power plant, which consumed on average 61 mmscf of associated gas which would otherwise have been flared.
The project was attributed carbon credits as part of the Clean Development Mechanism.
GTL Projects
Chevron’s Escravos GTL It converts daily 325 mmscf of gas into 33 000 barrels of synthetic fuel, diesel mainly. The GTL facility is also associated with an LPG plant that produces 150 mmscf of LPG per day. US$8.4 bn investments were necessary for the project for which a pre-feasibility study was executed in 1998 while commercial operations only started in 2014.
Difficulties with the project have stifled other GTL projects in Nigeria.
CNG
Benin city NIPCO’s CNG cars In 2007, NIPCO launched, in joint venture with Nigeria Gas Company, a CNG programme in Benin city, to convert cars and build CNG stations for refueling.
Although cost effective (it is estimated that switch to CNG can save 30% on fuel compared to gasoline), it did not meet its target and only 5,000 cars are currently running on CNG.
Nestlé’s Sagamu Factory Nestlé’s Sagamu plant installed G.E. Jenbacher gas engines to produce electricity on its production site. Gas is transported with CNG trucks. Volumes of gas and supplier are unknown.
PowerGas Africa PowerGas has 3 CNG facilities with a total production of 25 mmscf per day supplying industries with gas for power. Customers are mainly from the agri-food industry.
Compressing facilities are located in Lagos, Ibadan and Port Harcourt.
Mini-LNG
Rumuji mini-LNG This project is undertaken by Greenville and currently operational, with a capacity of processing of 2,250 tons/day (i.e. 100 mmscf/day). The project is located near the OUR pipeline from Total, ensuring easy access to gas supply. The plant is also expected to produce 150 MW of power.
58 | TECHNICAL REPORTS – No.34 – SEPTEMBER 2017
Appendix
The plant was supposed to supply a dual fuel power project in Kaduna, but delays incurred by the project and contractual issues stalled the situation on that side.
Compression station & pipeline Some projects aiming at compressing and transporting gas by pipeline were encouraged by the use of the Clean Development Mechanism.
Energia’s Edendo/Obodeti Marginal Fields A 30 mmscf gas processing plant was installed by Energia to handle the gas associated with its oil (production expected of 15 000 barrels per day in 2015).
Asuokpu/Umutu Marginal Field The project consists in the construction of a compression facility and pipeline linking the gas to ENI’s network with possibility of use in the Kwale Okpai power station.
The project has a treatment capacity of 37.5 mmscf of gas per day with annual average estimated reductions of CO2 emissions of 256 000 tonnes per year and also has the capacity to extract LPG.
Pan Ocean Pan Ocean acquired carbon credits for a 135 mmscfd project aiming at compressing gas for pipeline transportation.
Industrial projects
Indorama fertilizer and methanol plant The US$1.2bn Indorama Eleme project, located in Port Harcourt, was finished in 2016 and produces 1.4 million tonnes of urea for exports and the domestic market. The project benefited from funding from the IFC and other development finance institutions. Power is supplied to the facilities by a built-in gas fired power plant. The Eleme plant is expected to boost Nigerian exports.
Brass fertilizer and methanol plant The facility is to offtake 300mmscf/day from Shell to produce around 1.66 million tonnes of methanol and 1.3 million tonnes of urea per year. A US$6 bn offtake contract was struck with BP UK while the fertilizer would be commercialized domestically. Investment would be on the size. Phase 1 should cost around US$3.5 bn and generate a turnover of US$1.5 per year and come online in 2020.
59 | TECHNICAL REPORTS – No.34 – SEPTEMBER 2017

SUNREF NIGERIA MECHANISM 10.
60 | TECHNICAL REPORTS – No.34 – SEPTEMBER 2017
Prior publications in the collection
Notes techniques n°1 Panorama des inégalités hommes – femmes dans le monde (Juin 2015)
Notes techniques n°2 La Commission du Mékong face à un tournant –
Quelle place pour l’aide française (Septembre 2015)
Notes techniques n°3 Quelle efficacité environnementale de la certification pêche et aquaculture « durable » ? (Septembre 2015)
Notes techniques n°4 Vérité des prix ou socialisation de la couverture des coûts ? (Octobre 2015)
Notes techniques n°5 Accompagnement technique et renforcement des capacités : leçons de l'expérience (Octobre 2015)
Technical Reports No 6 Actors and networks of agroecology in the Greater Mekong Subregion (October 2015)
Technical Reports No.7 Creating Alliances to Accelerate Commercially Viable Sanitation (November 2015)
Notes techniques n°8 La recherche française sur l’éducation dans les pays en développement : un état des lieux (Novembre 2015)
Technical Reports No.9 Facilitating green skills and jobs in developing countries
Notes techniques n°10 Étude sur le développement de l’entreprenariat social à Madagascar
Notes techniques n°11 Ecole et Santé de la reproduction Une recherche-action dans les départements du Littoral et de l’Atlantique au Bénin (nov. 2014 – juil. 2015)
61 | TECHNICAL REPORTS – No.34 – SEPTEMBER 2017

Prior publications in the collection
Notes techniques n°12 Observation spatiale pour l’agriculture en Afrique : potentiels et défis
Notes techniques n°13 Améliorer la prise en compte de la nutrition dans les projets de développement rural et de santé
Notes techniques n°14 Villes et stratégies climatiques : cinq cas d’études
Notes techniques n°15 Jeunesses sahéliennes : dynamiques d’exclusion, moyen d’insertion
Technical Reports No.16 Supporting Access to and Retention in Employment for Women by Enhancing Child Care Services in Turkey
Notes techniques n°17 Méthode de suivi de l’impact climat des investissements (MRV) appliquée aux projets agricoles et forestiers des Banques Nationales de Développement
Notes techniques n°18 Gestion des ressources en eau souterraines comme biens communs
Notes techniques n°19 Eau des villes, assainissement et précarités – des réalités contrastées à Ouagadougou (Burkina Faso) et Niamey (Niger)
Technical Reports No.20 The effectiveness of an environmental credit line in Egypt: Synergies between market incentive and binding regulations
Notes techniques n°21 Développement rural à co-bénéfices - Gouvernance, suivi, certification
Notes techniques n°22 Dynamiques des systèmes agraires et devenirs de l’agriculture familiale en guinée
Notes techniques n°23 Évaluation de la politique d’aménagement du territoire en Tunisie de 1995 à 2010
62 | TECHNICAL REPORTS – No.34 – SEPTEMBER 2017
Prior publications in the collection
Notes techniques n°24 Cocoa farmers’ agricultural practices and livelihoods in Côte d’Ivoire
Notes techniques n°25 Vulnérabilité sociophysique aux inondations au Sénégal
Technical reports No.25 Socio-physical Vulnerability to Flooding in Senegal
Notes techniques n°26 Revenus et trajectoires agricoles en Afrique d’ici 2050 : vers un trop-plein d’agriculteurs ?
Notes techniques n°27 Comprendre le processus d’installation des jeunes en agriculture pour mieux l’accompagner - Grille d’analyse et premiers résultats
Notes techniques n°28 Les dynamiques d’inclusion / exclusion de la jeunesse en zone MED
Notes techniques n°29 Quelle compétitivité de la Côte d’Ivoire, du Sénégal et de la Tunisie ? - Un état des lieux à partir des nouvelles données de l’Observatoire de la Compétitivité Durable
Notes techniques n°30 Urgences et crises sanitaires dans les pays à ressources limitées : de la préparation à la réponse
Notes techniques n°31 Capitalisation des actions de formation-insertion des jeunes conduites par les organisations non gouvernementales
Notes techniques n°32 L’accès et le maintien des femmes à l’emploi de qualité au Maroc, en Tunisie et en Turquie
Notes techniques n°33 Le financement participatif et l’aide publique au développement : état des lieux et recommandations
63 | TECHNICAL REPORTS – No.34 – SEPTEMBER 2017

What is AFD
What is AFD
Agence Française de Développement (AFD), a public financial institution that implements the policy defined by the French Government, works to combat poverty and promote sustainable development.
AFD operates on four continents via a network of 75 offices, and finances and support projects that improve living conditions for populations, boost economic growth and protect the planet
In 2016, AFD earmarked EUR 9.4 bn to finance projects in developing countries and for overseas France.
Agence Française de Développement 5 rue Roland Barthes – 75598 Paris cedex 12
Tél : +33 1 53 44 48 86 – www.afd.fr
Conception et réalisation : Elsa MURAT, AFD
64 | TECHNICAL REPORTS – No.34 – SEPTEMBER 2017