Outlook for the New Zealand economy and tourism …...New Zealand economy and tourism sector...
22
Classification: PROTECTED Outlook for the New Zealand economy and tourism sector Dominick Stephens June 2019
Transcript of Outlook for the New Zealand economy and tourism …...New Zealand economy and tourism sector...

Classification: PROTECTED
Outlook for the New Zealand economy and tourism sector
Dominick Stephens
June 2019

Classification: PROTECTED 2
Visitor arrivals growth
-10
-5
0
5
10
15
20
25
-10
-5
0
5
10
15
20
25
2000 2002 2004 2006 2008 2010 2012 2014 2016 2018
Annual % Annual %
Source: Stats NZ
Classification: PROTECTED
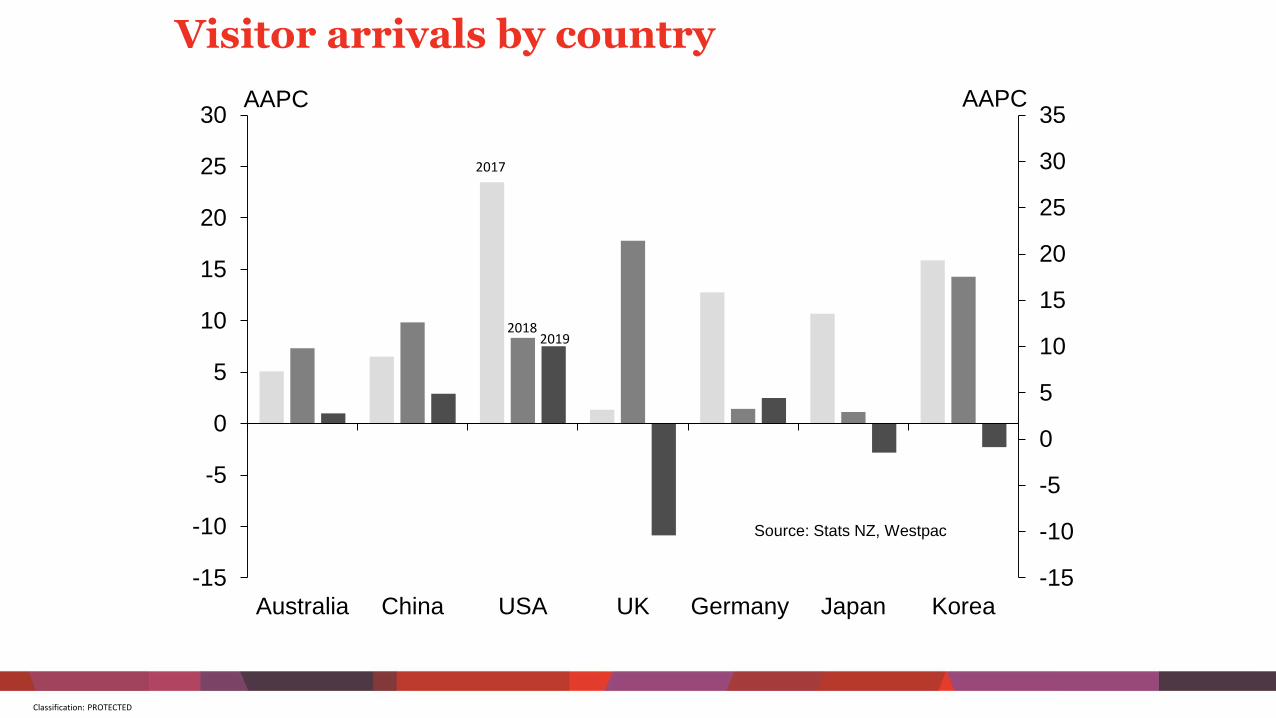
Visitor arrivals by country
Source: Stats NZ, Westpac
-15
-10
-5
0
5
10
15
20
25
30
35
-15
-10
-5
0
5
10
15
20
25
30
Australia China USA UK Germany Japan Korea
AAPC AAPC
2017
20182019
Classification: PROTECTED
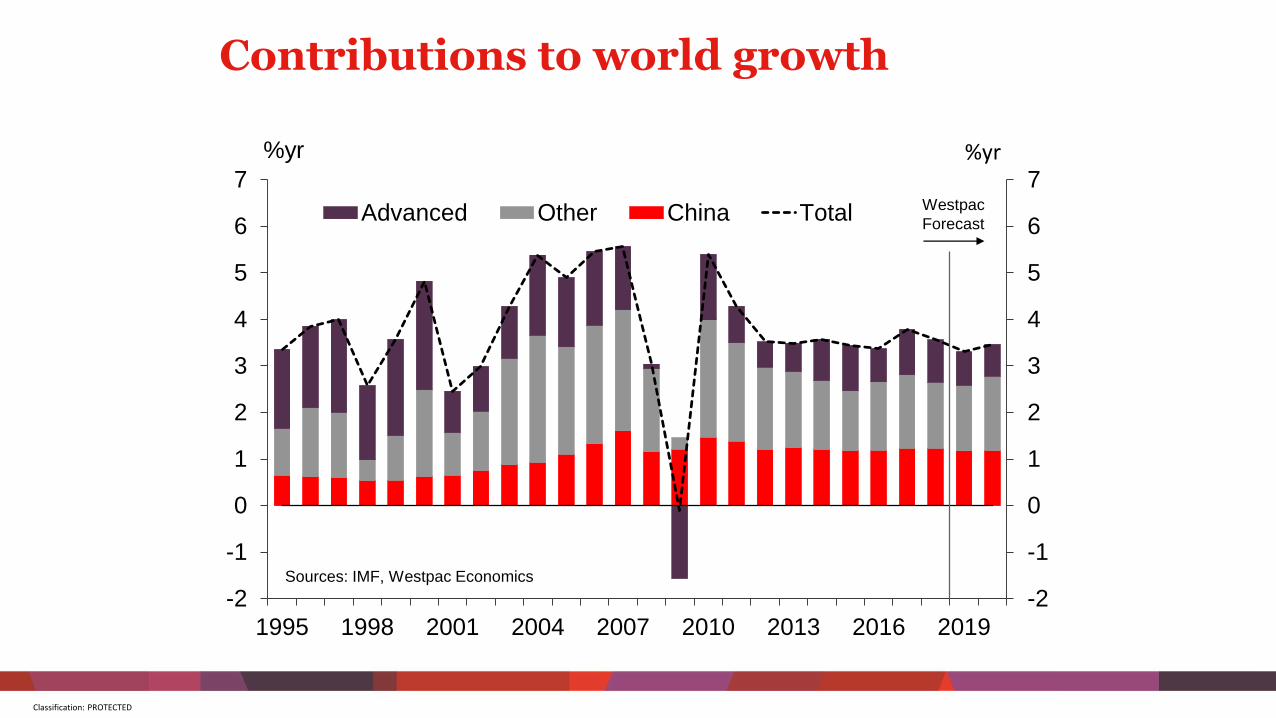
Contributions to world growth
-2
-1
0
1
2
3
4
5
6
7
-2
-1
0
1
2
3
4
5
6
7
1995 1998 2001 2004 2007 2010 2013 2016 2019
Advanced Other China Total
Sources: IMF, Westpac Economics
%yr
Westpac
Forecast
%yr

Classification: PROTECTED 5
US 10yr bond and share prices
1600
1800
2000
2200
2400
2600
2800
3000
Jan-16 Jan-17 Jan-18 Jan-19
1.0
1.5
2.0
2.5
3.0
3.5
4.0index%
US 10yr govt bond yield (left axis)
S&P 500 index (right axis)
Source: Bloomberg

Classification: PROTECTED
Chinese GDP growth
0
2
4
6
8
10
12
14
16
0
2
4
6
8
10
12
14
16
2005 2007 2009 2011 2013 2015 2017 2019
Annual average % change Annual average % change
Source: Westpac, Bloomberg
Forecast

Classification: PROTECTED
Australian GDP growth
0
1
2
3
4
5
6
0
1
2
3
4
5
6
2005 2007 2009 2011 2013 2015 2017 2019
Annual % change Annual % change
Source: Westpac, Bloomberg
Forecast
Classification: PROTECTED
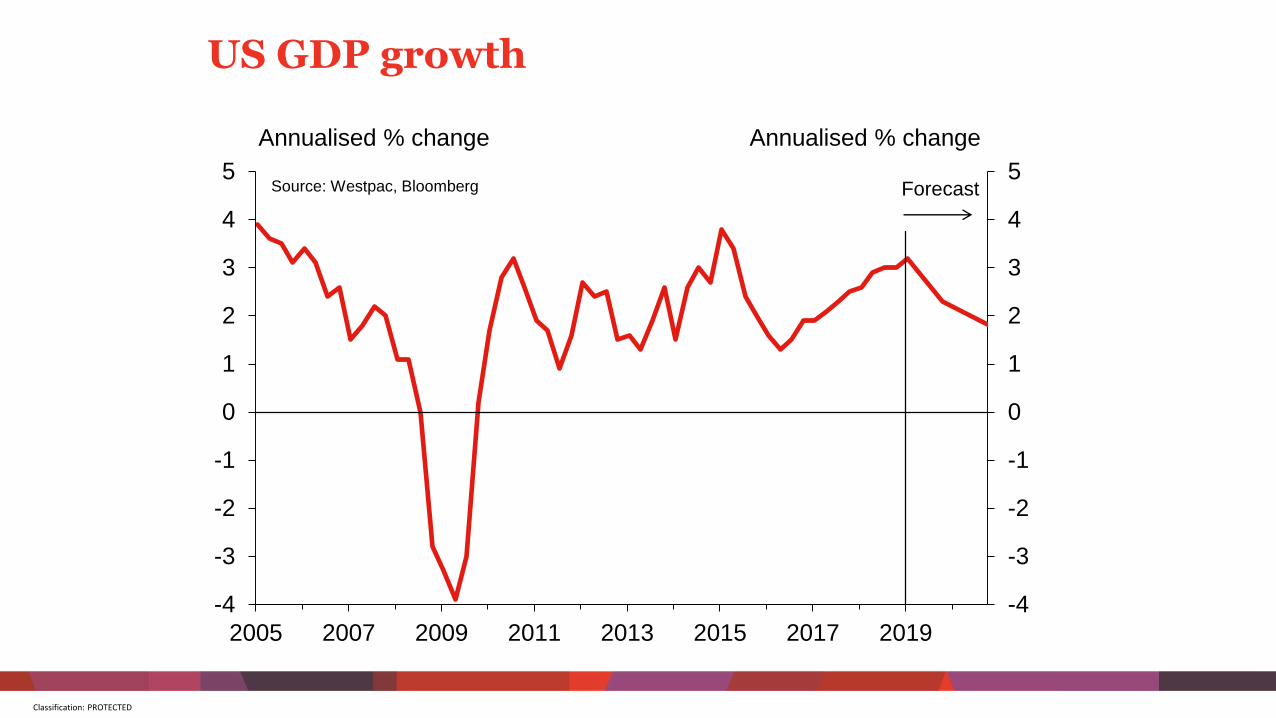
US GDP growth
-4
-3
-2
-1
0
1
2
3
4
5
-4
-3
-2
-1
0
1
2
3
4
5
2005 2007 2009 2011 2013 2015 2017 2019
Annualised % change Annualised % change
Source: Westpac, Bloomberg Forecast
Classification: PROTECTED
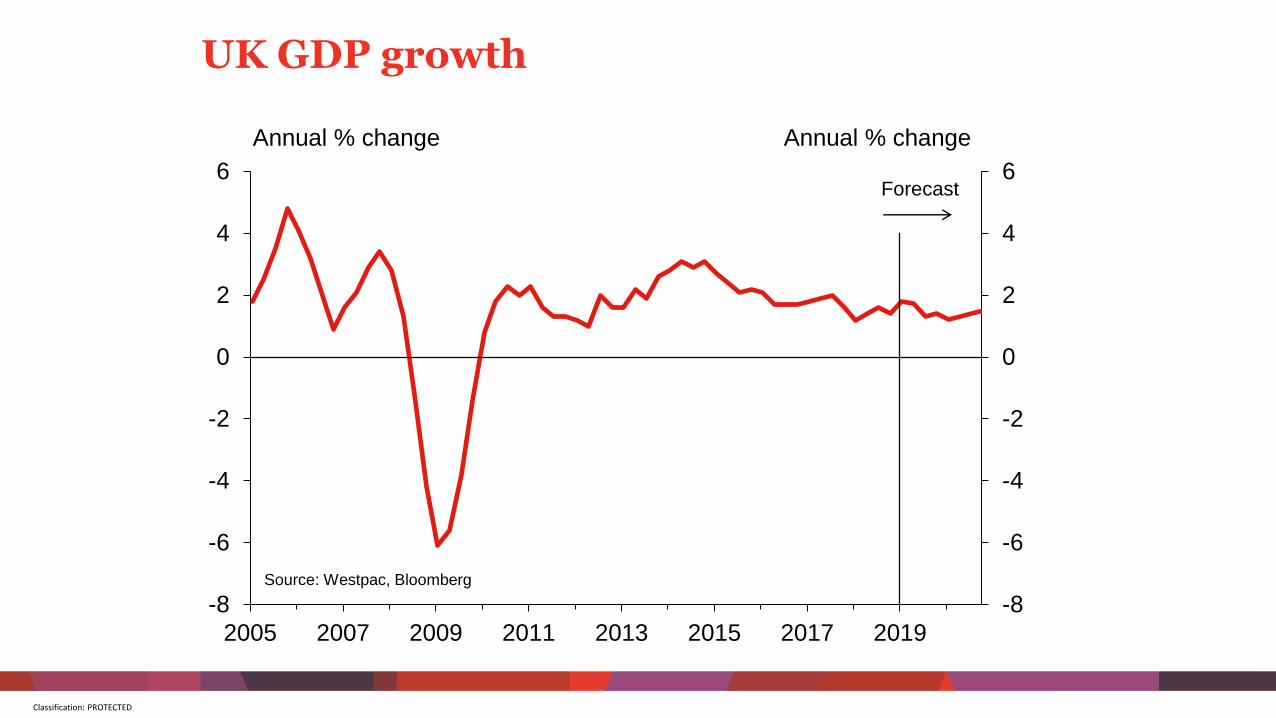
UK GDP growth
-8
-6
-4
-2
0
2
4
6
-8
-6
-4
-2
0
2
4
6
2005 2007 2009 2011 2013 2015 2017 2019
Annual % change Annual % change
Source: Westpac, Bloomberg
Forecast

Classification: PROTECTED
International guest nights by region
10
-12 -10 -8 -6 -4 -2 0 2 4 6
Canterbury
Southland
Auckland
Otago
Nelson, Marlborough, West Coast
Waikato
Taranaki, Manawatu, Wanganui
Gisborne/Hawke's Bay
Northland
Bay of Plenty
Wellington
AAPCSource: Stats NZ , Westpac

Classification: PROTECTED
Domestic guest nights by region
11
-2 0 2 4 6 8 10
Wellington
Taranaki, Manawatu, Wanganui
Waikato
Gisborne/Hawke's Bay
Otago
Northland
Bay of Plenty
Canterbury
Southland
Auckland
Nelson, Marlborough, West Coast
Source: Stats NZ , Westpac AAPC

Classification: PROTECTED
Guest nights – New Zealand
12
-10
-5
0
5
10
15
-10
-5
0
5
10
15
2010 2011 2012 2013 2014 2015 2016 2017 2018 2019
Domestic Guest Nights
International Guest Nights
ann avg % change ann avg % change
Source: Stats NZ, Westpac

Classification: PROTECTED 13
New Zealand quarterly GDP growth
0.0
0.2
0.4
0.6
0.8
1.0
1.2
1.4
0.0
0.2
0.4
0.6
0.8
1.0
1.2
1.4
2015 2016 2017 2018 2019 2020 2021
%
Source: Stats NZ, Westpac Westpac
forecast
%

Classification: PROTECTED 14
Consumer price inflation
0
1
2
3
4
5
6
0
1
2
3
4
5
6
2004 2006 2008 2010 2012 2014 2016 2018 2020 2022
Total
Ex-fuel
Source: Stats NZ, Westpac
Westpac
forecast
Annual % change Annual % change

Classification: PROTECTED 15
Official Cash Rate forecast
0.0
0.5
1.0
1.5
2.0
2.5
3.0
3.5
4.0
0.0
0.5
1.0
1.5
2.0
2.5
3.0
3.5
4.0
2010 2012 2014 2016 2018 2020 2022
%
Source: RBNZ, Westpac
Westpac
forecast
%
Classification: PROTECTED 16
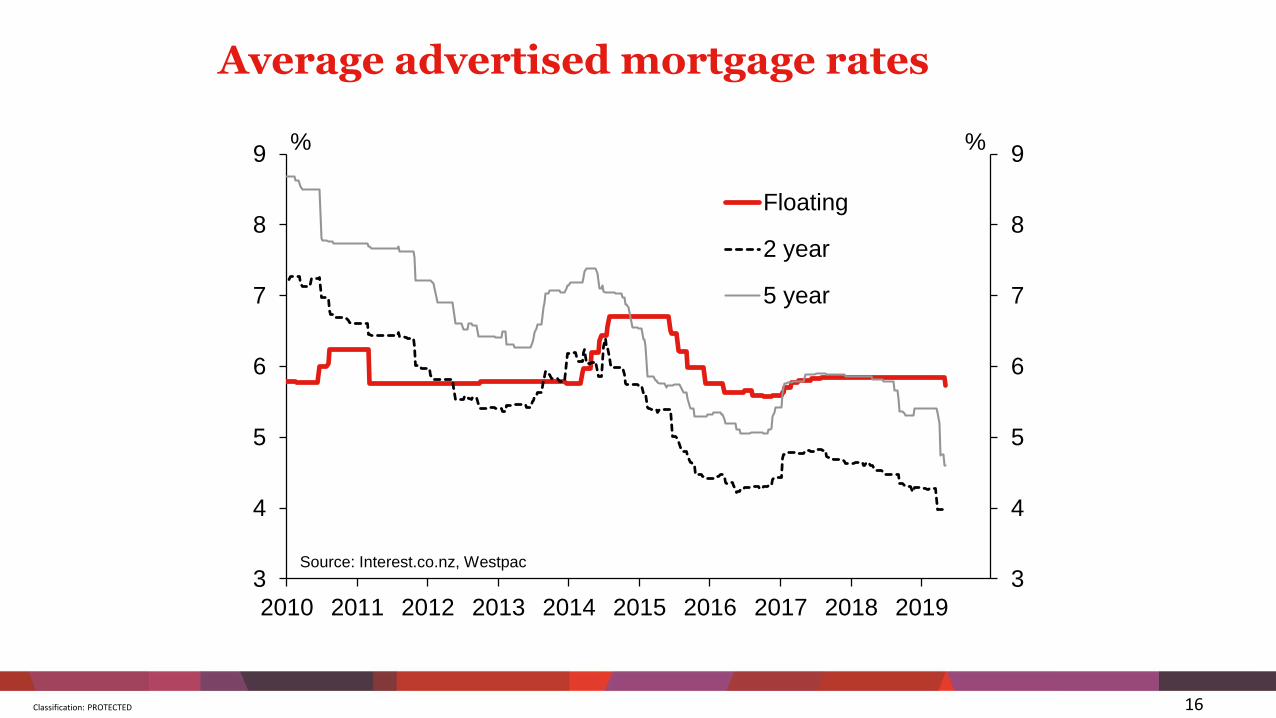
Average advertised mortgage rates
3
4
5
6
7
8
9
3
4
5
6
7
8
9
2010 2011 2012 2013 2014 2015 2016 2017 2018 2019
%%
Floating
2 year
5 year
Source: Interest.co.nz, Westpac
Classification: PROTECTED 17
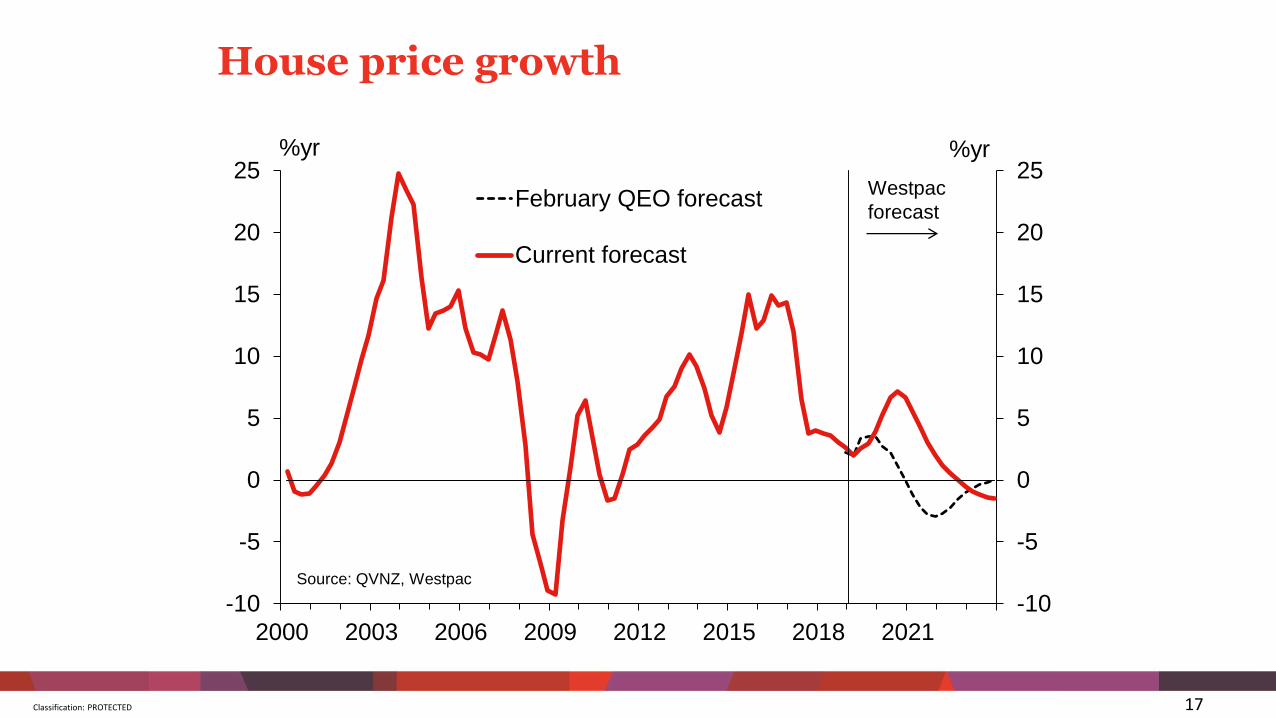
House price growth
-10
-5
0
5
10
15
20
25
-10
-5
0
5
10
15
20
25
2000 2003 2006 2009 2012 2015 2018 2021
February QEO forecast
Current forecast
%yr %yr
Source: QVNZ, Westpac
Westpac
forecast

Classification: PROTECTED 18
Government consumption spending
16
17
18
19
20
21
22
23
16
17
18
19
20
21
22
23
1987 1992 1997 2002 2007 2012 2017 2022
% of GDP % of GDP
Source: Stats NZ,
Westpac
National
1990-1999National
2008-2017
Westpac
forecasts
Labour
2017-
Labour
1999-2008
Labour
1984-1990

Classification: PROTECTED 19
Construction activity
0
5000
10000
15000
20000
25000
30000
35000
0
5000
10000
15000
20000
25000
30000
35000
2000 2003 2006 2009 2012 2015 2018 2021 2024
Excluding reconstruction spending
Canterbury reconstruction
Kaikoura reconstruction
$m $m
Source: Stats NZ, Westpac

Classification: PROTECTED 20
Farmgate Milk Price (incl. dividend)
$0
$2
$4
$6
$8
$10
$0
$2
$4
$6
$8
$10
2002/0
3
2003/0
4
2004/0
5
2005/0
6
2006/0
7
2007/0
8
2008/0
9
2009/1
0
2010/1
1
20
11
/12
2012/1
3
2013/1
4
2014/1
5
2015/1
6
2016/1
7
2017/1
8
2018/1
9
2019/2
0
KgMsKgMs
Milk price
Dividend
Source: Fonterra, Westpac Forecast

Classification: PROTECTED 21
Exchange rate forecasts
45
50
55
60
65
70
75
80
85
0.30
0.40
0.50
0.60
0.70
0.80
0.90
1.00
2002 2006 2010 2014 2018 2022
NZD/USD
NZD/AUD
TWI (right axis)Source: RBNZ,
Westpac
Westpac
forecast

Classification: PROTECTED 22
New Zealand quarterly GDP growth
0.0
0.2
0.4
0.6
0.8
1.0
1.2
1.4
0.0
0.2
0.4
0.6
0.8
1.0
1.2
1.4
2015 2016 2017 2018 2019 2020 2021
%
Source: Stats NZ, Westpac Westpac
forecast
%