Outline of the telecommunications business in Japan
36
August August August August 200 200 200 2002 TELECOMMUNICATIONS BUREAU, MINISTRY OF PUBLIC MANAGEMENT, HOME AFFAIRS, POSTS AND TELECOMMUNICATIONS (MPHPT)
Transcript of Outline of the telecommunications business in Japan

AugustAugustAugustAugust 200 200 200 2002222
TELECOMMUNICATIONS BUREAU,MINISTRY OF PUBLIC MANAGEMENT,HOME AFFAIRS, POSTS ANDTELECOMMUNICATIONS (MPHPT)

i
Contents
I. Development of Japanese pro-competition policy ........................................................... 11. Outline......................................................................................................................... 12. Pro-competition policy in telecommunications business for
promoting IT revolution ............................................................................................... 23. Establishment of interconnection rules ....................................................................... 44. Outline of NTT Reorganization Scheme ..................................................................... 5
II. Current situation surrounding the telecommunications business..................................... 61. Changes in the total number of telecommunications carriers..................................... 62. Current Status of Main Foreign Investment in Telecommunications Carriers............. 73. Changes in market size / investment in facilities and equipment ............................... 94. Shares of NTT / KDD and NCC ................................................................................ 105. Current Status of Rate Reductions ........................................................................... 12
III. Internet ........................................................................................................................... 141. Total Internet user population and Internet diffusion rate.......................................... 142. International comparison of full-time Internet connection fees ................................. 163. Construction of fiber-optic networks ......................................................................... 174. Major support systems for fiber-optic networks and broadband access network ..... 19
IV. Mobile communications.................................................................................................. 201. Status of diffusion of mobile phones......................................................................... 202. Growth Factors in the Mobile Phone Market ............................................................ 21
V. Introduction of new wireless system .............................................................................. 221. The third-generation mobile communications system .............................................. 222. The fourth-generation mobile communications system ............................................ 233. Wireless access system............................................................................................ 25
VI. Diffusion of major radio stations ..................................................................................... 261. Transition in the Number of Cellular Phones ............................................................ 262. Transition in the Number of PHS Subscribers .......................................................... 263. Transition in the Number of Radio Pagers................................................................ 274. Transition in the Number of VAST Earth Stations..................................................... 27
References
Reference 1. Diffusion of cable television ............................................................................... 29Reference 2. Current Status of Broadcasting Business in Japan ........................................... 30


1
1985
.4(L
iber
aliz
atio
n of
the
tele
com
mun
icat
ions
bus
ines
s)
○ U
ser r
ates
refo
rm:
Abol
ition
of a
sys
tem
by
whi
ch th
e go
vern
men
t offi
cial
ly a
ppro
ves
the
tele
com
serv
ice
fees
(Nov
embe
r 199
8)
○ U
ser r
ates
refo
rm:
Abol
ition
of a
sys
tem
by
whi
ch th
e go
vern
men
t offi
cial
ly a
ppro
ves
the
tele
com
serv
ice
fees
(Nov
embe
r 199
8)19
99.7
○ U
ser r
ates
regu
latio
n fo
r NTT
Wes
t/Eas
t:In
trodu
ctio
n of
a p
rice-
cap
syst
em (O
ctob
er 2
000)
○ U
ser r
ates
regu
latio
n fo
r NTT
Wes
t/Eas
t:In
trodu
ctio
n of
a p
rice-
cap
syst
em (O
ctob
er 2
000)
○ F
orei
gn o
wne
rshi
p re
stric
tion:
Lifti
ng o
f the
rest
rictio
ns o
n fo
reig
n-ca
pita
l inv
estm
ent i
n th
e Ty
pe 1
car
riers
(Exc
ludi
ng in
vest
men
t in
NTT
and
KD
D) (
Febr
uary
199
8)
○ F
orei
gn o
wne
rshi
p re
stric
tion:
Lifti
ng o
f the
rest
rictio
ns o
n fo
reig
n-ca
pita
l inv
estm
ent i
n th
e Ty
pe 1
car
riers
(Exc
ludi
ng in
vest
men
t in
NTT
and
KD
D) (
Febr
uary
199
8)
○ E
ntry
into
the
mar
ket:
Abol
ition
of t
he re
gula
tion
on s
uppl
y an
d de
man
d (N
ovem
ber 1
997)
○ In
terc
onne
ctio
n:Es
tabl
ishm
ent o
f new
rule
on
inte
rcon
nect
ions
, inc
ludi
ng in
trodu
ctio
n of
gen
eral
oblig
atio
ns fo
r typ
e-I c
arrie
rs to
inte
rcon
nect
with
oth
er n
etw
orks
(Nov
embe
r19
97)
○In
terc
onne
ctio
n:In
trodu
ctio
n of
a lo
ng-ru
n in
crem
enta
l cos
t met
hodo
logy
.○
Inte
rcon
nect
ion:
Intro
duct
ion
of a
long
-run
incr
emen
tal c
ost m
etho
dolo
gy.
Reo
rgan
izat
ion
of N
TT
Priv
atiz
atio
n of
Nip
pon
Tele
grap
h an
dTe
leph
one
Publ
icC
orpo
ratio
n
○Te
leco
mm
unic
atio
ns C
ounc
il R
epor
t:
The
first
repo
rt on
des
irabl
e pr
o-co
mpe
titiv
e po
licie
s in
the
tele
com
mun
icat
ions
busi
ness
fiel
d fo
r pro
mot
ing
the
IT re
volu
tion
com
pile
d by
the
Tele
com
mun
icat
ions
Cou
ncil
(Dec
embe
r 200
0)
○Te
leco
mm
unic
atio
ns C
ounc
il R
epor
t:
The
first
repo
rt on
des
irabl
e pr
o-co
mpe
titiv
e po
licie
s in
the
tele
com
mun
icat
ions
busi
ness
fiel
d fo
r pro
mot
ing
the
IT re
volu
tion
com
pile
d by
the
Tele
com
mun
icat
ions
Cou
ncil
(Dec
embe
r 200
0)
Rev
iew
of t
he fr
amew
ork
ofpr
o-co
mpe
titio
n po
licy
Rev
iew
of t
he fr
amew
ork
ofpr
o-co
mpe
titio
n po
licy
○ D
iscu
ssio
ns o
n th
e en
viro
nmen
t for
fair
com
petit
ion
invo
lvin
g al
lse
ctor
s, in
clud
ing
cont
ents
and
app
licat
ions
.○
Dis
cuss
ions
on
the
envi
ronm
ent f
or fa
ir co
mpe
titio
n in
volv
ing
all
sect
ors,
incl
udin
g co
nten
ts a
nd a
pplic
atio
ns.
2001
.6
○Th
e Te
leco
mm
unic
atio
ns C
ounc
il’s s
econ
d re
com
men
datio
n tit
led
“Inte
rcon
nect
ion
rule
s in
the
age
of in
form
atio
n te
chno
logy
” (Ju
ly20
01)
○Th
e Te
leco
mm
unic
atio
ns C
ounc
il’s s
econ
d re
com
men
datio
n tit
led
“Inte
rcon
nect
ion
rule
s in
the
age
of in
form
atio
n te
chno
logy
” (Ju
ly20
01)
○Th
e fir
st re
com
men
datio
n fro
m th
e Te
leco
mm
unic
atio
ns C
ounc
ilon
the
"Rev
iew
of i
nter
conn
ectio
n ru
les"
(Dec
embe
r 200
0)○
The
first
reco
mm
enda
tion
from
the
Tele
com
mun
icat
ions
Cou
ncil
on th
e "R
evie
w o
f int
erco
nnec
tion
rule
s" (D
ecem
ber 2
000)
Rev
isio
n of
the
Tele
com
mun
icat
ions
Bus
ines
s La
w a
ndot
her L
egis
latio
n
I. Development of Japanese pro-competition policy
1. Outline

2
2. Pro-competition policy in the telecommunications carriers business forpromoting the IT revolution○ On the basis of the first recommendation compiled by the Telecommunications Council
concerning the pro-competition policy in the telecommuncations industry to promotethe IT revolution (published on Dec. 21, 2000), the three-year deregulation planapproved by the Cabinet on March 31, 2001, and others, the government submittedrevision bills of the Telecommunications Business Law and other related laws to the151 Regular Diet session. The bills were legislated on June 15, 2001 and most of themwere put into force on Nov. 30 of the same year.

3
Esta
blis
hmen
t of r
ules
for f
air c
ompe
titio
nFu
rther
der
egul
atio
nPr
omot
ion
of e
stab
lishm
ent o
f an
IT in
frast
ruct
ure
Esta
blis
hmen
t of a
sym
met
ric re
gula
tions
Esta
blis
hmen
t of a
sys
tem
con
cern
ing
univ
ersa
l tel
epho
ny s
ervi
ce
Esta
blis
hmen
t of a
com
mitt
ee to
set
tle
disp
utes
invo
lvin
g th
e te
leco
mm
unic
atio
ns
carri
ers
busi
ness
Dra
stic
der
egul
atio
n fo
r the
car
riers
who
are
not
dom
inan
t in
the
mar
ket
Expa
nsio
n of
the
busi
ness
of N
TT E
ast a
nd W
est
Rel
axat
ion
of N
TT s
hare
s re
stric
tions
Smoo
th im
plem
enta
tion
of c
able
layi
ng, e
tc.
Intro
duct
ion
of th
e w
hole
sale
te
leco
mm
unic
atio
ns s
ervi
ces
syst
em
To p
rom
ote
the
IT re
volu
tion,
effo
rts s
houl
d be
mad
e to
enc
oura
ge fa
ir co
mpe
titio
n an
d to
max
imiz
e th
e pr
ofit
of u
sers
(Obj
ectiv
e)Es
tabl
ishm
ent o
f a s
yste
m to
set
tle p
rom
ptly
and
effe
ctiv
ely
disp
utes
invo
lvin
g in
terc
onne
ctio
ns a
nd o
ther
pro
blem
s be
twee
nte
leco
mm
unic
atio
ns c
arrie
rs(O
utlin
e)i)
Esta
blis
hmen
t of a
dis
pute
-set
tlem
ent c
omm
ittee
(an
orga
niza
tion
to b
e se
t up
in a
ccor
danc
e w
ith A
rticl
e 8)
, whi
ch is
orga
niza
tiona
lly in
depe
nden
t of t
he d
ivis
ion
in c
harg
e of
gra
ntin
gof
ficia
l app
rova
ls a
nd p
erm
issi
ons.
ii)In
trodu
ctio
n of
sim
pler
and
spe
edie
r dis
pute
-set
tlem
ent
proc
edur
es (m
edia
tion,
arb
itrat
ion)
iii)Es
tabl
ishm
ent o
f a s
yste
m in
whi
ch p
erso
nnel
cha
nges
of t
heco
mm
ittee
are
mad
e af
ter a
ppro
val b
y th
e D
iet,
and
anot
her
syst
em in
whi
ch n
ew m
embe
rs a
re re
com
men
ded
to th
e M
inis
ter
of P
ublic
Man
agem
ent,
Hom
e Af
fairs
, Pos
ts a
ndTe
leco
mm
unic
atio
ns.
(Obj
ectiv
e)Es
tabl
ishm
ent o
f a s
yste
m in
whi
ch a
ll ca
rrier
s be
nefit
ing
from
the
univ
ersa
l tel
epho
ny s
ervi
ce b
ear a
n ap
prop
riate
am
ount
of t
heco
sts
(ext
erna
l ass
ista
nce)
.(O
utlin
e)Es
tabl
ishm
ent o
f a s
yste
m in
whi
ch q
ualif
ied
tele
com
mun
icat
ions
carri
ers
rece
ive
subs
idie
s to
cov
er p
art o
f the
cos
t of p
rovi
ding
univ
ersa
l tel
epho
ny s
ervi
ce, t
hrou
gh a
des
igna
ted,
neu
tral a
nd fa
irco
rpor
atio
n.
(Obj
ectiv
e)Im
plem
enta
tion
of d
ram
atic
der
egul
atio
n of
exi
stin
g re
stric
tions
toth
e ex
tent
whe
re it
doe
s no
t dam
age
the
inte
rest
of u
sers
(Out
line)
To a
bolis
h al
l offi
cial
app
rova
l sys
tem
s in
volv
ing
gene
ral
cont
ract
ual c
ondi
tions
, int
erco
nnec
tion
agre
emen
ts, a
nd jo
int-u
seag
reem
ents
of n
on-d
omin
ant c
arrie
rs, a
nd to
intro
duce
ano
tific
atio
n sy
stem
in th
e sa
me
man
ner a
s th
e ta
riff s
yste
m.
(Obj
ectiv
e)To
enh
ance
free
man
agem
ent o
f bus
ines
s op
erat
ions
by
NTT
East
and
Wes
t, a
new
sys
tem
will
be e
stab
lishe
d in
whi
ch th
e tw
oco
mpa
nies
are
allo
wed
to e
nter
new
sec
tors
, suc
h as
Inte
rnet
-re
late
d se
rvic
es.
(Out
line)
To e
nabl
e N
TT E
ast a
nd W
est t
o la
unch
new
tele
com
mun
icat
ions
busi
ness
es b
usin
g its
faci
litie
s, te
chno
logy
or p
erso
nnel
afte
rob
tain
ing
the
appr
oval
of t
he M
inis
ter o
f Pub
lic M
anag
emen
t,H
ome
Affa
irs, P
osts
and
Tel
ecom
mun
icat
ions
. The
two
firm
s w
illbe
allo
wed
to d
o so
as
long
as
the
new
bus
ines
s do
es n
otob
stru
ct th
e sm
ooth
ope
ratio
n of
thei
r mai
nsta
y bu
sine
sses
, and
does
not
ham
per f
air c
ompe
titio
n in
the
tele
com
mun
icat
ions
mar
ket.
(Obj
ectiv
e)To
sup
port
the
expa
nsio
n of
NTT
-Gro
up b
usin
esse
s gl
obal
ly(O
utlin
e)i)
Rel
axat
ion
of re
stric
tions
on
fore
ign
inve
stm
ent i
n th
e ho
ldin
gco
mpa
ny (f
rom
less
than
20
perc
ent t
o on
e th
ird o
f the
tota
l cap
ital)
ii)Es
tabl
ishm
ent o
f exc
eptio
nal m
easu
res
for t
he is
suan
ce o
f new
shar
es b
y th
e ho
ldin
g co
mpa
nyiii)
Abol
ition
of a
sys
tem
requ
iring
the
NTT
Gro
up to
obt
ain
offic
ial
appr
oval
whe
n its
hol
ding
com
pany
sel
ls s
hare
s in
NTT
Com
mun
icat
ions
Cor
p.
(Obj
ectiv
e)To
impr
ove
the
flexi
bilit
y of
con
stru
ctin
g ne
twor
ks b
yte
leco
mm
unic
atio
ns c
arrie
rs(O
utlin
e)To
mak
e it
clea
r tha
t pro
cedu
res
for r
esol
ving
dis
pute
s ov
er th
eus
e of
ele
ctric
pol
es, c
ondu
its, e
tc.,
stip
ulat
ed in
the
Tele
com
mun
icat
ions
Bus
ines
s La
w, w
ill in
volv
e of
ficia
lly-o
wne
dla
nd. T
o es
tabl
ish
proc
edur
es fo
r med
iatio
n be
twee
n a
tele
com
mun
icat
ions
car
rier a
nd p
erso
n or
offi
ce in
cha
rge
ofm
anag
ing
road
s.
(Obj
ectiv
e)To
pro
mot
e ef
fect
ive
use
of fi
ber-o
ptic
net
wor
ks b
y lo
cal
gove
rnm
ents
, pub
lic u
tiliti
es, e
tc. a
nd to
enh
ance
the
flexi
bilit
y of
netw
ork
cons
truct
ion
by te
leco
mm
unic
atio
ns c
arrie
rs(O
utlin
e)i)
To in
trodu
ce a
sys
tem
whi
ch e
nabl
es p
rovi
sion
of f
lexi
ble
who
lesa
le te
leco
mm
unic
atio
ns s
ervi
ces
base
d on
indi
vidu
alco
ntra
cts
betw
een
tele
com
mun
icat
ions
car
riers
(wha
t is
calle
dth
e “c
arrie
r’s c
arrie
r con
tract
“).ii)
To a
bolis
h th
e tra
ditio
nally
pro
vide
d se
rvic
es n
ot in
clud
ed in
the
gene
ral c
ontra
ctua
l agr
eem
ent (
subj
ect t
o th
e of
ficia
l app
rova
lsy
stem
), an
d to
intro
duce
a n
otifi
catio
n sy
stem
in w
hich
all
who
lesa
le s
ervi
ces
will
be re
porte
d to
the
auth
oriti
es.
(Obj
ectiv
e)To
cre
ate
a ty
pica
l pat
tern
of t
elec
omm
unic
atio
ns c
arrie
rs th
atdo
min
ate
the
mar
ket (
both
in th
e re
gion
al fi
xed
tele
phon
y se
rvic
ese
ctor
and
the
mob
ile c
omm
unic
atio
ns s
ecto
r), a
nd to
ens
ure
prop
er o
pera
tion
of th
eir b
usin
ess.
(Out
line)
i)To
cre
ate
typi
cal p
atte
rns
of a
nti-c
ompe
titio
n ac
ts w
hich
sho
uld
be fo
rbid
den,
and
to fo
rmul
ate
mea
sure
s to
pro
mpt
ly e
limin
ate
such
act
s.ii)
Mea
sure
s to
enh
ance
tran
spar
ency
and
fairn
ess
ofin
terc
onne
ctio
ns (M
easu
res
to m
ake
it co
mpu
lsor
y fo
r car
riers
tofo
rmul
ate
and
publ
ish
thei
r gen
eral
con
tract
ual a
gree
men
ts).
Oth
ers
Obj
ectiv
e of
the
revi
sion
Esta
blis
hmen
t of r
egul
atio
ns c
once
rnin
g re
view
s
(Out
line)
“Pro
mot
ion
of fa
ir co
mpe
titio
n” s
houl
d be
cle
arly
stip
ulat
ed in
the
purp
ose
of th
e Te
leco
mm
unic
atio
ns B
usin
ess
Law
(Out
line)
Esta
blis
hmen
t of r
egul
atio
ns c
once
rnin
g a
com
preh
ensi
ve re
view
of s
yste
ms
invo
lvin
g th
e te
leco
mm
unic
atio
ns b
usin
ess,
in th
esu
pple
men
tary
pro
visi
ons
of th
e re
vise
d la
w.
Outline of partial revisions of the Telecommunications Law and related laws

4
3. Establishment of interconnection rules
○November 1997: A law to revise part of the Telecommunications Business Law wasenforced《Formulation of basic rules on interconnection》
○September 2000: Establishment of rules concerning unbundling of subscriber lines○October 2000: Establishment of rules concerning collocation○December 2000: The first recommendation from the Telecommunications Council on
the “review of interconnection rules.”○April 2001: Establishment of rules concerning unbundling of fiber optic
networks.○July 2001: The second recommendation from the Telecommunications Council
concerning “interconnection rules in the age of informationtechnology.”
(1) Unbundling of subscriber lines and fiber-optic networksThis means that telecommunications carriers divide network components and lease themto Internet connection providers
Typical examples
- Subscriber lines (not overlapped by telephone lines) 2,062 yen- Subscriber lines (overlapped by telephone lines) 187 yen- Subscriber fiber-optic lines 5,231 yen- Relay carriers’ fiber-optic networks 4.29 yen / meter + 157 yen
(2) CollocationThis means that Internet connection providers install the equipment necessary forconnection, in the facilities of NTT East, NTT West, etc.
Procedures for collocation(within one month) (within six months) (within three months)
Applicationfor prior
examination
Results ofprior
examinationApplication Start of
construction Completion
(within one month)
(3) Efforts made in response to the recommendation on “interconnection rules in theage of information technology”・Ministry ordinance
Further unbundling of fiber-optic networks and non-discriminatory treatment of domesticand foreign carriers in taking procedures for the use of fiber-optic networks (inquiry to asubcommittee on Sept. 21, 2001).・Future efforts
Resale of public networks, further unbundling of subscriber lines, etc.

5
4. Outline of NTT Reorganization Scheme
References
1. special corporation, private company
2. The holding company holds all shares of NTT East Corp. and NTT West Corp.
Holding Company(Nippon Telegraph and
Telephone Corp.)
- Using its right as a shareholder to ensure thatregional communications services are providedby the regional communications companies ona stable basis
- Promoting fundamental research anddevelopment on telecommunications
NTT West Corp.(Nippon Telegraph andTelephone West Corp.)
NTT East Corp.(Nippon Telegraph andTelephone East Corp.)
NTTCommunications
Corp.
- Providing regional communications service inWestern Japan (Tokai, Hokuriku, Kansai, Chugoku,Shikoku, Kyushu and Okinawa)
- Being obliged to provide universal service oftelephony in Western Japan
- Providing regional communicationsservice in Eastern Japan (Hokkaido,Tohoku, Kanto, Tokyo and Shin'etsu)
- Being obliged to provide universalservice of telephony in Eastern Japan

6
1985
1986
1987
1988
1989
1990
1991
1992
1993
1994
1995
1996
1997
1998
1999
2000
Apr.
120
01Ap
r. 1
2002
Jun.
120
02Se
pt. 1
2002
27
1337
4562
6870
8086
111
126
138
153
178
249
342
384
387
392
11
11
11
11
11
11
11
13
33
33
11
11
11
11
11
11
11
11
--
--
--
--
--
--
19
99
99
99
99
99
-5
1135
4360
6668
7775
100
115
127
142
167
236
330
372
375
380
-3
35
55
55
55
55
56
1221
3235
3433
--
34
47
77
810
1116
2847
7715
927
431
932
332
9
-2
22
22
23
32
24
45
65
55
55
--
223
3146
5253
6158
8290
9084
7251
1913
1313
Cel
lula
r Pho
nes
--
-2
48
89
1515
1721
2121
2121
85
55
Rad
io P
agin
g-
-2
2026
3336
3636
3131
3131
3131
193
22
2
PHS
--
--
--
--
--
2328
2828
189
52
22
Con
veni
ence
Rad
ioPh
one
(CR
P)-
--
--
24
47
77
66
--
--
--
-
Ship
Tel
epho
ne-
--
11
23
32
21
--
--
--
--
-
Airp
ort R
adio
Tel
epho
ne-
--
--
--
--
22
22
22
23
33
3
Dat
a co
mm
unic
atio
ns-
--
--
11
11
11
22
2-
--
--
-
Rad
io a
cces
s sy
stem
--
--
--
--
--
--
--
--
-1
11
--
11
1-
--
--
--
--
--
--
--
8520
935
653
069
384
194
31,
036
1,17
91,
589
2,10
73,
134
4,58
85,
871
6,60
27,
651
9,00
610
,137
10,1
9210
,376
09
1018
2528
3136
3639
4450
7895
8810
111
311
211
211
3
8520
034
651
266
881
391
21,
000
1,14
31,
550
2,06
33,
084
4,51
05,
776
6,51
47,
550
8,89
310
,025
10,0
8010
,263
8721
636
956
773
790
31,
011
1,10
61,
259
1,67
52,
218
3,26
04,
726
6,02
46,
780
7,90
09,
348
10,5
2110
,576
10,7
68
NTT
DoC
oMo,
Inc.
and
its
grou
p co
mpa
nies
New
Typ
e I
Tele
com
munic
atio
ns
Car
riers
Reg
iona
l Car
riers
Typ
e I T
ele
com
munic
atio
ns
Car
riers
NTT
Spec
ial T
ype
IITe
leco
mm
unic
atio
ns C
arrie
rs
Gen
eral
Typ
e II
Tele
com
mun
icat
ions
Car
riers
Tota
lKDD Lo
ng-
dist
ance
/Inte
rnat
iona
lC
arrie
rs
Sate
llite
Car
riers
Mob
ile C
omm
unic
atio
ns
Oth
ers
Typ
e II Tel
ecom
munic
atio
ns C
arriers
Not
es:
1.Ty
pe I
carri
ers
offe
r ser
vice
s by
est
ablis
hing
thei
r ow
n te
leco
mm
unic
atio
ns c
ircui
t fac
ilitie
s.2.
Type
II c
arrie
rs o
ffer s
ervi
ces
by le
asin
g te
leco
mm
unic
atio
ns c
ircui
t fac
ilitie
s.3.
NTT
was
reor
gani
zed
into
two
regi
onal
Typ
e I c
arrie
rs (N
TT E
ast C
orp.
and
NTT
Wes
t Cor
p.) a
nd o
ne lo
ng-d
ista
nce/
inte
rnat
iona
l car
rier (
NTT
Com
mun
icat
ions
Cor
p.) u
nder
one
hol
ding
com
pany
(NTT
) on
July
1, 1
999.
4.O
n O
ctob
er 1
, 200
0, D
DI C
orp.
, KD
D C
orp.
and
IDO
Cor
p. w
ere
mer
ged
into
DD
I Cor
p. (K
DD
I)
II. Current situation surrounding thetelecommunications business
1. Changes in the total number of telecommunications carriers

7
2. Current Status of Main Foreign Investment in TelecommunicationsCarriers
(1) Type I telecommunications carriers (As of Sept. 1, 2002)
Carrier Foreigncapital ratio Major foreign investors
Cable & Wireless IDC Inc. 98.02% Cable & Wireless plc (C&W), etc.J-COM Kanto Co., Ltd. 59.00% Liberty Japan, Inc., Liberty Jupiter, Inc., Microsoft Holding Inc.J-COM Kansai Co., Ltd. 58.11% Liberty Japan, Inc., Liberty Jupiter, Inc., Microsoft Holding Inc.KVH Telecom Co., Ltd. 100.00% KVH Telecom Holding SCDRLPCCA Private Limited 100.00% Corporate Access Group LTD.PanAmSat InternationalSystems, Inc.
100.00% Hughes Electronics etc.
MCI WorldCom Japan, Ltd. 100.00% MCI WorldCom, Inc.Metromedia Fiber NetworkJapan K.K.
100.00% Metromedia Fiber Network Service, Inc.
Global One CommunicationsNetwork, Inc.
100.00% Global One Communications World Holding
Primus Japan K.K. 100.00% Primus Telecommunications Group, Inc.K.K. Telegloble Japan 100.00% Teleglobe Communications Corp.RSL COM Service Japan K.K. 100.00% RSL COM Asia Pacific Ltd.Singapore Telecom Japan,Co., Ltd.
100.00% Singapore Telecommunications Ltd.
Reach Networks Japan K.K. 100.00% Reach Networks Hong Kong LimitedReach Networks K.K. 100.00% Level 3 International Inc.EGN B.V. 100.00% Equant Finance B.V.T Systems Japan K.K. 100.00% Deutsche Telecom AGSony Corp. 44.56% Moxley & Co., State Street Bank and Trust Company, etc.FLAG Telecom Japan Limited 100.00% FLAG Telecom Ireland LimitedNew Century Global Net Corp. 100.00% NCG Holdings L.P.Genuity Japan K.K. 100.00% Genuity Inc.Asia Global Crossing JapanCorporation
100.00% Asia Global Crossing Limited
World Exchange 100.00% World Exchange CommunicationsCircle Asia Corporation 54.39% Grand River Group Limited, etc.J-COM Kitakyushu Co., Ltd. 44.78% Liberty Japan, Inc., Liberty Jupiter, Inc., Microsoft Holding Inc.J-COM Shonan Co., Ltd. 41.00% Liberty Japan, Inc., Liberty Jupiter, Inc., Microsoft Holding Inc.J-COM Sapporo Co., Ltd. 46.32% Liberty Japan, Inc., Liberty Jupiter, Inc., Microsoft Holding Inc.Kisarazu Cable TV 45.78% Liberty Japan, Inc., Liberty Jupiter, Inc., Microsoft Holding Inc.J-COM Gunma Co., Ltd. 59.00% Liberty Japan, Inc., Liberty Jupiter, Inc., Microsoft Holding Inc.GTE Far East (Services) Ltd. 100.00% Verizon Hawaii InternationalAT&T CommunicationsService Japan Ltd.
100.00% AT&T TransOceanic Communications L.L.C.
Williams Communications, Inc. 100.00% Williams Communications ParticipationsSprint International Japan Co.,Ltd.
100.00% Sprint International Holding Inc.
Tyco Networks Japan Co., Ltd. 100.00% TCN Holding LuxemburgC2C Japan Co., Ltd. 100.00% C2C Pte LimitedQwest CommunicationsJapan Co., Ltd.
100.00% Qwest Communications International
Japan Telecom Co., Ltd. 45.00% Vodafone International Holdings BVPower Band Co., Ltd. 64.20% J.H. WHITNEY IV LP, World View Technology Partners III LPJ-phone Co., Ltd. 69.72% Boderphone International Holdings B.V., etc.ORBCOMM Japan Limited 37.91% ORBCOMM Asia LimitedNote: This list includes companies with foreign capital ratio of more than a third.

8
(2) Special Type II telecommunications carriers (As of Sept. 1, 2002)
CarrierForeign
capital ratioMajor foreign investors
IBM Japan, Ltd. 100.00% IBM WTC (U.S.A)Information Service International-Dentsu, Ltd. 34.00% GE Information Service (U.S.A)Xpedite 100.00% Xpedite Systems Inc. (U.S.A)Compaq Computer K.K. 100.00% Digital Equipment Corp. (U.S.A)Cable & Wireless Japan Ltd. 85.80% Cable & Wireless plc. (U.K.)Concert Global Network Japan 100.00% Concert Global Networks (U.S.A) Inc.Deutsche Telecom K.K. 100.00% Deutsche Telekom AG (Germany)Reach Holdings Singapore Japan 100.00% Reach Ltd. (Hong Kong)Saiki-Tech Communications Japan Co., Ltd. 100.00% SAIKI TECH INVESTMENT HOUSE (ISRAEL) LTD.TMI Telemedia International Hong Kong Ltd. 100.00% TMI Telemedia International Hong Kong Ltd.(Hong Kong)IXnet Japan Co., Ltd. 100.00% Saturn Global Network Holding Ltd. (U.K.)UUNet Japan Co., Ltd. 100.00% UUNet Technologies Inc. (U.S.A)MCI International (Japan) Co., Ltd. 100.00% MCI International, Inc. (U.S.A)AT & T Communications Service Japan Ltd. 100.00% AT & T Corp. (U.S.A)MCI WorldCom Communications Japan Ltd. 100.00% MCI WorldCom, Inc. (U.S.A)Far East Data Ltd. 90.00% Far East Enterprises, Ltd. (U.S.A)DoCoMo AOL, Inc. 40.30% America Online, Inc. (U.S.A)PSINet Japan Inc. 100.00% PSINet Inc. (U.S.A)Coyote Network Systems, Inc. 100.00% Coyote Network, Systems, Inc. (U.S.A)Magde Web Japan Co., Ltd. 100.00% Tullett & Tokyo Forex Europe B.V.(the Netherlands)Equant Co., Ltd. 100.00% EGN B.V. (the Netherlands)Primus Telecommunications K.K. 100.00% Primus Telecommunications International, Inc. (U.S.A)City Telecom (Japan) Co., Ltd. 100.00% City Telecom (H.K.) Ltd. (Hong Kong)Telegroup Japan, Inc. 100.00% Telegroup, Inc. (U.S.A)RSL COM Japan, K.K. 100.00% RSL Communications Ltd. (U.S.A)Teleglobe Services Japan, Inc. 100.00% Teleglobe International Corp. (U.S.A)Pacific Gateway Exchange Japan Inc. 100.00% Pacific Gateway Exchange Inc. (U.S.A)GINGA Communications International, Inc. 100.00% Unitrendix Corp. (U.S.A)Singapore Telecom Japan Co., Ltd. 100.00% Singapore Telecommunications Ltd. (Singapre)Nippon WorldxChange Ltd. 100.00% WorldxChange Communications (U.S.A)Genuity International Inc. (Japan) 100.00% Genuity International Inc. (U.S.A)AIC Telecom (Japan) Ltd. 100.00% AIC (Asia Pacific) Ltd. (Hong Kong)i-Tel Corp. 100.00% Impact Telecommunications, Inc. (U.S.A)AT & T Global Network Services Japan LLC 85.00% AT & T Corp. (U.S.A)Verizon Global Solutions Holdings Limited 100.00% Verizon International Holdings Limited (Bermuda (U.K. territory))Cignal Telecommunications Japan K.K. 100.00% Cignal Global Communications Holding B.V. (the Netherlands)Korea Telecom Japan K.K. 100.00% Korea Telecom (South Korea)REUTERS Japan Ltd. 100.00% Reuters Group PLC (U.K.)Telecom New Zealand Japan K.K. 100.00% Telecom New Zealand International Ltd. (New Zealand)Wherever Japan K.K. 100.00% Wherever Technology Corp. (Taiwan)At Home Japan Ltd. 57.2% At Home Corp. (U.S.A)KPN Japan, Ltd. 100.00% Royal KPN N.V. (the Netherlands)Nittan Telecom (Japan) Ltd. 100.00% Nittan Telecom Ltd. (Hong Kong)Global Crossing Japan Corp. 100.00% Asia Global Crossing (U.S.A)M3Com (Japan) K.K. 100.00% Millenium 3 Communications, Inc. (U.S.A)AboveNet Japan KK 40.0% AboveNet Communications, Inc. (U.S.A)Savvis Japan Ltd. 100.00% Savvis Communications, Inc. (U.S.A)Bazillion Inc. 90.0% Bazillion Inc. (U.S.A)WAM!NET Holding Japan KK 100.00% WAMNET Inc. (U.S.A)Hewlett-Packard Japan, Ltd. 100.00% Hewlett-Packard Company (U.S.A)At Network Japan KK 100.00% Network Inc. (U.S.A)Streamscape 99.00% Streamscape Network Inc. (U.S.A)Enron Broadband Services Network 100.00% Enron Corporation (U.S.A)QoS Network Services Japan 100.00% QoS Network Services Ltd. (Ireland)Sprint International Holding, Inc. 100.00% Sprint International Holding, Inc. (U.S.A)Angstrom Network Japan 100.00% Angstrom Networks Ltd. (U.S.A)iBasis Japan Co., Ltd. 100.00% iBasis Global, Inc. (U.S.A)XA Aliance Co., Ltd. 100.00% OMM Holdings Limited (Cayman Islands (U. K. territory))Infoserve Technology Co., Ltd 100.00% Infoserve Tech Corp. (U.S.A)BELGACOM Japan Co., Ltd 100.00% BELGACOM S.A. (Bergen)PCCW Communications Japan Co., Ltd 100.00% PCCW Holdings Limited (Cayman Islands (U. K. territory))SK Cyberpass Co., Ltd. 100.00% SK Telink (Korea)Chinalink Networks Co., Ltd. 99.8% Chinalink Networks LimitedJapan run xun Communications Co., Ltd. 100.00% Chinamotion (Hong Kong)

9
3. Changes in market size / investment in facilities and equipment
(1) Changes in market size of type-1 carriers
① The market size (combined sales) of type 1 carriers in fiscal 2001 was 17,245.3 billionyen (up 9.8 percent from the previous year)
② Supported by the growth of the mobile communications business, the combined salessurged from the previous year.
100,289121,370
133,048 138,615155,783
169,826 172,453 171,236
0
50,000
100,000
150,000
200,000
95 96 97 98 99 00 01 02(Projection)
(100 million yen)
Fiscal year
(2) Equipment investment by type-1 carriers (Plans for fiscal 2002)
① The total amount of equipment investment projected for fiscal 2002 is 2,882.3 billion yen(down 3.8 percent from the previous year’s total)
② This represents the second-highest amount in equipment investment projected by allindustries (37,671.9 billion yen).
③ Equipment investment by type-1 carriers is the second largest, next to that of theelectrical power and gas industries.
3.2(▲12.5)
Mobilecommunications
business:1.5 (▲10.3)
2.9(▲15.4)
2.9(▲20.7) 2.5
(▲24.0)
1.5(▲8.2)
1.5(▲1.7)
1.4(▲20.4)
0.5(▲26.1) 0.3
(▲17.2)
0.0
0.5
1.0
1.5
2.0
2.5
3.0
3.5
Electrical power, Gas
Type I telecommunications business
Services
Electric machinery
Chemicals
Automobiles
Real estate
Iron and steel
Construction
(Unit: 1 trillion yen)※ The combined amount of equipment investment by all industries:
37,671.9 billion yen (down 9.1 percent)

10
4. Shares of NTT and NCC
(1) Sales of NTT-Group companies in each type of service (FY2001)
Note:1. “NTT”
Comm2. The fig
servic3. The fig
comm
Voice communications(5,431.3 billion yen)
Mobile communications(6,033.5 billion yen)
Data transmission(467.4 billion yen)
Leased line(1,145.9 billion yen)
NTT(83.8%)
NTT Docomo(60.5%)
N(5
N(7
NCC (16.2%)
NCC (39.5%)NCC (46.5%)
NCC (26.3%)
TT3.5%)
indicates the combined sales of NTT East, NTTunications.ures in the charts of voice communications, lea
es are those of the fixed telephone service proviure for mobile communication indicates the com
unications service providers.
TT3.7%)
West, and NTT
sed line, and data transmissionders.bined sales of all mobile
11
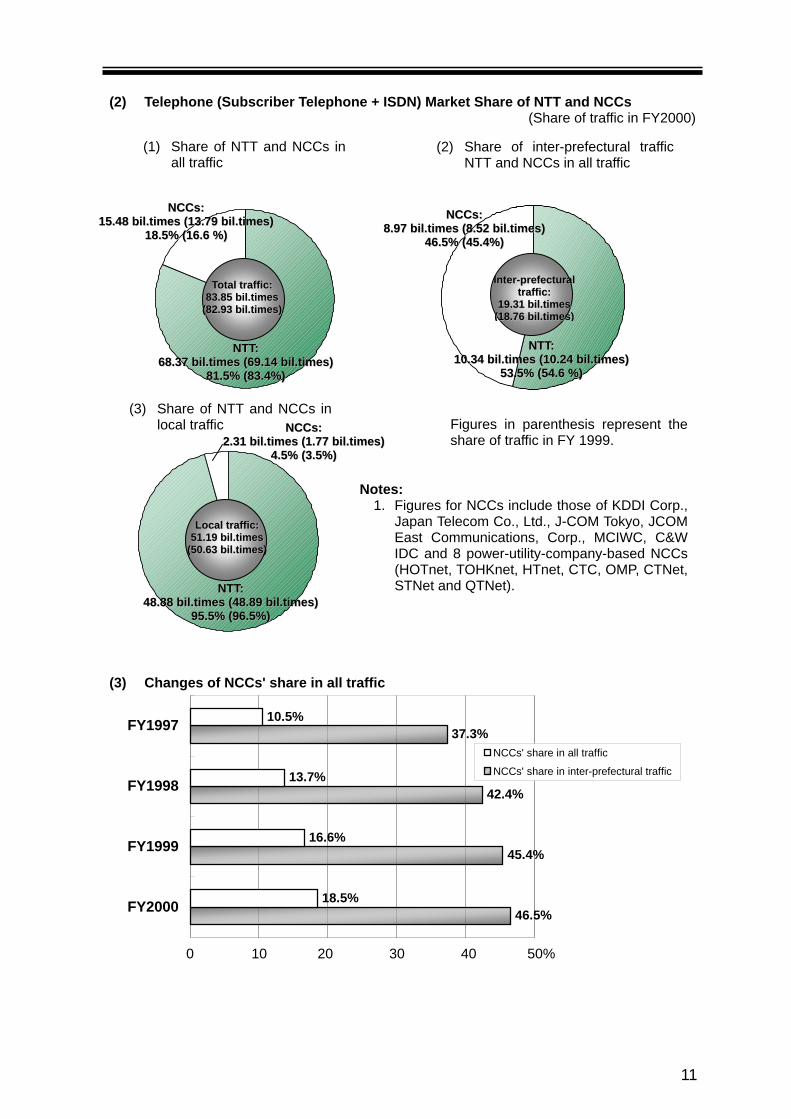
(2) Telephone (Subscriber Telephone + ISDN) Market Share of NTT and NCCs(Share of traffic in FY2000)
(3) Changes of NCCs' share in all traffic
46.5%
45.4%
42.4%
37.3%
18.5%
16.6%
13.7%
10.5%
FY2000
FY1999
FY1998
FY1997
NCCs' share in all traffic
NCCs' share in inter-prefectural traffic
NNCCCCss::1155..4488 bbiill..ttiimmeess ((1133..7799 bbiill..ttiimmeess))
1188..55%% ((1166..66 %%))
NNTTTT::6688..3377 bbiill..ttiimmeess ((6699..1144 bbiill..ttiimmeess))
8811..55%% ((8833..44%%))
TToottaall ttrraaffffiicc::8833..8855 bbiill..ttiimmeess
((8822..9933 bbiill..ttiimmeess))
(2) Share of inter-prefectural trafficNTT and NCCs in all traffic
NNCCCCss::88..9977 bbiill..ttiimmeess ((88..5522 bbiill..ttiimmeess))
4466..55%% ((4455..44%%))
NNTTTT::1100..3344 bbiill..ttiimmeess ((1100..2244 bbiill..ttiimmeess))
5533..55%% ((5544..66 %%))
IInntteerr--pprreeffeeccttuurraallttrraaffffiicc::
1199..3311 bbiill..ttiimmeess((1188..7766 bbiill..ttiimmeess))
(3) Share of NTT and NCCs inlocal traffic NNCCCCss::
22..3311 bbiill..ttiimmeess ((11..7777 bbiill..ttiimmeess))44..55%% ((33..55%%))
NNTTTT::4488..8888 bbiill..ttiimmeess ((4488..8899 bbiill..ttiimmeess))
9955..55%% ((9966..55%%))
LLooccaall ttrraaffffiicc::5511..1199 bbiill..ttiimmeess
((5500..6633 bbiill..ttiimmeess))
Notes:1. Figures for NCCs include those of KDDI Corp.,
Japan Telecom Co., Ltd., J-COM Tokyo, JCOMEast Communications, Corp., MCIWC, C&WIDC and 8 power-utility-company-based NCCs(HOTnet, TOHKnet, HTnet, CTC, OMP, CTNet,STNet and QTNet).
(1) Share of NTT and NCCs inall traffic
0 10 20 30 40 50%
Figures in parenthesis represent theshare of traffic in FY 1999.

12
5. Current Status of Rate Reductions
(1) Long-distance call (Tokyo-Osaka)
3 minutes, daytime, weekdays
050
100150200250300350400450
(2) Local call
3 minutes, daytime, weekdays
0
5
10
15
¥¥¥444000000
¥¥¥222000¥¥¥444555¥¥¥555444¥¥¥888000July 21, 1983
NTTApril 1, 2001~
Fusion,Dec. 12, 2001~
HEISEI DEN DENJan., 2002~ MEDiA
Dec. 1, 2000~C&WIDC
Mar. 1, 2001~TTNet
Mar. 1, 2001~NTT-C, JT
KDDI
▲▲▲▲95%
¥¥¥999~~~~~~~~~~~~
¥¥¥888...777
¥¥¥888...555~~~~~~~~~~~~
¥¥¥888...444
¥¥¥999¥¥¥111000
TTNet,QTNet ¥9
NTT East andWest, KDDI, JT,NTT-C ¥8.5TTNet, QTNet¥8.4
NTT East ¥9TTNet ¥8.7
▲▲▲▲25%~~~~▲▲▲▲15%
Nov. 17, 1976~NTT
Jan.7, 1998~ TTNetApril 1, 1999~ QTNet
Jan. 10, 2001~ May 1, 2001~
¥¥¥888...222~~~~~~~~~~~~
¥¥¥777...555
MEDiA ¥8.2HEISEI DEN DEN
¥7.5
MEDiA Jan. 30, 2002~HEISEI DEN DENFeb. 1, 2002~

(3) International call (Japan-U.S.A)
3 minutes, daytime, weekdays
0
500
1000
1500
2000
(4) Cellular phone (800MHz digital system)
Note: On March 25, 1993, the "800MHz digital cellular phone service" started.NTT DoCoMo reduced the basic charge to 4,500 yen (including a free call allowanceworth 200) in June 2000.
Call rate (cellular phone → fixed phone, intra-prefectural)
¥¥¥111,,,555333000KDD: ¥450 (Nov. 23, 1996)JT: ¥440 (Dec. 20, 1996)C&W: IDC ¥440 (Dec. 20, 1996)
April 1, 1985~KDDI
MCIWCJ: ¥150 (Dec. 1, 1998)JT ¥180: (Oct. 1, 1999)C&W IDC: ¥180 (Oct. 5, 1999)KDDI: ¥180 (Nov. 1, 1999)TTNet: ¥132 (Nov. 1, 1999)DTJ: ¥75 (Dec.10, 2000)NTT-COM: ¥160 (April 3, 2000)Fusion: ¥45 (Sept. 1, 2001)MEDiA: ¥45 (Jan. 30, 2002)HEISEI DEN DEN: ¥45(Feb. 1, 2002)
0
5000
10000
15000
20000 4
3
2
1
¥¥¥111777,,,000000000▲▲▲▲75%
NTT DoCoMo,Mar. 25, 1993~
¥¥¥444,,,333000000
¥¥¥222666000▲▲▲▲73%
¥¥¥777000
J-Phone,June 1, 1999~
NTT DoCoMo and nineother companies,
Dec. 1, 2000~
NTT DoCoMo,Mar. 25, 1993~
Basic fee
▲▲▲▲90~~~~96%
00
00
00
00
13

14
47.0
8
27.0
6
16.9
4
11.5
5
3.3
%
11.0
%
19.1
%
11.7
%
50.4
%
68.2
%
80.0
%
34.0
%
6.4
%
88.6
%
0
1,0
00
2,0
00
3,0
00
4,0
00
5,0
00
6,0
00
7,0
00
8,0
00
9,0
00
10,0
00
End
of C
Y199
5En
d of
CY1
996
End
of C
Y199
7En
d of
CY1
998
End
of C
Y199
9En
d of
CY2
000
End
of 2
005
0.0
%
10.0
%
20.0
%
30.0
%
40.0
%
50.0
%
60.0
%
70.0
%
80.0
%
90.0
%
100.0
%
Num
ber o
f Int
erne
t use
rs(J
apan
)Pe
netra
tion
rate
inho
useh
olds
Pene
tratio
n ra
te in
ente
rpris
es
(Uni
t: 1
milli
on)
(%
)
872
(Est
imat
e )
End
of C
Y200
1
55.9
3 60.5
%
97.6
%95.8
%
※Bu
sine
sses
are
thos
e ha
ving
mor
e th
an 3
00 w
orke
rs o
n th
eir p
ayro
lls, a
nd a
re lo
cate
d in
Jap
an(e
xclu
ding
bus
ines
ses
in th
e ag
ricul
ture
, for
estry
, fis
herie
s an
d m
inin
g in
dust
ries)
.So
urce
: WH
ITEP
APER
Info
rmat
ion
and
Com
mun
icat
ions
in J
apan
200
1, e
tc.
III. Internet
1. Total Internet user population and Internet diffusion rate
(1) Environment surrounding telecommunications business
14

15
0
500,
000
1,00
0,00
0
1,50
0,00
0
2,00
0,00
0
2,50
0,00
0
3,00
0,00
0
3,50
0,00
0
4,00
0,00
0
4,50
0,00
0
99-3
99-6
99-9
99-1
200
-300
-600
-900
-12
01-3
01-6
01-9
01-1
202
-302
-602
-9
133.
4 th
ousa
nd13
0.3
thou
sand
32.9
thou
sand
115.
1 th
ousa
nd
9.2
thou
sand
62.5
thou
sand
3.2
thou
sand6.6
thou
sand
15.4
thou
sand
21.6
thou
sand
46.3
thou
sand
78.4
thou
sand
96.7
thou
sand
139.
9 th
ousa
nd
145.
6 th
ousa
nd
171.
0 th
ousa
nd
153.
3 th
ousa
nd 162.
6 th
ousa
nd
156.
7 th
ousa
nd
1,52
4,56
4
1,78
7,59
8
1,20
4,56
492
1,86
7
650,
796
510,
339
400,
760
291,
333
178,
737
70,6
55
112,
182
9,72
32,
537
1,23
521
119
2,37
8,79
5
3,02
8,55
6
2,69
9,28
5
2,07
6,30
2
3,91
5,74
0
3,61
0,19
9
3,30
0,92
6
0
10,0
00
20,0
00
30,0
00
40,0
00
50,0
00
60,0
00
70,0
00
80,0
00
90,0
00
00-9
00-1
201
-301
-601
-901
-12
02-3
02-6
02-9
abt.
3,10
0ab
t. 2,
500
abt.
450
abt.
900
abt.
6,50
0ab
t. 8,
000
abt.
15,0
00
abt.
5,00
0
abt.
10,5
00
abt.
21,0
00
abt.
18,5
0012
,33718
,188
abt.
9,30
0ab
t. 4,
700
50,9
30
abt.
200
abt.
500
abt.
1 ,40
0
26,4
0034,9
30
84,9
03
68,6
00
Cab
le In
tern
et・Su
bscr
iber
s: a
bt. 1
,710
,000
・Bu
sine
sses
: 270
(A
s of
the
end
of J
uly
2002
)
Cab
le In
tern
etC
able
Inte
rnet
・Su
bscr
iber
s: a
bt. 1
,710
,000
・Bu
sine
sses
: 270
(A
s of
the
end
of J
uly
2002
)
DSL
・Su
bscr
iber
s: 3
,915
,740
(As
of t
he e
nd o
f Aug
. 200
2)・Bu
sine
sses
: 47
(A
s of
the
end
of A
ug. 2
002)
DSL
DSL
・Su
bscr
iber
s: 3
,915
,740
(As
of t
he e
nd o
f Aug
. 200
2)・Bu
sine
sses
: 47
(A
s of
the
end
of A
ug. 2
002)
Fibe
r-op
tic n
etw
orks
(for G
ener
al u
sers
)・Su
bscr
iber
s: 8
4,90
3・Bu
sine
sses
: 10
(As
of t
he e
nd o
f Jul
y 20
02)
Fibe
r-op
tic n
etw
orks
Fibe
r-op
tic n
etw
orks
(for G
ener
al u
sers
)・Su
bscr
iber
s: 8
4,90
3・Bu
sine
sses
: 10
(As
of t
he e
nd o
f Jul
y 20
02)
Wire
less
・Su
bscr
iber
s: a
bt. 2
1,00
0・Bu
sine
sses
: 25
(As
of t
he e
nd o
f Jul
y 20
02)
Wire
less
Wire
less
・Su
bscr
iber
s: a
bt. 2
1,00
0・Bu
sine
sses
: 25
(As
of t
he e
nd o
f Jul
y 20
02)
(2) Changes in the total number of subscribers to high-speed and ultra-high-speedInternet services
Current Status of Broadband Penetration - Number of Subscribers
15

16
2002
0606
2,90
03,
100
2,45
32,
932
2,05
62,
700
4,35
3
5,90
37,
085
2,01
2 FT
2,51
9 D
T
1,95
0 N
TT-C
1,95
0 N
TT-C
0
1,0
00
2,0
00
3,0
00
4,0
00
5,0
00
6,0
00
7,0
00
8,0
00
9,0
00
Com
mun
icat
ions
ser
vice
fees
Inte
rnet
acc
ess
rate
Tota
l5,
050
yen
Tota
l4,
850
yen
Tota
l2,
453
yen
Tota
l5,
903
yen
Tota
l4,
353
yen
Tota
l4,
944
yen
Tota
l7,
085
yen
Tota
l4,
575
yen
Tota
l2,
700
yen
(ye
n)
Yaho
oVe
rizon
Com
mun
icat
ions
(New
Yor
k)B
T(L
ondo
n)N
TT E
ast
FT(P
aris
)D
T(G
erm
any)
KT
(Kor
ea)
1.5
Mbps
/512kb
ps
512kb
ps
/256kb
ps
500kb
ps
/128kb
ps
8M
bps
/900kb
ps
768kb
ps
/128kb
ps
1.5
Mbps
/128kb
ps
768kb
ps
/128kb
ps
1.5
Mbps
/256kb
ps
8M
bps
/1M
bps
Not
e: 1.Th
e ra
tes
indi
cate
d ar
e th
ose
of J
uly
2002
.2.
Exch
ange
rate
s of
Jul
y 10
, 200
2 w
ere
used
to c
onve
rt ra
tes
in e
ach
coun
try (U
S$1
= ¥1
18.1
8; £
1 = ¥1
82.6
5; 1
eur
o = ¥1
16.9
0; 1
won
= 0
.09
yen)
3.Ta
xes
wer
e no
t inc
lude
d fo
r all
rate
s.
2.
Cur
rent
Con
ditio
ns in
Ele
ctro
nic
Com
mun
icat
ions
(Int
erna
tiona
l com
paris
on o
f ful
l-tim
e In
tern
et c
onne
ctio
n fe
es (A
DSL
))
16

17
3. Deployment of fiber-optic networks
(1) Current status in terms of cable length used(As of the end of FY2001; unit: 1,000km)
Item Cable length Fiber-optic cable
Backbone networks 283 257
Access networks 1,400 291
Total 1,683 548
(2) Changes in ratio of fiber-optic cables to all cables (cable length)(Unit: %)
End of FiscalYear FY91 FY92 FY93 FY94 FY95 FY96 FY97 FY98 FY99 FY00 FY01
Backbonenetworks 36.4 42.1 48.0 55.4 60.3 65.8 70.9 78.1 86.0 89.4 90.6
Accessnetworks 2.3 2.9 3.8 4.7 6.4 9.7 13.2 15.2 17.7 18.9 20.7
Total 8.6 10.1 12.4 15.1 17.3 21.4 25.1 27.7 32.6 31.4 32.5
Note: Since the end of FY2000, the total length of the International cables has been deductedfrom the total length of the relay carriers’ cables.
(3) Trends in actual investment in fiber-optic networks(Unit: ¥1 billion)
End of FiscalYear FY94 FY95 FY96 FY97 FY98 FY99 FY00 FY01
Backbonenetworks 3,414 2,972 3,387 3,446 2,247 2,859 2,037 1,957
Accessnetworks 1,299 2,447 3,315 3,033 2,415 2,774 2,052 2,153
Total 4,713 5,419 6,702 6,479 4,662 5,633 4,089 4,110

18
(4) Target of fiber optic Infrastructure
100%
59%
Make efforts to complete nationwide fiber-opticaccess networks by FY2005"(Policy Measures for Economic Rebirth: November1999)
Coverage (target)
Establishment of the IT StrategyHeadquarters
Enforcement of the Basic Law onInformation Technology (IT Basic Law)
Provisional Measures Lawfor Telecommunications
Infrastructure
Special Financing System for theDevelopment of the Optical Subscriber
Loop System
Set up Advanced Information andTelecommunications Society
Promotion Headquarters
Reo
rgan
izat
ion
Actual result Initial plan(Telecommunications Council
Report of May 1994)
Efforts made tocomplete the network
as early as 2005
FY 1994 1995 1996 1997 1998 1999 2000 2001
Coverage abt. 10% abt. 13% abt. 16% abt. 19% abt. 27% abt. 36% abt. 43% abt. 59%
nationwaide
1994 201020052001
2000
From 2001:
From 1991:
August 1994:
From 1995:
January 6, 2001:

19
4. Major support systems for fiber-optic networks and broadband accessnetworks
Financing Systems
No/low interest financing by theDevelopment Bank of Japan
No/low interest financing by the Development Bank ofJapan for perators introducing broadband accessnetworks such as fiber optic/DSL, etc.(No interest for public corporation, low interest forprivate corporation)
No-interest loan(NTT-C / the Third Sector)
Low-interest loan(NTT-C' / Private Sector)
Ultra-low interest financing by theDevelopment Bank of Japan andTelecommunication Advancement
Organization (TAO)
TAO makes interest-based assistance for privatecorporation with low interest financing from theDevelopment Bank of Japan.
Tax benefit incentives
Special redemptionfor corporate tax
Decrease of the taxstandard for fixed
assets tax
Operators introducing broadband access networks such as fiberpotic/DSL, etc. can apply for a special 6-18% redemption for corporatetax.
Operators introducing broadband access networks such as fiberoptic/DSL, etc. can decrease the tax standard for fixed assets tax by 20-25%.
Guarantee ofliabilities
TAO guarantees the debt liabilities of operators introducing broadbandaccess networks such as fiber potic/DSL, etc.
To receive the following support, applicants should obtainauthorization of deployment plans from MPHPT in line with theProvisional Measures Law for Telecommunications InfrastructureImprovement.

20
IV. Mobile communications1. Status of diffusion of mobile phones
Mar.80
Mar.81
Mar.82
Mar.83
Mar.84
Mar.85
Mar.86
Mar.87
Mar.88
Mar.89
Mar.90
Mar.91
Mar.92
Mar.93
Mar.94
Mar.95
Mar.96
Mar.97
Mar.98
Mar.99
Mar.00
Nov.01
Mar.02
Aug.02
Deposit ¥200,000 ¥100,000 Abolished
Subscription fee ¥80,000 ¥72,000 ¥45,800 ¥21,000→¥9,000→¥6,000→Free
Monthly basiccharge
¥30,000 ¥18,000 ¥15,000 ¥9,500 ¥8,400 ¥6,600 Abolished(Analog)
(800MHz, digital) ¥8,800 ¥6,800 ¥4,900 ¥4,500
Call charge(3 minutes)
¥280 ¥260 ¥230→¥200→¥150→¥ Abolished(Analog)
(800MHz, digital) ¥260 ¥200→¥180→¥110→¥80→¥70 (Dec. 2000)
Note: Figures are cellular phone rates of NTT DoCoMo (standard plan rate for 3 minutes during daytime hours on weekdays [when the personreceiving the call is using a standard telephone within the central business zone of NTT DoCoMo]).
Year 2000 Year 2010Forecast in April 1996 25.0~32.5 million -
↓Forecast in February 1997 42.8~47.3 million 59.9~66.2 million
↓Forecast in Sept. 1999 6.2~6.7 million 7.5~10.0 million
Source: Telecommunications Technology Council Report
Revised forecast for mobile telephone market
Mar. 31, 2000: 63.883 million subscribersCellular phones: 60.942 millionPHS: 5.842 million
July 95: Market entry of PHS carriers
December 79:NTT started service
April 85:Telecom Reform
4
April 94: Introduction of competition, by 4 carriers ineach regional block (market entry of digitalmobile carriers) and COAM system
433
July 93: NTT DoCoMo split into 9 companies
213
July 92: NTT separated mobile communications service
138
December 88: NCCs' entry
24
As of the end of Mar. 2002: 73.211 million subscribersCellular phones: 69.121 millionPHS: 5.7 million
1,000
0
5,000
4,000
3,000
2,000
6,000
8,000
7,000
As of the end of Aug. 2002: 77.267 million subscribersCellular phones: 71.622 millionPHS: 5.645 million

21
2. Growth Factors in the Mobile Phone Market
● Mobile phone market is growing with an annual increase of 10 million subscribers eachyear.26.91 million (FY96) → 38.25 million (FY97) → 47.31 million (FY98) →56.85 million (FY99) → 66.78 million (FY2000) (Cellular phone: 60.94 million, PHS: 5.84million) → 74.817 million (As of the end of Mar.) (Cellular phone: 69.12 million, PHS:5.697 million)
● High growth is fostered by pro-competition policy and technological innovation whichaccelerate rate reduction and diversification
Pro-competition policy
(1) July 1992: Separation of mobile business unit from NTTJuly 1993: Division of the mobile business carrier separated from NTT into 9 companies
(2) 1994: Introduction of competition by 3 or 4 carriers in each market blockThis became the most pro-competitive policy in the world
(3) Permission for 3 PHS carriers in each market block
(4) April 1994: Introduction of COAM (Customer Owned and Maintained) system
(5) Dec. 1998: Nine NTT Personal Group companies transferred their PHS business to NTTDoCoMo Group companies in each region. (5 or 6 cellular and PHS carriers in eachregional block)
Technological innovation
(1) 1993: Digital mobile phone services launched - Higher quality, privacy function, etc.
(2) Down-sizing and weight-reduction of terminals, longer battery life, low-priced terminals
1997 2002New subscription fees 0 → 0Basic fees 6800 → 4500Communication fees 130 → 70
Rate reduction anddiversification
(1) With the implementation of the above-mentioned pro-competition policy and the progressof technological innovation, we succeeded in cutting our rates sharply. The newsubscription fee was reduced to zero starting December 1996. The basic charge was cutby about 34% and the telephone call rate, by about 46% during the past five years, saidNTT DoCoMo, Inc.
(2) April 1994: Introduction of "Low-volume call rate" tariff opened market to personal users.
(3) April 1995: NTT DoCoMo introduced "Area-by-area call rate" tariff (3 min. ¥70: 800MHz,digital).
• Realization of fair and competitive markets containing six carriersin each market
• Digitalization and drastic technological innovation in terminalequipment
• Rapid reduction and diversification of rates

22
V. Introduction of new wireless systems1. The third generation mobile communications system (IMT-2000)
※IMT-2000: International Mobile Telecommunications - 2000
◎ Characteristics Realization of an internationally unified system → Global service that can be used
worldwide High transmission speed about 200 times faster than that of existing mobile telephones
(capable of transmitting simple, moving images) Capable of providing a voice-communications service whose quality is as good as that of
the fixed telephone network.
◎ Schedule for launching services- NTT DoCoMo Group・・・・・・・・ In May 2001, this group launched the third-generation
mobile communications service on an experimental basis.(Japanese/European system)In October 2001, this group launched the full-fledgedservice.
- J-Phone・・・・・・・・・・・・・・・・・・・ This group launched the experimental service in June 2002.(Japan/European System)It will start the full-fledged service in December 2002.
- KDDI Group ・・・・・・・・・・・・・・・ This group launched the service in April 2002. (NorthAmerican system)
The 2 GHz service will be launched in April 2003 on anexperimental basis, and the full-fledged service, inOctober, 2003.
~~~~Changes in the mobile communications system~~~~◆The first-generation mobile telephone (analogue system)
This system was launched in 1979, using the frequency band of 800MHz. Voice communications serviceonly.
◆The second-generation mobile telephone (digital system)This system was launched in 1993, using the frequency bands of 800MHz and 1.5GHz. Voice-communications and low-speed data transmission services (transmission speed of 9.6 – 64 kbps)
◆PHS (Personal Handy Phone System)This system was launched in 1995, using the frequency band of 1.9 GHz. Voice-communications and low-speed data transmission services (transmission speed of 32 – 128 kbps)
64,128,144kbps
Switching center
Fixed network
Other mobile network
Other IP network
Base station
Base station
64 kbps mobile device
64~~~~384kbpsPDA
Indoor applications
2Mbps (384kbps immediately after this system was introduced)
Multimedia devicesFixed/mobile
network
Indoor equipment
Telephone
Devices installed in a car
Multimedia devices
384 kbps → moving images

23
2. The fourth-generation mobile communications system
移動通信システムの分類Classification of mobile
communications systems
0.01 0.1 1 10 100
High speed
Walking environment
Stationary environment
Mov
ing
spee
d
Digitalmobilephone
(Second-generation
system)PHS
4G System(Fourth-generation
system)
IMT 2000 (Third-generation
system)
Communication speed (Mbit/s)
Wireless access /Wireless LAN
The next-generation mobile communications system will come after IMT-2000. Thefollowing high technology will be achieved.
・ The downstream (from the base station to terminal devices) transmission speed will beincreased to 50-100 Mbps. (In the case of IMT-2000, the maximum speed of both thedownstream and upstream transmission is 2Mbps.)
・ Multimedia mobile communications, including the transmission of high-definition, movingimages.
・ Increased compliance with the Internet protocol, and is compatible with IPv6.
・ Introduction of the next-generation mobile communications technology, includingwireless technology software (the technology that makes it possible to flexibly changethe frequency, communications system, etc. via software)
Image of the system

24
1980’s
Starting period Growing periodExpanding period
(customization of mobile devices Personal use) Maturing period
Analogue,Mobile / cartelephone,
Cordless telephone(First generation)
Digital,Mobile / cartelephone,
Cordless telephone(2 - 2.5 generation)
IMT 2000(Third generation)
-
Multimedia mobilecommunications
systems, includingimage and broadband
services(Fourth generation)
Mainly voicecommunications
Voice / ordinary data ~64 kbps
voice / ordinary data~384kbps (~2Mbps) 50-100 Mbps
移動通信の変遷Trends of mobile communications
2000’s1990’s
2001: Recommendation from the Telecommunications Council (June)(Basic concept, plans involving technological development /standardization, methods of achieving such plans, etc.)⇒ Proposal to ITU
2002: Formulation of the policy on the frequency bands for future mobilecommunications, such as the fourth-generation mobile communications
2005 : Improvements and sophistication of the existing systemsEstablishment of the technology required for the fourth-generation mobilecommunication system
Around 2006: International allocation of the frequency bands for the fourth- generationmobile communications system (WRC-2006?)
By 2010: To put the fourth-generation mobile communications system into practicaluse
Application Schedule

25
3. Wireless access system
○○○○ E-Japan Priority Policy Program (Decided by the IT Strategy Headquarters on March29, 2001)
ExtractsBefore the end of the year 2001, the frequency band available for high-speed wireless Internet accesswill be expanded. At the same time, the allocation of frequency will be reviewed and the re-allocationwill be carried out by FY2002, to secure the frequency for fourth-generation mobile communicationssystems, etc.
Frequency bands System Maximumtransmission speed
Transmissiondistance
Institutionalization
Number ofcompanies
entered
Point-to-Point(P-P)※1 Around 10Mbps※2 Around 5km※3
2.4 GHz bandPoint-to-multipoint
(P-MP)※1 Around 2 Mbps Around 400m※3
1999.10(Expansion ofthe frequency-usable areas)
12
22/26/38 GHzband
Point-to-Point(P-P) Around 156 Mbps Around 4km 11※4
26/38 GHz band Point-to-multipoint(P-MP) Around 10 Mbps Around (radius)
1km
1998.1210※4
25 GHz band Point-to-PointPoint-to-multipoint Around 100 Mbps Around 100m 2002.2 ――
Notes:1. P-P: A system used when one radio station communicates with another radio subscriber station.
P-MP: A system used when one base station communicates with more than one subscriber station.2. The most widely-used system (IEEE 802.11b)
The revision of the current regulation in February 2002 enabled higher-speed telecommunications ofmore than 20 Mbps.
3. Because this frequency band is used for other purposes as well, the transmission distance is greatlyaffected by the surrounding environment. (High-directional antenna capable of extending transmissiondistance three-fold will be introduced around the spring of 2002.)
4. Some companies use both systems. As a result, the number of the companies in this market totaled 15.
SubscriberP-MP communications system
Base station
Subscriber
Subscriber
Subscriber
Fiber optics
P-Pcommunications
system
26
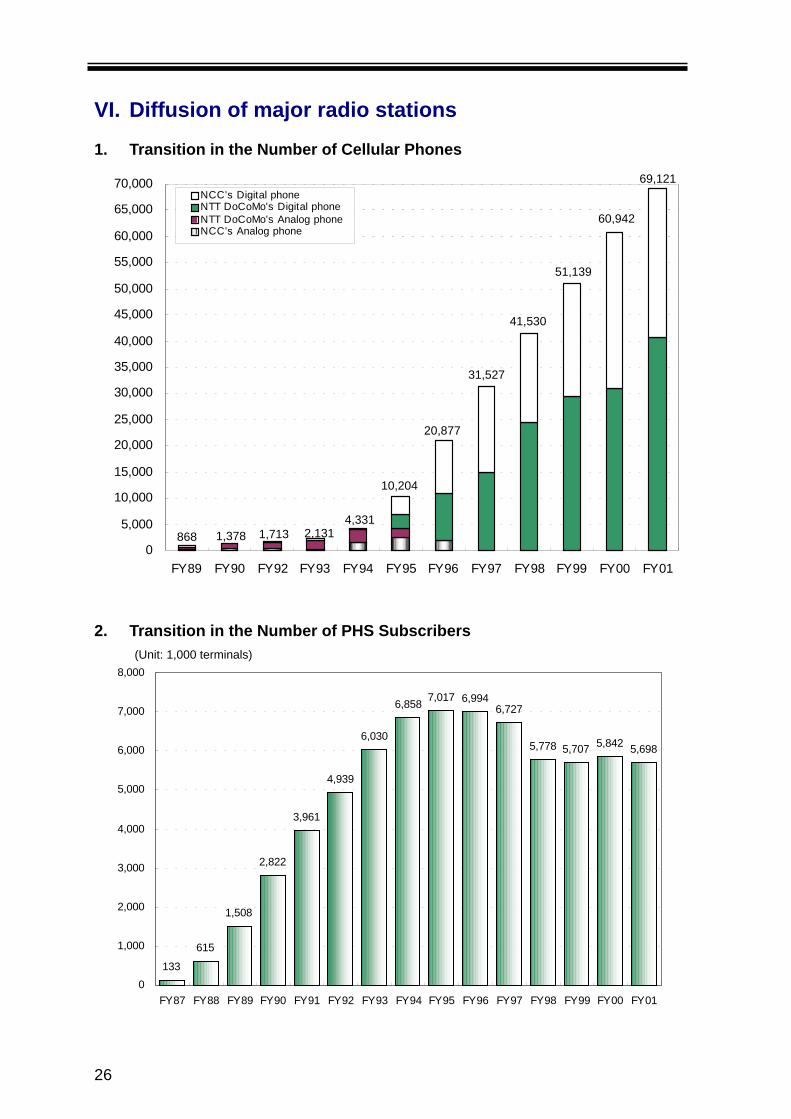
VI. Diffusion of major radio stations1. Transition in the Number of Cellular Phones
0
5,000
10,000
15,000
20,000
25,000
30,000
35,000
40,000
45,000
50,000
55,000
60,000
65,000
70,000
FY89 FY90 FY92 FY93 FY94 FY95 FY96 FY97 FY98 FY99 FY00 FY01
NCC's Digital phoneNTT DoCoMo's Digital phoneNTT DoCoMo's Analog phoneNCC's Analog phone
2. Transition in the Number of PHS Subscribers
133
615
1,508
2,822
3,961
4,939
6,030
6,858 7,017 6,9946,727
5,778 5,707 5,842 5,698
0
1,000
2,000
3,000
4,000
5,000
6,000
7,000
8,000
FY87 FY88 FY89 FY90 FY91 FY92 FY93 FY94 FY95 FY96 FY97 FY98 FY99 FY00 FY01
60,942
51,139
41,530
31,527
10,204
20,877
4,3312,1311,7131,378868
(Unit: 1,000 terminals)
69,121

27
3. Transition in the Number of Radio Pagers
0
2,000
4,000
6,000
8,000
10,000
12,000
FY88 FY89 FY90 FY91 FY92 FY93 FY94 FY95 FY96 FY97 FY98 FY99 FY00 FY01
NTT DoCoMo NCC
4. Transition in the Number of SA Earth Stations
1,066 1,157
2,597
3,227
3,7934,279
5,611
6,931
8,024
8,8728,588
8,876
0
1,000
2,000
3,000
4,000
5,000
6,000
7,000
8,000
9,000
FY90 FY91 FY92 FY93 FY94 FY95 FY96 FY97 FY98 FY99 FY00 FY01
(Unit: 1,000 subscribers)
3,520
10,61110,074
7,116
3,766
9,353
8,064
6,689
5,911
5,083
1,4392,071
4,247
(Unit: Number of VASTs)
1,137

28
References
Reference I. Status of diffusion of cable television
Reference II. Current Status of Broadcasting Businessin Japan

29
Reference I. Status of diffusion of cable television1. Changes in the total number of subscriber households, diffusion rate
1303
500
947 1048
794
672
27.1
20.0
17.0
14.6
11.0
21.8
0
200
400
600
800
1000
1200
1400
FY1996 (37.5%) FY1997 (34.4%) FY1998 (18.1%) FY1999 (19.3%) FY2000 (10.6%) FY2001 (24.4%)
[10,000 households]
0.0
5.0
10.0
15.0
20.0
25.0
30.0
Diffusion rate [%]
Subscriber households Diffusion rate [%]
※ The data are as of the end of each fiscal year. The figures in the parenthesis are the rate of year-to-year increase in the total number of subscriber households. The diffusion rate was calculatedusing official family register data as of the end of each fiscal year.
2. Changes in the total number of cable television facilities
994937 9469841030973
0
400
800
1200
FY1996 (12.9%) FY1997 (3.8%) FY1998 (5.9%) FY1999 (-4.5%) FY2000 (-3.9%) FY2001 (5.1%)
※ The data are as of the end of each fiscal year. The figures in the parenthesis are the rate of year-to-year increase in the total number of cable television facilities.
3. Changes in the total number of cable television service providers
669720 738
686646
708
0
200
400
600
800
FY1996 (10.5%) FY1997 (1.7%) FY1998 (2.5%) FY1999 (-7.0%) FY2000 (-5.8%) FY2001 (3.6%)
Note
※ The data are as of the end of each fiscal year. The figures in the parenthesis are the rate of year-to-year increase in the total number of cable television service providers.
Note: The data, up to FY1999, are the total of the figures collected by each TelecommunicationsBureau (including overlapped figures). (The data for FY2000 including the overlapped figure is660.)

30
Reference II. Current Status of Broadcasting Business inJapan
1. Operating Status of BroadcastersFY92 FY93 FY94 FY95 FY96 FY97 FY98 FY99 FY00 Aug. 2001 Oct. 2001 Dec. 2001 Feb. 2002 Mar. 2002 Apr. 2002 Jun. 2002 Aug. 2002
AM broadcasters 48 48 48 48 48 48 48 48 48 48 48 48 48 48 - - -Shortwavebroadcasters
2 2 2 2 2 2 2 2 2 - - - - 2 - - -
FM broadcasters 42 46 46 49 51 51 52 53 55 - - - - 55 - - -FM sound multiplexbroadcasters
1 1 1 1 0 - - - - 0 - - -
FM teletextmultiplexbroadcasters
37 40 40 40 41 44 - - - - 44 - - -
Communitybroadcasters
1 6 16 30 68 93 118 128 139 - - 150 152 - 152 152 156
FM teletext multiplexbroadcasts bycommunity broadcasters
3 3 1 - - 1 1 - 1 1 1
TV broadcasters 119 122 123 125 128 128 129 129 129 - - - - 129 - - -TV sound multiplexbroadcasters
113 116 119 122 126 68 28 28 28 - - - - 26 - - -
TV teletextmultiplexbroadcasters
25 25 25 24 25 24 23 21 19 - - - - 16 - - -
TV data multiplexbroadcasters
2 13 16 17 18 - - - - 18 - - -
TV teletext multiplex andTV data multiplexbroadcasters
16 16 15 15 - - - - 15 - - -
BS analog TVbroadcasters
2 2 2 2 2 2 2 2 2 2 2 2 2 2 2 2 2
BS analog soundmultiplex broadcasters
3 3 3 3 3 2 2 2 2 2 2 2 2 2 2 2 2
BS analog data multiplexbroadcasters
1 1 1 1 1 1 1 1 1 1 1 1 1 1 1
BS digital TVbroadcasters
1(8) 1(8) 1(8) 1(8) 1(8) 1(8) 1(8) 1(8) 1(8)
BS digital radiobroadcasters
1(10) 1(10) 1(10) 1(10) 1(10) 1(10) 1(10) 1(10) 1(10)
BS digital databroadcasters
1(9) 1(9) 1(9) 1(9) 1(9) 1(9) 1(9) 1(9) 1(9)
CS digital TV broadcasters (using asatellite that does not orbit above 110degrees of east longitude)
1(56) 2(71) 2(115) 2(120) 1(113) 1(112) 1(112) 1(111) 1(111) - 1(110) 1(108) 1(106)
CS digital radiobroadcasters
1(6) 2(8) 2(11) 2(11) 2(8) 2(8) 2(6) 2(6) 2(6) 2(6) 2(6) 2(6) 2(6)
CS digital databroadcasters
1(1) 2(2) 2(4) 2(4) 2(2) 2(2) 2(3) 2(3) 2(3) 2(3) 2(3) 2(3) 2(3)
CS digital TV broadcasters usinga satellite that orbits above 110degrees of east longitude
2(15) 2(15) 2(15) 2(15) 2(15) 2(15) 2(15) 2(15) 2(15)
CS digital FM broadcasters usinga satellite that orbits above 110degrees of east longitude
1(1) 1(1) 1(1) 1(1) 1(1) 1(1) 1(1) 1(1) 1(1)
CS digital data broadcastersusing a satellite that orbits above110 degrees of east longitude
2(8) 2(8) 2(8) 2(8) 2(8) 2(8) 2(8) 2(8) 2(8)
CS analog TVbroadcasters
2(6) 2(9) 2(10) 2(13) 2(13) 2(13) 0(0) 0(0) 0(0) 0(0) 0(0) 0(0) 0(0) 0(0) 0(0) 0(0) 0(0)
CS-PCM soundmultiplex broadcasters
2(6) 1(4) 1(3) 1(2) 1(1) 1(1) 1(1) 1(1) 1(1) 1(1) 1(1) 1(1) 1(1) 1(1) 1(1) 1(1) 1(1)
Notes:1. Numbers of broadcasters include NHK, the University of the Air and other broadcasters.2. Figures in parenthesis are the numbers of program supplying broadcasters who entrust broadcasting to
facility supplying broadcasters (broadcast station licensees) and broadcasters on telecommunicationsservices.

31
2. Diffusion of Terrestrial BroadcastingCommercial broadcasters NHK
TV Broadcasting Available nationwide. Four to six broadcastchannels are viewable in approx. 90% oftotal household.
One general and one educationchannel are broadcast nationwide.
AM Broadcasting Available nationwide. In major areas, two tofour channels are broadcast.
Radio 1 and Radio 2 are broadcastnationwide.
FM Broadcasting Available almost nationwide. In major areas,two channels are broadcast. In addition,foreign language broadcasting andcommunity broadcasting are conducted.
One channel is broadcastnationwide.
Short WaveBroadcasting
One channel is broadcast nationwide. (Overseas broadcasting isconducted.)
Note: In addition to the above, the University of the Air Foundation broadcasts one TV and one FM channel,targeting a major part of the Kanto Region as its coverage area.
3. Current Status of DBS in Japan
(1) DBS via broadcasting satellite (Transition of the number of household receivers)
Transition of the number of household receivers
11,238
11,164
537
1,204
2,351
3,803
5,001
5,850
6,570
7,332
8,142
8,762
9,464
10,621
11,139
2,5892,667
2,687
21
8011,257
1,4931,747
2,0552,278 2,401 2,534
2,651
0
2,000
4,000
6,000
8,000
10,000
12,000
89.9 90.3 91.3 92.3 93.3 94.3 95.3 96.3 97.3 98.3 99.3 01.3 02.2 02.3 02.6
The number of contracts with NHK satellite broadcasting
The number of contracts with WOWOW INC.
Unit: 1,000 households
(02.6)
(02.5)

32
(2) DBS via Communication Satellites
1) Transition of receiver's contract(Unit: 1000 cases)
FY94 FY95 FY96 FY97 FY98 FY99 FY00 Jul.,2001
Feb.,2002
Apr.,2002
Aug.,2002
CS TV(Digital) - - 236 631 1,373 2,248 2,618 2,761 3,011 3,086 3,260
2) Numbers of licensees and channels by type of broadcasting
(i) BS analog broadcasting
Satellite Type of broadcasting Licensees Number ofchannels
- High-definition TVbroadcasting
- NHK 1
- Standard definition TVbroadcasting
- NHK and 1 commercialbroadcaster
3
- Standard definition TVsound multiplexbroadcasting
- Commercialbroadcasters
2BSAT (BSAT-1a)
- Standard definition TVdata broadcasting
- 1 commercialbroadcaster
1
(ii) BS digital broadcasting
Satellite Type of broadcasting Licensees Number ofchannels
- High-definition TVbroadcasting
- NHK and 6 commercialbroadcasters
7
- Standard definition TVbroadcasting
- NHK (simulcast) and 7commercialbroadcasters
21
- FM broadcasting - 10 commercialbroadcasters (including1 simul-broadcaster)
23BSAT (BSAT-2a)
- Data broadcasting - 9 commercialbroadcasters (including1 simul-broadcaster)
9
(iii) Analog broadcasting
Satellite Type of broadcasting Number oflicensees
Number ofchannels
JSAT (JCSAT-2) PCM sound broadcastingData broadcasting
11
172
Notes: One broadcaster of JCSAT-2 data broadcasting also operates PCM sound broadcasting.

33
(iv) CS digital broadcasting (using a satellite that does not orbit above 110 degrees of eastlongitude)
Broadcasting Satellite Type of broadcasting Number oflicensees
Number ofchannels
JSAT (JCSAT-3)Standard definition TV broadcastingFM broadcastingData broadcasting
555*1
2*2
10610524
JSAT (JCSAT-4) Standard definition TV broadcastingData broadcasting
581*2
7216
SCC (SUPERBIRD-C) FM broadcastingData broadcasting
11*3
4022
Notes:1. Three broadcasters of JCSAT-3 radio broadcasting also operate standard definition TV
broadcasting.2. All data broadcasters also operate standard definition TV broadcasting.3. All data broadcasters also operate FM broadcasting.
(v) CS digital broadcasting using a satellite that orbits above 110 degrees of eastlongitude
Broadcasting Satellite Type of broadcasting Number oflicensees
Number ofchannels
SCC (N-SAT-110)
- High-definition TV broadcasting- Standard TV broadcasting- FM broadcasting- Data broadcasting
1*1
71*2
6*3
223208
JSAT (N-SAT-110) - Standard TV broadcasting- Data broadcasting
82*4
382
Notes:1. High-definition TV broadcasting is operated only when the standard TV broadcasting is not
operated. The high-definition TV broadcaster is also one of the standard TV broadcasters.2. The FM broadcaster is also one of the standard TV broadcasters.3. Three of the data broadcasters are also among the standard TV broadcasters.4. Two of the data broadcasters are also among the standard TV broadcasters.


![Manual for Market Entry into Japanese … for Market Entry into Japanese Telecommunications Business ― Table of Contents Preface 1 [Overview] I. Outline of Telecommunications Business](https://static.fdocuments.in/doc/165x107/5ab2aa747f8b9aea528d85c7/manual-for-market-entry-into-japanese-for-market-entry-into-japanese-telecommunications.jpg)