Outline of Inception Report
55
Phase I Report: Remuneration Packages for Principal Officials of HKSARG Appointed Under the New Accountability System Findings of Survey of Remuneration of CEOs, Managing Directors and Managing Partners and Review of Overseas Practices December 31, 2001 Submitted to: Constitutional Affairs Bureau Prepared by: Hay Group 27/F, 3 Lockhart Road Wanchai, Hong Kong
Transcript of Outline of Inception Report

Phase I Report: Remuneration Packages for Principal Officials of HKSARG Appointed Under the New Accountability System Findings of Survey of Remuneration of CEOs, Managing Directors and Managing Partners and Review of Overseas Practices December 31, 2001 Submitted to: Constitutional Affairs Bureau Prepared by: Hay Group 27/F, 3 Lockhart Road Wanchai, Hong Kong

Phase I Report – Remuneration of Principal Officials
2
Table of Contents Section Page Introduction 3 Part I. Survey of Remuneration of Chief Executives, Managing Directors and Managing Partners Purpose of Remuneration Survey and 4 General Criteria for Selection of Organisations Selection Criteria for Private Sector Organisations 5 Selection Criteria for Public Sector Organisations 5 Selection Criteria for Professional Services Firms 5 Other Criteria for Selection to Survey 6 Organisations Invited to Participate in Survey 6 Organisations Included in the Remuneration Survey 6 Categorization of Organisations into Tiers 10 Methodology 11 Results of Remuneration Survey 13 Impact of Dividends 14 Analysis 17 Part II. Review of Overseas Practices Selection of Countries for Inclusion in International Review 19 Overview of Practices 19 International Ministerial Remuneration Comparisons 26 Appendices Appendix 1. List of Organisations Selected for Invitation 28 Appendix 2. Overview of LTI Valuation Methodology 32 Appendix 3. Definition of Remuneration Terms 36 Appendix 4. Summary of Overseas Remuneration Practices for Ministers 37 Australia 38 Canada 41 Finland 43 Netherlands 45 New Zealand 46 Singapore 49 United Kingdom 51 United States 53

Phase I Report – Remuneration of Principal Officials
3
Introduction 1. At present, all principal officials holding Secretaries of Department
and Directors of Bureau positions in the HKSARG are civil servants. They are remunerated according to the relevant civil service pay scale and enjoy fringe benefits provided for in the civil service system. They are subject to the civil service management system and the civil service disciplinary mechanism.
2. There have been views expressed that as senior officials are involved in policy making and play a leading role in public affairs, they should be held accountable for the outcome of their policies. In his 2000 Policy Address, the Chief Executive of the HKSAR undertook to examine how, under the leadership of the Chief Executive, the accountability of principal officials for their respective policy portfolios could be enhanced. In his 2001 Policy Address, the Chief Executive outlined the initial thinking on enhancing accountability of principal officials. The idea is to introduce a new system of appointment applicable to the Chief Secretary, the Financial Secretary, the Secretary of Justice, and most Directors of Bureaux. They would be appointed on terms different to those in the civil service. Their term of office would not exceed that of the Chief Executive who nominated them for appointment.
3. This study includes a review of the approaches taken in a number of developed nations to determine reward levels for appointed, ministerial-level positions. This study also encompasses a survey of pay practices for top executives in a range of sectors in Hong Kong. Together, these reviews and surveys will support the recommendations as regards the approaches that could be adopted.
4. This Phase I Report describes in detail the methodology, selection criteria for organisations included in the remuneration survey, selection criteria for countries to be included in the review of overseas practices, and detailed presentation and analysis of the results of these surveys and reviews.

Phase I Report – Remuneration of Principal Officials
4
Part I. Survey of Remuneration of Chief Executives, Managing Directors and Managing Partners Purpose of Remuneration Survey and General Criteria for Selection of Organisations 5. The purpose of the survey is to provide an indication of compensation
levels for chief executives, managing directors, and managing partners of leading private sector, public sector and professional services firms. These compensation levels form the basis for determining the range of alternative earnings opportunities available to potential candidates for principal official positions.
6. The Secretary for Constitutional Affairs set the following standard: information on chief executive remuneration should be provided for no less than 25 private sector corporations, no less than 25 professional services firms, and no less than 6 public sector organisations.
7. To support this purpose, the organizations selected for this comparison must in their totality meet several general criteria:
• Collectively, they represent sectors that are possible sources of candidates for the various portfolios of principal official positions;
• Collectively, they provide a reasonable indication of the possible range of compensation levels and represent a cross-section of key industries and sectors found in Hong Kong;
• They are leading companies in their sectors, in Hong Kong; and • The selected position should be a CEO, Managing Director,
Managing Partner, or other position with substantial control of all company operations, with a multi-year strategic view subject only to review and approval of a board of directors. The jobholder may or may not be chairman of the organization.
8. Therefore, the selected organisations are drawn from sectors that
reflect the strength and diversity of the Hong Kong economy. Principal official positions are highly complex and responsible positions, and only the highest level executive positions in the largest organisations in the private, public, and professional services sectors are comparable to these positions. In view of this, the selected organisations should be among the largest in their respective sectors, and the positions selected should represent possible sources of candidates for principal officials.
9. Detailed criteria for each major sector are provided below.
Phase I Report – Remuneration of Principal Officials
5
Selection Criteria for Private Sector Organisations 10. Detailed criteria for selection of private sector organisations are
summarized and explained below:
• Sufficient numbers of companies to provide representation from a range of industries such as financial services; property & construction; utilities; transportation; diversified trading, communications, hi-technology, and retail.
• May be local or multinational firms with chief executive officers of
any nationality or ethnicity.
• Whether local or multinational, the company should be a recognized leader in its industry within HK, HK/China, or the Asia Region and the span of control of the executive being surveyed could extend from Hong Kong to Mainland China, the Asia region, or the world.
Selection Criteria for Public Sector Organisations 11. Hay Group recommends the selection of at least six to eight public
sector corporations including non-governmental organisations involved in providing public services.
• The selected organisations should not link their CEO’s pay to government pay practices (e.g., by reference to directorate scale).
• Non-governmental organizations are similar in many regards to
government-owned corporations and also provide a relevant point of reference for principal officials.
Selection Criteria for Professional Services Firms 12. Professional services firms carry out their business by applying the
expertise and knowledge of a profession on behalf of their clients. Professional services firms encompass professions such as accounting, law, real estate, communications, strategy consulting, and engineering.
13. Hay Group recommends representation in accounting, law, real estate, business and technology consulting, and engineering, architecture, and related areas. The firms should include internationally-recognized firms as well as leading local firms.
14. The medical profession is another important branch of professional services. One listed healthcare firm was invited to participate in the survey, as were two public sector organisations with significant healthcare services. However, there is only a very small number of

Phase I Report – Remuneration of Principal Officials
6
medical professional services practices that are of a size sufficient to be considered within this survey.
Other Criteria for Selection to Survey 15. Selected firms should have sufficient size and complexity to reflect the
complexity and impact of positions of principal officials. Complexity in organisations can be measured by the size of the business (revenue), geographic scope, and the diversity of business areas. As revenues are the most objective available measure of complexity, Hay Group have defined minimum revenue levels for inclusion of organisations in the analyses that follow. The minimum revenue for inclusion of a private sector company is HK$2 billion per annum, while the minimum for a public sector organisation is HK$500 million. The minimum revenue for a professional services firm is set at HK$100 million per annum.
16. The complexity of professional service firms reflects their impact on the strategy and operations of their clients’ organisations. Engineering consultants manage highly complex multi-billion dollar projects for their clients. The revenues of their firms reflect only the fees for the services of their engineers and project managers, often less than 10% of the total project value. Strategy consultants advise on long-term strategic business issues that impact the direction of a client’s business for years, but fees usually reflect time spent providing services. Therefore, the revenue standard for professional services firms is set lower than for corporations.
17. Likewise, some of the public sector organisations have regulatory or advisory impacts that have a larger economic and social impact than is indicated by revenues or fee income. Therefore, a lower minimum revenue has been set for these organisations.
18. Organisations selected for inclusion in the survey must also be able to provide accurate information on cash compensation and long-term incentives that reflects the earnings opportunities enjoyed by their chief executives or managing partners.
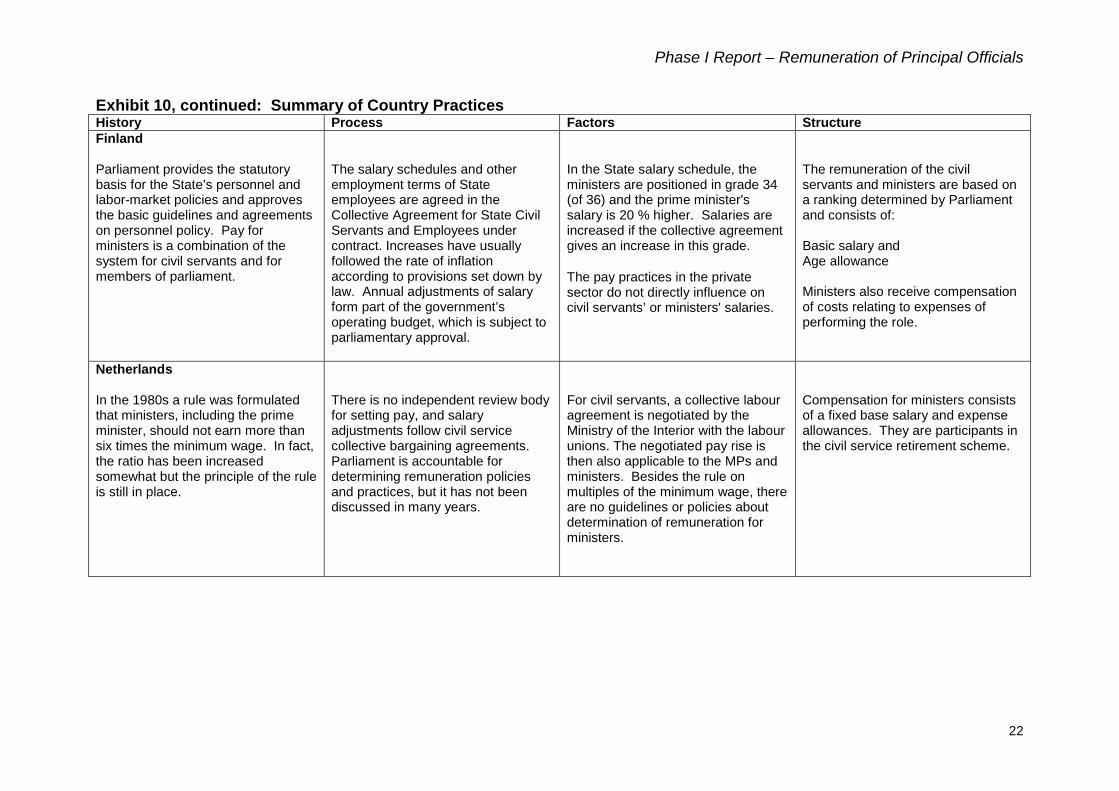
Organisations Invited to Participate 19. The selected list of organisations invited from each sector is given in
Appendix 1. To ensure information can be collected from a sufficient number of organisations, additional organisations have been selected for invitation.
Organisations Included in the Remuneration Survey 20. Exhibit 1 lists, by sectors, the organisations that provided data for the
survey. For reasons of confidentiality, Exhibit 1 includes all

Phase I Report – Remuneration of Principal Officials
7
organisations that have provided compensation information even if they do not meet criteria given in paragraphs 15-18 above. Analyses shown later in this report include only the organisations that meet the criteria.
21. In the event, of the 77 private sector corporations, 13 public sector organisations, and 50 professional services firms invited to participate in the survey, 34 private sector corporations, 11 public sector organisations, and 22 professional services firms provided compensation information within the required timeframe. Of these, 27 private sector corporations, 9 public sector organisations, and 20 professional services firms met the criteria set out above. Although the number of professional services firms included falls just short of 25, Hay Group considers that the data collected from 20 firms are sufficient for the purposes of the present study.
Exhibit 1: Organisations Included in Survey Organisation Industry Group Public Sector Organisations Hong Kong Hospital Authority Public Sector Hong Kong Housing Society Public Sector Hong Kong Monetary Authority Public Sector Hong Kong Mortgage Corporation Public Sector Hong Kong Securities & Futures Commission Public Sector Hong Kong Trade Development Council Public Sector KCR Corporation Public Sector Mandatory Provident Fund Schemes Authority Public Sector MTR Corporation Public Sector Tung Wah Group of Hospitals Public Sector Urban Renewal Authority Public Sector Private Sector Corporations Chevalier Construction Construction Gammon Construction Construction Shui On Construction Ltd Construction Amway China Consumer Product Lam Soon (HK) Ltd Consumer Product Swire Coca-Cola Bottling Ltd Consumer Product CITIC Pacific Ltd Diversified Companies Hutchison Whampoa Ltd Diversified Companies New World Services Diversified Companies Dah Sing Financial Group Financial Services Hong Kong Exchanges and Clearing Financial Services HSBC Holding Financial Services Standard Chartered Financial Services AXA China Region Insurance CMG Asia Insurance Manulife (Int'l) Ltd Insurance Pacific Century Insurance Insurance DuPont China Others HAECO Others Shangri-la Asia Ltd Others South China Morning Post Others Television Broadcasts Ltd Others Hang Lung Development Co. Ltd Property

Phase I Report – Remuneration of Principal Officials
8
Organisation Industry Group Hysan Development Property Giordano Retail and wholesale distribution and trading Shun Hing Electronic Trading Co., Ltd Retail and wholesale distribution and trading Siemens Telecom, IT/HT Cathay Pacific Airways Ltd Transport Kowloon Motor Bus Transport Modern Terminals Ltd Transport OOCL (HK) Transport CLP Holdings Ltd Utilities Hong Kong & China Gas Utilities Hong Kong Electric Holdings Utilities Professional Services BDO McCabe & Lo Accounting Deloitte Touche Tohmatsu Accounting Ernst & Young Accounting Grant Thornton Accounting J Walter Thompson Communications Leo Burnett Communications Bain & Company (Hong Kong) Consulting (IT/Strategy/HR) PA Consulting Consulting (IT/Strategy/HR) Pricewaterhouse Coopers Consulting (IT/Strategy/HR) Atkins China Ltd Engineering/Architecture/Surveying Binnie Black & Veatch HK Ltd Engineering/Architecture/Surveying Maunsell Consultants Engineering/Architecture/Surveying Ove ARUP & Partners HK Ltd Engineering/Architecture/Surveying Scott Wilson Engineering/Architecture/Surveying Baker & Mckenzie Legal Clifford Chance Legal Johnson Stokes & Master Legal Kwok & Yih Legal Woo, Kwan Lee & Lo Legal Centaline Properties Real Estate Chesterton Petty Real Estate Vigers Hong Kong Ltd Real Estate 22. Most organizations that did not agree to participate did so on grounds
of confidentiality of information, or unavailability of executives due to annual leave and business travel. Other organisations that provided information were screened out because they did not meet the criteria for size.
23. Exhibit 2 provides summary statistics for the organisations that are included in the remuneration analysis, including revenues or operating budget, number of employees, and geographical scope. These statistics represent the scope of business managed by the chief executive, managing director, or managing partner whose remuneration is included in the survey. A total of 56 organisations are included in the analysis, including 27 private sector corporations, 20 professional services firms, and 9 public sector organisations.

Phase I Report – Remuneration of Principal Officials
9
Exhibit 2: Summary Statistics of Organisations Managed by Participating Chief Executive, Managing Director, or Managing Partner
Sector
Distribution of Revenues
(HK$million)
Distribution of Number of Staff
Distribution of Geographical Scope
Private P90 26,350 22,155 (27 orgs.) P75 11,194 12,715 HK 5 P50 6,500 3,900 HK/China 12 P25 3,504 1,690 Regional 4 P10 2,725 1,233 Global 6 Ave 10,561 10,431 Professional P90 1,156 2,430 Services P75 813 1,275 HK 1 (20 orgs.) P50 538 665 HK/China 12 P25 223 298 Regional 7 P10 120 185 Global 0 Ave 618 985 Public P90 – – (9 orgs.) P75 7,573 5,600 HK 6 P50 6,400 890 HK/China 1 P25 1,500 600 Regional 0 P10 – – Global 2 Ave 10,605 7,870 All P90 19,625 15,370 (56 orgs.) P75 7,680 5,450 HK 12 P50 3,008 1,690 HK/China 25 P25 795 650 Regional 11 P10 270 295 Global 8 Ave 7,017 6,646 Notes: (1) Statistics reflect operations under the control of the participating chief
executive, managing director, or managing partner. (2) – indicates insufficient information to calculate this statistic.

Phase I Report – Remuneration of Principal Officials
10
Categorization of Organizations into Tiers 24. Organisations have been grouped into three tiers based primarily on
revenues. Exhibit 3 shows the revenue ranges for each tier, which are determined separately for Private and Public organisations and for Professional Services firms. The Exhibit also indicates the distribution of organizational scope and numbers of employees for each of the tiers.
Exhibit 3: Analysis of Tiers Sector
# of Orgs.
Revenues (HK$million)
Staff Distribution
Geographical Scope
Private 27
Tier 1 12 $8,000 above P75 21,444 HK 0 P50 11,350 HK/China 5 P25 4,636 Region 3 Ave 18,551 Global 4 Tier 2 7 $4,000 - $7,999 P75 8,815 HK 1 P50 2,200 HK/China 4 P25 1,799 Region 1 Ave 5,914 Global 1 Tier 3 8 $2,000 - $3,999 P75 2,350 HK 4 P50 1,540 HK/China 3 P25 1,093 Region 0 Ave 2,205 Global 1
Professional Services
20
Tier 1 4 $1,000 above Ave > 2,000 HK/China, Regional
Tier 2 8 $400 - $999 P75 1,275 HK 0 P50 715 HK/China 4 P25 683 Region 4 AVE 1,170 Global 0
Tier 3 8 $100 - $399 P75 350 HK 1 P50 245 HK/China 6 P25 178 Region 1 AVE 285 Global 0
Public Sector 9
Tier 1 2 $8,000 above Insufficient data HK 1 Global 1 Tier 2 3 $4,000 - $7,999 Ave 13,282 HK 2 HK/China 1 Tier 3 4 $500 - $3,999 P50 625 HK 3 Ave 1,737 Global 1

Phase I Report – Remuneration of Principal Officials
11
25. As discussed in paragraph 16 above, the revenue ranges that define the tiers are much smaller for professional services firms than for private and public sector organisations. This is consistent with Hay Group’s approach to recognizing differences in value added when comparing executive positions across different organisations. In the analyses that follow, professional firms will be clustered together with private and public sector corporations in the three tiers.
26. To preserve confidentiality of both corporate and individual pay information, the names of organisations in each tier will not be reported.
Methodology Compensation information
27. Compensation information from participating companies was collected directly from the executive or from a person designated by the executive. Wherever possible, Hay Group sought exact information – current base salary and allowances, most recent payments of bonuses or grants of stock options.
28. Managing partners in some professional firms do not receive base salaries – only an annual distribution of profits based on the size of their holding in the company. These amounts were categorized as short-term incentive.
Long-term incentives
29. Long-Term Incentives (LTI) are incentive arrangements designed to reward an individual for performance over a period of more than one year. Generally, the compensation value of these plans is dependent upon future performance – of the individual, the company, or the stock price of the company.
30. Appendix 2 contains definitions of different forms of LTI. The most common form of LTI is the stock option, but the survey also identified executives receiving grants of restricted shares and performance units. Appendix 2 also contains definitions of terms such as grant, exercise and vesting that are important in understanding and valuing long-term incentives.
31. Long-term incentives may be valued in two ways - by assessing the actual gains received when the incentive is vested and exercised or received, or by estimating the value of the incentive at the time of grant. Because actual gains realised in a given time period can be affected by the state of the markets as well as individual choices, we recommend the second approach as being a more reliable, stable measure of the value of incentives.

Phase I Report – Remuneration of Principal Officials
12
32. The methodology for valuing long-term incentives is described in Appendix 2. Where possible, Hay Group obtained details about long-term incentive grant size, frequency of grants, and the vesting schedule from survey participants. Hay Group also supplemented this with information from annual reports when applicable. Where details were not available we have used standard assumptions for valuing the long-term incentives.
Retirement valuation
33. In most cases, respondents are able to provide a specific percentage for the employer’s contribution to provident fund or contract gratuity. This amount is multiplied by base salary to determine the amount of contribution that is made on the executive’s behalf. In defined benefit final salary schemes, Hay Group used a standard adjustment (shown in Appendix 3) to convert the final salary factor into an annualized employer contribution.
Treatment of Benefits and Perquisites
34. The focus of the survey is on cash and deferred cash elements of pay, including retirement schemes. Other benefits include medical insurance and life insurance, whilst major perquisites include cars, clubs, and leave allowances (including class of travel). Whilst these benefits and perquisites are important, it is relatively difficult for survey participants to provide information on the cost or value of these items and the added difficulty could reduce participation levels. Therefore the survey only asked information to establish prevalence of these benefits and, in some cases, policy levels (e.g., name of club, model of car, class of leave travel).
35. Prevalence information on these non-cash benefits is sufficient for the purposes of this study. Existing government policy on perquisites and benefits for principal officials, including days of annual leave, will likely prevail for appointed principal officials as well. Lack of competitiveness of perquisites, if any, is not expected to be a serious deterrent to qualified and interested candidates, and it is not anticipated that additional cash compensation in lieu of perquisites will be considered.
Dividends
36. Some CEOs have significant shareholdings in their companies. Hay Group have identified these cases and obtained the amount of these holdings and dividends paid from 2000 annual reports or from the respondents, where information is available. It was not possible to obtain this information for all participants in the survey, particularly where the participant is a controlling shareholder who exercises control through an unlisted company, or where the executive holds shares in an unlisted subsidiary.

Phase I Report – Remuneration of Principal Officials
13
Compensation Items and Aggregates
37. Information from the survey was analyzed for detailed remuneration items (base salary, allowances, short-term incentives, long-term incentives, retirement) as well as aggregates (total earnings, total direct compensation, and total remuneration). The aggregates are defined in Appendix 3.
38. Information from the survey was analyzed by percentiles and averages. These terms are also defined in Appendix 3, which also shows the minimum number of cases required to show results for a given percentile. To preserve confidentiality of individual pay information, Hay Group will not report remuneration information unless there are sufficient numbers of individuals in the analysis. For example, Hay Group will report average values of remuneration if there are at least three individuals in the analysis, and will report values of the 75th percentile if there are at least eight individuals in the analysis.
Results of Remuneration Survey 39. Exhibit 4 shows results of the remuneration survey for all sectors by
tier. To minimise the impact of extreme values on the calculation of average, the highest and lowest paid individuals were excluded in calculating the average values. However, these cases are included in the percentile analysis, which is less sensitive to the impact of extreme values. Exhibit 5 shows a similar analysis for each sector.
40. Total Earnings represents the total cash income received as an employee of an organisation. It includes base salary, housing allowances or housing provided in-kind or as rental reimbursement, and annual variable bonuses. This amount also includes profits shared by a partner, such as a partner of a law firm or an accounting firm.
41. Total Direct Compensation includes Total Earnings plus the annualized value of long-term incentives, and Total Remuneration includes Total Direct Compensation plus retirement contribution.
42. Total Remuneration does not include the following factors, which are generally not differentiating factors in pay at the executive levels: medical and life insurance; cars and drivers; leave passage allowance; and other perquisites or benefits such as club membership or children’s education. Hay Group has separately examined the prevalence of these items.
43. The amounts given in Exhibits 4 and 5 for each element or aggregate of compensation is based on all individuals in the analysis, whether or not they receive that element. The exhibit shows the number of individuals who receive a particular element. For example, only 42

Phase I Report – Remuneration of Principal Officials
14
out of 56 individuals participate in a retirement scheme – therefore the values for P25 and P10 are near or equal to 0.
Impact of Dividends
44. Hay Group was able to estimate that the chief executives of approximately 11 out of the 27 private sector firms received some amount of dividends through share ownership. In the nine cases that Hay Group was able to ascertain the amounts of the dividends, they ranged between HK$18,000 and several hundreds of millions of dollars.
45. The average value of total remuneration including these dividends is more than three times the average value of total remuneration excluding dividends. Because of the high variability in the magnitude of dividends, interpretation of these results is difficult and Hay Group has therefore not reported these statistics.

Phase I Report – Remuneration of Principal Officials
15
Exhibit 4: Remuneration Analysis - All Organisations by Tiers Statistics
Base Salary
Housing
Guaranteed Cash
Compensation
Short-Term Incentives (% of Base)
Short- Term
Incentives
Total
Earnings
Long-Term Incentives (%
of Base)
Long- Term
Incentives
Total Direct
Compensation
Retirement (% of Base)
Retirement
Total
Remuneration (HK$000) (HK$000) (HK$000) (%) (HK$000) (HK$000) (%) (HK$000) (HK$000) (%) (HK$000) (HK$000)
All Organisations Total Orgs: 56 P90 5,450 1,800 6,486 158% 9,672 12,225 47% 1,178 12,225 24% 934 12,999 P75 3,790 1,326 4,436 76% 3,956 7,760 17% 593 9,028 18% 455 9,404 Median 2,370 474 3,500 34% 1,427 5,570 0% 0 6,045 10% 211 6,658 P25 1,785 0 2,084 0% 456 4,397 0% 0 4,397 4% 53 4,738 P10 0 0 350 0% 0 2,309 0% 0 2,615 0% 0 2,980 Average 2,819 667 3,486 101% 2,965 6,451 14% 438 6,889 10% 317 7,207 No. Orgs. 49 30 50 42 49 56 22 22 56 42 42 56 Tier 1 Organisations (Private/Public sector: Revenue > HK$8b; Professional Services: Revenue > HK$1b) Total Orgs: 18 P90 7,393 1,970 7,770 423% 13,530 15,015 58% 1,675 15,015 23% 1,036 15,255 P75 4,190 1,725 5,840 103% 6,861 11,529 27% 699 11,954 20% 529 12,866 Median 2,320 1,260 3,681 54% 2,398 7,408 0% 0 8,523 10% 360 8,774 P25 2,089 0 3,040 16% 1,435 5,136 0% 0 6,367 5% 153 6,742 P10 0 0 924 0% 1,151 4,996 0% 0 5,256 0% 0 5,512 Average 3,092 1,055 4,147 92% 4,069 8,217 22% 708 8,925 11% 377 9,302 No. Orgs. 15 12 16 12 18 18 6 6 18 14 14 18 Tier 2 Organisations (Private/Public sector: HK$4b < revenue < HK$8b; Professional Services: HK$400m < revenue < HK$1b) Total Orgs: 18 P90 5,090 1,006 5,090 112% 8,184 11,221 30% 1,156 11,376 22% 663 11,588 P75 3,870 574 4,320 56% 3,332 7,415 13% 567 7,716 12% 310 8,348 Median 2,690 0 3,667 39% 1,207 5,820 0% 0 6,284 8% 199 6,378 P25 2,028 0 2,240 16% 774 4,284 0% 0 4,309 1% 18 4,711 P10 490 0 490 0% 270 2,948 0% 0 3,005 0% 0 3,195 Average 2,942 342 3,284 129% 2,937 6,221 12% 393 6,614 9% 275 6,889 No. Orgs. 16 7 16 15 17 18 8 8 18 13 13 18 Tier 3 Organisations (Private/Public sector: HK$2b/HK$500m <revenue<HK$4b; Professional Services: HK$100m <revenue<HK$400m) Total Orgs: 20 P90 4,450 1,620 6,131 125% 5,550 7,960 37% 669 9,149 25% 884 9,562 P75 2,850 1,208 3,734 63% 2,057 5,798 17% 380 5,798 14% 342 6,690 Median 2,050 490 2,357 11% 716 4,819 0% 0 4,960 9% 205 4,998 P25 1,670 0 1,800 0% 0 2,311 0% 0 2,766 4% 57 3,144 P10 1,053 0 1,512 0% 0 2,027 0% 0 2,146 0% 0 2,149 Average 2,459 627 3,086 89% 2,005 5,091 10% 239 5,329 10% 304 5,633 No. Orgs. 18 11 18 12 14 20 8 8 20 15 15 20
Note: Highest and lowest paid individuals are excluded when calculating averages, but are included in calculating percentile values.

Phase I Report – Remuneration of Principal Officials
16
Exhibit 5: Remuneration Analysis - All Organisations by Sectors Statistics
Base Salary
Housing
Guaranteed Cash
Compensation
Short-Term Incentives (% of Base)
Short- Term
Incentives
Total
Earnings
Long-Term Incentives (%
of Base)
Long- Term
Incentives
Total Direct
Compensation
Retirement (% of Base)
Retirement
Total
Remuneration (HK$000) (HK$000) (HK$000) (%) (HK$000) (HK$000) (%) (HK$000) (HK$000) (%) (HK$000) (HK$000)
Private Sector Total Orgs: 27 P75 4,264 1,550 5,030 102% 3,200 7,978 27% 1,008 9,222 18% 713 10,007 Median 2,800 1,153 4,109 71% 1,725 6,387 9% 282 7,257 10% 281 7,539 P25 2,206 0 3,487 29% 1,195 5,007 0% 0 5,189 7% 204 5,510 Average 3,454 922 4,376 91% 2,483 6,859 24% 770 7,630 12% 408 8,038 No. Orgs. 27 17 27 25 25 27 15 15 27 25 25 27
Professional Services Sector Total Orgs: 20 P75 1,950 582 2,385 41% 7,637 7,967 5% 150 7,967 10% 193 7,967 Median 1,440 0 1,785 6% 2,298 5,281 0% 0 5,500 3% 35 5,638 P25 0 0 0 0% 288 2,771 0% 0 2,924 0% 0 3,188 Average 1,281 372 1,653 147% 4,479 6,132 8% 140 6,272 5% 108 6,380 No. Orgs. 13 9 14 11 18 20 6 6 20 10 10 20
Public Services Sector Total Orgs: 9 P75 6,000 900 6,090 25% 1,100 6,090 0% 0 6,090 25% 578 7,050 Median 3,640 0 4,400 19% 750 5,500 0% 0 5,500 23% 533 6,000 P25 2,478 0 3,413 0% 0 4,128 0% 0 4,128 7% 210 4,697 Average 4,220 577 4,798 17% 669 5,467 - - 5,598 15% 496 6,095 No. Orgs. 9 4 9 6 6 9 1 1 9 7 7 9
Note: Highest and lowest paid individuals are excluded when calculating averages, but are included in calculating percentile values.

Phase I Report – Remuneration of Principal Officials
17
Analysis
46. Exhibit 6 summarizes the differentials in average Total Remuneration between the three tiers. The table shows the expected pattern of lower pay as size of organization decreases.
Exhibit 6: Comparison of Total Remuneration Averages (All Sectors, All Size = 100%)
All Organisations
Tier 1
Tier 2
Tier 3
All Sectors 100% 129% 95% 78% 47. Exhibit 7 shows the mix of compensation by tier and by sector, where
average Total Remuneration in each category equals 100%. The exhibit shows that both short-term and long-term incentive payments increase in importance as size of organisation increases. Public sector organsations have significantly less compensation at risk than private sector organisations. The short-term variable compensation for professional services firms is very high because those organized as partnerships may not pay a base salary to managing partners at all.
Exhibit 7: Remuneration Mix by Tier and Sector (Average Total Remuneration = 100%) All
Organisations
Tier 1
Tier 2
Tier 3 All Sectors Base 39% 33% 43% 44% Allowance + Rental 9% 11% 5% 11% STI 41% 44% 43% 36% LTI 6% 8% 6% 4% Retirement 4% 4% 4% 5% Private Sector Base 43% Allowance + Rental 11% STI 31% LTI 10% Retirement 5% Professional Services Sector Base 20% Allowance + Rental 6% STI 70% LTI 2% Retirement 2% Public Sector Base 69% Allowance + Rental 9% STI 11% LTI 2% Retirement 8% Note: Percentages may not add to 100% due to rounding.

Phase I Report – Remuneration of Principal Officials
18
48. Exhibit 8 shows the prevalence of different LTI schemes amongst all organisations. Stock options are by far most common, with performance units as the next most common scheme.
Exhibit 8: Prevalence of Long-Term Incentive Schemes Plan Type
Prevalence
Stock Options 14 Performance Unit 2 Restricted Stock 3 Stock Option and Performance Unit 3
49. Exhibit 9 shows the prevalence of typical benefits and perquisites, by sector. Whilst medical and life insurance benefits are common, some companies do not provide these benefits, including professional service partnerships. Cars (almost always including driver for work-related trips) are very common, but some firms that take total remuneration approaches or partnerships who remunerate through profit distribution do not provide this perquisite.
Exhibit 9: Prevalence of Benefits and Perquisites Benefit/Perquisite
All Sectors
Total Participants 56 Retirement (including gratuity) 42 companies Contribution rate (excluding orgs providing only statutory MPF contribution)
0% (14) 5%-9% (14)
10%-14% (13) 15%-20% (4)
20%-25% (11) Life Insurance 44 Medical 53 Leave Passage 26 Class of Travel First (12), Business (9), Economy (3), Not Reported (2) Car 45 Most Common Car Models Benz S-class, BMW 7-series, Jaguar Sovereign, Lexus 400 Driver (work) 42 Driver (personal use) 21 Clubs 38 Number of clubs 1 (14), 2 (13), 3 or more (8), Not Reported (3) Children’s Education 18

Phase I Report – Remuneration of Principal Officials
19
Part II. Review of Overseas Practices Selection of Countries for Inclusion in International Review 50. The purpose of the review is to understand practices for determining
ministerial pay in other countries. Senior Hay Group consultants familiar with policies in each country have prepared reports for each country.
51. Hay Group recommended selecting countries on the following basis:
• They represent a range of approaches to determining remuneration for ministerial positions
• They have different political systems and arrangements • Information on the process and basis for determining pay levels is
mostly available to the public
52. The potential list of countries is large. Hay Group has selected a number of countries with different practices for in-depth review. These countries include Australia, Canada, Finland, Netherlands, New Zealand, Singapore, United Kingdom and United States.
Overview of Practices
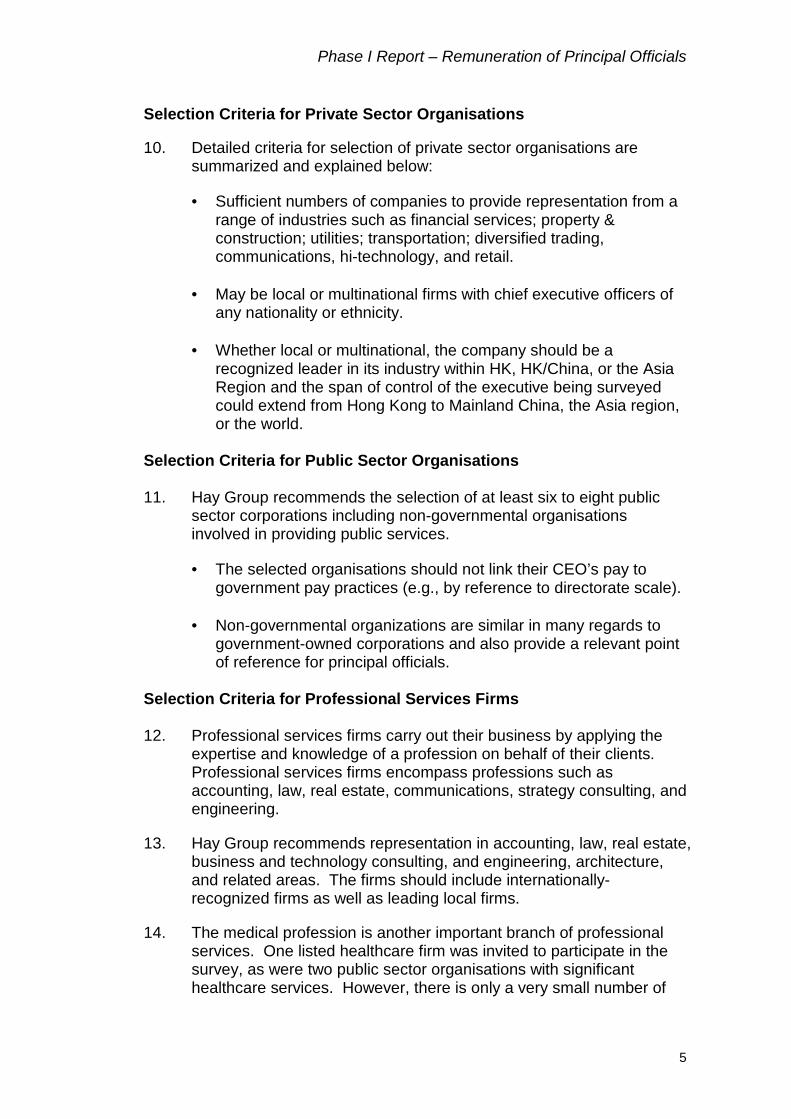
53. Exhibit 10 provides summary of the philosophy, policies, and practices applied by each country in determining remuneration of ministerial positions. Full reports are provided in Appendix 4.
54. The typical practice in countries such as UK, New Zealand, Canada, and Australia is that pay is recommended by an independent commission, who are concerned primarily with providing a reasonable remuneration when compared to members of parliament and other public sector jobs. In these countries, it is acknowledged that pay lags considerably behind private sector practices and it is viewed as politically infeasible to establish a closer relationship. It is also generally acknowledged that there are non-financial rewards to serving in government.
55. Finland and Netherlands have established a comparison either to civil service or even to a multiple of the minimum wage. The US does not have an established review system other than the political process.
56. Singapore is unique in targeting competitive levels of the private sector. The pay level for the entry level of minister is set by applying a discount factor to the median of a group of 48 top paid individuals from the private and professional services sectors. Remuneration progresses through the ministerial ranks up to the prime minister’s pay level.

Phase I Report – Remuneration of Principal Officials
20
57. It is a common issue that politicians (and by extension, ministers) are viewed as too well paid for what they do, even though it is clear when assessed by professionals in the field that they are paid far less than private sector executives having similar or lesser responsibilities.

Phase I Report – Remuneration of Principal Officials
21
Exhibit 10: Summary of Country Practices History Process Factors Structure Australia The Remuneration and Allowances Act 1990 linked the salary for Senators and MPs to minimum award salary of a middle ranking senior executive in the Australian Public Service. In turn, the salary of Principal Executive Officers are determined by a Remuneration Tribunal.
The Remuneration Tribunal is an independent statutory body that determines remuneration for key Commonwealth offices. The Tribunal reviews salaries annually, though it does not always recommend changes. The recommendations of the Tribunal are noted by Parliament.
In considering remuneration and allowances of MPs, the Tribunal considers • The nature of the jobs that they
perform • The conditions under which the
work is performed • How the job compares with
similar jobs in other sectors (with particular emphasis on relativity between federal, state and local positions)
• The principles governing workplace relations policies.
The package for PM and ministers is comprised of base salary and a complex system of allowances related to costs of operating an office and travelling between Canberra and the home constituency. Pay for PM and ministers is set equal to the MP pay plus a pay differential related to the relative complexity of the positions.
Canada Until the early 1990s, MPs reviewed and revised their own pay. Because of negative public reaction, reviews were infrequent and ad hoc. In 1993, the federal government commissioned an outside review of MPs remuneration resulting in recommendations on reference points and process for establishing remuneration levels.
Under law, an independent commission must be formed within six months of each general election to review compensation of MPs. The most recent review was completed in Spring 2001 after the November 2000 general election. The commission’s recommendations were approved by Parliament and establish a linkage between pay for PM and the Chief Justice.
The PM’s total remuneration is set equal to the Chief Justice total remuneration. All cabinet ministers will be paid 74% of the PM’s remuneration, and MPs will be paid 50% of the PM’s remuneration. Remuneration will be adjusted annually for inflation, equal to the Industrial Aggregate inflation rate – the same factor used to adjust the pay of the Chief Justice.
MPs receive a base salary, pension, insurance, and severance allowance upon leaving office based on service, as well as liberal free air and rail travel provisions to visit their constituents. The retirement arrangements are generous by comparison to private sector, since they are credited with 3% to 4% per year of service. No elected official receives any housing privilege, with the exception of certain government-owned residences set aside for the prime minister and others.
Phase I Report – Remuneration of Principal Officials
22
Exhibit 10, continued: Summary of Country Practices History Process Factors Structure Finland Parliament provides the statutory basis for the State’s personnel and labor-market policies and approves the basic guidelines and agreements on personnel policy. Pay for ministers is a combination of the system for civil servants and for members of parliament.
The salary schedules and other employment terms of State employees are agreed in the Collective Agreement for State Civil Servants and Employees under contract. Increases have usually followed the rate of inflation according to provisions set down by law. Annual adjustments of salary form part of the government’s operating budget, which is subject to parliamentary approval.
In the State salary schedule, the ministers are positioned in grade 34 (of 36) and the prime minister's salary is 20 % higher. Salaries are increased if the collective agreement gives an increase in this grade.
The pay practices in the private sector do not directly influence on civil servants’ or ministers' salaries.
The remuneration of the civil servants and ministers are based on a ranking determined by Parliament and consists of: Basic salary and Age allowance Ministers also receive compensation of costs relating to expenses of performing the role.
Netherlands In the 1980s a rule was formulated that ministers, including the prime minister, should not earn more than six times the minimum wage. In fact, the ratio has been increased somewhat but the principle of the rule is still in place.
There is no independent review body for setting pay, and salary adjustments follow civil service collective bargaining agreements. Parliament is accountable for determining remuneration policies and practices, but it has not been discussed in many years.
For civil servants, a collective labour agreement is negotiated by the Ministry of the Interior with the labour unions. The negotiated pay rise is then also applicable to the MPs and ministers. Besides the rule on multiples of the minimum wage, there are no guidelines or policies about determination of remuneration for ministers.
Compensation for ministers consists of a fixed base salary and expense allowances. They are participants in the civil service retirement scheme.

Phase I Report – Remuneration of Principal Officials
23
Exhibit 10, continued: Summary of Country Practices History Process Factors Structure New Zealand In 1973, the Royal Commission upon Parliamentary Salaries and Allowances established that the occupation of an MP is virtually full-time and professional, that the role of MP is the sole source of income, and that there are sacrifices made by the MP and his or her family that must be recognized in determining remuneration.
The Higher Salaries Commission is accountable for determining pay of ministers, MPs, and senior officials of the government. HSC comprises three independent commissioners appointed by the Governor-General for three-year terms. The HSC conducts reviews annually and its recommendations are implemented without parliamentary review.
The HSC must set remuneration having regard to the requirements of the job and the conditions and remuneration paid to those in comparable positions, taking into account: • the need to achieve and maintain
fair relativity with the levels of remuneration received elsewhere;
• the need to be fair both- to the persons whose remuneration is being determined and to the taxpayer; and
• the need to recruit and retain competent persons.
Pay consists of base salary plus a range of specific non-taxable allowances. Some of these allowances may be considered remuneration – housing for ministers, basic allowance, whilst some – consituency allowance - are intended to serve as reimbursements of costs incurred in the service of constituents. This structure is inconsistent with private sector practice as encouraged by government policy and is now subject of discussion.
Singapore The current system is based on a 1994 White Paper on Competitive Salaries for Competent and Honest Government. The system was established to ensure that Officers in key government positions are paid salaries that are competitive with those of professionals in the private sector.
A review is conducted by the Public Service Division every five years, with the last review being conducted in July 2000. The results of the review are debated at Parliament and a bill must be passed to implement the recommendations. Administrative Service salary levels are adjusted annually based on the recommendation of the National Wage Council. The NWC is made up of officials, industry leaders, and private sector representatives.
Pay is based on establishing a competitive position with the private sector, specifically top earners from six professions - Bankers, Engineers, Accountants, Lawyers, CEOs of Multinationals and CEOs of local manufacturing firms. Pay for the first level of minister is set at 2/3 the Median Principal income of the top eight individuals from each of the six professions. The pay for Administrative Service – Superscale G is set at the pay of the 15th highest paid person who is 32 years old and belongs to the six professions above.
Remuneration is comprised of Base Salary, GDP-Related Bonus and Performance Bonus. Base salary represents 60% of total remuneration, and the Annual Variable Component and the Performance Bonus represent 40% of Total Remuneration. Annual variable component is based on performance of the Singapore economy, and the Performance Bonus is based on individual performance rating.

Phase I Report – Remuneration of Principal Officials
24
Exhibit 10, continued: Summary of Country Practices History Process Factors Structure United Kingdom The process and principles of remuneration for ministers in UK has been broadly stable for many years. Work in Government or Parliamentary office is considered to bring rewards other than salary. Nevertheless, ministerial pay should be reasonably competitive to public sector pay levels.
Every three years, the PM commissions the Senior Salaries Review Body (SSRB) to review ministerial and parliamentary pay allowances. The SSRB also reviews pay of senior civil servants, equivalent ranks in the armed forces, and the judiciary. Recommendations are provided to the PM who then decides when to publish the paper and present it to Parliament for debate. Pay levels and pension arrangements for ministers and members of Parliament have to be agreed by the House of Commons, as have MPs’ office and staff support allowances.
The SSRB seeks to ensure that pay and pension levels are sufficient that suitable candidates are not deterred from entering public life and has attempted to ensure that ministeral pay remains broadly comparable to that of relevant positions in various parts of the public sector. It is accepted that tracking private sector practices, even on base salaries, is not practical in the UK. In the interim of major reviews, ministerial pay is adjusted according to inflation in line with civil service adjustments.
Pay is limited to a fixed base salary, a pension, and the use of facilities (including in many cases accommodation) which are ‘attached’ by custom and practice to specific offices. There is also a system of allowances which are intended to compensate for expenses related to performance of the duties of a minister or member of parliament. Examples of allowances include secretarial support, research support, office running costs, transportation to home constituency, and housing allowance if home constituency is not in London area.

Phase I Report – Remuneration of Principal Officials
25
Exhibit 10, continued: Summary of Country Practices History Process Factors Structure United States Salaries of top-level Executive Branch officials of the U.S. Federal government are statutorily linked to the salaries of Members of Congress who are responsible for setting pay for these positions. The framers of the Constitution placed the responsibility of setting pay of the top-level Executive Branch officials, as well as its own and of the President, to Congress. Congress enacted the Ethics Reform Act of 1989 due to growing concern over the Federal government’s ability to recruit highly qualified replacements. The Act restored two cost-of-living adjustments, comparability pay adjustment, and amended the Federal Salary Act and the Adjustment Act in two respects: • establishing a Citizens’
Commission on Public Service and Compensation and
• revising the mechanism for fixing the annual pay adjustments for judges, Members of Congress and top-level Executive officials.
This process has never become functional because no funds have ever been appropriated.
Federal employees are classified into categories according to position. The top-level Executive Branch officials are under the Executive Schedule pay system, which is a five-tier structure from Level I (highest salary) through Level V (lowest salary). Their salary is linked to the salary of the Members of Congress who are responsible for setting the pay of these top-level officials. The President presents salary recommendations for the top-level officials and these are either approved or rejected by Congress. By law, Executive Schedule pay is supposed to rise each year at the same rate as other Federal government employees (who are on the General Schedule), but Congress has voted each year to block Executive Schedule raises since 1993, except for 1998, 2000 and 2001.
Under current law, there are three ways to adjust pay of top-level officials: (1) allow automatic and annual pay
adjustments based on changes in the Employment Cost Index (ECI);
(2) adopt pay raises recommended by the President to Congress, based on the report of the Citizens’ Commission to review and consider salaries of high-level Federal officials; or
(3) pass special legislation authorizing a pay raise.
Private sector pay practices are not reviewed nor do they influence the pay levels of top-level Federal officials.
There is no variable compensation or non-accountable allowances. In addition, these officials are not provided with housing or housing allowances and no other significant benefits are provided. Federal executives, including Members of Congress and Cabinet Secretaries, are covered by the benefits package that applies to all Federal employees. The most important parts of the package are: • A contributory retirement plan
that pays approximately two-thirds of salary for a full career (35 years of service). Officials can first retire from 55 to 62 depending on years of service.
• A choice of health plans that reimburse about 80 percent of covered health care expenditures. The health plan eligibility is carried into retirement.
• A life insurance plan providing a benefit approximately equal to salary.
• Annual leave of up to six weeks a year depending on service.

Phase I Report – Remuneration of Principal Officials
26
International Ministerial Remuneration Comparisons
58. Exhibit 11 summarizes the pay levels of ministers, members of parliament or congress, and top levels of the civil service for the selected countries. The exhibit shows that, excluding Singapore, ministerial pay ranges from HK$640,000 (Finland) to HK$1,877,000 (UK prime minister) or HK$3,120,000 (US President). Singapore is exceptional, with pay rates for the prime minister at over HK$8.6m and for a cabinet-level minister at over HK$6.1m.
59. The table indicates that, except for Singapore and the US, prime minister pay varies between 84% and 100% of the top civil servant’s pay. Cabinet minister pay varies between 60% and 100% of this reference level. Among the selected countries, only Singapore and US pay higher for cabinet level positions than for top civil servants. In the other countries, most cabinet ministers are members of parliament. In US cabinet secretaries are appointed by the President and are not members of Congress. In Singapore, some ministers are members of Parliament but many are appointed from private sector, other public sector corporations, or from the civil service.
60. Besides receiving salaries, ministers in many of the countries also receive allowances. These allowances are intended to compensate for costs incurred in performance of duties of the job, so are not considered remuneration and are excluded in Exhibit 11. An example of a reimbursement-related allowance would be travel allowances to compensate an MP or minister for travel costs between the capital and his or her home area. However, some of the allowances paid to New Zealand ministers do not appear to be cost reimbursements and have been included as remuneration in the analysis.

Phase I Report – Remuneration of Principal Officials
27
Exhibit 11: International Comparison of Ministers’ Remuneration to Top Civil Servants (HK$000) (1) Australia Canada Finland Netherlands New Zealand Singapore UK US
Prime Minister 1,031 1,326 768 812 1,018 (4) 8,658 (5) 1,877 3,120 (6) Minister (2) 684 982 640 812 722 (4) 6,165 (5) 1,362 1,258 MP 396 663 480 619 333 (4) 732 (5) 588 1,132 Civil Servant 396 –
2,070 (3) 1,436 852 815 1,205 3,910 (5) 1,929 1,043
PM as % of Top Civil Servant
83% (7) 92% 90% 100% 84% 221% 97% 299%
Minister as % of Top Civil Servant
55% (7) 68% 75% 100% 60% 158% 71% 121%
Notes: (1) Exchange rates as of August 30, 2001 (2) Minister – Cabinet level minister. Australia has higher level for Treasurer, Singapore has higher level for deputy prime minister. These levels not
shown. (3) Australia principal executive officer pay is set individually based on relative work value of jobs. (4) New Zealand includes cash allowances that are viewed as remuneration (e.g., day allowances, housing allowances where it is not considered
necessary to maintain two homes to serve a local constituency). For other countries, most allowances related to expenses of public service and are not included.
(5) Singapore remuneration includes targeted total earnings levels. (6) US President base salary; also receive US$50,000 expense allowance and US$100,000 travel allowance in addition to official travel. (7) Australia relative percentage based on midpoint of range for Australia Principal Executive Officers, or A$300,000 per annum.

Phase I Report – Remuneration of Principal Officials
28
Appendix 1: List of organisations selected for invitation to survey Private Sector Organisations Organisation Industry Group A S Watson Retail and wholesale distribution and trading AIA Insurance Alcatel China Telecom, IT/HT Allianz Insurance Amway China Consumer Product AT&T Asia Pacific Telecom, IT/HT AXA China Region Insurance Bank of East Asia Financial Services BAT Others Caltex Others Cathay Pacific Airways Ltd Transport Chevalier Construction Construction CITIC Pacific Ltd Diversified Companies CLP Holdings Ltd Utilities CMG Asia Ltd Insurance Dah Sing Financial Group Financial Services Dairy Farm Retail and wholesale distribution and trading DHL International (HK) Transport DuPont China Others Edward Keller Retail and wholesale distribution and trading Esprit Holdings Ltd Retail and wholesale distribution and trading Gammon Construction Construction Giordano Intl Retail and wholesale distribution and trading Goldman Sachs Financial Services Great Eagle Properties Holdings Co. Ltd. Property HACTL Transport HAECO Other Hang Lung Development Co. Ltd Property Hang Seng Bank Financial Services Henderson Development Co. Ltd Property Hong Kong & China Gas Utilities Hong Kong & Shanghai Hotels Other Hong Kong Electric Holdings Utilities Hong Kong Exchanges and Clearing Financial Services Hong Kong Land Co., Ltd Property HSBC Holding Financial Services Hutchison Whampoa Ltd Diversified Companies Hysan Development Co. Ltd Property IBM China / Hong Kong Telecom, IT/HT i-CABLE Communication Ltd Telecom, IT/HT ING Asia Pacific Insurance Jardine Matheson Diversified Companies Johnson Electric Holdings Ltd Retail and wholesale distribution and trading JP Morgan Financial Services K.Wah Group Construction/Architecture/Surveying Kowloon Motor Bus Transport Lam Soon (HK) Ltd Consumer Product
Phase I Report – Remuneration of Principal Officials
29
Appendix 1: List of organisations selected for invitation to survey Private Sector Organisations Organisation Industry Group Li & Fung Ltd Diversified Companies Manulife (Int'l) Ltd Insurance Merck Sharpe & Dohme Others Merrill Lynch Financial Services Modern Terminals Ltd Transport New World Services Diversified Companies New World Telephone Telecom, IT/HT Nortel Networks (Asia Pacific) Telecom, IT/HT OOCL (HK) Ltd Transport Pacific Century Cyber Works Ltd Telecom, IT/HT Pacific Century Insurance Co., Ltd Insurance Pepsi Asia Pacific Others Prudential Corporation Asia Insurance Quality Healthcare Others Shangri-la Asia Ltd Others Shell Others Shui On Properties Ltd Property Shun Hing Electronic Trading Co., Ltd Retail and wholesale distribution and trading Siemens Telecom, IT/HT Sime Darby Group Diversified Companies Sino Land Co., Ltd Property South China Morning Post H Ltd Others Standard Chartered Financial Services Sun Hung Kai Development (China) Property Swire Pacific Ltd Diversified Companies Television Broadcasts Ltd Others UPS Parcel Delivery Service Transport Wharf Diversified Companies Wheelock and Co. Ltd Diversified Companies Wing On Co., Ltd Retail and wholesale distribution and trading

Phase I Report – Remuneration of Principal Officials
30
Appendix 1: List of organisations selected for invitation to survey Professional Firms Organisation Industry Group Accenture Consulting (IT/Strategy/HR) Allen & Overy Legal Andersen Business Consultants Consulting (IT/Strategy/HR) Arthur Andersen Accounting ARUP & Partners HK Ltd Engineering/Architecture/Surveying AT Kearney Asia Pacific Consulting (IT/Strategy/HR) Atkins China Ltd Engineering/Architecture/Surveying Bain & Company (Hong Kong) Consulting (IT/Strategy/HR) Baker & Mckenzie Legal BDO McCabe Lo & Co Accounting Binnie Black & Beatch HK Ltd Engineering/Architecture/Surveying Boston Consulting Group, The Consulting (IT/Strategy/HR) Burson-Marstellar Communications CB Richard Ellis Real Estate Centaline Properties Real Estate Chesterton Petty Real Estate Clifford Chance Legal Colliers Jardine (HK) Ltd Real Estate Deacons Legal Deloitte Touche Tohmatsu Accounting Ernst & Young Accounting Foster Partners Asia Engineering/Architecture/Surveying FPD Savills Real Estate Grant Thornton Accounting Halcrow China Ltd Engineering/Architecture/Surveying Hill & Knowlton Communications J Walter Thompson Communications Johnson Stokes & Master Legal Jones Long LaSalle Real Estate KPMG Consulting Asia Limited Consulting (IT/Strategy/HR) KPMG Peat Marwick Accounting Kwok & YIH Legal Leo Burnett Communications Linklaters Legal Maunsell Consultants Engineering/Architecture/Surveying McKinsey Consulting (IT/Strategy/HR) Ogilvy & Mathers Communications PA Consulting Consulting (IT/Strategy/HR) Parsons Brinckerhoff (Asia) Engineering/Architecture/Surveying Paul, Weiss, Rifkind, Wharton & Garrison Legal Pricewaterhouse Coopers Consulting (IT/Strategy/HR) PricewaterhouseCoopers Accounting Richard Butler Legal Scott Wilson Engineering/Architecture/Surveying Simmons & Simmons Legal Skidmore Owings & Merrill Engineering/Architecture/Surveying Vigers Hong Kong Ltd Real Estate Watson Wyatt Consulting (IT/Strategy/HR) William M Mercer Consulting (IT/Strategy/HR) Woo, Kwan Lee & Lo Legal

Phase I Report – Remuneration of Principal Officials
31
Appendix 1: List of organisations selected for invitation to survey Public Organisations Organisation Industry Group Airport Authority Hong Kong Public Sector HK Trade Development Council Public Sector Hong Kong Housing Society Public Sector Hong Kong Jockey Club Public Sector Hong Kong Monetary Authority Public Sector Hong Kong Mortgage Corporation Public Sector Hospital Authority Public Sector KCR Corporation Public Sector Mandatory Provident Fund Schemes Authority Public Sector MTR Corporation Public Sector The Securities and Futures Commission of HK Public Sector Tung Wah Group of Hospitals Public Sector Urban Renewal Authority Public Sector

Phase I Report – Remuneration of Principal Officials
32
Appendix 2: Overview of LTI Valuation Methodology Long-Term Incentives (LTI) are incentive arrangements designed to reward an individual for performance over a period longer than one year. Generally, the compensation value of these plans is dependent upon future performance – of the individual, the company, or the stock price of the company. Types of Plans Stock Option Plans. Stock option plans provide an individual with the right to purchase a specified number of shares of company stock for a specified price. Performance Unit Plans. These plans are awarded units usually equal to $1.00 with payouts based on performance over a specified period. Awards are expressed as a “target” number and payout varies based on actual performance and is paid in cash. Restricted Stock Plans. In these plans, awards are made in the forms of shares of company stock. Shares are actually transferred to the employee at no cost, but the shares carry restrictions such as prohibitions against disposition or rights of first refusal, and they be subject to substantial risk of forfeiture. Other Terms Exercise – using a stock option grant to purchase a specified number of stock shares for a specified price. Grant Value – the total dollar value of a stock-based award (the number of shares multiplied by the per-share stock price at market value). Grant – the act of transferring the potential value of a long-term incentive program from employer to employee, or the target value of such award at time of conveyance. Vesting – conveying to an employee the legal right to receive the value of a long-term incentive award, regardless of employment status. Methodology Stock Options. Hay Group uses the Expanded Black-Scholes stock option valuation model. The model shows the impact of dividends, vesting schedules, exercise period, and grant frequency on value of options. The table shows inputs into the valuation model and their impact on value – up, down or indeterminate.

Phase I Report – Remuneration of Principal Officials
33
Model Inputs Characteristics Impact on Value Stock Price High ! Low " Exercise Price At market value – Discounted ! Premium " Volatility of Share High ! Low " Dividends High " Low ! Interest Rates High ! Low " Option Term Short " Long ! Vesting Short ! Long " Restricted Stock. The restricted stock valuation begins as outright stock and is then discounted for probability of forfeiture. Probability of forfeiture is based on actuarial data for different types of termination. The table below shows the various inputs into the valuation model and their impact on the value. Model Inputs Characteristics Impact on Value Stock Price High ! Low " Dividends Paid – Not Paid " Vesting Short ! Long " Performance Units. The performance unit valuation is discounted for the time value of money, as well as probability of forfeiture, volatility of performance, and limited upside potential. The probability of forfeiture is carried over the length of the performance period and disposition of grant upon termination. The table below shows the inputs into the valuation model and their impact on the value. Model Inputs Characteristics Impact on Value Maximum Payout Above Target ! At Target " Volatility of Share High " Low ! Performance Period Short ! Long "

Phase I Report – Remuneration of Principal Officials
34
The following table shows the actual valuation factors being used within this study. LTI Features
Factor
Standard Stock Option Assumption:
Vesting schedule - 25% each year for four years (four-year ratable vesting), no performance hurdle, exercise price = 100% fair market value
0.35
Alternative Stock Option Assumptions: Performance hurdle - Example, Earnings per Share must grow by 3% more than inflation for a three-year period
Multiply above factor by 0.6
Infrequent Grants Divide factor above by frequency (e.g., divide by 2 if
granted every other year)
One-off grant Divide factor above by 4 (assume grant made every four
years)
Discount on exercise price: Exercise price = 80% of fair market value on date of option grant
Multiply factor above by 1.28
Performance Share Plan: Vesting schedule: 100% after four years 0.79 Performance Unit Plan: Vesting schedule: 100% after three years
0.59
Small differences in vesting schedule such as three-year vesting or five-year vesting result in small differences in valuation factor, so it is sufficiently accurate for purposes of this study to use one valuation for all stock option schemes.
However, Hay Group will make adjustments where differences in schemes create large value in differences. For example, if there is a discount on the exercise price then the value of the option is much higher than the standard valuation of 0.35. When discounts are applied in Hong Kong, the exercise price is usually 80% of the Fair Market Value on the date of grant.

Phase I Report – Remuneration of Principal Officials
35
The option valuation of 0.35 also assumes that the grants are made annually. Where this is not the case, Hay Group divides by the frequency which significantly reduces the value of the long-term incentive scheme.
Using a similar theoretical approach, Hay Group can also apply a standard valuation factor for Performance Share Plans or Performance Unit Plans. These plans have higher values because the executive does not have to pay the exercise price to obtain the shares or cash payments made upon vesting in these schemes. The valuation factors reflect the probability of remaining an employee until the scheme matures as well as the risk of achieving the performance targets of the scheme. The table below shows an example how the factors were used. In the example, the individual receives a one-off option grant of 1,000,000 shares with a vesting schedule of three years on a ratable basis. The fair market value at time of grant is $10 per share, but the exercise price is set at 80% of the fair market value, or $8 per share. We use the standard valuation factor of 0.35 even though the vesting schedule is slightly better than the standard assumption on vesting schedule. We multiply this factor by 1.28 to reflect the discount on the exercise price relative to the market price when the share was granted, and then divide the result by 4 because it is a one-off option grant (the standard valuation factor applies for an annual grant). The resulting factor of 0.112 is then multiplied by the grant size ($10,000,000) to yield an annualized valuation of $1,120,000. This amount would be included in the total remuneration results of the survey.
LTI Features
Value
Plan features: 33% each year for three years, no performance hurdle, exercise price = 80% fair market value, one-off grant
Grant size – 1,000,000 shares at $10 per share Grant value = 1,000,000 x $10
= $10,000,000 Option valuation factor: Basic valuation factor:
0.35
times premium for discount to fair market value:
1.28
divided by frequency of grant (assume every four years for one-off grant):
4
Overall factor: 0.35 x 1.28 / 4 =
0.112 Annualized option value (as included in survey) $10,000,000 x 0.112 =
$1,120,000

Phase I Report – Remuneration of Principal Officials
36
Appendix 3: Definition of Remuneration Terms Remuneration Components Base Salary. The annual total of monthly base salary payments, including guaranteed bonuses such as 13th month. Housing. Guaranteed cash allowances denominated separately from base salary or the amounts paid directly by the employer for renting accommodation. Guaranteed Cash Compensation. The sum of base salary and housing. This amount represents the cash, or cash equivalent compensation, that the employee receives regardless of performance or other conditions. Short-Term Incentive. Compensation that is paid in relation to performance of the individual or company over a period of one-year or less. Total Earnings. The sum of guaranteed cash compensation plus short-term incentives. Long-Term Incentive. Incentive arrangements designed to reward an individual for performance over a period longer than one year. The amount shown is the annualized value of the grant received in the current year based on a valuation model, not gains realized in the current year. Total Direct Compensation. Total Earnings plus the annualized value of long-term incentives. Retirement. The company cost of contributing to a retirement scheme. Schemes include defined contribution (provident fund), defined benefit (final salary scheme), and contractual gratuity. In cases where only the statutory minimum contribution to MPF is made, these amounts have been excluded.
Provident Fund. Company contribution percentage is used to multiply base salary. Final Salary. Final salary schemes usually take the form of Factor x Final Salary x Number of Years of Service.

Phase I Report – Remuneration of Principal Officials
37
Company contribution percentage is estimated according to the following table:
Final Salary Factor
Employer Contribution Rate
1.50 10.3% 1.75 12.0% 2.00 13.7% 2.50 17.2% 3.00 20.5%
Total Remuneration. Total Direct Compensation plus retirement contribution. Total Remuneration would normally include costs of providing other benefits and perquisites. These items are being considered separately in terms of prevalence. Statistics Compensation levels are defined in terms of percentiles and averages. To protect confidentiality of data, a minimum number of data points are required to calculate a particular percentile. These are also indicated below. P90 (90th percentile, upper decile) – the value that separates the highest ten percent of values from the lower 90 percent of values. At least 13 data points must be present to calculate a decile. P75 (75th percentile, upper quartile, 3rd quartile) – the value that separates the highest 25 percent of values from the lower 75 percent of values. At least 8 data points must be present to calculate a quartile. P50 (50th percentile, median) – the value that separates the upper half of values from the lower half of values. At least 4 data points must be present to calculate the median. P25 (25th percentile, lower quartile, 1st quartile) – the value that separates the lowest 25 percent of values from the higher 75 percent of values. At least 8 data points must be present to calculate a quartile. P10 (10th percentile, lower decile) – the value that separates the lowest ten percent of values from the higher 90 percent of values. At least 13 data points must be present to calculate a decile. Average – the arithmetic mean of all values. At least 3 data points must be present to calculate an average.

Phase I Report – Remuneration of Principal Officials
38
Appendix 4: Summary of Overseas Remuneration Practices for Ministers Summary of Practices on Ministerial Remuneration: Australia History The Remuneration and Allowances Act 1990 linked the salary for Senators and MPs to minimum award salary of a middle ranking senior executive in the Australian Public Service. In turn, the salary of Principal Executive Officers are determined by a Remuneration Tribunal. The Remuneration Tribunal is an independent statutory body that determines remuneration for key Commonwealth offices. The tribunal consists of three part-time members appointed by the Governor-General. Its role is to report on or determine the remuneration of members of the Federal Parliament, additional salaries for ministers and Parliamentary office-holders, and Judges of federal courts, most full-time and part-time holders of public offices and principal executive officers. The Remuneration Tribunal must meet every year to review pay levels, though there will not necessarily be increases in a given year. The Remuneration Tribunal’s recommendations are “noted” by Parliament and could be rejected though that does not normally occur. Factors In considering remuneration and allowances of MPs, the Tribunal considers • The nature of the jobs that they perform • The conditions under which the work is performed • How the job compares with similar jobs in other sectors (public sector, including state
and local government as well as agencies majority funded by government; and private sector including CEO’s and direct reports)
• The principles governing workplace relations policies More specifically, factors considered include: • Work value – the complexity of the work of senators and members, ministers and
parliamentary office holders, their responsibilities and accountabilities, and their contribution to a better governed and more prosperous nation.
• Productivity – the range of duties undertaken by senators and members, ministers and
parliamentary office holders and changes in the quantity and quality of the various key outputs they deliver, including legislative, executive and management outputs.
• Total remuneration – in considering the salaries of senators and members, ministers
and parliamentary office holders, the Tribunal has taken into account their total remuneration package, which includes superannuation and a private-plated motor vehicle.
• Community wage and salary movements and remuneration trends in specific market
segments, especially the public sector. As of July 1, 2001, the tribunal set the minimum pay for a Band 1 principal executive officer at A$95,600 per year and recommended that the pay for an MP be set at that level. This amount is subject to annual adjustment in accordance with the Average Weekly Ordinary Time Earnings index over the pervious 12 months. Band 1 Principal Executive Officers are usually heads of Commonwealth Agencies, or in case of the largest agencies, may be found in the second level. Principal executive officers are on individual contracts. The total

Phase I Report – Remuneration of Principal Officials
39
remuneration of a principal executive officer could range up to A$500,000 per annum, depending on the value of work as determined by the Remuneration Tribunal. Minister’s pay is set relative to this level, taking into account pay and relative work value for other state and federal government officials: Pay Levels (A$) Position Fixed Remuneration (1) Prime Minister $248,560 Deputy Prime Minister $195,980 Treasurer $179,250 Other Cabinet Minister $164,910 Other Ministers $150,570 MP $95,600 Top Civil Servant (2) $95,600 – about $500,000 Note: (1) Fixed remuneration does not include allowances.
(2) For Top Civil Servant, amounts are total cash; a portion may be subject to performance Structure The package for PM and ministers is comprised of base salary and a complex system of allowances related to costs of operating an office and travelling between Canberra and the home constituency. Ministers receive a range of allowances that must be related directly to performance of the job. These allowances are not considered to be remuneration and include:
Capped/Restricted Entitlements Uncapped entitlements Dollar Limit Occurrences Limit Content Limit
• Travelling allowance (other than within own jurisdiction)
• Scheduled travel
• Car transport
• Private vehicle allowance
• Office and residential telephone services
• Personalised letterhead stationery, newsletters and other printed material
• Retirement travel (pre 1 Jan. 1994 entitlements)
• Other non-salary entitlements (per the confidential Ministers of State Entitlements Handbook)
• Salary
• Electorate allowance
• Charter transport
• Information delivery services
• Overseas study trips
• Pooled spouse and dependant travel
• Travelling allowance (within electorate)
• Non-official spouse/nominee and dependent travel
• Retirement travel (post 1 Jan. 1994 entitlements)
• Newspapers & periodicals
• Staff
• Office accommodation, equipment, supplies
• Privately plated vehicles
• Photographic services
• Constituents request program
• Overseas delegations travel
Ministers are also entitled to the most generous defined-benefit superannuation scheme in Australia, paying up to 11.5% into the scheme compared to highest levels in private sector of 9%. MPs can receive an annual pension or a lump sum payment based on the

Phase I Report – Remuneration of Principal Officials
40
accumulated value of the superannuation scheme when leaving service after completing three terms or eight years. Issues Annual pay increases are set in accordance with wage inflation, but public criticism has been harsh whenever there are increases in parliamentary remuneration or allowances. The generous superannuation scheme also has been subject to much controversy.

Phase I Report – Remuneration of Principal Officials
41
Summary of Practices on Ministerial Remuneration: Canada History Until the early 1990s, MPs reviewed and revised their own pay. Because of negative public reaction, reviews were infrequent and ad hoc. The result was the erosion of pay levels relative to market practices over the 1970s and 1980s. The federal government as well as the two largest provincial governments (Ontario and Quebec) decided to experiment with a process that would be less political by involving outside parties. In 1993, the federal government commissioned an outside review of MPs remuneration resulting in recommendations on reference points for establishing remuneration levels: 1. An internal comparison with senior levels of the Federal Public Service (civil service) 2. A basket of reference positions in the Canadian market – mainly in the not-for-profit
sector and a few in the private sector 3. A group of six developed countries, as an international comparison (US, Sweden, UK,
France, Australia and Belgium). The study also recommended that an independent commission be established to undertake further periodic reviews. Process Under law, an independent commission must be formed within six months of each general election to review compensation of MPs. The most recent review was completed in Spring 2001 after the November 2000 general election. The commission’s recommendations were approved by Parliament and establish a linkage between pay for PM and the Chief Justice. The pay for Chief Justice is reviewed every four years (next in 2003) by an independent commission consisting of • One member appointed by the Minister of Justice • One member appointed by the Judicial Council, and • One member, who will serve as Chairman, selected by the other two appointed
members. The commission determining Chief Justice pay does not disclose the criteria used in reaching its decisions, nor does it disclose what market references may be used in the process. Parliament must approve the changes proposed for Chief Justice unless a concrete reason can be cited. If the package is rejected, then the issue would be settled in the courts. As a consequence of these recommendations, the commission on minister’s pay has passed accountability for setting the exact level of the PM’s remuneration to the commission on remuneration for the judiciary. Factors The PM’s total remuneration is set equal to the Chief Justice total remuneration. All cabinet ministers will be paid 74% of the PM’s remuneration, and MPs will be paid 50% of the PM’s remuneration. The relative levels of pay are the judgement of the commission and the precise factors leading to these recommendations are not public information. Remuneration will be adjusted annually for inflation, equal to the Industrial Aggregate inflation rate – the same factor used to adjust the pay of the Chief Justice.

Phase I Report – Remuneration of Principal Officials
42
Structure MPs receive a base salary, pension, insurance, and severance allowance based on service, as well as liberal free air and rail travel provisions to visit their constituents. The severance allowance, which is equal to 50% of a year’s salary, is paid to MPs or ministers upon losing their seats unless they have served more than six years, in which case they are eligible to receive a pension. The retirement arrangements are generous by comparison to private sector, since they are credited with 3% to 4% per year of service (depending on year they were originally elected). No elected official receives any housing privilege, with the exception of the government-owned residences set aside for the prime minister, official leader of the opposition, and the speaker of the House of Commons. The only other significant perquisite for PM and cabinet ministers is chauffeur-driven car and use of government-owned jets for official business. Pay Levels (C$) Position Fixed Remuneration Performance-Related Pay Prime Minister $262,900 - Minister $194,600 - MP $131,400 - Top Civil Servant $209,300 - $246,300 25% of base Note: Fixed remuneration does not include allowances. Issues Whilst pay levels for politicians including ministers are much lower than private sector, public perception remains that they are overpaid. Despite the establishment of the independent commission, public perception has remained unfavorable. The new arrangement – reference to Chief Justice pay – may help to resolve some of those perceptions. The province of Ontario is now reviewing legislation to give the Provincial Integrity Commissioner the complete and final authority for setting pay levels for the provincial premier, ministers, and MPs. These recommendations will not be subject to any political review and cannot be ignored or overridden. This experiment may serve as a model for determination of remuneration at federal levels as well.

Phase I Report – Remuneration of Principal Officials
43
Summary of Practices on Ministerial Remuneration: Finland History As the holder of legislative and budgetary powers, Parliament provides the statutory basis for the State’s personnel and labor-market policies and approves the basic guidelines and agreements on personnel policy. Since the 1980’s the Government has taken a more prominent role in drafting the central guidelines of State’s employer and personnel policy. Successive Government programs have also occupied a more visible role in decision-making. Pay for ministers is a combination of the system for civil servants and for members of parliament. Process The salary schedules and other employment terms of State employees are agreed in the Collective Agreement for State Civil Servants and Employees under contract. The contract is made between the State Employer's Office and the trade unions concerned. The state salary schedules are reviewed usually once a year. The increases have usually followed the rate of inflation and the government may also adjust taxation policies so that the level of real income is maintained.
The positions of senior civil servants in the ministries are based on legislation. When the position is established its title and the grade in the State salary schedule is determined. The State salary schedules, detailing also the age bonuses and cost of living compensation, are reviewed by grades.
The position of ministerial positions in the State salary schedule is set by law, whilst the annual adjustment process is set down in law. The contract agreed between the State Employer’s Office and the trade unions forms part of the budget, which is reviewed by Parliament.
Factors and Structure In the State salary schedule, the ministers are positioned in grade 34 and the prime minister's salary is 20 % higher. Their salaries are increased if the collective agreement gives an increase in this grade. Regardless of the period of the service in the public administration, the ministers receive automatically five age bonuses out of a maximum of six in the civil service system.
The pay practices in the private sector do not directly influence on civil servants’ or ministers' salaries. Indirectly the private sector may cause pressures to bigger reviews in the State salary schedules but bigger changes take effect slowly. Civil service salary schedules and grades have been always public, only the pay increase based on the personal performance is confidential. The pay transparency is one of the factors that makes bigger reforms slow due to lack of public money, public positions and public opinion. The salaries of the civil servants and ministers are based on the titles, which describe the demands of the position but not necessarily the contents of the work. When a new civil servant’s position is established its title and the range in the State salary schedules is determined. The salary schedules include the following compensation elements: Basic salary: The salary of a civil servant consists of a basic salary.
Age allowance: In addition to the basic salary age bonuses are paid in accordance with a six-stage scale on the basis of 3-18 years of service in the public sector or in a corresponding professional area. The age bonuses are determined as percentages of the basic salary and their maximum total amount is 25%. The first age bonus is added to

Phase I Report – Remuneration of Principal Officials
44
compensation after 3 years of service (5% on top of base salary) and additional bonuses are added every three years thereafter.
Compensations of costs which are paid to the members of Parliament and to ministers (who are usually also MPs) represent a substantial part of their salary package. MP's who are living in the Capital area can receive 30% of their base salary as a compensation of costs. Maximum compensation is 55% of base salary, and it is paid to MP's who need an apartment in Helsinki. The compensations are almost completely tax-free. Ministers' compensation of costs is 50% lower than the standard MP allowance because they have use of car and driver whilst in Helsinki and their personal travel between Helsinki and home is usually paid by their political party.
Car benefits including the drivers are granted to ministers and Chief General Managers of State Agencies. The prime minister has a residence with the servants but otherwise housing benefit is not applied to other ministers.
Pay Levels (Finnish Markka) Position Fixed Remuneration Cash Allowance
(Compensation of Costs) Prime Minister FM 641,000 (1) FM 96,000 – FM 176,000 Minister FM 534,000 (1) FM 80,000 – FM 147,000 MP FM 338,000 – FM 401,000 (2) FM 97,000 – FM 211,000 Top Civil Servant FM 616,000 – FM 711,000 - Note: (1) PM and minister pay includes maximum of six age allowances. PM and minister
automatically entitled to five of the six age allowances upon taking office. (2) MP below 12 years of service receives minimum, over 12 years receives maximum. Issues The general view is that ministers are not highly paid – even less than top civil servants. However, much controversy was generated when MPs voted a raise for themselves. Because the state is a very large employer in Finland, reforms in salary systems have been slow but have not generated resistance.

Phase I Report – Remuneration of Principal Officials
45
Summary of Practices on Ministerial Remuneration: Netherlands History In the 1980s a rule was formulated that ministers, including the prime minister, should not earn more than six times the minimum wage. In fact, the ratio has been increased but the principle of the rule is still in place.
Because of Labor Market restraints in attracting top civil servants and politicians there is (some) pressure to change remuneration policies and practices (i.e. higher pay), but the issue is very politically sensitive. Process There is no independent review body for setting pay, and salary adjustments follow civil service collective bargaining agreements. Parliament is accountable for determining remuneration policies and practices, but it has not been discussed in many years. They also are accountable for reviewing their own salaries, and as a result of concern about public scrutiny, there has not been an adjustment other than for wage inflation in a number of years.
Factors For civil servants, a collective labour agreement is negotiated by the Ministry of the Interior with the labour unions. The negotiated pay rise is then also applicable to the MPs and ministers. Besides the rule on multiples of the minimum wage, there are no guidelines or policies about determination of remuneration for ministers. Influence of private sector pay is only indirect, in that civil service unions refer to private sector collective bargaining agreements when negotiating on salary adjustments for civil service. Nevertheless, the rate of increase in civil service has been lower than in private sector, so gaps between the two sectors are expanding.
Structure Compensation for ministers consists of a fixed base salary and non-accountable allowances for expenses incurred in carrying out duties. They are participants in the civil service retirement scheme.
Pay Levels (NLG) Position Fixed Remuneration Cash Allowance Prime Minister NLG 251,515 - Minister NLG 251,515 - MP NLG 191,590 - Top Civil Servant NLG 252,400 NLG 11,400 Note: Fixed remuneration excludes allowances. Issues Compared to the private sector, ministers and top civil servants are poorly compensated compared to private enterprise, but the citizen’s view is that they are well compensated compared to the average worker and that they are being paid with that worker’s tax money. Because top civil servants pay is compressed by relation to politician’s pay, attracting and retaining qualified civil servants is a major concern. Attempts at reform, or studies of reform, have tended to fail because the public at large is not convinced of the need for pay raises, especially for ministers.

Phase I Report – Remuneration of Principal Officials
46
Summary of Practices on Ministerial Remuneration: New Zealand History From earliest times, MPs received an honorarium for serving as a representative. In the 1940s a system of salaries was established as well as a system of separate allowances. From the 1950s to the present, the structure of allowances has been modified and built up around particular purposes, creating the current categories. In 1973, the Royal Commission upon Parliamentary Salaries and Allowances established the following principles: • that the occupation of a member of Parliament should be regarded a virtually full time
and professional in nature; • that it should be assumed that a member of Parliament has no other income; • that it should be accepted that members are married with family commitments; and • that regard should be had to the sacrifices a member and his wife (or husband) have to
make in their enjoyment of leisure and family life. The Higher Salaries Commission (HSC) accepted these principles when it took over responsibility for parliamentary salaries and allowances in 1974. Process The HSC comprises three independent commissioners appointed by the Governor-General for three-year terms. The HSC conducts reviews annually but the process is long and there are sometimes two years between adjustments. There is no automatic adjustment mechanism linked to civil service pay adjustments or wage inflation in the market place. Factors The HSC must set remuneration having regard to the requirements of the job and the conditions and remuneration paid to those in comparable positions. And the HSC also has to take account of the following specific statutory criteria when setting levels of remuneration: • the need to achieve and maintain fair relativity with the levels of remuneration received
in the private sector and public sector; • the need to be fair both- to the persons whose remuneration is being determined and to
the taxpayer; and • the need to recruit and retain competent persons. Besides setting salaries, the commission also reviews the allowances, which are considered as reimbursement of costs incurred in the cost of employment – e.g., performing the duties expected by the members of the constituency. The commission seeks input from commercially-available salary surveys, the State Service’s Commission own salary survey unit, and responses to questionnaires issued by the commission to employers requiring remuneration information. The employers are bound by law to provide such information. There is no stated policy on remuneration levels, but there are significant differences between private sector remuneration and ministerial remuneration. Instead, the ministerial remuneration levels are in closer alignment with government department Chief Executives. Structure Pay consists of a system of base salary plus allowances that are not taxed.

Phase I Report – Remuneration of Principal Officials
47
Structure of Parliamentary and Ministerial Compensation (NZ$)
MP Minister Prime Minister Salary 85,000 149,200 250,000 Basic Expense Allowance (not taxed)1 7,000 12,000 23,500 House & Grounds Maintenance Allowance (not taxed) 1
1,500
Constituency Allowance (not taxed) 2 14,000 Day Allowance (not taxed) 1 4,704 House Allowance if not provided with a house ( not taxed) 1
2000
Accommodation Allowance (not taxed) 2
16,000
House (not taxed, estimate) 1 25,000 50,000 Self drive car 1 22,000 22,000 Chauffeured limousine 2 40,000 40,000 Total (all elements) 126,704 251,700 385,500 Total (remuneration elements only3) 96,704 209,700 295,500 1 These elements considered remuneration – basic expense, day and house and grounds
maintenance allowances are not accounted for against any job-related expense; house allowance is provided to those ministers who do not receive housing provided by virtue of already living in Wellington area; ministers not from Wellington area provided with housing; self-drive car is purchased for personal use of family in addition to chauffeured limousine.
2 These elements are not considered remuneration. Constituency allowance covers cost of secretarial support and other costs of providing constituency service; accommodation allowance covers cost of second home in Wellington, but is also given to MPs elected on party list who do not need to maintain home in a constituency; limousine is normal job requirement but also available for personal use.
3 Total of remuneration elements includes estimated value of housing, but not House Allowance as only one of these is received by a minister. As residence is traditionally reserved for prime minister in most countries, the house value has not been included as total remuneration for the prime minister.
Pay Levels (NZ$)
Ministerial and Civil Service Pay Levels Level Fixed Remuneration Performance Related Pay
(maximum) Prime Minister 295,500 Cabinet Minister 209,700 Member of Parliament 96,704 Top Civil Servant 350,000 50,000 Note: Fixed remuneration includes basic allowance and housing for ministers but excludes job-related allowances for MPs and housing for prime minister. MPs including ministers may contribute up to 5% of salary to the superannuation scheme, which is matched 2:1 by the government – up to a maximum of 10%. Issues Over the past 15 years, government policy and tax laws have influenced all employers to move away from provision of benefits or perquisites in-kind. Instead, these benefits and perquisites have been “encashed” into the base salary. However, parliamentary and ministerial remuneration remains a system of salaries, allowances and benefits. In recent months, a report by the Auditor General has signaled the need to review this system, both from a matter of tax fairness and transparency.

Phase I Report – Remuneration of Principal Officials
48
The public perception is that MPs and ministers are overpaid and have low standards of performance. The average wage in New Zealand is around $35,000 per annum and the MP base salary of $85,000 is in the top quartile of all salaried positions. Despite the disparity in remuneration compared to complexity of the job, there is no shortage of candidates seeking election as an MP.

Phase I Report – Remuneration of Principal Officials
49
Summary of Practices on Ministerial Remuneration: Singapore History The current system is based on a 1994 White Paper on Competitive Salaries for Competent and Honest Government. The system was established to ensure that Officers in key government positions are paid salaries that are competitive, in line with professionals in the private sector. Process A review is conducted by the Public Service Division, which is charged with the responsibility to review the pay policy and structure of government. The review of the remuneration structure is implemented every five years, with the last review being conducted in July 2000. The results of the review are debated at Parliament and a bill must be passed to implement the recommendations. Administrative Service salary levels are adjusted annually based on the recommendation of the National Wage Council. The NWC is made up of officials, industry leaders, and private sector representatives. Factors Pay is based on establishing a competitive position with the private sector, specifically the eight highest-paid individuals from six professions (48 individuals in total): Bankers, Engineers, Accountants, Lawyers, CEOs of Multinationals and CEOs of local manufacturing firms. The minimum targeted pay for a Staff Grade I (MR4) minister – the entry point for minister – is set to be 2/3 the Median Principal earned income of the top eight individuals from each of the six professions. That is, 2/3 of the median income of the 48 individuals drawn from the six professions. The pay for Administrative Service – Superscale G is set to be equal to the pay of the 15th highest paid person who is 32 years old and belongs to the same six professions above (banker, engineer, accountant, lawyer, or employee in a multinational of local manufacturing firm). Superscale G is the first level of director in the civil service. These two pay points serve as anchors and the rest of the structure from Superscale G to A and then from MR4 to MR1 and prime minister’s pay is set by an estimated progression of 17% to 20% between levels. Superscale B is typically the top level within the civil service; Superscale A is essentially equivalent to MR4. The information is obtained from the Inland Revenue Authority, and would have a time lag of about 1.5 to 2 years. Since 2000, Principal Earned Income is defined to include value of stock options as exercised. It is assumed that options exercised in a given year will have been accumulated over two years, and the gains are thus halved when calculating the level of earnings. Structure Remuneration is comprised of Base Salary, Annual Variable Component and Performance Bonus. Base salary represents 60% of total remuneration, and the Annual Variable Component and the Performance Bonus represent 40% of Total Remuneration. The Annual Variable Component is based on economic results of the Singapore economy. The Performance Bonus is based on individual performance rating. Effective in 2000, half of the performance bonus is paid in the year earned, and the remaining half is paid over the next two years.

Phase I Report – Remuneration of Principal Officials
50
This pay structure is common to both civil servants and ministers. The government is considering replacing the Annual Variable Component with a GDP-Related Bonus that would vary linearly with GDP growth, thus making this component of remuneration more transparent. However, this is not yet implemented. If the GDP-Related Bonus is eventually implemented, the individual Performance Bonus would remain in place. The Administrative Service has an active pension plan separate from the Central Provident Fund. The terms of this scheme are secret. Neither civil servants nor ministers receive education allowances, housing allowances, or other benefits, except a very limited medical scheme (S$350 per year). Ministers would be entitled to a car, but only top level ministers would have full-time drivers and security detail. The salary scales are adjusted according to the recommendations of the NWC. The salary ranges below represent the opportunity for monthly fixed remuneration. How much an officer or minister is paid within these ranges depends on individual performance. Pay Levels (S$) Position Monthly Fixed
Remuneration Annual Performance-
Related Pay Targeted Annual Total
Cash (Note 2) Prime Minister $85,300 $831,000 $1,940,000
MR1 (Deputy PM and Minister 1) (Note 1)
$60,000 - $75,900 $582,000 - $736,200 $1,500,000 - $1,897,500
MR2 (Minister 2) (1) $49,000 – $61,500 $475,300 – $596,550 $1,225,000 - $1,537,500
MR3 (Minister 3) $44,600 – $55,700 $558,200 – $697,900 $1,138,000 - $1,422,000
MR4 (Minister 4) $37,900 – $47,400 $475,000 – $593,000 $968,000 – $1,210,000
Superscale B (SR5) $28,800 – $39,800 $361,000 – $498,600 $736,000 – $1,016,000
Superscale C (SR 6) (1) $24,000 – $31,200 $259,200 – $337,000 $612,000 – $795,600
Superscale G (SR 9) $17,500 – $18,800 $135,500 – $145,600 $363,000 – $393,000 MP $11,900 $21,300 $176,000 Notes: (1) MR 1, MR2 and Superscale C are estimates, as figures are not made public. (2) For MR4 and above, targets are based on June 2000 recommendations and are being
phased in. For Superscale B and below, targets are currently implemented. Issues It is widely recognized that top civil servants and ministers in Singapore are well-compensated. Concerns have been expressed about rising income inequality between the poor and the rich, and also that increases in variable compensation are being used as a device to camouflage the true extent of pay rises accruing to ministers. With recent downturns in the economy, there have been pressures to cut salaries of key officials, but no official statement has been issued regarding this issue.

Phase I Report – Remuneration of Principal Officials
51
Summary of Practices on Ministerial Remuneration: United Kingdom History The process and principles of remuneration for ministers in UK has been broadly stable for many years. The same principles have recently been extended to cover the newly devolved Parliament in Scotland and the Assemblies in Wales and Northern Ireland. Key features of the approach are: • Work in Government or Parliamentary office is considered to bring rewards other than
salary and does not attract ‘full market rates’ of pay. Nevertheless, it is thought that ministerial pay should be reasonably competitive to public sector pay levels, where comparisons can be established. Current pay levels are considered by the appropriate Review Body (see below) to ‘represent the minimum that ministers should be paid’.
• Pay is limited to a fixed base salary, a pension, and the use of facilities (including in many cases accommodation) which are ‘attached’ by custom and practice to specific offices. There is no element of variable or performance related pay.
• Pay levels and pension arrangements for ministers and members of Parliament have to be agreed by the House of Commons, as have MPs’ office and staff support allowances, which are also payable to those ministers who are MPs. Currently all cabinet-level ministers are MPs except the Lord Chancellor and Lord Privy Seal, who are members of the House of Lords. Salaries and allowances are approved on the recommendation of the prime minister, although there have been several examples of MPs approving higher figures than those suggested by the SSRB.
• Housing is provided only for the prime minister, chancellor of the exchequer and foreign minister at no cost to the office holder, and no other housing allowances are provided for other ministers.
• Pay and allowances are formally reviewed every three years. Within that period, annual increases are geared to the median of pay movements for the Senior Civil Service (in respect of pay) and the Retail Price Index (in the case of allowances).
• Pay determination is, as far as possible, ‘de-politicised’ through an independent review process.
Process Every three years, the PM commissions the Senior Salaries Review Body (SSRB) to review ministerial and parliamentary pay allowances. The SSRB is composed of senior industrialists, retired public servants, academics and other professionals. The SSRB also reviews pay of senior civil servants, equivalent ranks in the armed forces, and the judiciary. The SSRB follows a standard process: • It invites written or oral evidence from interested groups • It asks an external consultant to advise on base pay for jobs of comparable weight to
ministers in both the public and private sectors • On some occasions, the SSRB commissions external research into international
practice • On pensions issues, it draws on advice from the Government Actuary and specialist
consultants Recommendations are provided to the PM who then decides when to publish the paper and present it to Parliament for debate. Factors The SSRB seeks to ensure that pay and pension levels are sufficient that suitable candidates are not deterred from entering public life and has attempted to ensure that ministeral pay remains broadly comparable to that of relevant positions in various parts of

Phase I Report – Remuneration of Principal Officials
52
the public sector. It is accepted that tracking private sector practices, even on base salaries, is not practical in the UK. It has long been recognized that some positions in the ministerial hierarchy are more complex than others. For example, the chancellor of the exchequer bears a much higher level of accountability than some of the other cabinet ministers. Nevertheless, differential pay has never been seriously considered. Pay Levels House of Commons1 Members of Parliament £51,822
Ministerial/ Office Holders
Salary
Parliamentary
Salary
Total
Salary Ministers’ Salaries £ £ £ Prime Minister2 110,287 51,822 165,418 Cabinet Minister2 66,172 51,822 119,979 Minister of State 34,326 51,822 87,178 Parliamentary Under Secretary 26,053 51,822 78,657 Top Civil Servant (Cabinet Secretary) 170,000 1 Pay for cabinet ministers in House of Lords is somewhat lower because they do not have constituency
accountabilities. 2 The prime minister and cabinet ministers in the House of Commons have elected not to draw all of the
ministerial salaries to which they are entitled. Issues It is typical for the SSRB review to be met with some amount of public controversy. Public opinion would tend to view MPs as overpaid in relation to what they do, though this analysis would not be shared by the SSRB. The SSRB is instead concerned that current levels of ministerial pay are the bare minimum that can be justified by relation to any external comparators. Fearing public reaction, governments have pursued cautious policies in implementing SSRB recommendations and until recently the Cabinet itself, at the request of the PM, did not draw their full salaries. The recent increase was implemented in the days immediately following the last election, thus attracting a minimum of attention.

Phase I Report – Remuneration of Principal Officials
53
Summary of Practices on Ministerial Remuneration: United States History Salaries of top-level Executive Branch officials of the U.S. Federal government are statutorily linked to the salaries of Members of Congress who are responsible for setting pay for these positions. The framers of the Constitution placed the responsibility of setting pay of the top-level Executive Branch officials, as well as its own and of the President, to Congress. In 1816, Congress’ first attempt to raise their salary met with negative public reaction. As a result, Congress tried to insulate itself from public criticism by linking its pay to top-level Executive Branch officials and Federal judges. In 1967, Congress passed the Federal Salary Act which created an independent commission (commonly referred to as Quadrennial Commission) on Executive, Legislative and Judicial Salaries. The Commission; composed of private sector members appointed by the President, leaders of the Senate and House Representatives, and Chief Justice of the United States; was designed to insulate Congress from the politically sensitive task of setting its own salaries. Every four years, the Commission would convene and make salary recommendations for top-level Executive Branch officials, Members of Congress and Federal judges. These recommendations would be sent to the President for final recommendations to Congress. The President’s recommendations would become effective unless rejected by Congress. The process was intended to serve the public interest and minimize political interference. The process worked in 1969, but then top-level Executive Branch officials were denied salary adjustments for the next six years. Then in 1975 to address the salary erosion, Congress enacted the Executive Salary Cost-of-Living Adjustment Act. This legislation was intended to grant certain positions, including top-level Executive Branch officials, the same automatic cost-of-living adjustment (COLA) given to rank-and-file Federal employees. Pay adjustments made under the Act were to be automatic, unless specifically rejected by Congress. These adjustments were to be in addition to the salary raises granted through the Quadrennial Commission review process. However, Congress frequently rejected or reduced the COLA available under the Act for political reasons. Then Congress enacted the Ethics Reform Act of 1989 due to anticipated mass departures of top officials and growing concern over the Federal government’s ability to recruit highly qualified replacements. The Act restored two cost-of-living adjustments, comparability pay adjustment, and most notably, amended the Federal Salary Act and the Adjustment Act in two respects:
(1) it replaced the Quadrennial Commission with a Citizens’ Commission on Public Service and Compensation and
(2) it revised the mechanism for fixing the annual pay adjustments for judges, Members of Congress and top-level Executive Branch officials.
The new Commission was to be comprised of 11 members: six members to be appointed by leaders of the Executive, Legislative and Judicial branches and five members to be selected from the public at large. Under the Ethics Reform Act, the Employment Cost Index (ECI), a quarterly index measuring the change in wages and salaries paid to private sector employees, was adopted as the basis for determining the amount of annual pay adjustment. It was Congress’ intention that ECI provide top government officials with regular pay increases to alleviate future need for major “catch-up” adjustments. The review commission, the Citizens’ Commission on Public Service and Compensation, has never become functional because no money has ever been appropriated for the Commission and Congress and the President have not appointed its members. As a result,

Phase I Report – Remuneration of Principal Officials
54
there has been no systematic review of salaries of top executive officials since 1988 (date of last Quadrennial Commission). Current Process Federal employees are classified into categories according to position. The top-level Executive Branch officials are under the Executive Schedule pay system, which is a five-tier structure from Level I (Cabinet Secretary) through Level V (lowest salary). Their salary is linked to the salary of the Members of Congress who are responsible for setting the pay of these top-level officials. The President presents salary recommendations for the top-level officials and these are either approved or rejected by Congress. By law, Executive Schedule pay is supposed to rise each year at the same rate as other Federal government employees (who are on the General Schedule), but Congress has voted each year to block Executive Schedule raises since 1993, except for 1998, 2000 and 2001. The salary levels of these positions are capped based on the Vice President’s salary, which currently is $186,300. Under current law, there are three ways to adjust pay of top-level officials:
(1) allow automatic and annual pay adjustments based on changes in the Employment Cost Index (ECI);
(2) adopt pay raises recommended by the President to Congress, based on the report of the Citizens’ Commission to review and consider salaries of high-level Federal officials; or
(3) pass special legislation authorizing a pay raise.
As a matter of practice, it is this third approach that has been taken, such that determination of pay levels is subject to political considerations. Private sector pay practices are not reviewed nor do they influence the pay levels of top-level Federal officials. Structure of the pay package Top-level Executive Branch officials receive only base salary, under a five-tier pay structure, Level I (highest) through Level V (lowest). There is no variable compensation or non-accountable allowances. In addition, these officials are not provided with housing or housing allowances and no other significant perquisites are provided. Top-level Executive Branch officials, as well as Members of Congress, are also covered by the benefits package that applies to Federal civil servants. The most important benefits are:
• A contributory retirement plan that pays approximately two-thirds of salary for a full career (35 years of service). Officials can first retire from 55 to 62 depending on years of service. The plan for officials entering the government since 1983 is a combined defined benefit/defined contribution plan. All Federal employees are also covered by Social Security.
• A choice of health plans that reimburse about 80 percent of covered health care expenditures. The health plan eligibility is carried into retirement. At age 65, the benefits are coordinated with Medicare.
• A life insurance plan providing a benefit approximately equal to salary.
• Annual leave of up to six weeks a year depending on service.

Phase I Report – Remuneration of Principal Officials
55
Remuneration for Cabinet and Other Top Appointed Positions (US$) Level Base Salary President $400,000 Vice President $186,300 Level I – Cabinet Secretary $161,200 Level II – Deputy & Directors of Agencies $145,100 Member of Congress $145,100 Top Civil Servant (SES 6) $133,700 Issues The system has been under much public and political scrutiny for many years. Pay of top-level Executive Branch officials (as well as Federal judges) is a politically sensitive issue. Increasing the pay of these top-level Executive Branch officials will affect the pay levels of other Federal employees because salary caps are set at the level of the top-level officials. If Members of Congress approve salary raises for top-level officials, they will have to approve raises for themselves in addition to other Federal employees who are on different pay systems from Congress and top-level officials, such as Senior Executive Service employees. This new pay system created under the Ethics Reform Act of 1989 is not working well. Congress has permitted only three COLA adjustments since 1993:
• 2.3% in 1998 • 3.4% in 2000 • 2.7% in 2001
Past attempts at reform, such as delinking pay of the top-level Executive Branch officials with Members of Congress, have failed mainly for political reasons. Congress’ reluctance is largely due to the concern over adverse public reaction to pay increases for themselves. Congress is hoping to force a consensus on the need for across-the-board salary increases. The current pay system and the reluctance of Congress to vote for Congressional pay raises are hindering the recruitment of highly qualified potential candidates from seeking appointments as Cabinet Secretaries, as is the intensive vetting and confirmation processes to which candidates are subject. Potential candidates prefer to remain in the private sector where compensation is higher and there are regular salary reviews.