Outlier Detection for Graph Data
128
1 Outlier Detection for Graph Data Microsoft Manish GuptaJing Gao Charu Aggarwal Jiawei Han SUNY IBM UIUC
-
Upload
tallulah-ross -
Category
Documents
-
view
69 -
download
1
description
Outlier Detection for Graph Data. Manish Gupta. Jing Gao. Jiawei Han. Charu Aggarwal. Microsoft. SUNY. UIUC. IBM. Tutorial Outline. Introduction [10 min] Static Graph Outlier Detection Algorithms [45 min] Break [10 min] Dynamic Graph Outlier Detection Algorithms [45 min] - PowerPoint PPT Presentation
Transcript of Outlier Detection for Graph Data
1
Outlier Detection for Graph Data
Microsoft
Manish Gupta Jing Gao Charu Aggarwal Jiawei HanSUNY IBM UIUC

[email protected], [email protected], [email protected], [email protected]
Tutorial Outline
• Introduction [10 min]• Static Graph Outlier Detection Algorithms [45
min]• Break [10 min]• Dynamic Graph Outlier Detection Algorithms
[45 min]• Summary [10 min]
* Slides borrowed with permission from authors
[email protected], [email protected], [email protected], [email protected]
Tutorial Outline
• Introduction [10 min]• Static Graph Outlier Detection Algorithms [45
min]• Break [10 min]• Dynamic Graph Outlier Detection Algorithms
[45 min]• Summary [10 min]

[email protected], [email protected], [email protected], [email protected]
Outlier Detection• Also called anomaly detection, event detection, novelty detection, deviant
discovery, change point detection, fault detection, intrusion detection or misuse detection
• Three types
• Techniques: classification, clustering, nearest neighbor, density, statistical, information theory, spectral decomposition, visualization, depth, and signal processing
• Outlier packages:
• Data types: high-dimensional data, uncertain data, stream data, network data, time series data
Contextual OutliersNormal Outlier
Collective OutliersPoint Outliers

[email protected], [email protected], [email protected], [email protected]
Information Network Analysis
Clustering Classification
?Link Prediction
Community Detection PageRank
0.13
0.30.1
0.41
0.8
0.27
0.2
0.9
0.01
0.7
0.6
0.54
0.1
0.110
0.20.7
Influence Propagation

[email protected], [email protected], [email protected], [email protected]
Outlier Detection for Information Networks
Network Analysis
OutlierDetection
OutlierDetection
ForNetworks

[email protected], [email protected], [email protected], [email protected]
Need for Outlier Detection on Networks (Social Media Analysis)
User Tag
URLArts Science
FashionSports
EXPERT
User Tag
VideoArts Science
FashionSports
MARKETER

[email protected], [email protected], [email protected], [email protected]
Need for Outlier Detection on Networks
• Distributed Systems
• Data Integration Systems
Intrusion DetectionLink FailuresInput/Output Correlation breach
Gandhi
18691969
1889X X
Civil Rights Movement
1893-1914
KasturbaGandhi
1869-1944Obama
1961-
XEntity Network

[email protected], [email protected], [email protected], [email protected]
Challenges in Outlier Detection on Networks
• Extraction of patterns– Across multiple node types– Across multiple types of node attribute data– Across time
• Scale• Matching patterns across time
– Modeling links and data together• Defining outliers given the patterns

[email protected], [email protected], [email protected], [email protected]
Tutorial Outline
• Introduction [10 min]• Static Graph Outlier Detection Algorithms [45 min]
– Minimum Description Length [10 min]– Ego-net Metrics [5 min]– Random Walks [5 min]– Random Field Models [10 min]– Outliers in Heterogeneous Networks [15 min]
• Break [10 min]• Dynamic Graph Outlier Detection Algorithms [45 min]• Summary [10 min]

[email protected], [email protected], [email protected], [email protected]
Minimum Description Length (MDL) Principle
• Best hypothesis for a given set of data is the one that leads to the best compression of the data
• Any regularity in a given set of data can be used to compress the data
• Given data , the best hypothesis to explain is the one which minimizes where– is the length, in bits, of the description of the hypothesis– is the length, in bits, of the description of the data when
encoded with the help of the hypothesis• Outlier Detection: Find patterns using MDL; objects that
do not fit the patterns are outliers

[email protected], [email protected], [email protected], [email protected]
MDL for Graph Partitioning and Outlier Edge Detection
People
Peop
le
People Groups Peop
le G
roup
s
Chakrabarti PKDD’04
Goals• [#1] Find groups (of people, species, proteins, etc.)
• [#2] Find outlier edges (“bridges”)
Good Clustering
1. Similar nodes are grouped together
2. As few groups as necessary
A few, homogeneous blocks
Good Compression
implies

[email protected], [email protected], [email protected], [email protected]
MDL for Graph Partitioning and Outlier Edge Detection: Algorithm
Start with initial matrix
Find good groups for fixed k
Choose k=k+1
Final groupingLower the encoding cost
Iteratively reassign each node to the group which minimizes the code cost
Split group with maximum entropyper node; assign “bad” nodes to new group

[email protected], [email protected], [email protected], [email protected]
MDL for Graph Partitioning and Outlier Edge Detection: Outlier Edges
Nodes
Nod
es
Outliers Deviations from “normality”
Lower quality compression
Find edges whose removal maximally reduces cost
Nod
e G
roup
s
Node Groups
Outlier
Edges

[email protected], [email protected], [email protected], [email protected]
MDL for Anomalous Substructure Detection: Graph Based Anomaly Detection
• Finding anomalous substructure is difficult because there are a lot many infrequent substructures
• Method 1– Anomaly is opposite of a pattern– Best substructure pattern is one that minimizes
– is “intuitively” the opposite of – Low is anomalous
• Method 2– Subgraphs containing many common substructures are generally less
anomalous than subgraphs with few common substructures– Use multiple iterations of Subdue to compress the graph– Outlier score should quantify how much and how soon graph is compressed
• Where n is number of iterations, is percentage of subgraph that is compressed away on ith iteration
Noble and Cook, KDD’03

[email protected], [email protected], [email protected], [email protected]
Entropy Measures of Graph Regularity (1)• How to identify if the graph is “regular enough” and does it contain
any anomalous substructures?• Substructure Entropy
– is defined as #instances of in /total #instances of all -vertex substructures– Given a regular graph with many common subgraph patterns, its entropy
will be low– Entropy will depend on the space of all possible substructures (which
depends on – size of any substructure)Example Graph A B C B C
values for =2 A B B C C B C A
1/5 2/5 1/5 1/5

[email protected], [email protected], [email protected], [email protected]
Entropy Measures of Graph Regularity (2)
• Conditional Substructure Entropy– Given an arbitrary n-vertex substructure, how many bits are needed to
describe its surroundings?– Surroundings can be thought of as a set of extensions to the
substructure; we define an extension of a substructure to be the addition of either a single vertex (along with the edge connecting it to the substructure), or a single edge within the substructure.
– Let be all vertex substructures in . then contains all substructures containing or vertices. will then be the percentage of instances of that extend to an instance of
A B C B C B CIf y =
And x= B C BP(x|y)=1/2

[email protected], [email protected], [email protected], [email protected]
Structural Anomalies in Graph Data
• Problem: Given a graph in which nodes and edges contain (non-unique) labels, how to find substructures that are very similar to, though not the same as, a normative substructure?
• Intuition: "The more successful money-laundering apparatus is in imitating the patterns and behavior of legitimate transactions, the less the likelihood of it being exposed." – United Nations Office on Drugs and Crime
• Formal Problem: Given graph with a normative substructure , a substructure is anomalous if difference between and satisfies , where is a (user-defined) threshold and is a measure of the unexpected structural difference
Eberle and Holder, ICDMW’07

[email protected], [email protected], [email protected], [email protected]
Three Types of MDL-based Subgraph Anomalies
• Subgraph patterns are obtained using the Graph Based Anomaly Detection (GBAD) tool based on SUBDUE algorithm
• Three types of anomalies– GBAD-MDL (Minimum Descriptive Length): anomalous
modifications– GBAD-P (Probability): anomalous insertions– GBAD-MPS (Maximum Partial Substructure): anomalous
deletions• Note: Prone to miss more than one type of anomaly
e.g., a deletion followed by modification

[email protected], [email protected], [email protected], [email protected]
GBAD-MDL (Information Theoretic Approach)
• Given a normative substructure , find similar but not exactly isomorphic substructures
• For each instance in
• Where is the cost to modify to

[email protected], [email protected], [email protected], [email protected]
GBAD-P (Probabilistic Approach)
• Given a normative substructure , find extensions to with lowest probability, (i.e., extend with vertices and edges with least probability)
• For each instance in

[email protected], [email protected], [email protected], [email protected]
GBD-MPS (Maximum Partial Substructure Approach)
• Given a normative substructure , find ancestral substructures that are missing various edges and vertices
• For each instance in

[email protected], [email protected], [email protected], [email protected]
Anomalies in Real Datasets (Cargo Shipment Data)
• Cargo Shipment Data: obtained from Customs and Borders Protection (CBP)– Scenario: Marijuana seized at Florida port [press release by U.S. Customs
Service, 2000]. Smuggler did not disclose some financial information, and ship traversed extra port
– GBAD-P discovers the extra traversed port– GBAD-MPS discovers the missing financial info
• Network Intrusion Data: 1999 KDD Cup Network Intrusion– 100% of attacks were discovered with GBAD-MDL– 55.8% for GBAD-P and 47.8% for GBAD-MPS– Data consists of TCP packets that have fixed size– Thus, the inclusion of additional structure, or the removal of structure, is not
relevant here– Modification is the only relevant one, at which GBAD-MDL performs well– High false positive rate!

[email protected], [email protected], [email protected], [email protected]
Tutorial Outline
• Introduction [10 min]• Static Graph Outlier Detection Algorithms [45 min]
– Minimum Description Length [10 min]– Ego-net Metrics [5 min]– Random Walks [5 min]– Random Field Models [10 min]– Outliers in Heterogeneous Networks [15 min]
• Break [10 min]• Dynamic Graph Outlier Detection Algorithms [45 min]• Summary [10 min]
[email protected], [email protected], [email protected], [email protected]
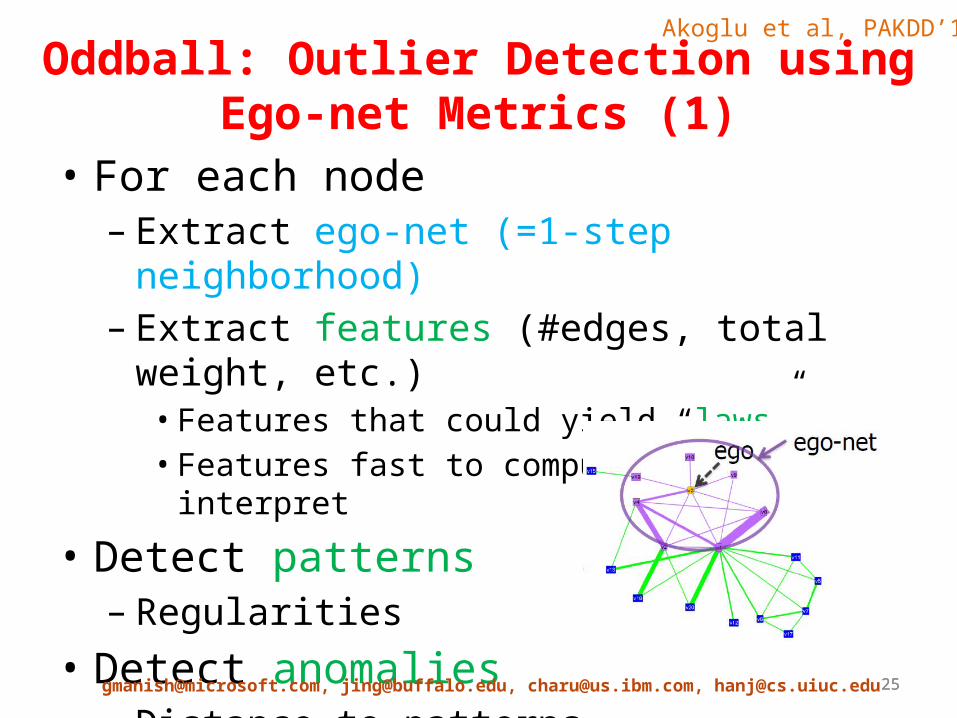
Oddball: Outlier Detection using Ego-net Metrics (1)
• For each node– Extract ego-net (=1-step neighborhood)– Extract features (#edges, total weight, etc.)
• Features that could yield “laws”• Features fast to compute and interpret
• Detect patterns– Regularities
• Detect anomalies– Distance to patterns
Akoglu et al, PAKDD’10

[email protected], [email protected], [email protected], [email protected]
Oddball: Outlier Detection using Ego-net Metrics (2)
• Which features to compute– : Number of neighbors (degree) of ego – : Number of edges in Ego-net – : Total weight of Ego-net – : principal eigenvalue of the weighted adjacency matrix of
Ego-net • Power laws
– Ego-net Density Power Law: , – Ego-net Weight Power Law: , – Ego-net Power Law: , – Ego-net Rank Power Law: , where is the rank of edge j in the
sorted list of edge weights

[email protected], [email protected], [email protected], [email protected]
Oddball: Outlier Detection using Ego-net Metrics (3)
• Outlier score for instance is the distance to the fitting power law curve

[email protected], [email protected], [email protected], [email protected]
Oddball: Outlier Detection using Ego-net Metrics (4)

[email protected], [email protected], [email protected], [email protected]
Link-based Outlier and Anomaly Detection in Evolving Data Sets (LOADED)
• Convert the multi-dimensional dataset with a few categorical and continuous attributes to a network dataset– Two data points are linked if they have at least 1 categorical attribute value
in common– Association link strength = number of attribute-value pairs shared in
common• Outlier score computation
– A point with no links to other points will have the highest possible score– A point that shares only a few links, each with a low link strength, will have
a high score– A point that shares only a few links, some with a high link strength, will
have a moderately high score– A point that shares several links, but each with a low link strength, will
have a moderately high score– Every other point will have a low to moderate score
Ghoting et al, ICDM’04

[email protected], [email protected], [email protected], [email protected]
LOADED Outlier Score Computation
• Categorical data: – is a set in the powerset of all attribute-value pairs in – is the number of attribute value pairs in – is the number of points sharing the same attribute value pairs– is the minimum support (or minimum number of links)
• Categorical+Continuous Data:
– : at least % of correlation coefficients disagree with the distribution followed by the continuous attributes for point
– : or hold true for every superset of in • The authors also propose a dynamic algorithm to maintain the
counts and support of frequent itemsets for efficient outlier detection in evolving datasets

[email protected], [email protected], [email protected], [email protected]
LOADED Performance on KDD-Cup 1999 Dataset

[email protected], [email protected], [email protected], [email protected]
Tutorial Outline
• Introduction [10 min]• Static Graph Outlier Detection Algorithms [45 min]
– Minimum Description Length [10 min]– Ego-net Metrics [5 min]– Random Walks [5 min]– Random Field Models [10 min]– Outliers in Heterogeneous Networks [15 min]
• Break [10 min]• Dynamic Graph Outlier Detection Algorithms [45 min]• Summary [10 min]

[email protected], [email protected], [email protected], [email protected]
Outlier Detection Using Random Walks
• Given a multi-dimensional dataset create a network dataset– OutRank-a: Use cosine similarity between objects as the
edge weight– OutRank-b: Generate graph using cosine similarity and
connect nodes only if cos-sim>threshold; on this graph, similarity between nodes is based on number of shared neighbors
• Connectivity score is then computed similar to the Pagerank score using power iterations– Outliers are nodes that are very weakly connected, i.e., ones
with low connectivity scores
Moonesinghe et al, ICTAI’06

[email protected], [email protected], [email protected], [email protected]
Outlier Detection Using Random Walks

[email protected], [email protected], [email protected], [email protected]
Anomalies using Random Walks on Bipartite Graphs
E
a1
ak
a5
a4
a3
a2
t1
tn
t5
t4
t3
t2
V1 V2
• such that edges are between and • Neighborhood formation (NF)
Problem– Given a query node in , what are
the relevance scores of all the nodes in to ?
• Anomaly detection (AD) Problem– Given a query node in , what
are the normality scores for nodes in that link to ?
Sun et al, ICDM’05

[email protected], [email protected], [email protected], [email protected]
Application Settings for Bipartite Graphs
• Publication network– (similar) authors vs. (unusual) papers
• P2P network– (similar) users vs. (“cross-border”) files
• Financial trading network– (similar) stocks vs. (cross-sector) traders
• Collaborative filtering– (similar) users vs. (“cross-border”)
products

[email protected], [email protected], [email protected], [email protected]
Neighborhood Formation on Bipartite Graphs
Input: a graph and a query node Output: relevance scores to • Random-walk with restart from
in • Record the probability visiting
each node in • The nodes with higher
probability are the neighbors
V1 V2
q
.3
.2
.05
.01.002
.01

[email protected], [email protected], [email protected], [email protected]
Anomaly Detection on Bipartite Graphs
• in is normal if all in that link to belong to the same neighborhood
low normalityhigh normality
tt

[email protected], [email protected], [email protected], [email protected]
Tutorial Outline
• Introduction [10 min]• Static Graph Outlier Detection Algorithms [45 min]
– Minimum Description Length [10 min]– Ego-net Metrics [5 min]– Random Walks [5 min]– Random Field Models [10 min]– Outliers in Heterogeneous Networks [15 min]
• Break [10 min]• Dynamic Graph Outlier Detection Algorithms [45 min]• Summary [10 min]

[email protected], [email protected], [email protected], [email protected]
Community Outliers
• Definition– Two information sources: links, node features– There exist communities based on links and node features– Objects that have feature values deviating from those of other
members in the same community are defined as community outliers
Gao et al, KDD’10
V5
V4
110K
40K
100K
V2
160KV170K
V8
30K V7 10K
V3140KV9
10K
V10
30KV6
high-income low-income
community outlier

[email protected], [email protected], [email protected], [email protected]
Alternative Network Outlier Definitions
• Global outlier: only consider node features
• Structural outlier: only consider links
• Local outlier: only consider the feature values of direct neighbors
V7
10
V9
V8
30
V10
40 70 100 110 140 160
V6 V1 V4 V5 V3 V2
Global Outlier
Salary (in $1000)
V6V5
V4
110K40K
100K
V2
160KV170K
V8
30K V7 10K
V9
10K
V10
30K
V3140K
V2
structural outlier local outlier

[email protected], [email protected], [email protected], [email protected]
A Unified Probabilistic Model (1)
community label Z
{0,1,2,… K}
outlier
node features
X link structure W
high-income:mean: 116k
std: 35k
low-income:mean: 20k
std: 12k
model parameters
K: number of communities
[email protected], [email protected], [email protected], [email protected]
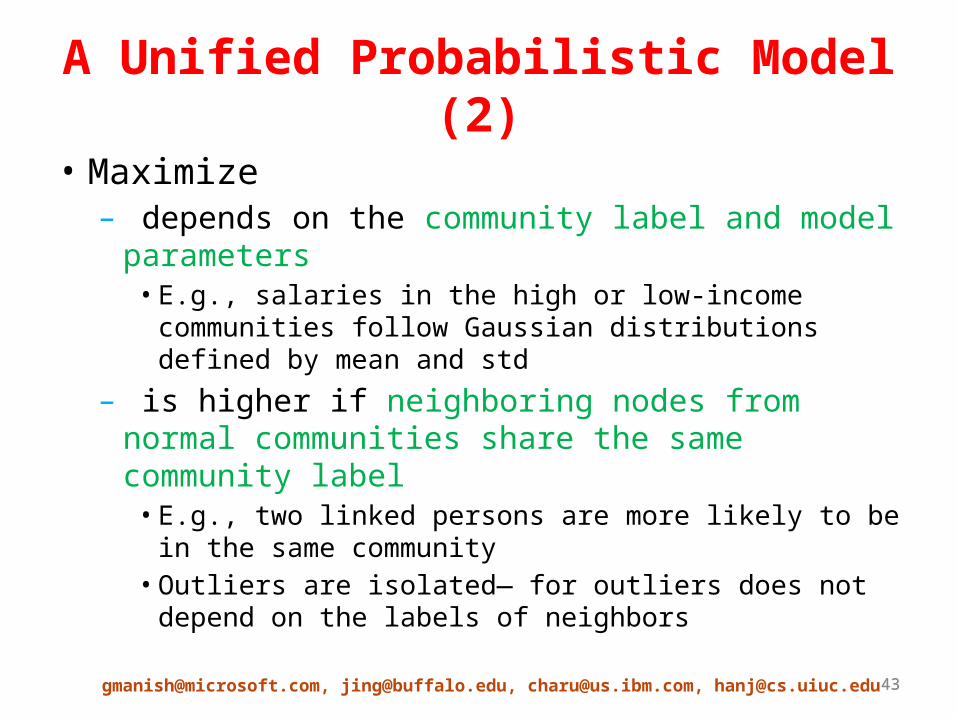
A Unified Probabilistic Model (2)
• Maximize – depends on the community label and model
parameters• E.g., salaries in the high or low-income communities
follow Gaussian distributions defined by mean and std
– is higher if neighboring nodes from normal communities share the same community label
• E.g., two linked persons are more likely to be in the same community
• Outliers are isolated— for outliers does not depend on the labels of neighbors

[email protected], [email protected], [email protected], [email protected]
Community Outlier Detection Algorithm
Fix , find that maximizes
Fix , find that maximizes
Initialize
: model parametersZ: community labels
Inference
Parameter
estimation
• Continuous Data– Gaussian distribution– Model parameters: mean,
standard deviation
• Text Data– Multinomial distribution– Model parameters:
probability of a word appearing in a community

[email protected], [email protected], [email protected], [email protected]
Comparing Community Outliers with Alternative Outlier Definitions
• Baseline models– GLODA: global outlier detection (based on node features only)– DNODA: local outlier detection (check the feature values of direct
neighbors)– CNA: partition data into communities based on links and then conduct
outlier detection in each community
0
0.1
0.2
0.3
0.4
0.5
0.6
0.7
0.8
r=1% K=5 r=5% K=5 r=1% K=8 r=5% K=8
GLODA
DNODA
CNA
CODA

[email protected], [email protected], [email protected], [email protected]
Community Outliers in DBLP
• Conferences graph– Links: % common authors among two conferences– Node features: publication titles in the conference
• Communities– Database: ICDE, VLDB, SIGMOD, PODS, EDBT– Artificial Intelligence: IJCAI, AAAI, ICML, ECML– Data Mining: KDD, PAKDD, ICDM, PKDD, SDM– Information Retrieval: SIGIR, WWW, ECIR, WSDM
• Community Outliers– CVPR and CIKM

[email protected], [email protected], [email protected], [email protected]
Community Outlier Links on Heterogeneous Networks
• Both content and link structure are important when performing clustering of objects in a network
• Heterogeneous random fields model is proposed to model the structure and content together
• Noisy links (spam, errors, or incidental links) are detected and their impact on the clustering algorithm can be significantly reduced
Qi et al, WSDM’12

[email protected], [email protected], [email protected], [email protected]
Heterogeneous Random Field Model Notations
• Tri-partite graph: • is set of users• is set of social media objects• is set of tags• denote the community label (from ) of the
user, object and tag respectively • indicates whether the link is noisy• indicates whether the link is noisy• denotes the confidence level of the links

[email protected], [email protected], [email protected], [email protected]
Heterogeneous Random Field Model
• Energy functions along the edges
• Generative model of feature vectors X for all social media objects in the network
• Random field on heterogeneous tri-partite graph G
• Inference using Gibbs Sampling

[email protected], [email protected], [email protected], [email protected]
Tutorial Outline
• Introduction [10 min]• Static Graph Outlier Detection Algorithms [45 min]
– Minimum Description Length [10 min]– Ego-net Metrics [5 min]– Random Walks [5 min]– Random Field Models [10 min]– Outliers in Heterogeneous Networks [15 min]
• Break [10 min]• Dynamic Graph Outlier Detection Algorithms [45 min]• Summary [10 min]

[email protected], [email protected], [email protected], [email protected]
Heterogeneous Networks are Ubiquitous
IMDB Network DBLP Network Facebook Network
Studio
06.01.03.0
3.03.03.01.0
4.01.02.03.0
2.03.04.01.0
1.03.04.02.0
0002.08.0
4.03.02.01.00
1.01.02.03.03.0
2.02.02.02.02.0
4.01.02.02.01.0
0002.08.0
4.03.02.01.00
1.01.02.03.03.0
2.02.02.02.02.0
4.01.02.02.01.0
06.01.03.0
3.03.03.01.0
4.01.02.03.0
2.03.04.01.0
1.03.04.02.0DirectorStudioMovieActor

[email protected], [email protected], [email protected], [email protected]
Association-Based Clique Outliers (ABC-Outliers)
• A conjunctive select query on a network consists of (type, predicate) pairs
• Expected result are cliques ranked by outlierness• ABCOutliers: Cliques containing rare and interesting associations
between constituent entities
ResearchArea
Author Conference
Computer Networking Author
Energy and Sustainability
Data engineering Conference
• Applications– Discovering interesting
relationships– Data de-noising (removing
incorrect data attributes or entity associations)
– Explaining the future behavior of objects participating in such associations
Gupta et al, ASONAM’13

[email protected], [email protected], [email protected], [email protected]
Concept Definitions: A NetworkA Actors B Locations
Query Q
ActorAmerican
MovieVietnamese
CountryChina
Outlier
C
A
B
B
A
B
B
A
C
C
A
B1
2
3
4
5 8
6
7
9
10
11
Network G
[email protected], [email protected], [email protected], [email protected]
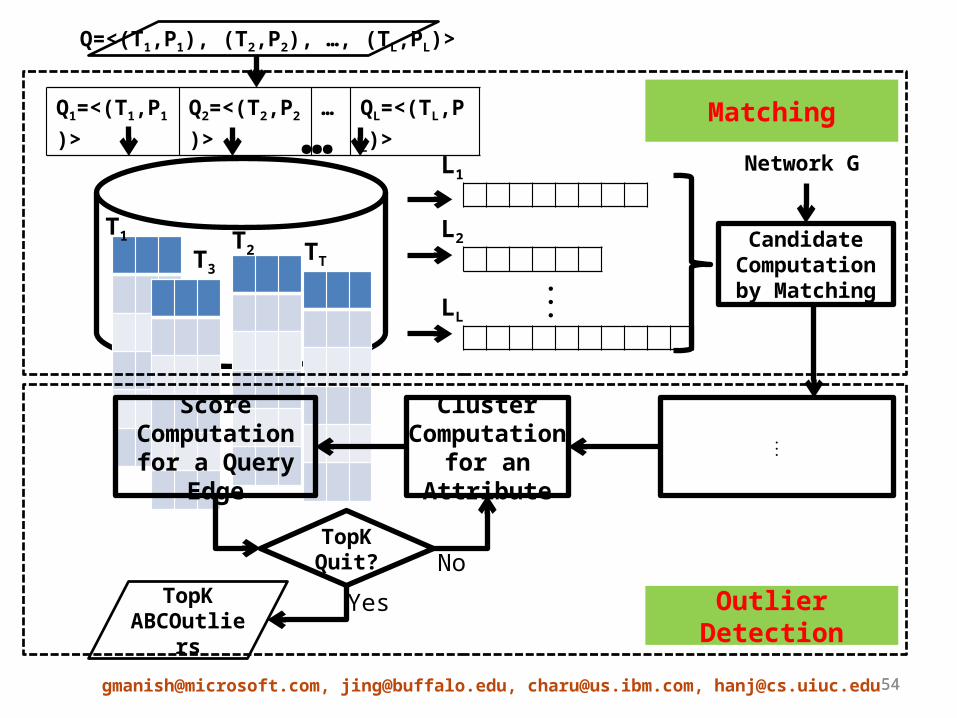
Q=<(T1,P1), (T2,P2), …, (TL,PL)>
…
⋮L1L2LL
Candidate Computation by
Matching
Network G
T1 T2T3TT
⋮Cluster Computation
for an Attribute
Score Computation for a Query Edge
TopK Quit?
Q1=<(T1,P1)> Q2=<(T2,P2)> … QL=<(TL,PL)>
TopK ABCOutliers
Matching
Outlier DetectionYes
No

[email protected], [email protected], [email protected], [email protected]
Candidate Computation by MatchingGraph Indexing
• Relational database: Attribute information associated with each of the vertices (entities) in G
• Memory: Connectivity information of the graph
• Shared neighbors index: For each entity, store the number of shared neighbors of each type, shared between the entity and its neighbors of a particular type
C
A
B
B
A
B
B
A
C
C
A
B1
2
3
4
5 8
6
7
9
10
11Network G
T1
T2
TT
A B C
A B C A B C A B C
1 0 0 1 0 0 0 1 0 0
2 0 0 0 0 0 0 0 0 0
3 0 0 0 0 0 1 0 1 0
4 0 1 0 1 0 0 0 0 0
5 0 0 0 0 0 0 0 0 0
6 0 0 0 0 0 0 0 0 0
7 0 0 1 0 0 0 1 0 0
8 0 0 1 0 0 0 1 0 0
9 0 2 1 2 0 0 1 0 0
10 0 0 0 0 0 1 0 2 0
11 0 0 0 0 0 1 0 1 1
12 0 0 1 0 0 0 2 0 0𝑂 (𝑁𝑇 2)

[email protected], [email protected], [email protected], [email protected]
Candidate Computation by MatchingCandidate Filtering
• Given: lists • Find: Cliques of size such that each clique has a
node from each list• Start with size 1 cliques and grow them• is list of min size and has type • Prune
– Prune the node if its typed neighbors cannot satisfy the requirements of the query
– Prune the node if its typed neighbors do not have enough shared neighbors

[email protected], [email protected], [email protected], [email protected]
Candidate Computation by MatchingGenerating Candidates
• Size 1 cliques: Elements of list • Grow each length- clique to length- cliques
– Randomly choose next type – A node of type is added to length- clique if it is
connected to all nodes in clique• Length- clique is pruned off if it cannot grow• Algorithm terminates when

[email protected], [email protected], [email protected], [email protected]
Outlier Score ComputationScoring Attribute Value Pairs
• Outlier score between values and should be high if– Values and co-occur rarely– Values and are individually frequent– co-occur freq() > freq() and – co-occur freq() > freq() and
• Computation for individual values may be noisy– Compute clusters for every attribute
• KMeans for numbers, time durations• Category label for categorical attributes• Sets of strings: create network and then partition (METIS)
0≤𝛾≤1
Hindi China
India Pakistan
Mandarin MongolianSouthern

59
Outlier Score ComputationScoring Attribute Value Pairs, Edges, Cliques• Peakedness of Cluster Co-occurrence Curves
• Outlier Score of an Association
04/19/2023
Hindi Country
1983 Latitude
Peaked
Non-Peaked
Indi
a
Paki
stan
Nepa
l
Oth
ers
Hindi Speaking Countries
Man
darin
Sout
hern
Mon
golia
n
Oth
ers
Languages in China

[email protected], [email protected], [email protected], [email protected]
Case Studies
No. Type1 Attribute1 Type2 Attribute2 Value1 Value2
1 settlement subdivision_type3 film screenplay comarca ted elliott, terry rossio
2 settlement subdivision_type3 person birth_place comarca Castile
3 settlement coordinates_region film screenplay es ted elliott, terry rossio
4 settlement subdivision_type3 person death_date comarca 1485
5 settlement subdivision_type1 film studio autonomous community dreamworks animation, stardust pictures
No. Type1 Attribute1 Type2 Attribute2 Value1 Value2
1 film writers company divisionsalex kurtzman, roberto
orci, j. j. abramsmtv networks, bet networks, paramount
pictures corporation
2 television creator company #employees trey parker, matt stone 10900
3 television #episodes company divisions 223mtv networks, bet networks, paramount
pictures corporation
4 television network company divisions comedy centralmtv networks, bet networks, paramount
pictures corporation
5 person birth date company foundation 1962 1971
Query: (film, country=“us”), (person, true), (settlement, true)(film="the road to el dorado", person="hernan cortes", settlement="seville")
Query: (company, country=“us"), (film, lang="english"), (person, birthplace=“us"), (tv, true)(company="viacom", film="mission:impossible iii", person="tom cruise", tv="south park")

[email protected], [email protected], [email protected], [email protected]
Community Distribution Outliers(CD-Outliers)
Type x y z
Pattern “b” 0.8 0.0 0.2
Pattern “g” 0.2 0.8 0.0
Pattern “r” 0.0 0.2 0.8
Pattern “c” 0.4 0.0 0.6
Pattern “m” 0.0 0.4 0.6
Pattern “y” 0.4 0.6 0.0
Outlier 1 0.6 0.0 0.4
Outlier 2 0.33 0.33 0.34
• Distribution Pattern for a Type– A cluster obtained by grouping rows of a
belongingness matrix of that type– Can be represented using cluster centroids
• Community Distribution Outliers: Objects whose community distribution does not follow any of the popular community distribution patterns
xy
z
Gupta et al., PKDD’13
User Tag
URLArts Science
FashionSports
EXPERT

62
CD-Outlier Framework
06.01.03.0
3.03.03.01.0
4.01.02.03.0
2.03.04.01.0
1.03.04.02.0
06.01.03.0
3.03.03.01.0
4.01.02.03.0
2.03.04.01.0
1.03.04.02.0
06.01.03.0
3.03.03.01.0
4.01.02.03.0
2.03.04.01.0
1.03.04.02.0
Joint NMF
T1
T2
T3
W1
W2
W3
H1
H2
H3
Top Outliers
Top Outliers
Top Outliers
Remove Outliers from Ti
Pattern Discovery Outlier Detection
[email protected], [email protected], [email protected], [email protected] 62

[email protected], [email protected], [email protected], [email protected]
Discovery of Distribution Patterns• Each of the membership matrices can be clustered
individually• But the membership matrices
– Are defined for objects that are connected to each other
– Represent objects in the same space of C dimensions• Hidden structures across types should be
consistent with each other• Divergence between any two clusterings should be
small

[email protected], [email protected], [email protected], [email protected]
Optimization and Iterative Update Rules
subject to the constraints
• denotes the Hadamard Product and denotes the element-wise division
NMFsubject to the constraints

[email protected], [email protected], [email protected], [email protected]
Community Distribution Outlier Detection
• Joint NMF outputs the and matrices• Each row of is a distribution pattern• Each element of denotes probability with
which object belongs to community • Outlier score of an object is the distance of
the object from the nearest cluster centroid
– Objects far away from nearest cluster centroids get higher outlier score

[email protected], [email protected], [email protected], [email protected]
Iterative Refinement Algorithm
𝑶 (𝑵 𝑲𝑪′𝟐)𝑶 (𝑲𝟐 𝑰𝑵 𝑪′𝟐)
𝑶 (𝑲𝑵𝒍𝒐𝒈(𝜿))
𝑶 (𝑵 𝑰 ′𝑲 [𝑲𝑰 𝑪 ′𝟐+𝐥𝐨𝐠 (𝜿)])Linear in
number of objects

[email protected], [email protected], [email protected], [email protected]
Synthetic Dataset Results Summary
Synthetic Dataset Results (CDO =The Proposed Algorithm CDODA, SI = Single Iteration Baseline, Homo = Homogenous (Single NMF) Baseline) for C=6
• SI: Single iteration version of CDO• Homo: Treats all objects to be of the same type SI (2.9%)
Homo(21%)

[email protected], [email protected], [email protected], [email protected]
Real Dataset Case Studies (DBLP)• Each research area appears as a pattern and then there are other patterns
with distributions across multiple areas. E.g., “Data Mining” and “Computational Biology” is a pattern
• Some patterns are specific to particular types– “Software engineering” and “Operating systems” for conferences– “Concurrent Distributed and Parallel Computing” and “Security and privacy” for
authors– “Security and privacy” and “Education” for terms
• Top Outlier Author: Giuseppe de Giacomo - Algorithms and Theory (0.25), Databases (0.47), Artificial Intelligence (0.13), Human Computer Interaction (0.06)
• Top conference outlier: From integrated publication and information systems to virtual information and knowledge environments - Databases (0.5), Artificial Intelligence (0.09), Human Computer interaction (0.4)
• Top terms outlier: military - Algorithms and theory (0.02), Security and Privacy (0.37), Databases (0.22), Computer Graphics (0.37)

70
Outlier Detection for Graph Data
Microsoft
Manish Gupta Jing Gao Charu Aggarwal Jiawei HanSUNY IBM UIUC

[email protected], [email protected], [email protected], [email protected]
Tutorial Outline
• Introduction [10 min]• Static Graph Outlier Detection Algorithms [45 min]• Break [10 min]• Dynamic Graph Outlier Detection Algorithms [45
min]– Graph Similarity [15 min]– Evolutionary Community Outlier Detection [20 min]– Online Graph Outlier Detection [10 min]
• Summary [10 min]

[email protected], [email protected], [email protected], [email protected]
Networks Evolve
• Social networks: New users join, new friendships are created
• Bibliographic networks: New authors publish more papers, more collaborations are done
• Transportation/road networks: New roads are constructed
• Ad hoc networks: Army vehicles change positions very frequently, new messages are transmitted

[email protected], [email protected], [email protected], [email protected]
Tutorial Outline
• Introduction [10 min]• Static Graph Outlier Detection Algorithms [45 min]• Break [10 min]• Dynamic Graph Outlier Detection Algorithms [45
min]– Graph Similarity [15 min]– Evolutionary Community Outlier Detection [20 min]– Online Graph Outlier Detection [10 min]
• Summary [10 min]

[email protected], [email protected], [email protected], [email protected]
Graph Similarity-based Outlier Detection Algorithms
• Given a series of graph snapshots• Time series of graph distance metrics can be
individually modeled using univariate autoregressive moving average (ARMA) model
• Outliers are time points where the actual and predicted values differ greater than a threshold
• A large variety of similarity/distance measures have been proposed to compare two graph snapshots
• Notations– and are vertex sets for G and H resp. If , V is used– and are edges in graphs G and H

[email protected], [email protected], [email protected], [email protected]
Graph Similarity/Distance Measures (1)
1. Weight Distance
2. MCS Weight Distance– Same as weight distance but only for edges in
MCS where the maximum common subgraph (MCS) F of G and H is the common subgraph with the most vertices
3. MCS Edge Distance
Papadimitriou et al, Jour. ISA’10; Pincombe, ASOR’05

[email protected], [email protected], [email protected], [email protected]
Graph Similarity/Distance Measures (2)
4. MCS Vertex Distance
5. Median Graph Edit Distance6. Modality Distance
– Absolute value of the difference between the Perron vectors (principal eigen vector of adjacency matrix) of these graphs
Dickinson et al, IDC’02

[email protected], [email protected], [email protected], [email protected]
Graph Similarity/Distance Measures (3)
7. Graph Edit Distanced(G,G ) = |V|+|V |−2|V∩V |+|E|+|E |−2|E∩E |′ ′ ′ ′ ′
Cnd(n)=cost of deleting node nCni(n)=cost of inserting node nCes(n)=cost of substituting an edge weight for edge eCed(n)=cost of deleting edge eCei(n)=cost of inserting edge eC=tradeoff parameter(e)=weight of edge e=smoothing parameter (set to 1)
Shoubridge et al, IDC’99

[email protected], [email protected], [email protected], [email protected]
Graph Similarity/Distance Measures (4)
8. Diameter Distance– difference in the diameters for each graph
9. Entropy Distance where 10. Spectral Distance
Gaston et al, AJC’06

[email protected], [email protected], [email protected], [email protected]
Graph Similarity/Distance Measures (5)
11. Umeyama graph distance
12. The Euclidean distance between the principal eigenvectors of the graph adjacency matrices (Vector Similarity)13. Spearman’s correlation coefficient
– rank correlation between sorted (based on PageRank) lists of vertices of the two graphs
Dickinson and Kraetzl, Fusion’03

[email protected], [email protected], [email protected], [email protected]
Graph Similarity/Distance Measures (6)14. Sequence similarity
– Similarity of vertex sequences of the graphs that are obtained through a graph serialization algorithm
15. Signature similarity– Hamming distance between appropriate fingerprints
of two graphs
16. Vertex/edge overlap (VEO)
17. Vertex ranking (VR)
w is PageRank value, is the vertex rank, D is normalization constant
Papadimitriou et al, WWW’08

[email protected], [email protected], [email protected], [email protected]
Outlier Web Crawl Snapshot• Given multiple crawls of the web graph, find a crawl graph with
anomalies. • These anomalies refer to
– Failures of web hosts that do not allow the crawler to access their content – Hardware/software problems in the search engine infrastructure that can
corrupt parts of the crawled data
• Signature Similarity turned out to be most important measure

[email protected], [email protected], [email protected], [email protected]
Metric Forensics: Introduction
• Study on summary graphs created using some "aggregation" (binary/sum/max) over edge weights of different snapshots in that time interval
• Given a volatile graph it can detect interesting events at multiple levels (both temporally and topologically)
• At the global level, METRICFORENSICS computes and monitors a suite of graph metrics (e.g., the number of active nodes and links, the first few eigenvalues, their wavelet transforms, etc) at regular intervals.
• Only when a deviation from usual behavior is flagged, METRICFORENSICS follows through with a “drill down” approach, where the offending graph is studied at finer temporal and topological resolutions
Henderson et al, KDD’10

[email protected], [email protected], [email protected], [email protected]
Metric Forensics: Outlier Types
• “Elbows” (where the observed behavior changes while another phenomenon remains stable)
• Broken correlations (where previously strong correlations disappear)
• Prolonged spikes (where there is low volume but prolonged activity-level)
• “Lightweight" stars (i.e., vertices that form very big star-like structures but have lower than expected total incident edge-weights)

[email protected], [email protected], [email protected], [email protected]
Metric Forensics: Metrics• Metrics at three levels
– Global• Basic metrics
– Number of active vertices– Number of active edges– Average vertex degree– Average edge weight– Maximum vertex degree
• Connectivity Metrics– Number of connected components– Fraction of vertices in the largest
component– Number of articulation points– Minimum spanning tree weight
• Spectral Metrics– Top-k eigenvalues of the adjacency
matrix
• Stability Metrics– Jaccard( )– Jaccard()
– Community• Static
– Fraction of vertices in the largest community
– Number of communities
• Dynamic– Variation of information between
successive community assignments.– Cross Associations
– Local• Centrality metrics• OddBall• Impact metrics (e.g., leaving a single
vertex out of the graph and recalculating other metrics to determine the impact of the vertex

[email protected], [email protected], [email protected], [email protected]
Metric Forensics: Collection of Analysis Techniques
• Single metric analysis– Autoregressive Moving Average (ARMA) Model to identify metric values that are
abnormally large or small given recent values. – Fourier analysis can identify periodic behavior, such as daily trends in graph properties. – Wavelet analysis to identify patterns and anomalies in metric values. – Lag plots– Outlier detection techniques such as Local Outlier Factor and fractal dimension analysis
• Coupled metric analysis– Pearson Correlation analysis– Outlier detection or clustering on coupled metric data
• Non-metric analysis– Visualization (3D display of summary graphs) tools
• The size of a vertex can show its degree, while the color can depict the vertex between-ness centrality
– Attribute data inspection• Vertices and edges in volatile graphs can have attributes.• For example, IP communication traces often have at least partial packet contents

[email protected], [email protected], [email protected], [email protected]
Metric Forensics: Real Dataset Examples
• Three real-world graphs– An enterprise IP trace (LBNL)– A trace of legitimate and malicious network traffic from a
research institution (ENTP),– MIT Reality Mining proximity sensor data (RMBT)
Variation of top two principal components for ENTP graph. Colors represent time. 2 regions denote “elbows”
The top-14 graph metrics correlated with first principal component in the ENTP data. The sharp drop in correlation for Region 1 depicts a broken correlation.

[email protected], [email protected], [email protected], [email protected]
Tutorial Outline
• Introduction [10 min]• Static Graph Outlier Detection Algorithms [45 min]• Break [10 min]• Dynamic Graph Outlier Detection Algorithms [45
min]– Graph Similarity [15 min]– Evolutionary Community Outlier Detection [20 min]– Online Graph Outlier Detection [10 min]
• Summary [10 min]

[email protected], [email protected], [email protected], [email protected]
Two Definitions for Network Community Outliers
• Community based Outliers: Network nodes that evolve against temporal community change trends– Two snapshots: Evolutionary Community Outliers (ECOutliers)– More than two snapshots: Community Trend Outliers (CTOutliers)
Evolutionary Community Outliers (KDD 2012)
Community Trend Outliers(PKDD 2012)

[email protected], [email protected], [email protected], [email protected]
Communities Evolve
ContractionExpansion
SplitMerge
Gupta et al, KDD’12

[email protected], [email protected], [email protected], [email protected]
Real-life Examples of ECOutliersConglomerate Diversification: Walt Disney
Animation Movies
Theme Parks+ Resorts

[email protected], [email protected], [email protected], [email protected]
ECOutliers: Dataset Representation
Belongingness Matrix Community-Community Correspondence Matrix
Databases (DB)
Data Mining (DM)
InformationRetrieval (IR)
MachineLearning (ML)
06.01.03.0
3.03.03.01.0
4.01.02.03.0
2.03.04.01.0
1.03.04.02.0
DM IR ML DB
P Q
S
X ≈
06.01.03.0
3.03.03.01.0
4.01.02.03.0
2.03.04.01.0
1.03.04.02.0
0002.08.0
4.03.02.01.00
1.01.02.03.03.0
2.02.02.02.02.0
4.01.02.02.01.0
1.0009.00
00100
1.01.01.01.06.0
3.01.03.02.01.0
N N
K1K2
K1
K2

[email protected], [email protected], [email protected], [email protected]
TwoStage Evolutionary Outlier Detection Framework
Outlier Detection
X1
X2
P
Q
Evol
ution
ary
Clus
terin
g
06.01.03.0
3.03.03.01.0
4.01.02.03.0
2.03.04.01.0
1.03.04.02.0
0002.08.0
4.03.02.01.00
1.01.02.03.03.0
2.02.02.02.02.0
4.01.02.02.01.0
×
P S Q
≈
CommunityDetection
Community Matching

[email protected], [email protected], [email protected], [email protected]
OneStage Evolutionary Outlier Detection Framework
CommunityDetection
Community Matching
Outlier Detection
X1
X2
P
Q
06.01.03.0
3.03.03.01.0
4.01.02.03.0
2.03.04.01.0
1.03.04.02.0
0002.08.0
4.03.02.01.00
1.01.02.03.03.0
2.02.02.02.02.0
4.01.02.02.01.0
×
P S Q
≈
A
=
Outlierness Matrix:

[email protected], [email protected], [email protected], [email protected]
OneStage Evolutionary Outlier Detection Framework
CommunityDetection
Community Matching
Outlier Detection
X1
X2
P
Q
06.01.03.0
3.03.03.01.0
4.01.02.03.0
2.03.04.01.0
1.03.04.02.0
0002.08.0
4.03.02.01.00
1.01.02.03.03.0
2.02.02.02.02.0
4.01.02.02.01.0
×
P S Q
≈
A =
×
P S Q
≈
A =
Community Matching
Outlier Detection
Estimate

[email protected], [email protected], [email protected], [email protected]
Community Matching and Outlier Detection Together
𝑷 𝑸𝑺
X ≈
06.01.03.0
3.03.03.01.0
4.01.02.03.0
2.03.04.01.0
1.03.04.02.0
0002.08.0
4.03.02.01.00
1.01.02.03.03.0
2.02.02.02.02.0
4.01.02.02.01.0
1.0009.00
00100
1.01.01.01.06.0
3.01.03.02.01.0
Given and , estimate and
• = #objects• = #clusters in
• 2 = #clusters in • = belongingness matrix for • = belongingness matrix for • = corr. matrix• = outlierness matrix• = maximum level of overall
outlierness

[email protected], [email protected], [email protected], [email protected]
Evolutionary Community Outlier Detection Algorithm (OneStage)
• Input: and • Output: Estimates of and • Initialize , all to and all to • While (not converged)
– Compute (Outlier Detection step)– Compute (Community Matching step)
• Estimate• While (not converged)
– Compute (Outlier Detection step)– Compute (Community Matching step)
• Two pass algorithm• Coordinate descent iterative computation of and
=#objects=#clusters in =#clusters in =#iterations
CommunityMatching
Evolutionary Community
Outlier Detection

[email protected], [email protected], [email protected], [email protected]
Synthetic Datasets
Cluster Merge Cluster Split
Expansion/Contraction No Evolution

[email protected], [email protected], [email protected], [email protected]
N Ψ SynContractExpand SynNoEvolution SynMerge SynSplit SynMix (%) NN 2S 1S 1Sµ NN 2S 1S 1Sµ NN 2S 1S 1Sµ NN 2S 1S 1Sµ NN 2S 1S 1Sµ
1000
1 0.755 0.947 0.966 0.966 0.832 0.791 0.853 0.965 0.72 0.774 0.835 0.926 0.786 0.918 0.929 0.931 0.606 0.891 0.904 0.9252 0.729 0.92 0.948 0.957 0.812 0.733 0.789 0.961 0.702 0.715 0.781 0.908 0.779 0.865 0.92 0.924 0.675 0.823 0.86 0.9155 0.71 0.853 0.913 0.956 0.726 0.712 0.752 0.928 0.645 0.654 0.719 0.849 0.697 0.799 0.891 0.92 0.631 0.77 0.817 0.92
10 0.619 0.766 0.833 0.96 0.657 0.684 0.706 0.881 0.58 0.617 0.656 0.801 0.63 0.749 0.832 0.918 0.594 0.73 0.776 0.917
5000
1 0.778 0.945 0.97 0.97 0.938 0.793 0.848 0.971 0.713 0.762 0.801 0.928 0.796 0.913 0.942 0.942 0.691 0.881 0.895 0.9182 0.756 0.93 0.947 0.961 0.864 0.772 0.815 0.962 0.677 0.752 0.791 0.903 0.768 0.885 0.938 0.94 0.646 0.862 0.876 0.9195 0.689 0.901 0.929 0.964 0.742 0.75 0.779 0.941 0.626 0.698 0.749 0.827 0.689 0.806 0.913 0.924 0.608 0.831 0.86 0.921
10 0.622 0.778 0.829 0.964 0.656 0.73 0.747 0.912 0.579 0.643 0.679 0.795 0.624 0.762 0.834 0.929 0.593 0.783 0.824 0.919
10000
1 0.769 0.949 0.973 0.974 0.926 0.807 0.856 0.974 0.707 0.788 0.817 0.933 0.789 0.938 0.955 0.96 0.665 0.882 0.897 0.9212 0.752 0.937 0.949 0.963 0.851 0.788 0.828 0.964 0.681 0.762 0.796 0.898 0.758 0.898 0.948 0.951 0.67 0.869 0.881 0.9165 0.695 0.9 0.93 0.964 0.738 0.763 0.788 0.951 0.627 0.719 0.756 0.826 0.683 0.807 0.914 0.922 0.604 0.847 0.871 0.919
10 0.622 0.771 0.825 0.965 0.66 0.753 0.769 0.926 0.583 0.645 0.681 0.795 0.621 0.769 0.827 0.934 0.584 0.812 0.845 0.917
Synthetic Dataset Results Summary
• NN: Comparison with old Nearest neighbors without community matching
• 2S: Outlier detection after community matching
• 1S: Single pass version of 1S• 1S: Outlier detection with community
matching
1S (8%)2S (15%)NN (33%)
1S (5%)2S (8%)
NN (36%)
1S (15%)2S (25%)NN (21%)
1S (11%)2S (22%)NN (33%)
1S (3%)2S (10%)NN (30%)
1S (6%)2S (10%)NN (46%)
Average Variance
NN 0.0012
1S 0.0021
2S 0.0017
1S 0.0005

9999
Real Dataset Case Studies
• IMDB Actors Network • Kelly Carlson (I)
– X1: Many Sport, Thriller, and Action movies
– X2: Many Drama, Music, Reality-TV movies
• DBLP Authors Network• Georgios B. Giannakis
– X1 conferences: CISS, ICC, GLOBECOM, INFOCOM
– X2 conferences: ICASSP, ICRA

[email protected], [email protected], [email protected], [email protected]
Two Definitions for Network Community Outliers
• Community based Outliers: Network nodes that evolve against temporal community change trends– Two snapshots: Evolutionary Community Outliers (ECOutliers)– More than two snapshots: Community Trend Outliers (CTOutliers)
Evolutionary Community Outliers (KDD 2012)
Community Trend Outliers(PKDD 2012)

[email protected], [email protected], [email protected], [email protected]
Community Trend Outliers
Anomalous
Normal
Community Trend Outliers: Nodes for which evolutionary behaviour across a series of snapshots is quite different from that of its community members
Gupta et al, PKDD’12

[email protected], [email protected], [email protected], [email protected]
Possible to Extend OneStage for Multiple Snapshots?
• Belongingness Matrices: • Outlierness Matrices: • For two snapshots, we did: • For snapshots?
• Drawbacks– Inefficient: Too many variables– Unable to capture patterns of length >2– May try to overfit to capture all length-2 patterns– Unable to capture subtle patterns of change

[email protected], [email protected], [email protected], [email protected]
Soft Sequence Representation
• Every object has a distribution associated with it across time– In a co-authorship network, an author has a distribution of research areas associated
with it across years
Soft sequence for object denoted by <1: (A:0.1 , B:0.8 , C:0.1) , 2: (D:0.07 , E:0.08 , F:0.85) , 3: (G:0.08 , H:0.8 , I:0.08 , J:0.04)>Hard sequence is <1:B, 2:F, 3:H>Outliers: ■ and

[email protected], [email protected], [email protected], [email protected]
Problem Formulation
• Problem – Input: Soft sequences (each of length T) for N objects,
denoted by matrix S– Output: Set of CTOutlier objects
• SubProblems– Pattern Extraction
• Input: Soft sequences (S)• Output: Frequent soft patterns (P)
– Outlier Detection• Input: Frequent soft patterns (P)• Output: Set of CTOutlier objects
[email protected], [email protected], [email protected], [email protected]
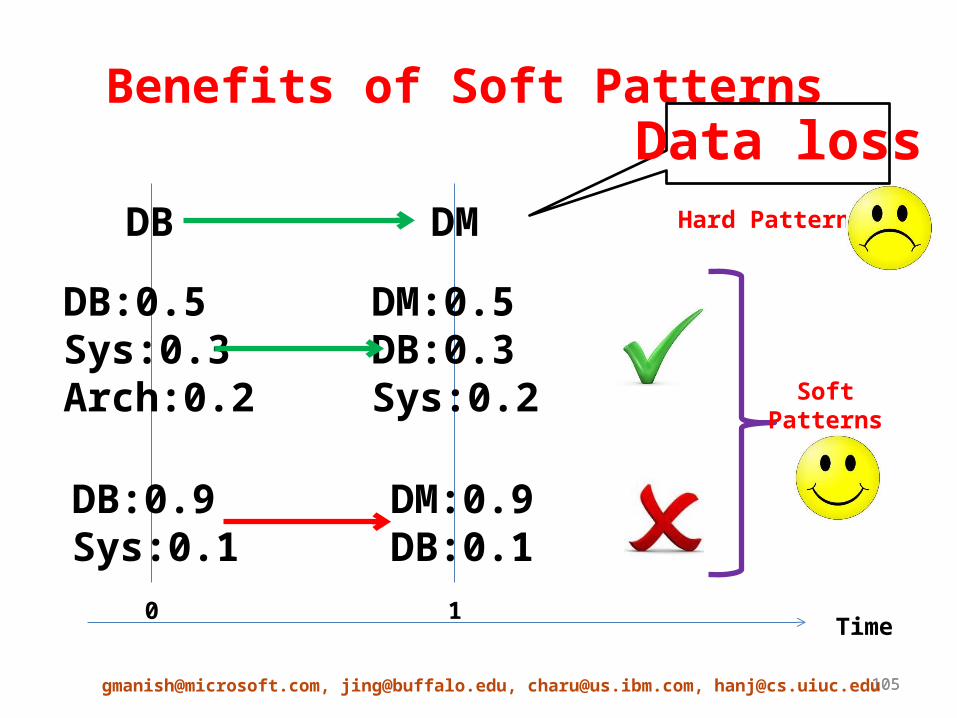
Benefits of Soft Patterns
Time0 1
DB DM Hard Pattern
DB:0.5Sys:0.3Arch:0.2
DM:0.5DB:0.3Sys:0.2
DB:0.9Sys:0.1
DM:0.9DB:0.1
SoftPatterns
Data loss

[email protected], [email protected], [email protected], [email protected]
Support Computation for Soft Patterns
𝑠𝑢𝑝 (𝑃 𝑡𝑝 )=∑𝑜=1
𝑁 [1− 𝐷𝑖𝑠𝑡 (𝑆𝑡 𝑜,𝑃 𝑡 𝑝 )
𝑚𝑎𝑥𝐷𝑖𝑠𝑡 (𝑃 𝑡𝑝 ) ]Notation Meaningmin_sup Minimum Support
t Index for timestampso Index for objectsp Index for patternsN Total number of objectsT Total number of timestamps
Distribution for object o at time t
Distribution for pattern p at time t
Set of timestamps for pattern p
𝑠𝑢𝑝 (𝑝)=∑𝑜=1
𝑁
∏𝑡 ∈𝑇𝑆𝑝
[1− 𝐷𝑖𝑠𝑡 (𝑆𝑡 𝑜,𝑃 𝑡 𝑝 )
𝑚𝑎𝑥𝐷𝑖𝑠𝑡 (𝑃 𝑡𝑝 ) ]For longer patterns
Candidate generation uses Apriori

[email protected], [email protected], [email protected], [email protected]
CTOutlier Detection
• Given: Set of soft patterns (P) and set of sequences (S)• Output: Find outlier sequences
– But object o may follow only one pattern! So, sum may be incorrect– But generally will be min for very short pattern mostly of length 2
1 2 3 4 5 6 7 8 9 10
Pattern p
Sequence o
(Match): {1,2,5,7,8} (Mismatch): {4,10}
Gapped Pattern

[email protected], [email protected], [email protected], [email protected]
Outlier Score using Pattern Configurations
• Divide pattern space into different “projections” called configurations
• A configuration is a set of timestamps of size>1
• E.g., {1,3,4} is a configuration
where bmpoc is the best matching pattern for object o given the configuration c, and C is the set of all configurations
T=4

[email protected], [email protected], [email protected], [email protected]
Finding Best Matching Pattern
• Find all patterns that are defined exactly for configuration • For each such pattern
• Match Score is high if– Timestamps where the and match are high– has higher support– represents compact clusters – is close to the cluster centroid of across the various timestamps
• Best matching pattern for is pattern with highest
h𝑚𝑎𝑡𝑐 (𝑜 ,𝑝)= ∑𝑡∈ 𝜙𝑝𝑜
¿ (𝑃 𝑡 𝑝 )×(𝑃 𝑡𝑝
,𝑆𝑡𝑜)
𝑎𝑣𝑔𝐷𝑖𝑠𝑡 (𝑃𝑡 𝑝)
[email protected], [email protected], [email protected], [email protected]
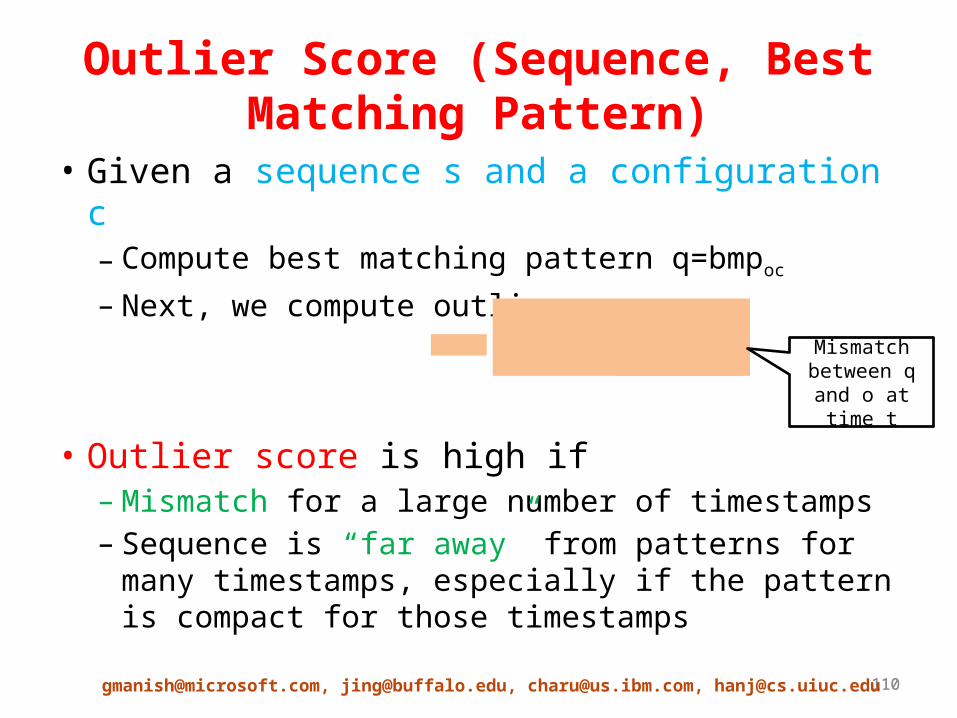
Outlier Score (Sequence, Best Matching Pattern)
• Given a sequence s and a configuration c– Compute best matching pattern q=bmpoc
– Next, we compute outlier score as
• Outlier score is high if– Mismatch for a large number of timestamps– Sequence is “far away” from patterns for many
timestamps, especially if the pattern is compact for those timestamps
Mismatch between q and
o at time t

[email protected], [email protected], [email protected], [email protected]
Experiments
• Lack of ground truth• Synthetic Datasets with a variety of settings
– Precision at rank=number of injected outliers• Real datasets: Four Area, Budget
Dataset Duration T N Communities
Four Area
2000-01 to 2008-09
5 643 authors DB, DM, IR, ML
Budget 2001-10 10 50 states Pensions, Health Care, Education, Defense, Welfare, Protection, Transportation, General Government, Other Spending

[email protected], [email protected], [email protected], [email protected]
Baselines
• Consecutive (BL1)– Configurations of length-2 with consecutive
timestamps only
Time0 1 2 43

[email protected], [email protected], [email protected], [email protected]
Baselines
• No-gaps (BL2)– Configurations without any gapped timestamps
Time0 1 2 43
Frequent
Not Frequent
Ungapped patternsCannot capture this!

[email protected], [email protected], [email protected], [email protected]
N Outliers Outlier Degree=0.8(%) |P|=5 |P|=10 |P|=15
CTO BL1 BL2 CTO BL1 BL2 CTO BL1 BL21 95.5 85.5 92 83 76.5 84 92 77 86
1000 2 98.2 94.5 96.5 91.2 86.5 90 95.5 76 945 99 95.7 97.3 96.3 91 95.9 97.4 79.3 96.71 95.8 83.5 89.8 84.4 76.6 84.4 88.4 73.1 86.1
5000 2 97.9 89.6 94 89.4 85.6 88.4 95.4 79.8 93.15 98.8 95.4 97.6 95 90.5 94.7 97.7 79.7 96.91 95.6 84.2 89.5 81.8 76.4 82.8 91.8 76.5 87.6
10000 2 98 91.1 95 89.9 86.9 90.7 95.8 80.6 93.35 99.1 95.8 98 95.3 90.1 95.3 97.3 76.4 96.6
Synthetic Dataset Results
CTO=The Proposed Algorithm CTODABL1=Consecutive Baseline
BL2=No-gaps Baseline
BL1 (7.4%)BL2 (2.3%)
Runtime(seconds)
83
116
184Average Std Dev.
BL1 0.0485
BL2 0.0339
CTO 0.0311

[email protected], [email protected], [email protected], [email protected]
Real Dataset Case Studies (Four Area)
• 1008 patterns (10% support)• General trends
– Authors switch between data mining and machine learning – Authors switch between information retrieval and
databases• Outlier’s sequence
– 2000-01: (IR:0.75, DB:0.25)2002-03: (IR:1)2004-05: (DB:1)2006-07: (DB:0.67, DM:0.33)2008-09: (DB:0.5, ML:0.5)

[email protected], [email protected], [email protected], [email protected]
Real Dataset Case Studies (Budget)• 41545 patterns (20% support)• State of Arkansas
2001
2002
2003
2004
2005
2006
2007
2008
2009
2010
0%
10%
20%
30%
40%
50%
60%
70%
80%
90%
100%
Other Spending General Government Transportation Protection Welfare Defense Education Health CarePensions
2001
2002
2003
2004
2005
2006
2007
2008
2009
2010
0%
10%
20%
30%
40%
50%
60%
70%
80%
90%
100%
Other Spending General Government Transportation Protection Welfare Defense Education Health CarePensions
Average trend of 5 states with distributionsclose to that of AK for 2004-2009
Distributions of Budget Spending for AK

[email protected], [email protected], [email protected], [email protected]
Tutorial Outline
• Introduction [10 min]• Static Graph Outlier Detection Algorithms [45 min]• Break [10 min]• Dynamic Graph Outlier Detection Algorithms [45
min]– Graph Similarity [15 min]– Evolutionary Community Outlier Detection [20 min]– Online Graph Outlier Detection [10 min]
• Summary [10 min]

[email protected], [email protected], [email protected], [email protected]
Eigenspace-based Anomaly DetectionIde and Kashima,KDD’04
LeftSingularVector

[email protected], [email protected], [email protected], [email protected]
Outliers in Mobile Communication GraphsAkoglu et al, ASC’10

[email protected], [email protected], [email protected], [email protected]
Structural Outlier Detection• [Aggarwal et al., 2011] propose the problem of structural outlier detection
in massive network streams• Outliers are graph objects which contain unusual bridging edges• The network is dynamically partitioned in order to construct statistically
robust models of the connectivity behavior• For robustness, multiple such partitionings are maintained• These models are maintained with the use of an innovative reservoir
sampling approach for efficient structural compression of the underlying graph stream
• Using these models, edge generation probability is defined and then graph object likelihood fit is defined as the geometric mean of the likelihood fits of its constituent edges
• Those objects for which this fit is t standard deviations below the average of the likelihood probabilities of all objects received so far are reported as outliers
Aggarwal et al, ICDE’11

[email protected], [email protected], [email protected], [email protected]
Graph Outliers in Graph Streams• [Aggarwal et al., 2011] discover graphs representing inter-disciplinary
research papers as outliers from the DBLP dataset. They also discover movies with a cast from multiple countries as outliers from the IMDB dataset
• (DBLP) Yihong Gong, Guido Proietti, Christos Faloutsos, Image Indexing and Retrieval Based on Human Perceptual Color Clustering, CVPR 1998: 578-585– Yihong Gong: computer vision and multimedia processing– Christos Faloutsos: database and data mining
• (DBLP) Natasha Alechina, Mehdi Dastani, Brian Logan, John-Jules Ch Meyer, A Logic of Agent Programs, AAAI 2007: 795-800– Natasha Alechina: United Kingdom– John-Jules Ch Meyer: Netherlands
• (IMDB) Movie Title: Cradle 2 the Grave (2003)– Jet Li: Chinese actor– DMX (I): American actor

[email protected], [email protected], [email protected], [email protected]
Tutorial Outline
• Introduction [10 min]• Static Graph Outlier Detection Algorithms [45
min]• Break [10 min]• Dynamic Graph Outlier Detection Algorithms
[45 min]• Summary [10 min]

[email protected], [email protected], [email protected], [email protected]
Summary• Static Graph Outlier Detection Algorithms
– Minimum Description Length• Outlier Edge Detection, GBAD, Entropy Measures of Graph Regularity, Structural Anomalies
– Ego-net Metrics• OddBall, LOADED
– Random Walks• General Graphs, Bipartite Graphs
– Random Field Models• Community Outliers and Outlier Links in Heterogeneous Networks
– Outliers in Heterogeneous Networks• Clique outliers and Community Distribution Outliers
• Dynamic Graph Outlier Detection Algorithms– Graph Similarity
• Graph Similarity/Distance Metrics, Metric Forensics
– Evolutionary Community Outlier Detection• Evolutionary Community Outliers, Community Trend Outliers
– Online Graph Outlier Detection• Eigenspace-based Anomaly Detection, Structural Outlier Detection
[email protected], [email protected], [email protected], [email protected]
Further Reading
• Outlier Analysis (Springer) Authored by Charu Aggarwal, January 2013
• Survey on outlier detection for temporal data– http://
dais.cs.uiuc.edu/manish/pub/gupta12_temporalOutlierDetectionSurvey.pdf
• SDM 2013 Tutorial on Outlier Detection for Temporal Data– http://
dais.cs.uiuc.edu/manish/ppt/gupta13_sdmb.pptx

[email protected], [email protected], [email protected], [email protected]
References (1)• [AF10] L. Akoglu and C. Faloutsos. Event Detection in Time Series of Mobile Communication Graphs. In
Proc. of the Army Science Conf., 2010. • [AMF10] Leman Akoglu, Mary McGlohon, and Christos Faloutsos. Oddball: Spotting anomalies in
weighted graphs. In Proc. of the 14th Pacific-Asia Conf. on Advances in Knowledge Discovery and Data Mining (PAKDD), pages 410–421. Springer, 2010.
• [AZY11] Charu C. Aggarwal, Yuchen Zhao, and Philip S. Yu. Outlier Detection in Graph Streams. In Proc. of the 27th Intl. Conf. on Data Engineering (ICDE), pages 399–409. IEEE Computer Society, 2011.
• [Cha04] Deepayan Chakrabarti. AutoPart: Parameter-free Graph Partitioning and Outlier Detection. In Proc. of the 8th European Conf. on Principles and Practice of Knowledge Discovery in Databases (PKDD), pages 112–124, 2004.
• [DBDK02] P. Dickinson, H. Bunke, A. Dadej, and M. Kraetzl. Median Graphs and Anomalous Change Detection in Communication Networks. In Proc. of the Intl. Conf. on Information, Decision and Control, pages 59–64, Feb 2002.
• [DK03] P. Dickinson and M. Kraetzl. Novel Approaches in Modelling Dynamics of Networked Surveillance Environment. In Proc. of the 6th Intl. Conf. of Information Fusion, volume 1, pages 302–309, 2003.
• [EH07] William Eberle and Lawrence Holder. Discovering structural anomalies in graph-based data. In Proc. of the 7th IEEE Intl. Conf. on Data Mining Workshops (ICDMW), pages 393–398, 2007.
• [GAH11] Manish Gupta, Charu C. Aggarwal, and Jiawei Han. Finding Top-K Shortest Path Distance Changes in an Evolutionary Network. In Proc. of the 12th Intl. Conf. on Advances in Spatial and Temporal Databases (SSTD), pages 130–148, 2011.

[email protected], [email protected], [email protected], [email protected]
References (2)• [GAHS11] Manish Gupta, Charu C. Aggarwal, Jiawei Han, and Yizhou Sun. Evolutionary Clustering and Analysis of
Bibliographic Networks. In Proc. of the 2011 Intl. Conf. on Advances in Social Networks Analysis and Mining (ASONAM), pages 63–70, 2011.
• [GGSH12a] Manish Gupta, Jing Gao, Yizhou Sun, and Jiawei Han. Community Trend Outlier Detection using Soft Temporal Pattern Mining. In Proc. of the 2012 European Conf. on Machine Learning and Knowledge Discovery in Databases (ECML PKDD), pages 692–708, 2012.
• [GGSH12b] Manish Gupta, Jing Gao, Yizhou Sun, and Jiawei Han. Integrating Community Matching and Outlier Detection for Mining Evolutionary Community Outliers. In Proc. of the 18th ACM Intl. Conf. on Knowledge Discovery and Data Mining (KDD), pages 859–867, 2012.
• [GLF+10] Jing Gao, Feng Liang, Wei Fan, Chi Wang, Yizhou Sun, and Jiawei Han. On Community Outliers and their Efficient Detection in Information Networks. In Proc. of the 16th ACM Intl. Conf. on Knowledge Discovery and Data Mining (KDD), pages 813–822, 2010. 6
• [GOP04] Amol Ghoting, Matthew Eric Otey, and Srinivasan Parthasarathy. LOADED: Link-Based Outlier and Anomaly Detection in Evolving Data Sets. In Proc. of the 4th IEEE Intl. Conf. on Data Mining (ICDM), pages 387–390, 2004.
• [HERF+10] Keith Henderson, Tina Eliassi-Rad, Christos Faloutsos, Leman Akoglu, Lei Li, KojiMaruhashi, B. Aditya Prakash, and Hanghang Tong. Metric Forensics: A Multi-level Approach for Mining Volatile Graphs. In Proc. of the 16th ACM SIGKDD Intl. Conf. on Knowledge Discovery and Data Mining (KDD), pages 163–172, 2010.
• [IK04] Tsuyoshi ID´E and Hisashi KASHIMA. Eigenspace-based Anomaly Detection in Computer Systems. In Proc. of the 10th ACM Intl. Conf. on Knowledge Discovery and Data Mining (KDD), pages 440–449, 2004.
• [KDD07] K. M. Kapsabelis, P. J. Dickinson, and K. Dogancay. Investigation of Graph Edit Distance Cost Functions for Detection of Network Anomalies. In Proc. of the 13th Biennial Computational Techniques and Applications Conf. (CTAC), volume 48, pages C436–C449, Oct 2007.

[email protected], [email protected], [email protected], [email protected]
References (3)• [LYY+05] Chao Liu, Xifeng Yan, Hwanjo Yu, Jiawei Han, and Philip S. Yu. Mining Behavior Graphs for “Back-
trace” of Noncrashing Bugs. In Proc. of the 5th SIAM Intl. Conf. on Data Mining (SDM), pages 286–297, 2005.
• [MT06] H. D. K. Moonesignhe and Pang-Ning Tan. Outlier Detection Using Random Walks. In Proc. of the 18th IEEE Intl. Conf. on Tools with Artificial Intelligence (ICTAI), pages 532–539, 2006.
• [NC03] Caleb C. Noble and Diane J. Cook. Graph-Based Anomaly Detection. In Proc. of the 9th ACM SIGKDD Intl. Conf. on Knowledge Discovery and Data Mining (SIGKDD), pages 631–636. ACM, 2003.
• [PCMP05] Carey E. Priebe, John M. Conroy, David J. Marchette, and Youngser Park. Scan Statistics on Enron Graphs. Computational & Mathematical Organization Theory, 11(3):229–247, Oct 2005.
• [PDGM10] Panagiotis Papadimitriou, Ali Dasdan, and Hector Garcia-Molina. Web Graph Similarity for Anomaly Detection. Journal of Internet Services and Applications, 1(1):19–30, 2010.
• [Pin05] Brandon Pincombe. Anomaly Detection in Time Series of Graphs using ARMA Processes. ASOR Bulletin, 24(4):2–10, 2005.
• [QAH12] Guo-Jun Qi, Charu C. Aggarwal, and Thomas S. Huang. On Clustering Heterogeneous Social Media Objects with Outlier Links. In Proc. of the 5th ACM Intl. Conf. on Web Search and Data Mining (WSDM), pages 553–562, 2012.
• [SKR99] P. Shoubridge, M. Kraetzl, and D. Ray. Detection of Abnormal Change in Dynamic Networks. In Proc. of the Intl. Conf. on Information, Decision and Control, pages 557–562, 1999.
• [SQCF05] Jimeng Sun, Huiming Qu, Deepayan Chakrabarti, and Christos Faloutsos. Neighborhood Formation and Anomaly Detection in Bipartite Graphs. In Proc. of the 5th IEEE Intl. Conf. on Data Mining (ICDM), pages 418–425, 2005.