Our people care more/media/Files/E/...EXPEDITORS INTERNATIONAL OF WASHINGTON, INC. (Exact name of...
87
Our people care more...
Transcript of Our people care more/media/Files/E/...EXPEDITORS INTERNATIONAL OF WASHINGTON, INC. (Exact name of...

Our people care more...

...just ask our customers.

we were still solidly profitable. 2010 started off well and ended terrific. The main reason for such a solid year is predicated on one large factor…our no layoff policy. At the conclusion of 2008 there were signs of a severe slowdown. We decided at that time to initiate a hiring freeze and institute a “no layoff policy” in order to protect our two most important assets: our people and our customers. Some in our industry had considerable layoffs, but we’ve always believed that layoffs are a poor strategy, particularly in this very “people business.” One can park planes and ships but one cannot park people.
This decision, in my mind, was a sound one, as this year’s results indicate. What’s paying off for us now, and what customers are increasingly looking to us for, are our financial stability, our I.T. prowess, and the tenure of our people. The retention of our employees and our customers is paramount to the creation of long-term value at Expeditors...and they are intrinsically linked. One would think one could not be criticized for making such a decision. Well we were; not surprisingly by Wall Street, who in their infinite wisdom clearly stated that had we laid people off, our profits would have been higher. Fortunately we don’t work for Wall Street or anyone else who might describe a 35% year-over-year increase in operating income as “lackluster.” Not taking their advice to sacrifice our most valuable assets, our people, for short-term profits in 2009, paid off quite well for us in 2010. As the old saying goes, “sometimes you have to put your money where your mouth is.” We think these results show that we did the correct thing, for both 2010 and for the future. In this day and age, loyalty is fleeting, but the majority of our customers have been just that – loyal and for that we can’t thank them enough. Who takes care of them? The same employees that weren’t laid off. We have always said that our primary job is to take care of our people, their primary job is to take care of our customers, and that should take care of Wall Street. We believe (and always have) that corporate performance is a direct function of employee satisfaction, and we have managed accordingly. Employee satisfaction improves customers service, which in turn creates greater customer satisfaction, and that creates greater value for Expeditors. That’s a little long winded however it bespeaks of our culture and explains our continued achievement. What about 2011…who knows? The fact that every year is an anomaly is what makes it interesting. What surprises await us? More government regulations, more cargo security rules, perhaps more mergers of carriers. Having successfully navigated through the downtown of 2009 and experienced the great turnaround in 2010, more than ever, we believe that we still have the best people and the best customers. With our two greatest assets secure, we can’t think of a better springboard for whatever 2011 may bring.
Thank you for your continued support.
Peter J. RoseChairman of the Board & CEO
What a difference a year makes! 2009 was the worst year I’ve ever experienced during my career, and yet...

Geographic Overview

After the difficult year of 2009, 2010 was a year of rebound, and a big one at that. Our no layoff strategy proved its great value by retaining some of the best employees in the industry, whose combined efforts resulted in a jump in operating income of 33% as compared with the previous year. This achievement could not have happened if we had not focused on our core strategy of continuous improvement in customer service, operational efficiency, and service provider partnerships. To cope with this rapid growth, we strengthened our management team by continuing to promote from within. We also invested in new offices (e.g. Beijing, Zhengzhou and Chengdu), and product advancements (e.g. road freight service and customs compliance). Last but not least, the integration of Asia and South Pacific to Asia-Pacific has been successful and has focused these two regions to work more closely together to develop more business opportunities.
Looking forward to 2011, we see stronger cooperation for business development with the Americas and EMAIR regions, as well as with offices within our own Asia-Pacific region. We believe that our focus on product diversification, especially in the areas of import, distribution services and road freight services, will strengthen our product portfolio and attract more customers. In addition, the enhancement of strategic partnerships with our service providers will continue to ensure capacity stability, performance sustainability, and legal compliance. In terms of network expansion, new offices are planned in Northern and Western China, Malaysia, Korea and Indonesia. By combining the growth initiatives with continuous cost and process management, we are confident of achieving our goals in the coming year.
James L. WangPresident- Asia Pacific
Asia Pacific

When you have a year like 2010, you let the numbers speak for themselves. The Americas’ net revenues were up 21% while operating income was up 58%. This is a tribute to our people…who are the best professionals in the industry. Without them none of this would have been possible. By investing in our people in 2009, we reaped the benefits, and then some, in 2010. As we reflect back on 2010, we saw our volumes increase with little or no additional headcount. This is a tribute to process improvement and productivity initiatives we’ve had in place for several years now.
As we look forward to 2011, we will continue to invest in new product offerings and account retention capabilities and will continue our commitment to compliance at each district branch. This has proven to be the correct strategy. Most importantly, we can expect more of the same in our continued focus on superior customer service, which is the backbone of our organization.
Bob VillanuevaPresident, The Americas
The Americas

The EMAIR groups’ dedication and commitment to the execution of our plans throughout 2010, resulted in the EMAIR groups’ increase in operating income of 29% as compared with 2009. While there were many good things that occurred in the EMAIR region this year, none were more important than seeing the growth in our people and the corresponding increase in business that was entrusted to us by our customers.
Our objective for 2011 is to focus aggressively on, and gain the nomination from many more EMAIR-based global companies, and to become their strategic logistics partners. Our follow-up on effective cash management, including credit and receivable control, will continue to be a priority while continuing to enhance our already robust sales and customer retention programs. As always I want to extend my sincere thanks and appreciation to our supportive customers, service providers and our ever-dedicated EMAIR Team. Rommel C. SaberPresident - Europe, Africa Near/Middle East & Indian Subcontinent
EMAIR

UNITED STATESSECURITIES AND EXCHANGE COMMISSION
Washington, D.C. 20549
FORM 10-K(Mark One)
È ANNUAL REPORT PURSUANT TO SECTION 13 OR 15(d) OF THE SECURITIESEXCHANGE ACT OF 1934
For the fiscal year ended December 31, 2010OR
‘ TRANSITION REPORT PURSUANT TO SECTION 13 OR 15(d) OF THE SECURITIESEXCHANGE ACT OF 1934
For the transition period from toCommission File Number: 0-13468
EXPEDITORS INTERNATIONAL OF WASHINGTON, INC.(Exact name of registrant as specified in its charter)
Washington 91-1069248(State or other jurisdiction of
incorporation or organization)(I.R.S. Employer
Identification Number)
1015 Third Avenue, 12th Floor, Seattle, Washington 98104(Address of principal executive offices) (Zip Code)
(206) 674-3400(Registrant’s telephone number, including area code)
Securities registered pursuant to Section 12(b) of the Act:Title of each class Name of each exchange on which registered
Common Stock, par value $.01 per share NASDAQ Global Select MarketSecurities registered pursuant to Section 12(g) of the Act: None
Indicate by check mark if the registrant is a well-known seasoned issuer, as defined in Rule 405 of the Securities Act. Yes È No ‘
Indicate by check mark if the registrant is not required to file reports pursuant to Section 13 or Section 15(d) of the Act. Yes ‘ No È
Indicate by check mark whether the registrant (1) has filed all reports required to be filed by Section 13 or 15(d) of the Securities ExchangeAct of 1934 during the preceding 12 months (or for such shorter period that the registrant was required to file such reports), and (2) has been sub-ject to such filing requirements for the past 90 days. Yes È No ‘
Indicate by check mark whether the registrant has submitted electronically and posted on its corporate Web site, if any, every InteractiveData File required to be submitted and posted pursuant to Rule 405 of Regulation S-T (§232.405 of this chapter) during the preceding 12 months (orfor such shorter period that the registrant was required to submit and post such files). Yes È No ‘
Indicate by check mark if disclosure of delinquent filers pursuant to Item 405 of Regulation S-K (§229.405 of this chapter) is not containedherein, and will not be contained, to the best of registrant’s knowledge, in definitive proxy or information statements incorporated by reference inPart III of this Form 10-K or any amendment to this Form 10-K. ‘
Indicate by check mark whether the registrant is a large accelerated filer, an accelerated filer, a non-accelerated filer, or a smaller reportingcompany. See the definitions of “large accelerated filer,” “accelerated filer” and “smaller reporting company” in Rule 12b-2 of the Exchange Act.(Check one):
Large accelerated filer È Accelerated filer ‘Non-accelerated filer ‘ (Do not check if a smaller reporting company) Smaller reporting company ‘
Indicate by check mark whether the registrant is a shell company (as defined in Rule 12b-2 of the Act). Yes ‘ No È
At June 30, 2010, the aggregate market value of the registrant’s Common Stock held by non-affiliates of the registrant was approximately$7,209,494,453.
At February 18, 2011, the number of shares outstanding of registrant’s Common Stock was 212,197,775.
DOCUMENTS INCORPORATED BY REFERENCEPortions of the definitive proxy statement for the Registrant’s 2011 Annual Meeting of Shareholders to be held on May 4, 2011 are
incorporated by reference into Part III of this Form 10-K.

Forward-Looking Statements
In accordance with the provisions of the Private Securities Litigation Reform Act of 1995, the Company is makingreaders aware that forward-looking statements, because they relate to future events, are by their very nature sub-ject to many important risk factors which could cause actual results to differ materially from those contained inthe forward-looking statements. For additional information about forward-looking statements and for an identi-fication of risk factors and their potential significance, see “Safe Harbor for Forward-Looking Statements UnderPrivate Securities Litigation Reform Act of 1995; Certain Cautionary Statements” immediately preceding Part II,Item 7 “Management’s Discussion and Analysis of Financial Condition and Results of Operations” in this report.
PART I
ITEM 1 — BUSINESS
Expeditors International of Washington, Inc. is engaged in the business of providing global logistics services.The Company offers its customers a seamless international network supporting the movement and strategicpositioning of goods. The Company’s services include the consolidation or forwarding of air and ocean freight. Ineach United States office, and in many overseas offices, the Company acts as a customs broker. The Companyalso provides additional services including distribution management, vendor consolidation, cargo insurance,purchase order management and customized logistics information. The Company does not compete for overnightcourier or small parcel business and does not own aircraft or steamships.
Beginning in 1981, the Company’s primary business focus was on airfreight shipments from Asia to theUnited States and related customs brokerage and other services. In the mid-1980’s, the Company began to expandits service capabilities in export airfreight, ocean freight and distribution services. Today the Company offers acomplete range of global logistics services to a diversified group of customers, both in terms of industry special-ization and geographic location. As opportunities for profitable growth arise, the Company plans to create newoffices. While the Company has historically expanded through organic growth, the Company has also been opento growth through acquisition of, or establishing joint ventures with, existing agents or others within the industry.
The Company, including its majority-owned subsidiaries, operates full service offices (•) in the cities identi-fied below. Full service offices have also been established in locations where the Company maintains unilateralcontrol over assets and operations and where the existence of the parent-subsidiary relationship is maintained bymeans other than record ownership of voting stock (#). In other cities, the Company contracts with independentagents to provide required services and has established approximately 48 such relationships world-wide. Loca-tions where Company employees perform sales and customer service functions are identified below as interna-tional service centers (*). Wholly-owned locations operating under the supervision and control of another fullservice office are identified as satellite offices (+). In each case, the opening date for the full service office,international service center or satellite office is set forth in parenthesis.
UNITED STATES AND OTHER NORTH AMERICA
UNITED STATES• Seattle (5/79)• Chicago (7/81)• San Francisco (7/81)• New York (11/81)• Los Angeles (5/82)• Atlanta (8/83)• Boston (11/85)• Miami (3/86)• Minneapolis (7/86)• Denver (2/88)
• Baltimore (4/92)• Dallas (5/92)• Columbus (6/92)• Charlotte (7/92)• Newark (9/94)• Philadelphia (3/95)• Charleston (6/95)• Memphis (8/95)• Salt Lake City (11/95)• Norfolk (9/96)• Indianapolis (11/96)
• McAllen (4/98)• Pittsburgh (6/99)• Savannah (3/00)• Milwaukee (7/00)• Kansas City (8/00)• Washington, D.C. (9/00)• Nashville (10/01)+ Huntsville (12/02)• Austin (2/03)• Orlando (8/03)• Tampa (9/03)
• Vancouver (9/95)+ Windsor (6/98)• Montreal (4/99)• Calgary (9/04)
MEXICO• Mexico City (6/95)• Nuevo Laredo (4/97)• Guadalajara (9/97)• Nogales (1/99)• Ciudad Juarez (5/00)• Monterrey (1/05)
| 1.

UNITED STATES AND OTHER NORTH AMERICA
• Detroit (7/88)• Portland (7/88)• Cincinnati (8/89)• Cleveland (7/90)• Phoenix (7/91)• Louisville (10/91)• St. Louis (4/92)• Houston (4/92)
+ Port Huron-Blue WaterBridge (12/96)
+ Detroit-AmbassadorBridge (12/96)
• Buffalo-Peace Bridge(1/97)
• El Paso (1/97)• Laredo (2/97)• Nogales (2/97)• San Diego (7/97)+ Rochester (10/97)
• New Orleans (9/04)+ Omaha (7/06)+ Calexico (6/06)+ Knoxville (5/07)• Raleigh Durham (1/08)+ Tulsa (1/09)
CANADA• Toronto (5/84)
• Reynosa (6/06)+ Querétaro (9/06)+ Lázaro Cárdenas (7/08)
PUERTO RICO• San Juan (5/95)
LATIN AMERICA
ARGENTINA• Buenos Aires (1/98)
BRAZIL• Sao Paulo (9/95)• Rio de Janeiro (9/95)• Campinas (9/95)+ Santos (10/97)• Manaus (7/00)• Porto Alegre (1/05)
• Curitiba (10/10)+ Belo Horizonte (10/10)
CHILE• Santiago (2/95)
COLOMBIA• Bogota (12/98)+ Cali (12/98)+ Medellin (7/00)
COSTA RICA• San Jose (10/03)
GUATEMALA• Guatemala City (1/07)
PERU• Lima (12/05)
ASIA PACIFIC
AUSTRALIA• Sydney (8/88)• Melbourne (8/88)• Brisbane (10/93)• Perth (12/94)• Adelaide (10/97)
BANGLADESH• Dhaka (6/89)+ Chittagong (8/93)
CAMBODIA• Phnom Penh (4/00)
PEOPLE’S REPUBLICOF CHINA• Guangzhou (4/94)• Beijing (7/94)• Dalian (7/94)• Shanghai (7/94)• Shenzhen (7/94)• Qingdao (7/94)• Tianjin (7/94)• Xi’an (7/94)• Xiamen (7/94)+ Chengdu (9/00)• Ningbo (7/01)
• Suzhou (9/01)• Zhongshan (9/01)• Hangzhou (10/01)+ Kunshan (12/01)• Fuzhou (6/02)• Yantai (11/02)+ Shenyang (12/02)• Wuhan (1/03)+ Huizhou (12/03)+ Zhuhai (12/03)+ Foshan (1/04)• Chongqing (7/04)• Dongguan (2/05)• Nanjing (3/05)+ Macau (5/05)+ Shantou (12/06)+ Changzhou (10/07)
FIJI* Nadi (7/96)* Suva (5/97)
HONG KONG• Kowloon (6/81)
INDONESIA• Jakarta (12/90)• Surabaya (2/92)+ Batam (3/07)
JAPAN• Tokyo (1/01)• Osaka (1/01)+ Nagoya (8/03)
MALAYSIA• Penang (11/87)• Kuala Lumpur (6/90)• Johor Bahru (11/94)
NEW ZEALAND• Auckland (8/88)+ Christchurch (10/07)
PHILIPPINES• Manila (8/98)+ Olongapo City (8/98)+ Cebu City (9/99)
SINGAPORE• Singapore (9/81)
SRI LANKA• Colombo (3/95)
SOUTH KOREA• Seoul (10/94)+ Pusan (10/94)+ Chonan (6/96)+ Kwangju (6/96)+ Masan (6/96)+ Taegu (6/96)
TAIWAN• Taipei (7/81)+ Kaohsiung (9/81)+ Taichung (9/81)+ Hsin-Chu (9/89)
THAILAND• Bangkok (9/94)+ Laem Chabang (8/05)
VIETNAM• Ho Chi Minh City (5/00)• Hanoi (3/04)+ Da Nang (9/05)
2. |

EUROPE AND AFRICA
AUSTRIA• Vienna (11/95)
BELGIUM• Brussels (7/90)+Antwerp (4/91)
THE CZECH REPUBLIC• Prague (6/98)
FINLAND• Helsinki (4/94)
FRANCE• Paris (1/97)• Mulhouse (1/97)• Lyon (1/97)• Lille (3/97)• Bordeaux (7/00)
GERMANY• Frankfurt (4/92)• Munich (4/92)• Dusseldorf (4/92)
• Stuttgart (4/92)• Hamburg (1/93)• Nuremberg (1/01)+ Hannover (1/05)
HUNGARY• Budapest (4/00)
IRELAND• Dublin (3/97)• Cork (3/97)• Shannon (3/97)
ITALY• Milan (4/93)• Verona (4/93)• Florence (3/98)+ Turin (4/05)+ Rome (1/10)
THE NETHERLANDS• Amsterdam (6/94)• Rotterdam (3/95)
+ Maastricht (9/07)
NORWAY• Oslo (6/10)
POLAND• Warsaw (2/05)+ Krakow (8/07)
PORTUGAL• Lisbon (10/91)• Oporto (10/91)
ROMANIA• Bucharest (9/08)
SPAIN• Barcelona (1/94)• Madrid (1/94)• Alicante (4/96)
SWEDEN• Stockholm (1/94)• Goteborg (1/94)+ Malmoe (3/05)
SWITZERLAND• Chiasso (2/01)• Zurich (10/05)
UNITED KINGDOM• London (4/86)• Manchester (11/88)• Birmingham (3/90)• Glasgow (4/92)• Bristol (3/97)• East Midlands (1/99)+ Hull (1/00)• Belfast (9/01)• Aberdeen (9/05)
SOUTH AFRICA• Johannesburg (3/94)• Durban (3/94)• Capetown (1/97)
MADAGASCAR• Antananarivo (11/01)
MIDDLE EAST AND INDIA
BAHRAIN• Manama (1/08)
EGYPT• Cairo (2/95)+ Alexandria (2/95)
GREECE• Athens (2/99)+ Thessaloniki (2/99)
INDIA• New Delhi (7/96)• Mumbai (Bombay) (1/97)• Bangalore (6/97)• Chennai (Madras) (6/97)+ Jaipur (6/99)+ Cochin (4/01)+ Hyderabad (9/01)
+ Tuticorin (11/03)+ Ahmedabad (1/05)+ Tiruppur (3/05)+ Ludhiana (6/05)+ Pune (10/06)+ Kolkata (1/08)+ Coimbatore (1/08)+ Mundra (4/08)
JORDAN• Amman (9/07)
KUWAIT# Kuwait City (7/97)
LEBANON• Beirut (8/99)
OMAN• Muscat (4/09)
PAKISTAN• Karachi (9/96)• Lahore (9/96)+ Sialkot (6/03)+ Faisalabad (5/06)+ Islamabad (10/06)
QATAR• Doha (1/07)
SAUDI ARABIA# Riyadh (7/92)# Jeddah (7/92)# Dammam (6/05)
TURKEY• Ankara (1/99)• Istanbul (1/99)• Izmir (1/99)• Mersin (1/99)+ Adana (1/99)
U.A.E.• Abu Dhabi (1/94)• Dubai (10/98)
The Company was incorporated in the State of Washington in May 1979. Its executive offices are located at1015 Third Avenue, 12th Floor, Seattle, Washington, and its telephone number is (206) 674-3400.
The Company’s internet address is http://www.expeditors.com. The Company makes available free ofcharge through its internet website its annual report on Form 10-K, quarterly reports on Form 10-Q, currentreports on Form 8-K, and all amendments to those reports as soon as reasonably practicable after such materialis electronically filed with or furnished to the Securities and Exchange Commission (SEC).
For information concerning the amount of revenues, net revenues, operating income, identifiable assets,capital expenditures and depreciation and amortization attributable to the geographic areas in which the Com-pany conducts its business, see Note 9 to the consolidated financial statements.
| 3.

Airfreight Services
Airfreight services accounted for approximately 38, 35 and 36 percent of the Company’s 2010, 2009 and 2008 con-solidated revenues net of freight consolidation expenses (“net revenues”), respectively. When performing air-freight services, the Company typically acts either as a freight consolidator or as an agent for the airline whichcarries the shipment. When acting as a freight consolidator, the Company purchases cargo space from airlineson a volume basis and resells that space to its customers at lower rates than the customers could obtain directlyfrom airlines. When moving shipments between points where the volume of business does not facilitate con-solidation, the Company receives and forwards individual shipments as the agent of the airline which carries theshipment. Whether acting as a consolidator or agent, the Company offers its customers knowledge of optimumrouting, familiarity with local business practices, knowledge of export and import documentation and procedures,the ability to arrange for ancillary services, and assistance with space availability in periods of peak demand.
In its airfreight forwarding operations, the Company procures shipments from its customers, determinesthe routing, consolidates shipments bound for a particular airport distribution point, and selects the airline fortransportation to the distribution point. At the distribution point, the Company or its agent arranges for the con-solidated lot to be broken down into its component shipments and for the transportation of the individual ship-ments to their final destinations.
The Company estimates its average airfreight consolidation weighs approximately 3,900 pounds and atypical consolidation includes merchandise from several shippers. Because shipment by air is relatively expensivecompared with ocean transportation, air shipments are generally characterized by a high value-to-weight ratio, theneed for rapid delivery, or both.
The Company typically delivers shipments from a Company warehouse at the origin to the airline afterconsolidating the freight into containers or onto pallets. Shipments normally arrive at the destination distributionpoint within forty-eight hours after such delivery. During peak shipment periods, cargo space available from thescheduled air carriers can be limited and backlogs of freight shipments may occur. When these conditions exist,the Company may charter aircraft to meet customer demand.
The Company consolidates individual shipments based on weight and volume characteristics in cost-effective combinations. Typically, as the weight or volume of a shipment increases, the cost per pound/kilo orcubic inch/centimeter charged by the Company decreases. The rates charged by airlines to forwarders and othersalso generally decrease as the weight or volume of the shipment increases. As a result, by aggregating shipmentsand presenting them to an airline as a single shipment, the Company is able to obtain a lower rate per pound/kiloor cubic inch/centimeter than that which it charges to its customers for the individual shipment, while generallyoffering the customer a lower rate than could be obtained from the airline for an unconsolidated shipment.
The Company’s airfreight forwarding net revenues from a consolidated shipment include the differentialbetween the rate charged to the Company by an airline and the rate which the Company charges to its customers,commissions paid to the Company by the airline carrying the freight and fees for ancillary services. Such ancillaryservices provided by the Company include preparation of shipping and customs documentation, packing, cratingand insurance services, negotiation of letters of credit, and preparation of documentation to comply with localexport laws. When the Company acts as an agent for an airline handling an unconsolidated shipment, its netrevenues are primarily derived from commissions paid by the airline and fees for ancillary services paid by thecustomer.
The Company also performs breakbulk services which involve receiving and breaking down consolidatedairfreight lots and arranging for distribution of the individual shipments. Breakbulk service revenues also includecommissions from agents for airfreight shipments.
The Company does not own aircraft and does not plan to do so. Management believes that the ownershipof aircraft would subject the Company to undue business risks, including large capital outlays, increased fixedoperating expenses, problems of fully utilizing aircraft and competition with airlines. Because the Company relieson commercial airlines to transport its shipments, changes in carrier financial stability, policies and practicessuch as pricing, payment terms, scheduling, capacity and frequency of service may affect its business.
4. |

The commercial airline industry as a whole incurred substantial operating losses in 2009. While their oper-ations improved in 2010, many airlines are highly leveraged with debt. Carriers continue to merge and consolidateoperations and reduce available capacity to improve financial results. Some airlines have significantly reducedtheir reliance on cargo-only aircraft to service their airfreight customers. The reduction in capacity allows asset-based carriers to raise rates in the face of declining or stable demand. When fewer planes are flying, the Companyhas fewer shipping options from which to craft service offerings to meet customers’ needs. The combination ofreduced capacity, higher rates and more infrequent flights could challenge the Company’s ability to maintainhistorical unitary profitability.
Ocean Freight and Ocean Services
Ocean freight services accounted for approximately 23, 24, and 25 percent of the Company’s 2010, 2009 and 2008consolidated net revenues, respectively. The Company operates Expeditors International Ocean (“EIO”), anOcean Transportation Intermediary, sometimes referred to as a Non-Vessel Operating Common Carrier(“NVOCC”) specializing in ocean freight consolidation in most major trade lanes in the world. As an NVOCC,EIO contracts with ocean shipping lines to obtain transportation for a fixed number of containers between variouspoints during a specified time period at an agreed rate. EIO handles full container loads for customers that do nothave annual shipping volumes sufficient to negotiate comparable contracts directly with the ocean carriers. EIOalso solicits Less-than Container Load (“LCL”) freight to fill the containers and charges lower rates than thoseavailable directly from shipping lines. The Company’s revenues as an ocean freight forwarder are also derivedfrom commissions paid by the carrier and revenues from fees charged to customers for ancillary services whichthe Company may provide, such as preparing documentation, procuring insurance, arranging for packing andcrating services, and providing consultation. The Company does not own vessels and generally does not physi-cally handle the cargo.
Ocean carriers incurred substantial operating losses in 2009. Operations improved in 2010, but many car-riers are highly leveraged with debt. Carriers continue to manage available capacity and modify sailing schedulesto improve financial results. The combination of lower capacity, slower sailing schedules and pricing volatilitycould impact the Company’s ability to maintain historical unitary profitability.
Order Management provides services which manage origin consolidation, supplier performance, carrierallocation and performance, container management, document management, destination management and PO/SKU visibility through a web based application. Customers have the ability to monitor and report against real timestatus of purchase orders from the date of creation through final delivery. Item quantities, required ship dates,commodity descriptions, estimated vs. actual ex factory dates, container utilization, supplier performance anddocument visibility are many of the managed functions that are visible and reportable via the web. OrderManagement is available for various modes of transportation including ocean, air, truck and rail. Order Manage-ment revenues are derived from services provided to the shipper as well as management fees associated withmanaging purchase order execution against customer specific rules. One basic function of Order Managementinvolves the taking of cargo from many suppliers in a particular origin and “consolidating” these shipments intothe fewest possible number of containers to maximize space and minimize cost. Through origin consolidationcustomers can reduce the number of containers shipped by putting more product in larger and fewer containers.Data integrity is an increasingly critical function of Order Management. Efficient data management is a by-productof our operational processes.
Customs Brokerage and Other Services
Customs brokerage and other services accounted for approximately 39, 41 and 39 percent of the Company’s 2010,2009 and 2008 consolidated net revenues, respectively. As a customs broker, the Company assists importers toclear shipments through customs by preparing required documentation, calculating and providing for payment ofduties on behalf of the importer, arranging for any required inspections by governmental agencies, and arrangingfor delivery. The Company also provides other value added services at destination such as warehousing and
| 5.

product distribution, time definite transportation and inventory management. None of these other services arecurrently individually significant to the Company’s net revenues.
The Company provides customs clearance services in connection with many of the shipments it handlesas a freight forwarder. However, substantial customs brokerage revenues are derived from customers that elect touse a competing forwarder. Conversely, shipments handled by the Company as a forwarder may be processed byanother customs broker selected by the customer.
The Company also provides custom clearances for goods moving by rail and truck between the UnitedStates, Canada and/or Mexico. The commodities being cleared and the time sensitive nature of the borderbrokerage business require the Company to continue to make enhancements to its systems in order to providecompetitive service.
The Company’s wholly-owned subsidiary, Expeditors Tradewin, L.L.C., responds to customer drivenrequests for high-end customs consulting services. Fees for these non-transactional services are based uponhourly billing rates and bids for mutually agreed projects.
Marketing and Customers
The Company provides customer specific solutions and seeks to understand the needs of the customers fromorder inception through to order delivery. Although the domestic importer usually designates the logistics com-pany and the services that will be required, the foreign shipper may also participate in this selection proc-ess. Therefore, the Company coordinates its marketing program to reach both domestic importers and theiroverseas suppliers.
The Company’s marketing efforts are focused on interacting with our customers’ supply chain, includinglogistics, transportation, customs, compliance and purchasing departments of existing and potential custom-ers. The district manager of each office is responsible for marketing, sales coordination, and implementation inthe area in which he or she is located. All employees are responsible for customer service and retention.
The Company staffs its offices largely with managers and other key personnel who are citizens of thenations in which they operate and who have extensive experience in global logistics. Marketing and customerservice staffs are responsible for marketing the Company’s services directly to customers and prospects who mayselect or influence the selection of logistics service providers and for ensuring that customers receive timely andefficient service. The Company believes that its expertise in supplying solutions customized to the needs of itscustomers, its emphasis on coordinating its origin and destination customer service and marketing activities, andthe incentives it gives to its managers have been important elements of its success.
The goods handled by the Company are generally a function of the products which dominate internationaltrade between any particular origin and destination. Shipments of computer components, electronic goods,medical equipment, sporting goods, machine parts, aviation parts and toys comprise a significant percentage ofthe Company’s business. Typical import customers include retailers and distributors of consumer electronics,department store chains, clothing and shoe wholesalers, manufacturers and catalogue stores. Historically, nosingle customer has accounted for five percent or more of the Company’s net revenues.
Competition
The global logistics services industry is intensely competitive and is expected to remain so for the foreseeablefuture. There are a large number of companies competing in one or more segments of the industry, but the num-ber of firms with a global network that offer a full complement of logistics services is more limited. Depending onthe location of the shipper and the importer, the Company must compete against both the niche players and largerentities. Historically, the industry has experienced consolidations into larger firms striving for stronger and morecomplete multinational and multi-service networks. However, regional and local competitors still maintain astrong market presence in certain areas.
6. |

The primary competitive factors in the global logistics services industry continue to be price and quality ofservice, including reliability, responsiveness, expertise, convenience, and scope of operations. The Companyemphasizes quality service and believes that its prices are competitive with the prices of others in theindustry. Larger customers utilize more sophisticated and efficient procedures for the management of their logis-tics supply chains by embracing strategies such as just-in-time inventory management. Accordingly, timely andaccurate information integrated into customer service capabilities are a significant factor in attracting and retain-ing customers. This information integrated into customer service capabilities include customized Electronic DataInterchange, (“EDI”), on-line freight tracing and tracking applications and customized on-line reporting. Thecustomized EDI applications allow the transfer of key information between the customers’ systems and theCompany’s systems. Freight tracing and tracking applications provide customers with real time visibility to thelocation, transit time and estimated delivery time of inventory in transit.
Management believes that the ability to develop and deliver innovative solutions to meet customers’increasingly sophisticated information requirements is a critical factor in the ongoing success of the Com-pany. The Company devotes a significant amount of resources towards the maintenance and enhancement ofsystems that will meet these customer demands. Management believes that the Company’s existing systems arecompetitive with the systems currently in use by other logistics services companies with which it competes.
Unlike many of its competitors, who have tended to grow by merger and acquisition, the Company oper-ates the same accounting and transportation computer software, running on a common hardware platform, in allof its full-service locations. Small and middle-tier competitors, in general, do not have the resources available todevelop these customized systems. Historically, growth through aggressive acquisition has proven to be a chal-lenge for many of the Company’s competitors and typically involves the purchase of significant “goodwill.” As aresult, the Company has pursued a strategy emphasizing organic growth supplemented by certain strategicacquisitions.
The Company’s ability to attract, retain, and motivate highly qualified personnel with experience in globallogistics services is an essential, if not the most important, element of its ability to compete in the industry. Tothis end, the Company has adopted incentive compensation programs which make percentages of branch netrevenues or profits available to managers for distribution among key personnel. The Company believes that theseincentive compensation programs, combined with its experienced personnel and its ability to coordinate globalmarketing efforts, provide it with a distinct competitive advantage and account for historical growth that com-petitors have generally matched only through acquisition.
Currency and Other Risk Factors
The nature of the Company’s worldwide operations necessitate the Company dealing with a multitude of curren-cies other than the U.S. dollar. This results in the Company being exposed to the inherent risks of the interna-tional currency markets and governmental interference. Many of the countries where the Company maintainsoffices and/or agency relationships have strict currency control regulations which influence the Company’s abilityto hedge foreign currency exposure. The Company tries to compensate for these exposures by acceleratinginternational currency settlements among these offices or agents.
In addition, the Company’s ability to provide service to its customers is highly dependent on good workingrelationships with a variety of entities including airlines, steamship lines and governmental agencies. The Com-pany considers its current working relationships with these entities to be satisfactory. However, changes in thefinancial stability and operating capabilities of asset-based carriers, space allotments available from carriers,governmental deregulation efforts, “modernization” of the regulations governing customs clearance, and/orchanges in governmental quota restrictions could affect the Company’s business in unpredictable ways.
| 7.

Seasonality
Historically, the Company’s operating results have been subject to seasonal trends when measured on a quarterlybasis. The first quarter has traditionally been the weakest and the third and fourth quarters have traditionally beenthe strongest. This pattern has been the result of, or influenced by, numerous factors including weather patterns,national holidays, consumer demand, economic conditions and a myriad of other similar and subtle forces. Inaddition, this historical quarterly trend has been influenced by the growth and diversification of the Company’sinternational network and service offerings. The Company cannot accurately forecast many of these factors, norcan the Company estimate accurately the relative influence of any particular factor and, as a result, there can beno assurance that historical patterns will continue in future periods.
Environmental
In the United States, the Company is subject to Federal, state and local provisions regulating the discharge ofmaterials into the environment or otherwise for the protection of the environment. Similar laws apply in manyother jurisdictions in which the Company operates. Although current operations have not been significantlyaffected by compliance with these environmental laws, governments are becoming increasingly sensitive to envi-ronmental issues, and the Company cannot predict what impact future environmental regulations may have on itsbusiness. The Company does not anticipate making any material capital expenditures for environmental controlpurposes during the remainder of the current or succeeding fiscal years.
Employees
At January 31, 2011, the Company employed approximately 12,880 people, 4,410 in the United States and 730 in thebalance of North America, 620 in Latin America, 3,850 in Asia Pacific, 2,100 in Europe and Africa, and 1,170 in theMiddle East. Approximately 1,730 of the Company’s employees are engaged principally in sales and marketing andcustomer service, 7,550 in operations and 3,600 in finance and administration. The Company is not a party to anycollective bargaining agreement and considers its relations with its employees to be satisfactory.
In order to retain the services of highly qualified, experienced, and motivated employees, the Companyplaces considerable emphasis on its non-equity incentive compensation programs and stock option plans.
Executive Officers of the Registrant
The following table sets forth the names, ages, and positions of current executive officers of the Company.
Name Age Position
Peter J. Rose . . . . . . . . . . . . . 67 Chairman and Chief Executive Officer and directorJames L.K. Wang . . . . . . . . . 63 President-Asia Pacific and directorR. Jordan Gates . . . . . . . . . . . 55 President and Chief Operating Officer, directorRommel C. Saber . . . . . . . . . . 53 President-Europe, Africa, Near/Middle East and Indian SubcontinentRobert L. Villanueva . . . . . . . 58 President-The AmericasTimothy C. Barber . . . . . . . . . 51 President-Global Sales and MarketingRosanne Esposito . . . . . . . . . 59 Executive Vice President-Global CustomsEugene K. Alger . . . . . . . . . . . 50 Executive Vice President-North AmericaPhilip M. Coughlin . . . . . . . . . 50 Executive Vice President-North AmericaJeffrey S. Musser . . . . . . . . . . 45 Executive Vice President and Chief Information OfficerCharles J. Lynch . . . . . . . . . . 50 Senior Vice President-Corporate ControllerDaniel R. Wall . . . . . . . . . . . . 42 Senior Vice President-Ocean ServicesJose A. Ubeda . . . . . . . . . . . . 44 Senior Vice President-Air CargoAmy J. Tangeman . . . . . . . . . 42 Vice President-General Counsel and SecretaryBradley S. Powell . . . . . . . . . . 50 Chief Financial Officer
8. |

Peter J. Rose has served as a director and Vice President of the Company since July 1981. Mr. Rose waselected a Senior Vice President of the Company in May 1986, Executive Vice President in May 1987, President andChief Executive Officer in October 1988, and Chairman and Chief Executive Officer in May 1991.
James L.K. Wang has served as a director and the Managing Director of Expeditors International TaiwanLtd., the Company’s former exclusive Taiwan agent, since September 1981. In 1991, Mr. Wang’s employmentagreement was assigned to E.I. Freight (Taiwan), Ltd., the Company’s exclusive Taiwan agent through2004. Mr. Wang’s contract is now assigned to ECI Taiwan Co. Ltd., a wholly-owned subsidiary of the Company. InOctober 1988, Mr. Wang became a director of the Company and its Director-Far East, and Executive Vice Presi-dent in January 1996. In May 2000, Mr. Wang was elected President-Asia.
R. Jordan Gates joined the Company as its Controller-Europe in February 1991. Mr. Gates was electedChief Financial Officer and Treasurer of the Company in August 1994 and Senior Vice President-Chief FinancialOfficer and Treasurer in January 1998. In May 2000, Mr. Gates was elected Executive Vice President-Chief Finan-cial Officer and Treasurer. Mr. Gates was also elected as a director in May 2000. On January 1, 2008, Mr. Gatesassumed the role of President and Chief Operating Officer.
Rommel C. Saber joined the Company as Director-Near/Middle East in February 1990 and was electedSenior Vice President-Sales and Marketing in January 1993. Mr. Saber was elected Senior Vice President-AirExport in September 1993. In July 1997, Mr. Saber was elected Senior Vice President Near/Middle East and IndianSubcontinent and Executive Vice President-Europe, Africa and Near/Middle East in August 2000. In Febru-ary 2006, Mr. Saber was elected President-Europe, Africa, Near/Middle East and Indian Subcontinent.
Robert L. Villanueva joined the Company as Regional Vice President Northwest U.S. Region inApril 1994. In September 1999, he was elected Executive Vice President-The Americas and President-The Amer-icas in May 2004.
Timothy C. Barber joined the Company in May 1986. Mr. Barber was promoted to District Manager of theSeattle office in January 1987 and Regional Vice President in January 1993. Mr. Barber was elected VicePresident-Sales and Marketing in September 1993 and Senior Vice President-Sales and Marketing in Jan-uary 1998. In September 1999, Mr. Barber was elected Executive Vice President-Global Sales. On January 1, 2008,Mr. Barber assumed the role of President-Global Sales and Marketing.
Rosanne Esposito joined the Company as its Director-U.S. Import Services in January 1996. Ms. Espositowas promoted to Vice President in May 1997 and Senior Vice President-Global Customs in May 2001. In May 2004,Ms. Esposito was promoted to Executive Vice President-Global Customs.
Eugene K. Alger joined the Company in October 1982. Mr. Alger was promoted to District Manager andRegional Vice President of the Los Angeles office in May 1983. He was elected Regional Vice President-Southwestern U.S. and Mexico Region in January 1992, and Senior Vice President of North America in Sep-tember 1999. In March, 2008, he was promoted to Executive Vice President-North America.
Philip M. Coughlin joined the Company in October 1985. In August 1986, Mr. Coughlin was promoted toDistrict Manager. Mr. Coughlin was elected Regional Manager for New England and Canada in January 1991,Regional Vice President-Northeastern U.S. and Northern Border in January 1992, and Senior Vice President ofNorth America in September 1999. In March, 2008, he was promoted to Executive Vice President-North America.
Jeffrey S. Musser joined the Company in February 1983. Mr. Musser was promoted to District Manager inOctober 1989 and Regional Vice President in September 1999. Mr. Musser was elected Senior Vice President-Chief Information Officer in January 2005. In May 2009, Mr. Musser was promoted to Executive Vice President andChief Information Officer.
Charles J. Lynch joined the Company in September 1984. Mr. Lynch was promoted to Assistant Controllerin July 1985 and Controller-Domestic Operations in January 1989. Mr. Lynch was elected Corporate Controller inJanuary 1991 and Vice President-Corporate Controller in January 1998. In May 2002, Mr. Lynch was elected SeniorVice President-Corporate Controller.
Daniel R. Wall joined the Company in March 1987. Mr. Wall was promoted to District Manager in May 1992and Global Director-Account Management in March 2002. Mr. Wall was elected Vice President-ECMS in Jan-uary 2004 and Senior Vice President-Ocean Services in September 2004.
| 9.

Jose A. Ubeda joined the Company in May 1984. Mr. Ubeda was promoted to District Manager in February1993 and to Regional Vice President-Northwest U.S. Region in May 2000. In April 2010, Mr. Ubeda was promotedto Senior Vice President-Air Cargo.
Amy J. Tangeman joined the Company in January 1997. Ms. Tangeman was promoted to Assistant Gen-eral Counsel in November 2001. In October 2006, Ms. Tangeman was elected Vice-President-General Counsel andSecretary.
Bradley S. Powell joined the Company as Chief Financial Officer in October 2008. Prior to joining theCompany, Mr. Powell served as President and Chief Financial Officer of Eden Bioscience Corporation, a publicly-traded biotechnology company, from December 2006 to September 2008 and as Vice President and Chief FinancialOfficer from July 1998 to December 2006.
Regulation and Security
With respect to the Company’s activities in the air transportation industry in the United States, it is subject toregulation by the Transportation Security Administration (“TSA”) of the Department of Homeland Security as anindirect air carrier. All United States indirect air carriers are required to maintain prescribed security proceduresand are subject to periodic audits by TSA. The Company’s overseas offices and agents are licensed as airfreightforwarders in their respective countries of operation. The Company is licensed in each of its offices, or in the caseof its newer offices, has made application for a license as an airfreight forwarder by the International Air Trans-port Association (“IATA”). IATA is a voluntary association of airlines and air transport related entities whichprescribes certain operating procedures for airfreight forwarders acting as agents for its members. The majorityof the Company’s airfreight forwarding business is conducted with airlines which are IATA members.
The Company is licensed as an Ocean Transportation Intermediary (“OTI”) (sometimes referred to asNVOCC-Non-Vessel Operating Common Carrier) by the Federal Maritime Commission (“FMC”). The FMC hasestablished certain qualifications for shipping agents, including certain surety bonding requirements. The FMC isalso responsible for the economic regulation of OTI/NVOCC activity originating or terminating in the UnitedStates. To comply with these economic regulations, vessel operators and NVOCCs, such as EIO, are required tofile tariffs electronically which establish the rates to be charged for the movement of specified commodities intoand out of the United States. The FMC has the power to enforce these regulations by assessing penalties.
The Company is licensed as a customs broker by Customs and Border Protection (“CBP”) of the Depart-ment of Homeland Security nationally and in each U.S. customs district in which it does business. All UnitedStates customs brokers are required to maintain prescribed records and are subject to periodic audits by CBP. Inother jurisdictions in which the Company performs clearance services, the Company is licensed by the appro-priate governmental authority (where such license is required to perform these services). The Company partic-ipates in various governmental supply chain security programs, such as the Customs-Trade Partnership AgainstTerrorism (“C-TPAT”) in the United States and additional security initiatives as they continue to be enacted bydifferent governments, such as Authorized Economic Operator (“AEO”).
The Company does not believe that current United States and foreign governmental regulations imposesignificant economic restraint upon its business operations. In general, the Company conducts its businessactivities in each country through a majority-owned subsidiary corporation that is organized and existing underthe laws of that country. However, the regulations of foreign governments can impose barriers to the Company’sability to provide the full range of its business activities in a wholly or majority United States-owned sub-sidiary. For example, foreign ownership of a customs brokerage business is prohibited in some jurisdictions andless frequently the ownership of the licenses required for freight forwarding and/or freight consolidation isrestricted to local entities. When the Company encounters this sort of governmental restriction, it works to estab-lish a legal structure that meets the requirements of the local regulations while also giving the Company the sub-stantive operating and economic advantages that would be available in the absence of such regulation. This canbe accomplished by creating a joint venture or exclusive agency relationship with a qualified local entity that holdsthe required license. The war on terror and governments’ overriding concern for the safety of passengers andcitizens who import and/or export goods into and out of their respective countries has resulted in a proliferation
10. |

of cargo security regulations over the past several years. While these cargo regulations have already created amarked difference in the security arrangements required to move shipments around the globe, regulations areexpected to become more stringent in the future. As governments look for ways to minimize the exposure of theircitizens to potential terror related incidents, the Company and its competitors in the transportation business maybe required to incorporate security procedures within their scope of services to a far greater degree than has beenrequired in the past. The Company feels that increased security requirements may involve further investments intechnology and more sophisticated screening procedures being applied to potential customers, vendors andemployees. The Company’s position is that any increased cost of compliance with security regulations will bepassed through to those who are beneficiaries of the Company’s services.
Cargo Liability
When acting as an airfreight consolidator, the Company assumes a carrier’s liability for lost or damaged ship-ments. This legal liability is typically limited by contract to the lower of the transaction value or the released value(17 Special Drawing Rights per kilo unless the customer declares a higher value and pays a surcharge), except ifthe loss or damage is caused by willful misconduct or in the absence of an appropriate airway bill. The airlinewhich the Company utilizes to make the actual shipment is generally liable to the Company in the same mannerand to the same extent. When acting solely as the agent of the airline or shipper, the Company does not assumeany contractual liability for loss or damage to shipments tendered to the airline.
When acting as an ocean freight consolidator, the Company assumes a carrier’s liability for lost or dam-aged shipments. This liability is typically limited by contract to the lower of the transaction value or the releasedvalue ($500 per package or customary freight unit unless the customer declares a higher value and pays asurcharge). The steamship line which the Company utilizes to make the actual shipment is generally liable to theCompany in the same manner and to the same extent. In its ocean freight forwarding and customs clearanceoperations, the Company does not assume cargo liability.
When providing warehouse and distribution services, the Company limits its legal liability by contract andtariff to an amount generally equal to the lower of fair value or $0.50 per pound with a maximum of $50 per “lot” —which is defined as the smallest unit that the warehouse is required to track. Upon payment of a surcharge forwarehouse and distribution services, the Company will assume additional liability.
The Company maintains cargo legal liability insurance covering claims for losses attributable to missingor damaged shipments for which it is legally liable. The Company also maintains insurance coverage for theproperty of others which is stored in Company warehouse facilities. This insurance coverage is provided by aVermont U.S. based insurance entity wholly-owned by the Company. The coverage is fronted and reinsured by aglobal insurance company. The total risk retained by the Company in 2010 was approximately $4 million. In addi-tion, the Company is licensed as an insurance broker through its subsidiary, Expeditors Cargo Insurance Brok-ers, Inc. and places insurance coverage for other customers.
| 11.

ITEM 1A — RISK FACTORS
RISK FACTORS DISCUSSION AND POTENTIAL SIGNIFICANCE
International Trade . . . . . . . . The Company primarily provides services to customers engaged in internationalcommerce. Everything that affects international trade has the potential to expandor contract the Company’s primary market and impact its operating results. Forexample, international trade is influenced by:
• currency exchange rate and currency control regulations;
• interest rate fluctuations;
• changes in governmental policies, such as taxation, quota restrictions, otherforms of trade barriers and/or restrictions and trade accords;
• changes in and application of international and domestic customs, trade andsecurity regulations;
• wars, strikes, civil unrest, acts of terrorism, and other conflicts;
• natural disasters and pandemics;
• changes in consumer attitudes regarding goods made in countries otherthan their own;
• changes in availability of credit;
• changes in the price and readily available quantities of oil and otherpetroleum-related products; and
• increased global concerns regarding environmental sustainability.
Third Party Suppliers . . . . . . The Company is a non-asset based provider of global logistics services. As aresult, the Company depends on a variety of asset-based third party suppliers.The quality and profitability of the Company’s services depend upon effectiveselection, management and discipline of third party suppliers, while operationshave improved in 2010, many of the Company’s third party suppliers have incurredsignificant operating losses in 2009 and are highly leveraged with debt. Changesin the financial stability, operating capabilities and capacity of asset-basedcarriers and space allotment made available to the Company by asset-basedcarriers could affect the Company in unpredictable ways, including volatility ofpricing, and challenge the Company’s ability to maintain historical unitaryprofitability.
Predictability of Results . . . . The Company is not aware of any accurate means of forecasting short-termcustomer requirements. However, long-term customer satisfaction depends uponthe Company’s ability to meet these unpredictable short-term customerrequirements. Personnel costs, the Company’s single largest variable expense,are always less flexible in the very near term as the Company must staff to meetuncertain demand. As a result, short-term operating results could bedisproportionately affected.
12. |

RISK FACTORS DISCUSSION AND POTENTIAL SIGNIFICANCE
A significant portion of the Company’s revenues are derived from customers inretail industries whose shipping patterns are tied closely to consumer demand,and from customers in industries whose shipping patterns are dependent uponjust-in-time production schedules. Therefore, the timing of the Company’srevenues are, to a large degree, impacted by factors out of the Company’s control,such as a sudden change in consumer demand for retail goods and/ormanufacturing production delays. Additionally, many customers ship asignificant portion of their goods at or near the end of a quarter, and therefore,the Company may not learn of a shortfall in revenues until late in a quarter. To theextent that a shortfall in revenues or earnings was not expected by securitiesanalysts, any such shortfall from levels predicted by securities analysts couldhave an immediate and adverse effect on the trading price of the Company’sstock.
Foreign Operations . . . . . . . . The majority of the Company’s revenues and operating income comes fromoperations conducted outside the United States. To maintain a global servicenetwork, the Company may be required to operate in hostile locations and indangerous situations.
In addition, the Company operates in parts of the world where common businesspractices could constitute violations of the anti-corruption laws, rules,regulations and decrees of the United States, including the U.S. Foreign CorruptPractices Act, and of all other countries in which the Company conductsbusiness; as well as trade control laws, or laws, regulations and Executive Ordersimposing embargoes and sanctions; and anti-boycott laws and regulations.Compliance with these laws, rules, regulations and decrees is dependent on theCompany’s employees, subcontractors, agents, third party brokers andcustomers, whose individual actions could violate these laws, rules, regulationsand decrees. Failure to comply could result in substantial penalties andadditional expenses, damages to the Company’s reputation and restrictions onits ability to conduct business.
Key Personnel . . . . . . . . . . . . The Company is a service business. The quality of this service is directly relatedto the quality of the Company’s employees. Identifying, training and retaining keyemployees is essential to continued growth and future profitability. Continuedloyalty to the Company will not be assured by contract.
The Company believes that its compensation programs, which have been in placesince the Company became a publicly traded entity, are one of the uniquecharacteristics responsible for differentiating its performance from that of manyof its competitors. Significant changes to its compensation programs could affectthe Company’s performance.
Technology . . . . . . . . . . . . . . . Increasingly, the Company must compete based upon the flexibility andsophistication of the technologies utilized in performing its core businesses.Future results depend upon the Company’s success in the cost effectivedevelopment, maintenance and integration of communication and informationsystems technologies, including those of third party suppliers. Any significantdisruptions to these systems could negatively affect the Company’s results.
| 13.

RISK FACTORS DISCUSSION AND POTENTIAL SIGNIFICANCE
Growth . . . . . . . . . . . . . . . . . . . To date, the Company has relied primarily upon organic growth and has tended toavoid growth through acquisition. Future results will depend upon theCompany’s ability to continue to grow internally or to demonstrate the ability tosuccessfully identify and integrate non-dilutive acquisitions.
Regulatory Environment . . . . The Company is affected by ever increasing regulations from a number ofsources. The current business environment tends to stress the avoidance of riskthrough regulation and oversight, the effect of which is likely to be unforeseencosts and potentially unforeseen consequences.
In reaction to the global war on terror, governments around the world arecontinuously enacting or updating security regulations. These regulations aremulti-layered, increasingly technical in nature and characterized by a lack ofharmonization of substantive requirements amongst various governmentalauthorities. Furthermore, the implementation of these regulations, includingdeadlines and substantive requirements, is driven by political urgencies ratherthan the industries’ realistic ability to comply. Failure to consistently and timelycomply with these regulations, or the failure, breach or compromise of theCompany’s security procedures or those of its subcontractors or agents, mayresult in increased operating costs, damage to the Company’s reputation,restrictions on operations and/or fines and penalties.
Competition . . . . . . . . . . . . . . The global logistics services industry is intensely competitive and is expected toremain so for the foreseeable future. There are a large number of companiescompeting in one or more segments of the industry, but the number of firms witha global network that offer a full complement of logistics services is morelimited. Depending on the location of the shipper and the importer, the Companymust compete against both the niche players and larger entities.
Taxes . . . . . . . . . . . . . . . . . . . . The Company is subject to many taxes in the United States and foreignjurisdictions. In many of these jurisdictions, the tax laws are very complex and areopen to different interpretations and application. Tax authorities frequentlychange their tax rules, reconciliations and rates. The Company is regularly underaudit by tax authorities. Although the Company believes its tax estimates arereasonable, the final determination of tax audits could be materially different fromthe Company’s tax provisions and accruals and negatively impact its financialresults.
Litigation/Investigations . . . . As a multinational corporation, the Company is subject to formal or informalinvestigations or litigation from governmental authorities or others in thecountries in which it does business. The Company is currently subject to, and iscooperating fully with, an investigation by the U.S. Department of Justice (DOJ)of air cargo freight forwarders. In addition, the Company and its Hong Kongsubsidiary received a Statement of Objections from the European Commission(EC) relating to an ongoing investigation of freight forwarders. The Company andits Brazilian subsidiary also received an Administrative Proceeding from theBrazilian Ministry of Justice (MOJ) relating to an on-going investigation of freightforwarders. These investigations will require further management time and causethe Company to incur substantial additional legal and related costs, which couldinclude fines and/or penalties if the DOJ, EC and/or MOJ concludes that theCompany has engaged in anti-competitive behavior and such fines and/orpenalties could have a material impact on the Company’s financial position,results of operations and operating cash flows.
14. |

RISK FACTORS DISCUSSION AND POTENTIAL SIGNIFICANCE
The Company is currently subject to and may become subject to other civillitigation arising from these investigations, including but not limited toshareholder class action lawsuits and derivative claims made on behalf of theCompany. The Company has been named as a defendant in a Federal anti-trustclass action lawsuit filed in New York and will incur additional costs related todefending itself in these proceedings.
Economic Conditions . . . . . . The global economy and capital and credit markets continue to experienceuncertainty and volatility. Unfavorable changes in economic conditions mayresult in lower freight volumes and adversely affect the Company’s revenues andoperating results, as experienced in 2009. These conditions may adversely affectcertain of the Company’s customers and third party suppliers. Were that to occur,the Company’s revenues and net earnings could also be adversely affected.Should customers’ ability to pay deteriorate, additional bad debts may beincurred.
These unfavorable conditions can create situations where rate increases chargedby carriers and other suppliers are implemented with little or no advanced notice.The Company often times cannot pass these rate increases on to its customers inthe same time frame, if at all. As a result, the Company’s yields and margins canbe negatively impacted.
Catastrophic Events . . . . . . . A disruption or failure of the Company’s systems or operations in the event of amajor earthquake, weather event, cyber-attack, terrorist attack, strike, civil unrest,pandemic or other catastrophic event could cause delays in providing services orperforming other mission-critical functions. The Company’s corporateheadquarters, and certain other critical business operations are in the Seattle,Washington area, which is near major earthquake faults. A catastrophic eventthat results in the destruction or disruption of any of the Company’s criticalbusiness or information technology systems could harm the Company’s ability toconduct normal business operations and its operating results.
ITEM 1B — UNRESOLVED STAFF COMMENTS
Not applicable.
| 15.

ITEM 2 — PROPERTIES
The Company owns the following properties:
Location Nature of Property
United States:
Seattle, Washington . . . . . . . . . . . . . . . . . . . . . . . . . . . . . . . . . . . . . . . . . . . . . Office buildingsNear Seattle-Tacoma International Airport (in Washington) . . . . . . . . . . Office buildingHouston, Texas . . . . . . . . . . . . . . . . . . . . . . . . . . . . . . . . . . . . . . . . . . . . . . . . . Office and warehouseNassau County, New York . . . . . . . . . . . . . . . . . . . . . . . . . . . . . . . . . . . . . . . . Office and warehouseMiddlesex County, New Jersey . . . . . . . . . . . . . . . . . . . . . . . . . . . . . . . . . . . . Office and warehouseNear San Francisco International Airport (in California) . . . . . . . . . . . . . . Office and warehouseNear Los Angeles International Airport (in California) . . . . . . . . . . . . . . . Office and warehouseNear O’Hare International Airport (in Illinois) . . . . . . . . . . . . . . . . . . . . . . . Office and warehouseMiami, Florida . . . . . . . . . . . . . . . . . . . . . . . . . . . . . . . . . . . . . . . . . . . . . . . . . . Office, warehouse and free trade zone*Spokane, Washington . . . . . . . . . . . . . . . . . . . . . . . . . . . . . . . . . . . . . . . . . . . Office building
Asia:
Kowloon, Hong Kong . . . . . . . . . . . . . . . . . . . . . . . . . . . . . . . . . . . . . . . . . . . . OfficesTaipei, Taiwan . . . . . . . . . . . . . . . . . . . . . . . . . . . . . . . . . . . . . . . . . . . . . . . . . . OfficeSeoul, Korea . . . . . . . . . . . . . . . . . . . . . . . . . . . . . . . . . . . . . . . . . . . . . . . . . . . OfficeShanghai, China . . . . . . . . . . . . . . . . . . . . . . . . . . . . . . . . . . . . . . . . . . . . . . . . Office building
Europe:
Brussels, Belgium . . . . . . . . . . . . . . . . . . . . . . . . . . . . . . . . . . . . . . . . . . . . . . . Office and warehouseDublin, Ireland . . . . . . . . . . . . . . . . . . . . . . . . . . . . . . . . . . . . . . . . . . . . . . . . . . Office and warehouseCork, Ireland . . . . . . . . . . . . . . . . . . . . . . . . . . . . . . . . . . . . . . . . . . . . . . . . . . . Office and warehouseNear Heathrow Airport (in London, England) . . . . . . . . . . . . . . . . . . . . . . . Acreage
Latin America:
Alajuela, Costa Rica . . . . . . . . . . . . . . . . . . . . . . . . . . . . . . . . . . . . . . . . . . . . . Office building
Middle East:
Cairo, Egypt . . . . . . . . . . . . . . . . . . . . . . . . . . . . . . . . . . . . . . . . . . . . . . . . . . . . Office and warehouse
* Company directly owns 50% with Cargo Ventures, LLC, a private, non-affiliated real estate developmentcompany.
The Company leases and maintains 68 additional offices and satellite locations in the United States and356 leased locations throughout the world, each located close to an airport, ocean port, or on an important bordercrossing. The majority of these facilities contain warehouse facilities. Lease terms are either on amonth-to-month basis or terminate at various times through 2020. See Note 7 to the Company’s consolidatedfinancial statements for lease commitments. As an office matures, the Company will investigate the possibility ofbuilding or buying suitable facilities. The Company believes that current leases can be extended and that suitablealternative facilities are available in the vicinity of each present facility should extensions be unavailable at theconclusion of current leases.
16. |

ITEM 3 — LEGAL PROCEEDINGS
On October 10, 2007, the U. S. Department of Justice (DOJ) issued a subpoena ordering the Company to producecertain information and records relating to an investigation of alleged anti-competitive behavior amongst air cargofreight forwarders. The Company has retained the services of a law firm to assist in complying with the DOJ’ssubpoena. As part of this process, the Company has met with and continues to co-operate with the DOJ. TheCompany expects to incur additional costs during the course of this ongoing investigation, which could includefines and/or penalties if the DOJ concludes that the Company has engaged in anti-competitive behavior and suchfines and/or penalties could have a material impact on the Company’s financial position, results of operations andoperating cash flows.
On January 3, 2008, the Company was named as a defendant, with seven other European and NorthAmerican-based global logistics providers, in a Federal antitrust class action lawsuit filed in the United StatesDistrict Court of the Eastern District of New York, Precision Associates, Inc. et al v. Panalpina World Transport,No. 08-CV0042. On July 21, 2009, the plaintiffs filed an amended complaint adding a number of new third partydefendants and various claims which they assert to violate the Sherman Act. The plaintiffs’ amended complaint,which purports to be brought on behalf of a class of customers (and has not yet been certified), asserts claimsthat the defendants engaged in price fixing regarding eight discrete surcharges in violation of the Sherman Act.The allegations concerning the Company relate to two of these surcharges. The amended complaint seeksunspecified damages and injunctive relief. The Company believes that these allegations are without merit andintends to vigorously defend itself. On August 13, 2009, the Company filed a motion to dismiss the amendedcomplaint for failure to state a claim. Plaintiffs filed their opposition to the Company’s motion on January 30, 2010,to which the Company filed a reply, and the motion is currently pending before the Court.
On June 18, 2008, the European Commission (EC) issued a request for information to the Company’s UKsubsidiary, Expeditors International (UK) Ltd., requesting certain information relating to an ongoing investigationof freight forwarders. The Company replied to the request. On February 18, 2009, the EC issued another requestfor information to the same subsidiary requesting certain additional information in connection with the EC’songoing investigation of freight forwarders. The Company replied to the request. On February 10, 2010, the Com-pany and its Hong Kong subsidiary, Expeditors Hong Kong Limited, received a Statement of Objections (SO) fromthe EC. The SO initiates a proceeding against the Company alleging anti-competitive behavior contrary to Euro-pean Union rules on competition. Specific to the Company, the allegations in the SO are limited to the period fromAugust 2005 to June 2006 and only concern airfreight trade lanes between South China/Hong Kong and the Euro-pean Economic Area. The Company filed a response to the allegations in the SO on April 12, 2010 and partici-pated in an oral hearing on July 6, 2010. On January 20, 2011, the EC issued another request for information to theCompany and its Hong Kong subsidiary requesting certain additional information in connection with its on-goinginvestigation of freight forwarders. The Company replied to the request. The Company continues to vigorouslydefend itself against the allegations. The Company expects to incur additional costs during the course of thisongoing proceeding, which could include administrative fines if the EC concludes that the Company has engagedin anti-competitive behavior and such fines could have a material impact on the Company’s financial position,results of operations and operating cash flows.
On August 17, 2010, the Company and its Brazilian subsidiary, Expeditors Internacional do Brasil Ltdareceived an Administrative Proceeding (AP) from the Brazilian Ministry of Justice (MOJ). The AP initiates aproceeding against the Company and one of its employees, alleging possible anti-competitive behavior. TheCompany intends to vigorously defend itself against the allegations. The Company expects to incur additionalcosts during the course of this proceeding, which could include administrative fines if the MOJ concludes thatthe Company has engaged in anti-competitive behavior and such fines could have a material impact on theCompany’s financial position, results of operations and operating cash flows.
The proceedings described above generally relate to investigations of freight forwarders or allegations ofanti-competitive behavior. The distractions caused by these proceedings and the legal and other costs associatedwith these proceedings have been significant. The Company has incurred approximately $1 million, less than $1million, and approximately $10 million for the years ended December 31, 2010, 2009 and 2008, respectively, in legal
| 17.

and associated costs on the above matters. Since the beginning of the proceedings in 2007, the Company hasincurred approximately $15 million in legal and associated costs on the above matters. At this time the Companyis unable to estimate the range of loss or damages, if any, that might result as an outcome of any of theseproceedings. The Company assumes, as should investors, that these challenges could continue for a significantperiod of time and may require the investment of substantial additional management time and substantial finan-cial resources. These government investigations and the related litigation matters are subject to inherentuncertainties, and unfavorable rulings could occur. An unfavorable ruling could include substantial monetarydamages and, in matters in which injunctive relief or other conduct remedies are sought, an injunction or otherorder relating to business conduct. Were unfavorable final outcomes to occur, the Company’s business, financialposition, results of operations, and operating cash flows could be materially harmed.
The Company is involved in other claims and lawsuits which arise in the ordinary course of business, noneof which currently, in management’s opinion, will have a significant effect on the Company’s operations or finan-cial position.
18. |

PART II
ITEM 5 — MARKET FOR REGISTRANT’S COMMON EQUITY, RELATED STOCKHOLDER MATTERSAND ISSUER PURCHASES OF EQUITY SECURITIES
The following table sets forth the high and low sale prices for the Company’s common stock as reported by TheNASDAQ Global Select Market under the symbol EXPD.
Common Stock Common Stock
Quarter High Low Quarter High Low
2010 2009
First . . . . . . . . . . . . . . . . . . . . . . . . $ 38.93 $ 32.36 First . . . . . . . . . . . . . . . . . . . . $ 34.59 $ 23.86Second . . . . . . . . . . . . . . . . . . . . . $ 42.39 $ 34.46 Second . . . . . . . . . . . . . . . . . $ 38.10 $ 27.26Third . . . . . . . . . . . . . . . . . . . . . . . $ 47.58 $ 33.65 Third . . . . . . . . . . . . . . . . . . . $ 37.04 $ 24.50Fourth . . . . . . . . . . . . . . . . . . . . . . $ 57.15 $ 45.23 Fourth . . . . . . . . . . . . . . . . . . $ 35.83 $ 31.27
There were 1,347 shareholders of record as of February 18, 2011. This figure does not include a sub-stantially greater number of beneficial holders of the Company’s common stock, whose shares are held of recordby banks, brokers and other financial institutions.
The Board of Directors declared semi-annual dividends during the two most recent fiscal years paid asfollows:
June 15, 2010 . . . . . . . . . . . . . . . . . . . . . . . . . . . . . . . . . . . . . . . . . . . . . . . . . . . . . . . . . . . . . . . . . . . . . . . . . . . . . . . . $ .20December 15, 2010 . . . . . . . . . . . . . . . . . . . . . . . . . . . . . . . . . . . . . . . . . . . . . . . . . . . . . . . . . . . . . . . . . . . . . . . . . . . $ .20
June 15, 2009 . . . . . . . . . . . . . . . . . . . . . . . . . . . . . . . . . . . . . . . . . . . . . . . . . . . . . . . . . . . . . . . . . . . . . . . . . . . . . . . . $ .19December 15, 2009 . . . . . . . . . . . . . . . . . . . . . . . . . . . . . . . . . . . . . . . . . . . . . . . . . . . . . . . . . . . . . . . . . . . . . . . . . . . $ .19
ISSUER PURCHASES OF EQUITY SECURITIES
Period
Total Numberof Shares
Purchased
Average PricePaid per
Share
Total Numberof Shares
Purchased asPart of
PubliclyAnnounced
Plans orPrograms
MaximumNumber
of Sharesthat
May Yet BePurchasedUnder the
Plans orPrograms
October 1-31, 2010 . . . . . . . . . . . . . . . . . . . . . . . . . . . . . . . 64 $ 48.09 64 31,241,990November 1-30, 2010 . . . . . . . . . . . . . . . . . . . . . . . . . . . . . 1,244,011 $ 51.33 1,244,011 30,637,955December 1-31, 2010 . . . . . . . . . . . . . . . . . . . . . . . . . . . . . 763,818 $ 56.30 763,818 30,177,722
Total . . . . . . . . . . . . . . . . . . . . . . . . . . . . . . . . . . . . . . . . . . 2,007,893 $ 53.22 2,007,893 30,177,722
In November 1993, the Company’s Board of Directors authorized a Non-Discretionary Stock Repurchase Plan forthe purpose of repurchasing the Company’s common stock in the open market with the proceeds received fromthe exercise of stock options. On February 9, 2009, the Plan was amended to increase the authorization torepurchase up to 40 million shares of the Company’s common stock. This authorization has no expirationdate. This plan was disclosed in the Company’s report on Form 10-K filed March 31, 1995. In the fourth quarter of2010, 755,736 shares of common stock were repurchased under the Non-Discretionary Stock Repurchase Plan.
| 19.

In November 2001, under a Discretionary Stock Repurchase Plan, the Company’s Board of Directorsauthorized the repurchase of such shares as may be necessary to reduce the issued and outstanding stock to200 million shares of common stock. The maximum number of shares available for repurchase under this plan willincrease as the total number of outstanding shares increases. This authorization has no expiration date. Thisplan was announced on November 13, 2001. In the fourth quarter of 2010, 1,252,157 shares of common stock wererepurchased under the Discretionary Stock Repurchase Plan. These discretionary repurchases were made tolimit the growth in the number of issued and outstanding shares resulting from stock option exercises and theexercise of employee stock purchase rights.
The graph below matches the cumulative 5-year total return of holders of Expeditors International of Wash-ington’s common stock with the cumulative total returns of the NASDAQ Composite index and the NASDAQTransportation index. The graph assumes that the value of the investment in the company’s common stock and ineach of the indexes (including reinvestment of dividends) was $100 on 12/31/2005 and tracks it through 12/31/2010.
COMPARISON OF 5 YEAR CUMULATIVE TOTAL RETURN*Among Expeditors International of Washington, the NASDAQ Composite Index
and the NASDAQ Transportation Index
Expeditors International of Washington NASDAQ Composite NASDAQ Transportation
$0
$20
$40
$60
$80
$100
$120
$140
$160
$180
12/05 12/06 12/07 12/08 12/09 12/10
* $100 invested on 12/31/05 in stock or index, including reinvestment of dividends. Fiscal year ending December 31.
12/05 12/06 12/07 12/08 12/09 12/10
Expeditors International of Washington . . . . . . . . . . . . 100.00 120.54 133.83 100.47 106.24 168.33NASDAQ Composite . . . . . . . . . . . . . . . . . . . . . . . . . . . . 100.00 111.74 124.67 73.77 107.12 125.93NASDAQ Transportation . . . . . . . . . . . . . . . . . . . . . . . . 100.00 111.57 117.39 88.90 91.15 117.01
The stock price performance included in this graph is not necessarily indicative of future stock price performance.
20. |

ITEM 6 — SELECTED FINANCIAL DATA
Financial Highlights
In thousands except per share data
2010 2009 2008 2007 2006
Revenues . . . . . . . . . . . . . . . . . . . . . . . . . . . . . . . $ 5,967,573 4,092,283 5,633,878 5,235,171 4,633,987Net revenues . . . . . . . . . . . . . . . . . . . . . . . . . . . . 1,692,786 1,382,786 1,603,261 1,452,961 1,290,960Net earnings attributable to shareholders . . . 344,172 240,217 301,014 269,154 235,094Diluted earnings attributable to shareholders
per share . . . . . . . . . . . . . . . . . . . . . . . . . 1.59 1.11 1.37 1.21 1.06Basic earnings attributable to shareholders
per share . . . . . . . . . . . . . . . . . . . . . . . . . 1.62 1.13 1.41 1.26 1.10Dividends declared and paid per common
share . . . . . . . . . . . . . . . . . . . . . . . . . . . . .40 .38 .32 .28 .22Working capital . . . . . . . . . . . . . . . . . . . . . . . . . 1,278,377 1,079,444 903,010 764,944 632,691Total assets . . . . . . . . . . . . . . . . . . . . . . . . . . . . . 2,679,179 2,323,722 2,100,839 2,068,605 1,821,878Shareholders’ equity . . . . . . . . . . . . . . . . . . . . . 1,740,906 1,553,007 1,366,418 1,226,571 1,070,091Weighted average diluted shares
outstanding . . . . . . . . . . . . . . . . . . . . . . . 216,446,656 216,533,240 219,170,003 221,799,868 222,223,312Weighted average basic shares
outstanding . . . . . . . . . . . . . . . . . . . . . . . 212,283,966 212,112,744 212,755,946 213,314,761 213,454,579
All share and per share information have been adjusted to reflect a 2-for-1 stock split effected in June, 2006.
SAFE HARBOR FOR FORWARD-LOOKING STATEMENTS UNDER PRIVATE SECURITIESLITIGATION REFORM ACT OF 1995; CERTAIN CAUTIONARY STATEMENTS
From time to time, the Company or its representatives have made or may make forward-looking statements, orallyor in writing. Such forward-looking statements may be included in, but not limited to, press releases, oral state-ments made with the approval of an authorized executive officer or in various filings made by the Company withthe Securities and Exchange Commission. The words or phrases “will likely result”, “are expected to”, “willcontinue”, “is anticipated”, “estimate”, “project” or similar expressions are intended to identify “forward-lookingstatements” within the meaning of the Private Securities Litigation Reform Act of 1995. Such statements arequalified in their entirety by reference to and are accompanied by the discussion in Item 1A of certain importantfactors that could cause actual results to differ materially from such forward-looking statements.
The risks included in Item 1A are not exhaustive. Furthermore, reference is also made to other sections ofthis report which include additional factors which could adversely impact the Company’s business and financialperformance. Moreover, the Company operates in a very competitive and rapidly changing environment. New riskfactors emerge from time to time and it is not possible for management to predict all of such risk factors, nor canit assess the impact of all of such risk factors on the Company’s business or the extent to which any factor, orcombination of factors, may cause actual results to differ materially from those contained in any forward-lookingstatements. Accordingly, forward-looking statements cannot be relied upon as a guarantee of actual results.
Shareholders should be aware that while the Company does, from time to time, communicate with secu-rities analysts, it is against the Company’s policy to disclose to such analysts any material non-public informationor other confidential commercial information. Accordingly, shareholders should not assume that the Companyagrees with any statement or report issued by any analyst irrespective of the content of such statement or report.Furthermore, the Company has a policy against issuing financial forecasts or projections or confirming the accu-racy of forecasts or projections issued by others. Accordingly, to the extent that reports issued by securities ana-lysts contain any projections, forecasts or opinions, such reports are not the responsibility of the Company.
| 21.

ITEM 7 — MANAGEMENT’S DISCUSSION AND ANALYSIS OF FINANCIAL CONDITION ANDRESULTS OF OPERATIONS
Executive Summary
Expeditors International of Washington, Inc. is engaged in the business of global logistics management, includ-ing international freight forwarding and consolidation, for both air and ocean freight. The Company acts as acustoms broker in all domestic offices, and in many of its international offices. The Company also provides addi-tional services for its customers including value-added distribution, purchase order management, vendor con-solidation and other logistics solutions. The Company does not compete for overnight courier or small parcelbusiness. The Company does not own or operate aircraft or steamships.
International trade is influenced by many factors, including economic and political conditions in the UnitedStates and abroad, currency exchange rates, regulatory environments, cargo and other security concerns, lawsand policies relating to tariffs, trade restrictions, foreign investments and taxation. Periodically, governmentsconsider a variety of changes to regulations, current tariffs and trade restrictions and accords. The Companycannot predict which, if any, of these proposals may be adopted, nor can the Company predict the effects theadoption of any such proposal will have on the Company’s business. Doing business in foreign locations alsosubjects the Company to a variety of risks and considerations not normally encountered by domestic enter-prises. In addition to being influenced by governmental policies concerning international trade, the Company’sbusiness may also be affected by political developments and changes in government personnel or policies, aswell as economic turbulence or security concerns in the nations in which it does business, such as the currentevents in the Middle East and the future impact that these events may have on international trade and oil prices.The global logistics services industry is intensely competitive and is expected to remain so for the foreseeablefuture. Consistent with current economic conditions, the Company’s pricing continues to be pressured bycustomers and service providers.
The Company derives its revenues from three principal sources: 1) airfreight services, 2) ocean freight andocean services, and 3) customs brokerage and other services. These are the revenue categories presented in thefinancial statements.
The Company is managed along three geographic areas of responsibility: Americas; Asia Pacific; andEurope, Africa, Near/Middle East and Indian Subcontinent (EMAIR). Each area is divided into sub-regions whichare composed of operating units with individual profit and loss responsibility. The Company’s business involvesshipments between operating units and typically touches more than one geographic area. The nature of the inter-national logistics business necessitates a high degree of communication and cooperation among operatingunits. Because of this inter-relationship between operating units, it is very difficult to look at one geographic areaand draw meaningful conclusions as to its contribution to the Company’s overall success on a stand-alone basis.
The Company’s operating units share revenue using the same arms-length pricing methodologies theCompany uses when its offices transact business with independent agents. The Company charges its sub-sidiaries and affiliates for services rendered in the United States on a cost recovery basis. The Company’s strat-egy closely links compensation with operating unit profitability. Individual success likely involves cooperationwith other operating units.
As a non-asset based carrier, the Company does not own transportation assets. Rather, the Companygenerates the major portion of its air and ocean freight revenues by purchasing transportation services fromdirect (asset-based) carriers and reselling those services to its customers. The difference between the rate billedto customers (the sell rate) and the rate paid to the carrier (the buy rate) is termed “net revenue” or “yield.” Byconsolidating shipments from multiple customers and concentrating its buying power, the Company is able tonegotiate favorable buy rates from the direct carriers, while at the same time offering lower sell rates thancustomers would otherwise be able to negotiate themselves. Buy rates continued to be challenging in 2010 asvolumes increased and carriers managed overall capacity. Consequently, price changes are absorbed by theCompany during the short-term, pending negotiation with and acceptance by the Company’s customers. Thecombination of carriers managing capacity and associated price volatility continues to challenge the Company’sability to maintain historical unitary profitability.
22. |

Customs brokerage and other services involves providing services at destination, such as helping custom-ers clear shipments through customs by preparing required documentation, calculating and providing for pay-ment of duties and other taxes on behalf of the customers as well as arranging for any required inspections bygovernmental agencies, and arranging for delivery. This is a complicated function requiring technical knowledgeof customs rules and regulations in the multitude of countries in which the Company has offices.
The Company’s ability to provide services to its customers is highly dependent on good working relation-ships with a variety of entities including airlines, ocean steamship lines, and governmental agencies. The sig-nificance of maintaining acceptable working relationships with governmental agencies and asset-based carriersinvolved in global trade has gained increased importance as a result of ongoing concern over terrorism. As eachcarrier labors to comply with additional governmental regulations implementing security policies and procedures,inherent conflicts emerge which can and do affect global trade. A good reputation helps to develop practicalworking understandings that will assist in meeting security requirements while minimizing potential internationaltrade obstacles. The Company considers its current working relationships with these entities to be sat-isfactory. However, airline and ocean steamship line industries have incurred significant losses in recent years asa result of the global economic downturn and many carriers are highly leveraged with debt. This situation hasrequired the Company to be increasingly selective in which carriers to utilize. Further changes in the financialstability, operating capabilities and capacity of asset-based carriers, space allotments available from carriers,governmental regulation or deregulation efforts, “modernization” of the regulations governing customs broker-age, and/or changes in governmental quota restrictions or trade accords could affect the Company’s business inunpredictable ways.
Historically, the Company’s operating results have been subject to a seasonal trend when measured on aquarterly basis. The first quarter has traditionally been the weakest and the third and fourth quarters have tradi-tionally been the strongest. This pattern is the result of, or is influenced by, numerous factors including weatherpatterns, national holidays, consumer demand, economic conditions and a myriad of other similar and subtleforces. In addition, this historical quarterly trend has been influenced by the growth and diversification of theCompany’s international network and service offerings. The Company cannot accurately forecast many of thesefactors nor can the Company estimate accurately the relative influence of any particular factor and, as a result,there can be no assurance that historical patterns, if any, will continue in future periods.
Primarily as a result of the global economic downturn, the Company’s air and ocean freight volumes wereat exceptionally low levels in 2009 as compared to 2010 and 2008. The Company’s air and ocean volumes began toimprove in the fourth quarter of 2009 and this trend continued throughout 2010. Due to the uncertainty in the globaleconomy, the Company cannot predict whether this trend will continue.
A significant portion of the Company’s revenues are derived from customers in retail industries whoseshipping patterns are tied closely to consumer demand, and from customers in industries whose shipping pat-terns are dependent upon just-in-time production schedules. Therefore, the timing of the Company’s revenuesare, to a large degree, impacted by factors out of the Company’s control, such as a sudden change in consumerdemand for retail goods and/or manufacturing production delays. Additionally, many customers ship a significantportion of their goods at or near the end of a quarter, and therefore, the Company may not learn of a shortfall inrevenues until late in a quarter. To the extent that a shortfall in revenues or earnings was not expected by secu-rities analysts, any such shortfall from levels predicted by securities analysts could have an immediate andadverse effect on the trading price of the Company’s stock.
In terms of the opportunities, challenges and risks that management focused on in 2010, the Companyoperates in 60 countries throughout the world in the competitive global logistics industry and Company activitiesare tied directly to the global economy. From the inception of the Company, management has believed that theelements required for a successful global service organization can only be assured through recruiting, training,and ultimately retaining superior personnel. The Company’s greatest challenge is now and always has been per-petuating a consistent global corporate culture which demands:
• Total dedication, first and foremost, to providing superior customer service;• Aggressive marketing of all of the Company’s service offerings;
| 23.

• Ongoing development of key employees and management personnel via formal and informal means;• Creation of unlimited advancement opportunities for employees dedicated to hard work, personal growth,
ethical behavior and continuous improvement;• Individual commitment to the identification and mentoring of successors for every key position so that
when inevitable change is required, a qualified and well-trained internal candidate is ready to step forward;and
• Continuous identification, design and implementation of system solutions, both technological and other-wise, to meet and exceed the needs of our customers while simultaneously delivering tools to make ouremployees more efficient and more effective.
The Company reinforces these values with a compensation system that rewards employees for profitablymanaging the things they can control. This compensation system has been in place since the Company became apublicly traded entity. There is no limit to how much a key manager can be compensated for success. The Com-pany believes in a “real world” environment in every operating unit where individuals are not sheltered from theprofit implications of their decisions. If these decisions result in operating losses, these losses must be made upfrom future operating profits, in the aggregate, before any cash incentive compensation can be earned. At thesame time, the Company insists on continued focus on such things as accounts receivable collection, cash flowmanagement and credit soundness in an attempt to insulate managers from the sort of catastrophic errors thatmight end a career.
Any failure to perpetuate this unique culture on a self-sustained basis throughout the Company provides agreater threat to the Company’s continued success than any external force, which would be largely beyond ourcontrol. Consequently, management spends the majority of its time focused on creating an environment whereemployees can learn and develop while also improving systems and taking preventative action to reduce exposureto negative events. The Company strongly believes that it is nearly impossible to predict events that, in theaggregate, could have a positive or a negative impact on future operations. As a result, our focus is on buildingand maintaining a global corporate culture of well-trained employees and managers that are prepared to identifyand react to subtle changes as they develop and thereby help the Company adapt and thrive as major trendsemerge.
Critical Accounting Estimates
A summary of the Company’s significant accounting policies can be found in Note 1 to the consolidated financialstatements in this Annual Report.
Management believes that the nature of the Company’s business is such that there are few complex chal-lenges in accounting for operations.
While judgments and estimates are a necessary component of any system of accounting, the Company’suse of estimates is limited primarily to the following areas:
• accounts receivable valuation;• the accrual of costs related to ancillary services the Company provides;• accrual of insurance liabilities for the portion of the freight related exposure which the Company has self-
insured;• accrual of various tax liabilities;• accrual of loss contingencies; and• calculation of share-based compensation expense.
These estimates, other than the accrual of loss contingencies and calculation of share-based compensa-tion expense, are not highly uncertain and have not historically been subject to significant change. Managementbelieves that the methods utilized in all of these areas are non-aggressive in approach and consistent in applica-tion. Management believes that there are limited, if any, alternative accounting principles or methods which could
24. |

be applied to the Company’s transactions. While the use of estimates means that actual future results may bedifferent from those contemplated by the estimates, the Company believes that alternative principles and methodsused for making such estimates, other than the calculation of share-based compensation expense, would notproduce materially different results than those reported.
The outcomes of legal proceedings and claims brought against the Company are subject to significantuncertainty. An estimated loss from a contingency such as a legal proceeding or claim is accrued by a charge toincome if it is probable that an asset has been impaired or a liability has been incurred and the amount of the losscan be reasonably estimated. Disclosure of a loss contingency is required if there is at least a reasonable possi-bility that a loss has been incurred. In determining whether a loss should be accrued, management evaluatesseveral factors, including advice from outside counsel, in order to estimate the degree of probability of anunfavorable outcome and make a reasonable estimate on the amount of loss. Changes in these factors could havea material impact on the Company’s financial position, results of operations and operating cash flows.
As described in Note 1.I to the consolidated financial statements in this report, the Company accounts forshare-based compensation based on an estimate of the fair value of options granted to employees under theCompany’s stock option and stock purchase rights plans. This expense is recorded on a straight-line basis overthe option vesting periods.
Determining the appropriate option pricing model to use to estimate stock compensation expense requiresjudgment. Any option pricing model requires assumptions that are subjective and these assumptions also requirejudgment. Examples include assumptions about long-term stock price volatility, employee exercise patterns,pre-vesting option forfeitures, post-vesting option terminations, and the future interest rates and dividend yields.The Company uses the Black-Scholes model for estimating the fair value of stock options. Refer to Note 2 in theconsolidated financial statements for the assumptions used for grants issued during the years endedDecember 31, 2010, 2009 and 2008. The assumptions used by the Company for estimating the fair value of optionsgranted were developed on a basis consistent with assumptions used for valuing previous grants.
Management believes that the assumptions used are appropriate based upon the Company’s historicaland currently expected future experience. Looking to future events, management has been strongly influenced byhistorical patterns which may not be valid predictors of future developments and any future deviation may bematerial.
The Company’s expected volatility assumptions are based on the historical volatility of the Company’sstock. The expected life assumption is primarily based on historical employee exercise patterns and employeepost-vesting termination behavior. The risk-free interest rate for the expected term of the option is based on thecorresponding yield curve in effect at the time of grant for U.S. Treasury bonds having the same term as theexpected life of the option, i.e. a ten year bond rate is used for valuing an option with a ten year expected life. Theexpected dividend yield is based on the Company’s historical experience. The forfeiture rate used to calculatecompensation expense is primarily based on historical pre-vesting employee forfeiture patterns.
The use of different assumptions would result in different amounts of stock compensation expense. Keep-ing all other variables constant, the indicated change in each of the assumptions below increases or decreasesthe fair value of an option (and the resulting stock compensation expense), as follows:
AssumptionChange in
assumptionImpact of fair
value of options
Expected volatility . . . . . . . . . . . . . . . . . . . . . . . . . . . . . . . . . . . . . . . . . . . . . . . . . . . . . . . . . . Higher HigherExpected life of option . . . . . . . . . . . . . . . . . . . . . . . . . . . . . . . . . . . . . . . . . . . . . . . . . . . . . . Higher HigherRisk-free interest rate . . . . . . . . . . . . . . . . . . . . . . . . . . . . . . . . . . . . . . . . . . . . . . . . . . . . . . . Higher HigherExpected dividend yield . . . . . . . . . . . . . . . . . . . . . . . . . . . . . . . . . . . . . . . . . . . . . . . . . . . . . Higher Lower
The fair value of an option is more significantly impacted by changes in the expected volatility andexpected life assumptions. The pre-vesting forfeitures assumption is ultimately adjusted to the actual forfeiturerate. Therefore, changes in the forfeitures assumption would not impact the total amount of expense ultimatelyrecognized over the vesting period. Different forfeiture assumptions would only impact the timing of expense
| 25.

recognition over the vesting period. Estimated forfeitures will be reassessed in subsequent periods and maychange based on new facts and circumstances.
Recent Accounting Pronouncements
In October 2009, the Financial Accounting Standards Board (FASB) issued Accounting Standards Update (ASU)2009–No. 13 “Multiple-Deliverable Revenue Arrangements”, which amends FASB Accounting StandardsCodification Topic 605 –“Revenue Recognition”. This provides amendments to the criteria for separating deliver-ables, measuring and allocating arrangement consideration to one or more units of accounting. This updateestablishes a selling price hierarchy for determining the selling price of a deliverable. ASU 2009–No. 13 is effectivefor revenue arrangements entered into or materially modified in fiscal years beginning on or after June 15, 2010.The Company is required to and plans to adopt the provisions of this update beginning in the first quarter of 2011.The Company has assessed the impact of the adoption of ASU 2009–No. 13 and it is not expecting this update willhave a material effect on the Company’s results of operations.
Results of Operations
The following table shows the consolidated net revenues (revenues less transportation expenses) attributable tothe Company’s principal services and the Company’s expenses for 2010, 2009, and 2008, expressed as percentagesof net revenues. Management believes that net revenues are a better measure than total revenues of the relativeimportance of the Company’s principal services since total revenues earned by the Company as a freight con-solidator include the carriers’ charges to the Company for carrying the shipment whereas revenues earned by theCompany in its other capacities include only the commissions and fees actually earned by the Company.
2010 2009 2008
In thousands Amount
Percentof net
revenues Amount
Percentof net
revenues Amount
Percentof net
revenues
Net revenues:
Airfreight services . . . . . . . . . . . . . . . . . $ 640,230 38% $ 489,475 35% $ 578,756 36%Ocean freight and ocean services . . . . 385,523 23 324,223 24 394,637 25Customs brokerage and other
services . . . . . . . . . . . . . . . . . . . . 667,033 39 569,088 41 629,868 39
Net revenues . . . . . . . . . . . . . . . . . . . . . . 1,692,786 100 1,382,786 100 1,603,261 100
Overhead expenses:
Salaries and related costs . . . . . . . . . . . 894,132 53 774,214 56 863,846 54Other . . . . . . . . . . . . . . . . . . . . . . . . . . . . . 251,424 15 223,571 16 266,279 17
Total overhead expenses . . . . . . . . . . . . 1,145,556 68 997,785 72 1,130,125 71
Operating income . . . . . . . . . . . . . . . . . . 547,230 32 385,001 28 473,136 29Other income, net . . . . . . . . . . . . . . . . . . 16,838 1 17,871 1 26,436 2
Earnings before income taxes . . . . . . . . 564,068 33 402,872 29 499,572 31Income tax expense . . . . . . . . . . . . . . . . 219,863 13 162,475 12 196,593 12
Net earnings . . . . . . . . . . . . . . . . . . . . . . 344,205 20 240,397 17 302,979 19Less: net earnings attributable to
noncontrolling interest . . . . . . . 33 — 180 — 1,965 —
Net earnings attributable toshareholders . . . . . . . . . . . . . . . . $ 344,172 20% $ 240,217 17% $ 301,014 19%
26. |

2010 compared with 2009
Airfreight services net revenues in 2010 increased 31% as compared with 2009. The increase in global airfreightservices net revenues was primarily due to a 35% increase in airfreight tonnage, which was partially offset by aslight decrease in net revenue per kilo. North America, Asia Pacific and Europe airfreight services net revenuesincreased 34%, 39% and 15%, respectively, in 2010 as compared with 2009, while airfreight export tonnageincreased 47%, 32% and 28%, respectively. The increase in airfreight tonnage is primarily due to improvements inthe global economy which began in the fourth quarter of 2009.
Ocean freight and ocean services net revenues increased 19% in 2010 as compared with 2009. North Amer-ica, Asia Pacific and Europe ocean freight net revenues increased approximately 17%, 23% and 13%, respectively,in 2010 as compared with 2009.
Ocean freight net revenues are comprised of three basic services: ocean freight consolidation, directocean forwarding and order management. The majority of the Company’s ocean freight net revenue is derivedfrom ocean freight consolidation which represented 51% and 52% of ocean freight net revenue in 2010 and 2009,respectively.
Ocean freight consolidation net revenue increased 16% in 2010 as compared with 2009, primarily due to a20% increase in volume as measured in terms of forty-foot container equivalent units (FEUs), partially offset by a3% decrease in net revenue per container. Direct ocean freight forwarding and order management, which areprimarily fee-based, increased 15% and 34%, respectively, in 2010, as compared with 2009, due to an increase involume.
The increase in ocean volumes is primarily due to an improvement in the global economy which began inthe fourth quarter of 2009. Net revenue per container in 2010 was lower than in 2009 due to favorable spot marketbuying opportunities in the first half of 2009 that were not available in 2010.
Customs brokerage and other services net revenues increased 17% in 2010 as compared with 2009, primar-ily as a result of increases in international air and ocean and domestic time definite freight volumes. Customerscontinue to seek out customs brokers with sophisticated computerized capabilities critical to an overall logisticsmanagement program, including rapid responses to changes in the regulatory and security environment.
Salaries and related costs, excluding stock compensation expense, increased 16% in 2010, as comparedwith 2009, primarily as a result of larger bonuses earned from achieving higher operating income before bonuses,an increase in the number of employees, and higher stock compensation expense.
The effects of including stock-based compensation expense in salaries and related costs for 2010 and 2009are as follows:
Years ended December 31,
In thousands 2010 2009
Salaries and related costs . . . . . . . . . . . . . . . . . . . . . . . . . . . . . . . . . . . . . . . . . . . . . . . . . . $ 894,132 $ 774,214As a % of net revenue . . . . . . . . . . . . . . . . . . . . . . . . . . . . . . . . . . . . . . . . . . . . . . . . . . . . . . 52.8% 56.0%Stock compensation expense . . . . . . . . . . . . . . . . . . . . . . . . . . . . . . . . . . . . . . . . . . . . . . . $ 43,743 $ 39,135As a % of salaries and related costs . . . . . . . . . . . . . . . . . . . . . . . . . . . . . . . . . . . . . . . . . . 4.9% 5.1%As a % of net revenue . . . . . . . . . . . . . . . . . . . . . . . . . . . . . . . . . . . . . . . . . . . . . . . . . . . . . . 2.6% 2.8%
Excluding stock compensation expense, salaries and related costs as a percentage of net revenuedecreased 292 basis points for 2010, as compared with 2009. This decrease can be attributed to productivity gainsthat resulted from more efficient staff utilization. Stock compensation expense increased 12% in 2010, as com-pared with 2009, primarily a result of a $4 million “true up” credit recognized in 2009 for the difference between thehigher actual pre-vesting forfeiture experience and the pre-vesting forfeiture assumptions used to calculate stockoption expense. The net impact on salaries and related costs was $3 million after consideration of the effect onbonuses.
| 27.
Historically, the relatively consistent relationship between salaries and net revenues is the result of acompensation philosophy that has been maintained since the inception of the Company: offer a modest basesalary and the opportunity to share in a fixed and determinable percentage of the operating profit of the businessunit controlled by each key employee. Using this compensation model, changes in individual incentive compensa-tion will occur in proportion to changes in Company profits, creating a direct alignment between corporate per-formance and shareholder interests. Bonuses to field and corporate management in 2010 were up 35% ascompared with 2009 primarily as a result of a 42% increase in operating income. The Company’s managementincentive compensation programs have always been incentive-based and performance driven and there is nobuilt-in bias that favors or enriches management in a manner inconsistent with overall corporate performance.
Because the Company’s management incentive compensation programs are also cumulative, no manage-ment bonuses can be paid unless the relevant business unit is, from inception, cumulatively profitable. Any oper-ating losses must have been offset in their entirety by operating profits before management is eligible for a bonus.Since the most significant portion of management compensation comes from the incentive bonus programs, theCompany believes that this cumulative feature is a disincentive to excessive risk taking by its managers. Due tothe nature of the Company’s services, it has a short operating cycle. The outcome of any higher risk transactions,such as overriding established credit limits, would be known in a relatively short time frame. Management believesthat when the potential and certain impact on the bonus is fully considered in light of this short operating cycle,the potential for short term gains that could be generated by engaging in risky business practices is sufficientlymitigated to discourage excessive and inappropriate risk taking. Management believes that both the stability andthe long term growth in revenues, net revenues and net earnings are a result of the incentives inherent in theCompany’s compensation program.
Other overhead expenses increased 12% in 2010, as compared with 2009, primarily as a result of higherbusiness taxes, travel and other expenses related to increased activity. Legal and related expenses increasedslightly in 2010, as compared with 2009, primarily attributable to preparing the Company’s responses to a State-ment of Objections issued by the European Commission as described further in Part I — Item 3 in this report onForm 10-K entitled “Legal Proceedings”. The Company will continue to incur legal costs, which could be sub-stantial and include judgments, fines and/or penalties, until the legal proceedings described in Item 3 herein areconcluded. Further, the Company periodically conducts reviews of the operations and procedures of its officesworldwide relating to compliance with applicable laws and regulations. If the governmental regulatory agenciesconclude that the Company has engaged in anti-competitive behavior or in the event of an adverse judgment inthe class action lawsuit described in Item 3 herein, such judgments, fines and/or penalties could have a materialimpact on the Company’s financial condition, results of operations and operating cash flows. Other overheadexpenses as a percentage of net revenues decreased slightly for 2010, as compared with 2009.
Other income, net, decreased 6% in 2010, as compared with 2009. Interest income decreased $3 million dueto lower average interest rates during 2010, as compared with 2009.
The Company pays income taxes in the United States and other jurisdictions, as well as other taxes whichare typically included in costs of operations. The Company’s consolidated effective income tax rate in 2010 was38.9% as compared to 40.3% for 2009. Although a tax benefit related to stock-based compensation expense isrecorded for non-qualified stock options at the time the related compensation expense is recognized, the taxbenefit received for disqualifying dispositions of incentive stock options cannot be anticipated. The lower con-solidated effective income tax rate for 2010, as compared 2009, is primarily the result of a higher tax benefitreceived for disqualifying dispositions of incentive stock options for 2010, as compared with 2009.
2009 compared with 2008
Airfreight services net revenues in 2009 decreased 15% compared with 2008. The decrease in global airfreight serv-ices net revenues was primarily due to a 13% decline in airfreight tonnage. North America, Asia Pacific andEurope airfreight services net revenues decreased 13%, 15% and 21%, respectively, in 2009 as compared with 2008,while airfreight export tonnage decreased 16%, 13% and 10%, respectively.
28. |

The decrease in airfreight tonnage is primarily due to the global economic downturn which began in thesecond half of 2008. During the first six months of 2009, net revenue per kilo increased as compared to the sameperiod in 2008, as a result of favorable buying opportunities that developed in a number of short-term spot mar-kets. This increase was offset during the second half of 2009, as air carriers removed significant capacity from themarkets while rapidly and aggressively increasing airfreight pricing, particularly in Asia. The Company absorbedthese price increases during the short-term, prior to negotiations with and acceptance by the Company’scustomers. North America and Asia Pacific net revenues declined primarily due to lower export tonnage in 2009as compared to 2008. Europe net revenues declined principally due to lower export tonnage and lower importvolumes, primarily from Asia.
Ocean freight and ocean services net revenues decreased 18% in 2009 as compared with 2008. North Amer-ica, Asia Pacific and Europe ocean freight net revenues decreased approximately 19%, 18% and 21%, respectively,in 2009 as compared with 2008.
Ocean freight net revenues are comprised of three basic services: ocean freight consolidation, directocean forwarding and order management. The majority of the Company’s ocean freight net revenue is derivedfrom ocean freight consolidation which represented 52% and 59% of ocean freight net revenue in 2009 and 2008,respectively.
Ocean freight consolidation net revenue decreased 27% in 2009 as compared with 2008, primarily due to a17% decrease in volume and a 13% decrease in net revenue per container. Direct ocean freight forwarding, whichis primarily fee-based, decreased 8% in 2009, as compared with 2008, due to a decrease in volume. Ordermanagement remained relatively constant in 2009 as compared with 2008.
The decrease in ocean volumes is primarily due to the global economic downturn. Net revenue percontainer increased in the first half of 2009, as compared with 2008, as a result of favorable buying opportunitiesthat developed in a number of short-term spot markets. Steamship lines removed significant capacity from themarket and implemented price increases in the second half of 2009, particularly on the Pacific North Americalanes. The combination of these moves eliminated the favorable buying opportunities that existed in the first halfof 2009. These price increases were absorbed by the Company during the second half of 2009, prior to negotia-tions with and acceptance by the Company’s customers.
Customs brokerage and other services net revenues decreased 10% in 2009 as compared with 2008, primar-ily as a result of declines in air and ocean freight volumes.
Salaries and related costs decreased 10% in 2009, as compared with 2008, primarily as a result of (i) smallerbonuses due to lower operating income, (ii) an overall decrease in base salaries directly related to a lower head-count and (iii) lower stock compensation expense.
The effect of including stock-based compensation expense in salaries and related costs for 2009 and 2008are as follows:
Years ended December 31,
In thousands 2009 2008
Salaries and related costs . . . . . . . . . . . . . . . . . . . . . . . . . . . . . . . . . . . . . . . . . . . . . . . . . . $ 774,214 $ 863,846As a % of net revenue . . . . . . . . . . . . . . . . . . . . . . . . . . . . . . . . . . . . . . . . . . . . . . . . . . . . . . 56.0% 53.9%Stock compensation expense . . . . . . . . . . . . . . . . . . . . . . . . . . . . . . . . . . . . . . . . . . . . . . . $ 39,135 $ 44,879As a % of salaries and related costs . . . . . . . . . . . . . . . . . . . . . . . . . . . . . . . . . . . . . . . . . . 5.1% 5.2%As a % of net revenue . . . . . . . . . . . . . . . . . . . . . . . . . . . . . . . . . . . . . . . . . . . . . . . . . . . . . . 2.8% 2.8%
Excluding stock compensation expense, salaries and related costs as a percentage of net revenueincreased 208 basis points for 2009, as compared with 2008. This increase is largely due to the fixed nature of basesalaries and management’s commitment to maintaining its people during this economic downturn. Stockcompensation expense declined 13% in 2009, as compared with 2008, primarily a result of a $4 million “true up”credit recognized in the first quarter of 2009 for the difference between the higher actual pre-vesting forfeitureexperience and the pre-vesting forfeiture assumptions used to calculate stock option expense. The net impact on
| 29.

salaries and related costs was $3 million after consideration of the effect on bonuses. This credit relates primarilyto stock option grants made in 2006, the majority of which began vesting in May 2009.
The Company’s operating income in 2009 was 19% lower than the amount reported in 2008. This was thefirst year since 1984 that the Company’s operating income was lower than the amount which had been reported inthe previous year. Bonuses to field and corporate management in 2009 were also both down 19% as compared with2008. The Company’s management incentive compensation programs have always been incentive-based andperformance driven and there is no built-in bias that favors or enriches management in a manner inconsistentwith overall corporate performance.
Other overhead expenses decreased 16% in 2009, as compared with 2008, primarily as a result of continuedcost reduction measures, including cutbacks on travel and entertainment expenses. Legal and related expensesdecreased approximately $11 million in 2009, as compared with 2008, primarily attributable to lower activity relatedto governmental regulatory agencies’ ongoing investigations of air cargo freight forwarders and related legalproceedings as described further in Part I—Item 3 in this report on Form 10-K entitled “Legal Proceedings”. Otheroverhead expenses as a percentage of net revenues remained constant for 2009, as compared with 2008.
Other income, net, decreased 32% in 2009, as compared with 2008. Interest income decreased $11 milliondue to lower average interest rates during 2009, as compared with 2008.
The Company pays income taxes in the United States and other jurisdictions, as well as other taxes whichare typically included in costs of operations. The Company’s consolidated effective income tax rate in 2009 was40.3% as compared to 39.4% for 2008. The higher consolidated effective income tax rate for 2009, as compared 2008,is primarily the result of a lower tax benefit received for disqualifying dispositions of incentive stock options for2009, as compared with 2008.
Currency and Other Risk Factors
International air/ocean freight forwarding and customs brokerage are intensively competitive and are expected toremain so for the foreseeable future. There are a large number of entities competing in the international logisticsindustry; however, the Company’s primary competition is confined to a relatively small number of companieswithin this group. Historically, the industry has experienced consolidations into larger firms striving for strongerand more complete multinational and multi-service networks. However, regional and local broker/forwardersremain a competitive force.
The primary competitive factors in the international logistics industry continue to be price and quality ofservice, including reliability, responsiveness, expertise, convenience, and scope of operations. The Companyemphasizes quality customer service and believes that its prices are competitive with those of others in theindustry. Larger customers utilize more sophisticated and efficient procedures for the management of their logis-tics supply chains by embracing strategies such as just-in-time inventory management. The Company believesthat this trend has resulted in customers using fewer service providers with greater technological capacity andmore consistent global coverage. Accordingly, sophisticated computerized customer service capabilities and astable worldwide network have become significant factors in attracting and retaining customers.
Developing these systems and a worldwide network adds a considerable indirect cost to the services pro-vided to customers. Smaller and middle-tier competitors, in general, do not have the resources available todevelop customized systems and a worldwide network.
The nature of the Company’s worldwide operations necessitates the Company dealing with a multitude ofcurrencies other than the U.S. dollar. This results in the Company being exposed to the inherent risks of theinternational currency markets and governmental interference. Some of the countries where the Company main-tains offices and/or agency relationships have strict currency control regulations which influence the Company’sability to hedge foreign currency exposure. The Company tries to compensate for these exposures by acceleratinginternational currency settlements among its offices or agents. The Company enters into foreign currency hedg-ing transactions only in limited locations where there are regulatory or commercial limitations on the Company’sability to move money freely around the world or the short-term financial outlook in any country is such that hedg-ing is the most time-sensitive way to avoid short-term exchange losses. Any such hedging activity during 2010,
30. |

2009 and 2008 was insignificant. Net foreign currency gains in 2010 and 2009 were $2 million and $1 million,respectively. Net foreign currency losses in 2008 were $191,000. The Company had no foreign currency derivativesoutstanding at December 31, 2010 and 2009.
Geographic Coverage
During 2010, the Company opened three full-service offices: 1) Curitiba, Brazil; 2) Oslo, Norway; and 3) Zhong-shan, People’s Republic of China (formerly a satellite of Shenzhen, People’s Republic of China). The Companyopened two satellite offices: 1) Belo Horizonte, Brazil; and 2) Rome, Italy. The Company changed the Macau,People’s Republic of China office from a full service to a satellite office and closed one satellite office in Lewiston,New York.
Acquisitions – Historically, growth through aggressive acquisition has proven to be a challenge for manyof the Company’s competitors and typically involves the purchase of significant “goodwill,” the value of whichcan be realized in large measure only by retaining the customers and profit margins of the acquired business. Asa result, the Company has pursued a strategy emphasizing organic growth supplemented by certain strategicacquisitions, where future economic benefit significantly exceeds the “goodwill” recorded in the transaction.
Internal Growth – Management believes that a comparison of “same store” results is critical in the evalua-tion of the quality and extent of the Company’s internally generated growth. The “same store” analysis isolatesthe financial contributions from offices that have been included in the Company’s operating results for at leastone full year. There were no significant differences between the “same store” analysis and the Company’s resultsfor the years ended December 31, 2010, 2009 and 2008.
Liquidity and Capital Resources
The Company’s principal source of liquidity is cash and cash equivalents and cash generated from operatingactivities. Net cash provided by operating activities for the year ended December 31, 2010 was $396 million, ascompared with $331 million for 2009. This $65 million increase is primarily due to an increase in net earnings offsetby changes in working capital accounts, primarily an increase in accounts receivable. At December 31, 2010, work-ing capital was $1,278 million, including cash, cash equivalents and short-term investments of $1,085 million. TheCompany had no long-term debt at December 31, 2010.
The Company’s business is subject to seasonal fluctuations. Cash flow fluctuates as a result of this sea-sonality. Historically, the first quarter shows an excess of customer collections over customer billings. Thisresults in positive cash flow. The increased activity associated with peak season (typically commencing latesecond or early third quarter and continuing well into the fourth quarter) causes an excess of customer billingsover customer collections. This cyclical growth in customer receivables consumes available cash.
As a customs broker, the Company makes significant cash advances for a select group of its credit-worthycustomers. These cash advances are for customer obligations such as the payment of duties to customs author-ities in various countries throughout the world. Cash advances are a “pass through” and are not recorded as acomponent of revenue and expense. The billings of such advances to customers are accounted for as a directincrease in accounts receivable from the customer and a corresponding increase in accounts payable to gov-ernmental customs authorities. As a result of these “pass through” billings, the conventional Days Sales Out-standing or DSO calculation does not directly measure collection efficiency.
Cash used in investing activities for the year ended December 31, 2010 was $42 million, as compared with$41 million for 2009. The largest use of cash in investing activities is cash paid for capital expenditures. TheCompany does have need, on occasion, to purchase buildings to house staff and to facilitate the staging of cus-tomers’ freight. The Company routinely invests in technology, leasehold improvements, equipment, and officefurniture. For the year ended December 31, 2010, the Company made capital expenditures of $42 million as com-pared with $40 million for 2009, which includes prepayments on long-term land leases. This includes normal capi-tal expenditures as noted above and $13 million for real estate development. Total capital expenditures in 2011 arecurrently estimated to be $117 million. This includes normal capital expenditures as noted above, plus additional
| 31.

real estate development. In 2010, the Company entered into contracts to develop office/warehouse facilities inLondon, United Kingdom and in Beijing, China and these projects are expected to be completed in 2011.
Cash used in financing activities for the year ended December 31, 2010 was $209 million as compared with$117 million in 2009. The Company uses the proceeds from stock option exercises to repurchase the Company’scommon stock on the open market. In 2010, the Company continued its policy of repurchasing stock to limitgrowth in issued and outstanding shares as a result of stock option exercises. The increase in cash used infinancing activities for the year ended December 31, 2010 as compared with the same period in 2009 is primarilydue to a greater number of shares repurchased and a higher average price per share. During 2010 and 2009 the netuse of cash in financing activities included the payment of dividends of $.40 per share and $.38 per share,respectively.
The Company follows established guidelines relating to credit quality, diversification and maturities of itsinvestments to preserve principal and maintain liquidity. The Company’s investment portfolio has not beenadversely impacted by the disruption in the credit markets. However there can be no assurance that the Compa-ny’s investment portfolio will not be adversely affected in the future.
The Company cannot forecast the impact that ongoing uncertainties in the global economy will have on itsoperating results. Management believes that the Company has effective credit control procedures, and historicallyhas experienced relatively insignificant collection problems. The Company cannot predict what fallout economicuncertainties may have on freight volumes, pricing, changes in consumer demand, supplier stability and capacityor on customers’ abilities to pay.
The Company maintains international unsecured bank lines of credit. At December 31, 2010, the interna-tional bank lines of credit totaled $22 million. At December 31, 2010, the Company had no amounts outstanding onthese lines of credit, but was contingently liable for $91 million from standby letters of credit and guarantees. Thestandby letters of credit and guarantees relate to obligations of the Company’s foreign subsidiaries for creditextended in the ordinary course of business by direct carriers, primarily airlines, and for duty and tax deferralsavailable from governmental entities responsible for customs and value-added-tax (VAT) taxation. The totalunderlying amounts due and payable for transportation and governmental excises are properly recorded asobligations in the books of the respective foreign subsidiaries, and there would be no need to record additionalexpense in the unlikely event the parent company is required to perform.
Amount of CommitmentExpiration Per Period
In thousands
Totalamounts
committed
Lessthan 1
year1 - 3
years3 - 5
yearsAfter
5 years
Standby letters of credit . . . . . . . . . . . . . . . . . . . . . . . $ 91,495 $ 85,342 $ 3,867 $ 227 $ 2,059
At December 31, 2010, the Company’s contractual obligations are as follows:
Payments Due by Period
In thousands TotalLess than
1 year1 - 3
years3 - 5
yearsAfter
5 years
Contractual Obligations:
Operating leases . . . . . . . . . . . . . . . . . . . . . . . $ 128,154 $ 39,244 $ 54,022 $ 23,445 $ 11,443Unconditional purchase obligations . . . . . . 180,202 180,202 — — —Construction and equipment purchase
obligations . . . . . . . . . . . . . . . . . . . . . . 37,266 35,923 1,343 — —
Total contractual cash obligations . . . . . . . . $ 345,622 $ 255,369 $ 55,365 $ 23,445 $ 11,443
The Company enters into short-term agreements with asset-based providers reserving space on a guaran-teed basis. The pricing of these obligations varies to some degree with market conditions. The Company only
32. |

enters into agreements that management believes the Company can fulfill with relative ease. Historically, theCompany has not paid for guaranteed space that it has not used. Management believes, in line with historicalexperience, committed purchase obligations outstanding as of December 31, 2010, will be fulfilled during 2011 inthe Company’s ordinary course of business.
The Company has a Non-Discretionary Stock Repurchase Plan to repurchase shares from the proceeds ofstock option exercises. As of December 31, 2010, the Company had repurchased and retired 21,870,052 shares ofcommon stock at an average price of $21.24 per share over the period from 1994 through 2010. During 2010,2,235,613 shares were repurchased at an average price of $44.41 per share.
The Company has a Discretionary Stock Repurchase Plan under which Management is allowed torepurchase such shares as may be necessary to reduce the issued and outstanding stock to 200,000,000 shares ofcommon stock. As of December 31, 2010, the Company had repurchased and retired 20,067,005 shares of commonstock at an average price of $34.37 per share over the period from 2001 through 2010. During 2010, 3,218,407 shareswere repurchased at an average price of $45.69 per share. These discretionary repurchases were made to limit thegrowth in the number of issued and outstanding shares as a result of stock option exercises and the exercise ofemployee stock purchase rights.
Management believes that the Company’s current cash position and operating cash flows will be sufficientto meet its capital and liquidity requirements for the foreseeable future, including meeting any contingentliabilities related to standby letters of credit and other obligations.
In some cases, the Company’s ability to repatriate funds from foreign operations may be subject to foreignexchange controls. At December 31, 2010, cash and cash equivalent balances of $561 million were held by theCompany’s non-United States subsidiaries, of which $66 million was held in banks in the United States.
Impact of Inflation
To date, the Company’s business has not been adversely affected by inflation. Direct carrier rate increases couldoccur over the short- to medium-term period. Due to the high degree of competition in the market place, theserate increases can lead to an erosion in the Company’s margins. As the Company is not required to purchase ormaintain extensive property and equipment and has not otherwise incurred substantial interest rate-sensitiveindebtedness, the Company currently has limited direct exposure to increased costs resulting from increases ininterest rates.
Off-Balance Sheet Arrangements
As of December 31, 2010, the Company did not have any material off-balance-sheet arrangements, as defined inItem 303(a)(4)(ii) of SEC Regulation S-K.
| 33.

ITEM 7A — QUANTITATIVE AND QUALITATIVE DISCLOSURES ABOUT MARKET RISK
The Company is exposed to market risks in the ordinary course of its business. These risks are primarily relatedto foreign exchange risk and changes in short-term interest rates. The potential impact of the Company’sexposure to these risks is presented below:
Foreign Exchange Risk
The Company conducts business in many different countries and currencies. The Company’s business oftenresults in revenue billings issued in a country and currency which differs from that where the expenses related tothe service are incurred. In the ordinary course of business, the Company creates numerous intercompany trans-actions and may hold currencies that are not the local functional currency. This brings foreign exchange risk tothe Company’s earnings.
Foreign exchange rate sensitivity analysis can be quantified by estimating the impact on the Company’searnings as a result of hypothetical changes in the value of the U.S. dollar, the Company’s functional currency,relative to the other currencies in which the Company transacts business. All other things being equal, an aver-age 10% weakening of the U.S. dollar, throughout the year ended December 31, 2010, would have had the effect ofraising operating income approximately $40 million. An average 10% strengthening of the U.S. dollar, for the sameperiod, would have the effect of reducing operating income approximately $32 million. This analysis does not takeinto account changes in shipping patterns based upon this hypothetical currency fluctuation. For example, aweakening in the U.S. dollar would be expected to increase exports from the United States and decrease importsinto the United States over some relevant period of time, but the exact effect of this change cannot be quantifiedwithout making speculative assumptions.
As of December 31, 2010, the Company had approximately $1 million of net unsettled intercompany trans-actions. The Company currently does not use derivative financial instruments to manage foreign currency riskand only enters into foreign currency hedging transactions in limited locations where regulatory or commerciallimitations restrict the Company’s ability to move money freely. Any such hedging activity throughout the yearended December 31, 2010, was insignificant. Net foreign currency gains in 2010 and 2009 were $2 million and $1million, respectively. Net foreign currency losses in 2008 were $191,000. The Company had no foreign currencyderivatives outstanding at December 31, 2010 and 2009. The Company instead follows a policy of acceleratinginternational currency settlements to manage foreign exchange risk relative to intercompany billings. The majorityof intercompany billings are resolved within 30 days and intercompany billings arising in the normal course ofbusiness are fully settled within 90 days.
Interest Rate Risk
At December 31, 2010, the Company had cash, cash equivalents and short-term investments of $1,085 million, ofwhich $641 million was invested at various short-term market interest rates. The Company had no short-termborrowings at December 31, 2010. A hypothetical change in the interest rate of 10 basis points at December 31,2010 would not have a significant impact on the Company’s earnings.
In management’s opinion, there has been no material change in the Company’s interest rate risk exposurebetween 2009 and 2010.
34. |

ITEM 8 — FINANCIAL STATEMENTS AND SUPPLEMENTARY DATA
The following documents are filed on the pages listed below, as part of Part II, Item 8 of this report.
Document Page
1. Financial Statements and Reports of Independent Registered Public Accounting Firm:
Reports of Independent Registered Public Accounting Firm . . . . . . . . . . . . . . . . . . . . . . . . . F-1 and F-2
Consolidated Financial Statements:
Balance Sheets as of December 31, 2010 and 2009 . . . . . . . . . . . . . . . . . . . . . . . . . . . . . . . . F-3
Statements of Earnings for the Years Ended December 31, 2010, 2009 and 2008 . . . . . . . . F-5
Statements of Equity and Comprehensive Income for the Years Ended December 31,2010, 2009 and 2008 . . . . . . . . . . . . . . . . . . . . . . . . . . . . . . . . . . . . . . . . . . . . . . . . . . . . . F-7
Statements of Cash Flows for the Years Ended December 31, 2010, 2009 and 2008 . . . . . F-9
Notes to Consolidated Financial Statements . . . . . . . . . . . . . . . . . . . . . . . . . . . . . . . . . . . . . F-11 through F-27
ITEM 9 — CHANGES IN AND DISAGREEMENTS WITH ACCOUNTANTS ON ACCOUNTING ANDFINANCIAL DISCLOSURE
None.
ITEM 9A — CONTROLS AND PROCEDURES
Evaluation of Controls and Procedures
The Company carried out an evaluation, under the supervision and with the participation of its management,including the Chief Executive Officer and Chief Financial Officer, of the effectiveness of the design and operationof the Company’s “disclosure controls and procedures” (as defined in the Exchange Act Rule 13a-15(e)) as of theend of the period covered by this report. Based upon that evaluation, the Chief Executive Officer and Chief Finan-cial Officer concluded that the Company’s disclosure controls and procedures were effective as of the end of theperiod covered by this report at the reasonable assurance level.
Changes in Internal Controls
There were no changes in the Company’s internal control over financial reporting that occurred during the mostrecent fiscal quarter that have materially affected, or are reasonably likely to materially affect, the Company’sinternal control over financial reporting.
We have confidence in the Company’s internal controls and procedures. Nevertheless, the Company’smanagement, including the Company’s Chief Executive Officer and Chief Financial Officer, does not expect thatthe Company’s disclosure procedures and controls or the Company’s internal controls will prevent all errors orintentional fraud. An internal control system, no matter how well-conceived and operated, can provide only rea-sonable, not absolute, assurance that the objectives of such internal controls are met. Further, the design of aninternal control system must reflect the fact that there are resource constraints, and the benefits of controls mustbe considered relative to their costs. Because of the inherent limitations in all internal control systems, no evalua-tion of controls can provide absolute assurance that all the Company’s control issues and instances of fraud, ifany, have been detected.
| 35.

Management Report on Internal Control Over Financial Reporting
The management of the Company is responsible for establishing and maintaining adequate internal control overfinancial reporting as required by the Sarbanes-Oxley Act of 2002 and as defined in Exchange Act Rule 13a-15(f). The Company’s system of internal control over financial reporting is designed to provide reasonable assur-ance to the Company’s management and Board of Directors regarding the reliability of our financial reporting andthe preparation of financial statements for external purposes in accordance with U.S. generally accepted account-ing principles. Internal control over financial reporting includes those policies and procedures that (i) pertain tothe maintenance of records that in reasonable detail accurately and fairly reflect the transactions and dispositionsof the assets of the Company; (ii) provide reasonable assurance that transactions are recorded as necessary topermit preparation of financial statements in accordance with U.S. generally accepted accounting principles, andthat receipts and expenditures of the Company are being made only in accordance with authorizations ofmanagement and the Board of Directors of the Company; and (iii) provide reasonable assurance regarding pre-vention or timely detection of unauthorized acquisition, use or disposition of the Company’s assets that couldhave a material effect on the financial statements.
A system of internal control can provide only reasonable, not absolute, assurance that the objectives of thecontrol system are met. Our management, including our Chief Executive Officer and Chief Financial Officer,conducted an assessment of the effectiveness of our internal control over financial reporting, as of December 31,2010, based on the framework in “Internal Control — Integrated Framework” issued by the Committee of Sponsor-ing Organizations of the Treadway Commission (COSO). Based on this assessment, our management has con-cluded that, as of December 31, 2010, our internal control over financial reporting was effective.
KPMG LLP, an independent registered public accounting firm, has issued an attestation report on theCompany’s internal control over financial reporting as of December 31, 2010, which is included on page F-2.
ITEM 9B — OTHER INFORMATION
Not applicable.
36. |

PART III
ITEM 10 — DIRECTORS, EXECUTIVE OFFICERS AND CORPORATE GOVERNANCE
The information required by this item is set forth below or incorporated by reference to information under thecaption “Proposal 1 — Election of Directors” and to the information under the captions “Section 16(a) BeneficialOwnership Reporting Compliance” and “Corporate Governance-Director Nomination Process” in the Company’sdefinitive Proxy Statement for its annual meeting of shareholders to be held on May 4, 2011. See also Part I — Item1 — Executive Officers of the Registrant.
Audit Committee and Audit Committee Financial Expert
Our Board has a separately-designated standing Audit Committee established in accordance with Sec-tion 3(a)(58)(A) of the Exchange Act. The members of the Audit Committee are Mark A. Emmert, Dan P.Kourkoumelis, Michael J. Malone, John W. Meisenbach and Robert R. Wright. Our Board has determined thatRobert R. Wright, Chairman of the Audit Committee, is an audit committee financial expert as defined byItem 407(d)(5) of Regulation S-K under the Exchange Act and that each member of the Audit Committee isindependent under the NASDAQ independence standards applicable to audit committee members.
Code of Ethics and Governance Guidelines
We have adopted a Code of Business Conduct that applies to all Company employees including, of course, ourprincipal executive officer and principal financial and accounting officer. The Code of Business Conduct is postedon our website at http://www.investor.expeditors.com. We will post any amendments to the Code of BusinessConduct at that location. In the unlikely event that the Board of Directors approves any sort of waiver to the Codeof Business Conduct for our executive officers or directors, information concerning such waiver will also beposted at that location. No waivers were granted in 2010. In addition to posting information regarding amend-ments and waivers on our website, the same information will be included in a Current Report on Form 8-K withinfour business days following the date of the amendment or waiver, unless website posting of such amendmentsor waivers satisfies applicable NASDAQ listing rules.
Our investor relations website also includes under the heading “Executive Officer’s and Director’s StockTrading Plans” information regarding entries into a Rule 10b5-1 trading plan by directors or officers of the Com-pany or by the Company itself. Any new entry into such a trading plan or amendments thereto will be posted atthat location.
ITEM 11 — EXECUTIVE COMPENSATION
The information required by this item is incorporated by reference to information under the captions “Proposal 1 –Election of Directors” and “Executive Compensation” in the Company’s definitive Proxy Statement for its annualmeeting of shareholders to be held on May 4, 2011.
ITEM 12 — SECURITY OWNERSHIP OF CERTAIN BENEFICIAL OWNERS AND MANAGEMENT ANDRELATED STOCKHOLDER MATTERS
The information required by this item is incorporated by reference to information under the captions “PrincipalHolders of Voting Securities” and “Proposal 1 — Election of Directors” in the Company’s definitive Proxy State-ment for its annual meeting of shareholders to be held on May 4, 2011.
| 37.

Securities Authorized for Issuance under Equity Compensation Plans
The following table provides information as of December 31, 2010, regarding compensation plans under whichequity securities of the Company are authorized for issuance.
Plan Category
Number of Securitiesto be Issued Upon
Exercise ofOutstanding
Options, Warrantsand Rights (1)
Weighted-AverageExercise Price of
OutstandingOptions, Warrants
and Rights (2)
Number of SecuritiesAvailable for Future
Issuance, OtherThan Securities to
be Issued UponExercise of All
OutstandingOptions, Warrants
and Rights (3)
Equity Compensation Plans Approved by SecurityHolders . . . . . . . . . . . . . . . . . . . . . . . . . . . . . . . . . 16,293,671 $ 34.11 3,894,408
Equity Compensation Plans Not Approved bySecurity Holders . . . . . . . . . . . . . . . . . . . . . . . . . — — —
Total . . . . . . . . . . . . . . . . . . . . . . . . . . . . . . . . . . . . . . . . . 16,293,671 $ 34.11 3,894,408
(1) Does not include 26,735 restricted stock awards that were not fully vested as of December 31, 2010.
(2) The weighted-average exercise price does not take into account the shares issuable upon vesting of out-standing restricted stock awards which have no exercise price.
(3) Includes 3,403,479 available for issuance under the employee stock purchase plans, 372,027 available for futuregrants of stock options and 118,902 available for issuance of restricted stock awards.
ITEM 13 — CERTAIN RELATIONSHIPS AND RELATED TRANSACTIONS, AND DIRECTORINDEPENDENCE
The information required by this item is incorporated by reference to information under the captions “CorporateGovernance” and “Certain Relationships and Related Transactions” in the Company’s definitive Proxy Statementfor its annual meeting of shareholders to be held on May 4, 2011.
ITEM 14 — PRINCIPAL ACCOUNTING FEES AND SERVICES
The information required by this item is incorporated by reference to information under the caption “Relationshipwith Independent Public Accountants” in the Company’s definitive Proxy Statement for its annual meeting ofshareholders to be held on May 4, 2011.
38. |

PART IV
ITEM 15 — EXHIBITS, FINANCIAL STATEMENT SCHEDULES
Page
(a) 1. FINANCIAL STATEMENTS
Reports of Independent Registered Public Accounting Firm . . . . . . . . . . . . . . . . . . . . . F-1 and F-2
Consolidated Balance Sheets as of December 31, 2010 and 2009 . . . . . . . . . . . . . . . . . . . F-3
Consolidated Statements of Earnings for the Years Ended December 31, 2010, 2009and 2008 . . . . . . . . . . . . . . . . . . . . . . . . . . . . . . . . . . . . . . . . . . . . . . . . . . . . . . . . . . . . F-5
Consolidated Statements of Equity and Comprehensive Income for the Years EndedDecember 31, 2010, 2009 and 2008 . . . . . . . . . . . . . . . . . . . . . . . . . . . . . . . . . . . . . . . F-7
Consolidated Statements of Cash Flows for the Years Ended December 31, 2010,2009 and 2008 . . . . . . . . . . . . . . . . . . . . . . . . . . . . . . . . . . . . . . . . . . . . . . . . . . . . . . . . F-9
Notes to Consolidated Financial Statements . . . . . . . . . . . . . . . . . . . . . . . . . . . . . . . . . . . F-11 through F-27
2. FINANCIAL STATEMENT SCHEDULES
Schedules are omitted because of the absence of conditions under which they are required or because therequired information is given in the consolidated financial statements or notes thereto.
| 39.

3. EXECUTIVE COMPENSATION PLANS AND ARRANGEMENTS
The following list is a subset of the list of exhibits described below and contains all compensatory plans, con-tracts or arrangements in which any director or executive officer of the Company is a participant, unless themethod of allocation of benefits thereunder is the same for management and non-management participants:
(1) Form of Employment Agreement executed by the Company’s Chairman and Chief Executive Officer. SeeExhibit 10.23.
(2) Form of Employment Agreement executed by the Company’s President and Chief Operating Officer andcertain of the Company’s executive officers. See Exhibit 10.24.
(3) Form of Employment Agreement executed by the Company’s Chief Financial Officer. See Exhibit 10.25.
(4) The Company’s Amended 1985 Stock Option Plan. See Exhibit 10.4.
(5) Form of Stock Option Agreement used in connection with options granted under the Company’s Amended1985 Stock Option Plan. See Exhibit 10.5.
(6) The Company’s Amended 1993 Directors’ Non-Qualified Stock Option Plan. See Exhibit 10.39.
(7) Form of Stock Option Agreement used in connection with options granted under the Company’s 1993Directors’ Non-Qualified Stock Option Plan. See Exhibit 10.9.
(8) The Company’s Amended 1997 Non-Qualified and Incentive Stock Option Plan. See Exhibit 10.40.
(9) Form of Stock Option Agreement used in connection with Non-Qualified options granted under theCompany’s 1997 Non-Qualified and Incentive Stock Option Plan. See Exhibit 10.30.
(10) Form of Stock Option Agreement used in connection with Incentive options granted under the Company’s1997 Non-Qualified and Incentive Stock Option Plan. See Exhibit 10.31.
(11) The Company’s 2008 Executive Incentive Compensation Plan. See Exhibit 10.35.
(12) The Company’s 2008 Directors’ Restricted Stock Plan. See Exhibit 10.36.
(13) The Company’s 2002 Employee Stock Purchase Plan. See Exhibit 10.42.
(14) The Company’s 2005 Stock Option Plan. See Exhibit 10.45.
(15) Form of Stock Option Agreement used in connection with Incentive options granted under the Company’s2005 Incentive Stock Option Plan. See Exhibit 10.46.
(16) The Company’s 2006 Stock Option Plan. See Exhibit 10.47.
(17) Form of Stock Option Agreement used in connection with Incentive options granted under the Company’s2006 Incentive Stock Option Plan. See Exhibit 10.48.
(18) The Company’s 2007 Stock Option Plan. See Exhibit 10.49.
(19) Form of Stock Option Agreement used in connection with Incentive options granted under the Company’s2007 Incentive Stock Option Plan. See Exhibit 10.50.
(20) The Company’s 2008 Stock Option Plan. See Exhibit 10.51.
(21) Form of Stock Option Agreement used in connection with options granted under the Company’s 2008Stock Option Plan. See Exhibit 10.52.
(22) The Company’s 2009 Stock Option Plan. See Exhibit 10.53.
(23) Form of Stock Option Agreement used in connection with options granted under the Company’s 2009Stock Option Plan. See Exhibit 10.54.
(24) The Company’s 2010 Stock Option Plan. See Exhibit 10.55.
(25) Form of Stock Option Agreement used in connection with options granted under the Company’s 2010Stock Option Plan. See Exhibit 10.56.
40. |

(b) EXHIBITS
ExhibitNumber Exhibit
3.1 The Company’s Restated Articles of Incorporation and the Articles of Amendment thereto datedDecember 9, 1993. (Incorporated by reference to Exhibit 3.1 to Form 10-K, filed on or about March 31, 1995.)
3.1.1 Articles of Amendment to the Restated Articles of Incorporation dated November 12, 1996. (Incorporatedby reference to Exhibit 3.1.1 to Form 10-K, filed on or about March 31, 1997.)
3.1.2 Articles of Amendment to the Restated Articles of Incorporation dated May 20, 1999. (Incorporated byreference to Exhibit 3.1.2 to Form 10-K, filed on or about March 28, 2003.)
3.1.3 Articles of Amendment to the Restated Articles of Incorporation dated June 12, 2002. (Incorporated byreference to Exhibit 3.1.3 to Form 10-K, filed on or about March 28, 2003.)
3.2 The Company’s Amended and Restated Bylaws. (Incorporated by reference to Exhibit 3.2 to Form 8-K,filed on or about November 4, 2010.)
10.4 The Company’s Amended 1985 Stock Option Plan. (Incorporated by reference to Exhibit 10.14 toForm 10-K, filed on or about March 28, 1991.)
10.5 Form of Stock Option Agreement used in connection with options granted under the Company’sAmended 1985 Stock Option Plan. (Incorporated by reference to Exhibit 10.15 to Form 10-K, filed on orabout March 28, 1991.)
10.9 Form of Stock Option Agreement used in connection with options granted under the Company’s 1993Directors’ Non-Qualified Stock Option Plan. (Incorporated by reference to Exhibit 10.9 to Form 10-K, filedon or about March 28, 1994.)
10.23 Form of Employment Agreement executed by the Company’s Chairman and Chief Executive Officer datedDecember 31, 2008. (Incorporated by reference to Exhibit 10.23 to Form 10-K, filed on or about February 27,2009.)
10.24 Form of Employment Agreement executed by the Company’s President and Chief Operating Officer andcertain of the Company’s executive officers dated December 31, 2008. (Incorporated by reference toExhibit 10.24 to Form 10-K, filed on or about February 27, 2009.)
10.25 Form of Employment Agreement executed by the Company’s Chief Financial Officer dated December 31,2008. (Incorporated by reference to Exhibit 10.25 to Form 10-K, filed on or about February 27, 2009.)
10.30 Form of Stock Option Agreement used in connection with Non-Qualified options granted under theCompany’s 1997 Non-Qualified and Incentive Stock Option Plan. (Incorporated by reference toExhibit 10.30 to Form 10-K, filed on or about March 31, 1998.)
10.31 Form of Stock Option Agreement used in connection with Incentive options granted under theCompany’s 1997 Non Qualified and Incentive Stock Option Plan. (Incorporated by reference toExhibit 10.31 to Form 10-K, filed on or about March 31, 1998.)
10.35 The Company’s 2008 Executive Incentive Compensation Plan. (Incorporated by reference to Appendix Cof the Company’s Notice of Annual Meeting of Shareholders and Proxy Statement pursuant to Regulation14A filed on or about March 21, 2008.)
10.36 The Company’s 2008 Directors’ Restricted Stock Plan. (Incorporated by reference to Appendix B of theCompany’s Notice of Annual Meeting of Shareholders and Proxy Statement pursuant to Regulation 14Afiled on or about March 21, 2008.)
| 41.

ExhibitNumber Exhibit
10.39 The Company’s Amended 1993 Directors’ Non-Qualified Stock Option Plan. (Incorporated by reference toAppendix B of the Company’s Notice of Annual Meeting of Shareholders and Proxy Statement pursuantto Regulation 14A filed on or about March 28, 2001.)
10.39.1 Amendment to Amended 1993 Directors’ Non-Qualified Stock Option Plan (Incorporated by reference toExhibit 10.39.1 to Form 10-Q filed on or about August 9, 2007.)
10.40 The Company’s Amended 1997 Non-Qualified and Incentive Stock Option Plan. (Incorporated byreference to Appendix C of the Company’s Notice of Annual Meeting of Shareholders and ProxyStatement pursuant to Regulation 14A filed on or about March 28, 2001.)
10.42 The Company’s 2002 Employee Stock Purchase Plan. (Incorporated by reference to Appendix B of theCompany’s Notice of Annual Meeting of Shareholders and Proxy Statement pursuant to Regulation 14Afiled on or about March 30, 2007.)
10.45 The Company’s 2005 Stock Option Plan. (Incorporated by reference to Appendix A of the Company’sNotice of Annual Meeting of Shareholders and Proxy Statement pursuant to Regulation 14A filed on orabout March 31, 2005.)
10.46 Form of Stock Option Agreement used in connection with Incentive options granted under theCompany’s 2005 Incentive Stock Option Plan. (Incorporated by reference to Exhibit 10.46 to Form 10-Kfiled on or about March 1, 2007.)
10.47 The Company’s 2006 Stock Option Plan. (Incorporated by reference to Appendix A of the Company’sNotice of Annual Meeting of Shareholders and Proxy Statement pursuant to Regulation 14A filed on orabout April 4, 2006.)
10.48 Form of Stock Option Agreement used in connection with Incentive options granted under theCompany’s 2006 Incentive Stock Option Plan. (Incorporated by reference to Exhibit 10.48 to Form 10-Kfiled on or about March 1, 2007.)
10.49 The Company’s 2007 Stock Option Plan. (Incorporated by reference to Appendix A of the Company’sNotice of Annual Meeting of Shareholders and Proxy Statement pursuant to Regulation 14A filed on orabout March 30, 2007.)
10.50 Form of Stock Option Agreement used in connection with Incentive options granted under theCompany’s 2007 Incentive Stock Option Plan. (Incorporated by reference to Exhibit 10.50 to Form 10-Kfiled on or about February 9, 2008.)
10.51 The Company’s 2008 Stock Option Plan. (Incorporated by reference to Appendix A of the Company’sNotice of Annual Meeting of Shareholders and Proxy Statement pursuant to Regulation 14A filed on orabout March 21, 2008.)
10.52 Form of Stock Option Agreement used in connection with options granted under the Company’s 2008Stock Option Plan. (Incorporated by reference to Exhibit 10.52 to Form 10-K filed on or about February 27,2009.)
10.53 The Company’s 2009 Stock Option Plan. (Incorporated by reference to Appendix A of the Company’sNotice of Annual Meeting of Shareholders and Proxy Statement pursuant to Regulation 14A filed on orabout March 20, 2009.)
10.54 Form of Stock Option Agreement used in connection with options granted under the Company’s 2009Stock Option Plan. (Incorporated by reference to Exhibit 10.2 to Form 8-K filed on or about May 11, 2009.)
42. |

ExhibitNumber Exhibit
10.55 The Company’s 2010 Stock Option Plan. (Incorporated by reference to Appendix A of the Company’sNotice of Annual Meeting of Shareholders and Proxy Statement pursuant to Regulation 14A filed on orabout March 19, 2010.)
10.56 Form of Stock Option Agreement used in connection with options granted under the Company’s 2010Stock Option Plan. (Incorporated by reference to Appendix B of the Company’s Notice of AnnualMeeting of Shareholders and Proxy Statement pursuant to Regulation 14A filed on or about March 19,2010.)
21.1 Subsidiaries of the registrant.
23.1 Consent of Independent Registered Public Accounting Firm.
31.1 Certification of Chief Executive Officer pursuant to Section 302 of the Sarbanes-Oxley Act of 2002.
31.2 Certification of Chief Financial Officer pursuant to Section 302 of the Sarbanes-Oxley Act of 2002.
32 Certification pursuant to 18 U.S.C. Section 1350, as adopted pursuant to Section 906 of the Sarbanes-Oxley Act of 2002.
101.INS Instance Document.
101.SCH XBRL Taxonomy Extension Schema Document.
101.CAL XBRL Taxonomy Extension Calculation Linkbase Document.
101.LAB XBRL Taxonomy Extension Label Linkbase Document.
101.PRE XBRL Taxonomy Extension Presentation Linkbase Document.
101.DEF XBRL Taxonomy Extension Definition Linkbase Document.
| 43.

SIGNATURES
Pursuant to the requirements of Section 13 or 15(d) of the Securities Exchange Act of 1934, the registrant has dulycaused this report to be signed on its behalf by the undersigned, thereunto duly authorized.
Date: February 28, 2011
EXPEDITORS INTERNATIONAL OF WASHINGTON, INC.
By: /s/ BRADLEY S. POWELL
Bradley S. PowellChief Financial Officer
44. |

Pursuant to the requirements of the Securities Exchange Act of 1934, this report has been signed below by thefollowing persons on behalf of the registrant and in the capacities indicated on February 28, 2011.
Signature Title
/s/ Peter J. Rose
(Peter J. Rose)
Chairman of the Board and Chief ExecutiveOfficer(Principal Executive Officer) and Director
/s/ R. Jordan Gates
(R. Jordan Gates)
President and Chief Operating Officer andDirector
/s/ James Li Kou Wang
(James Li Kou Wang)
President-Asia Pacific and Director
/s/ Bradley S. Powell
(Bradley S. Powell)
Chief Financial Officer(Principal Financial and Accounting Officer)
/s/ Mark A. Emmert
(Mark A. Emmert)
Director
/s/ Dan P. Kourkoumelis
(Dan P. Kourkoumelis)
Director
/s/ Michael J. Malone
(Michael J. Malone)
Director
/s/ John W. Meisenbach
(John W. Meisenbach)
Director
/s/ Robert R. Wright
(Robert R. Wright)
Director
| 45.

EXPEDITORS INTERNATIONAL OF WASHINGTON, INC.
AND SUBSIDIARIES
CONSOLIDATED FINANCIAL STATEMENTS
COMPRISING ITEM 8
ANNUAL REPORT ON FORM 10-K
TO SECURITIES AND EXCHANGE COMMISSION FOR THE
YEARS ENDED DECEMBER 31, 2010, 2009, AND 2008

Report of Independent Registered Public Accounting Firm
The Board of Directors and ShareholdersExpeditors International of Washington, Inc.:
We have audited the accompanying consolidated balance sheets of Expeditors International of Washington, Inc.and subsidiaries as of December 31, 2010 and 2009, and the related consolidated statements of earnings, equityand comprehensive income, and cash flows for each of the years in the three-year period ended December 31,2010. These consolidated financial statements are the responsibility of the Company’s management. Ourresponsibility is to express an opinion on these consolidated financial statements based on our audits.
We conducted our audits in accordance with the standards of the Public Company Accounting Oversight Board(United States). Those standards require that we plan and perform the audit to obtain reasonable assuranceabout whether the financial statements are free of material misstatement. An audit includes examining, on a testbasis, evidence supporting the amounts and disclosures in the financial statements. An audit also includesassessing the accounting principles used and significant estimates made by management, as well as evaluatingthe overall financial statement presentation. We believe that our audits provide a reasonable basis for our opin-ion.
In our opinion, the consolidated financial statements referred to above present fairly, in all material respects, thefinancial position of Expeditors International of Washington, Inc. and subsidiaries as of December 31, 2010 and2009, and the results of their operations and their cash flows for each of the years in the three-year period endedDecember 31, 2010, in conformity with U.S. generally accepted accounting principles.
We also have audited, in accordance with the standards of the Public Company Accounting Oversight Board(United States), Expeditors International of Washington, Inc.’s internal control over financial reporting as ofDecember 31, 2010, based on criteria established in Internal Control — Integrated Framework issued by theCommittee of Sponsoring Organizations of the Treadway Commission (COSO), and our report dated February 28,2011 expressed an unqualified opinion on the effectiveness of the Company’s internal control over financialreporting.
/s/ KPMG LLP
Seattle, WashingtonFebruary 28, 2011
F-1. |

Report of Independent Registered Public Accounting Firm
The Board of Directors and ShareholdersExpeditors International of Washington, Inc.:
We have audited Expeditors International of Washington, Inc.’s internal control over financial reporting as ofDecember 31, 2010, based on criteria established in Internal Control – Integrated Framework issued by theCommittee of Sponsoring Organizations of the Treadway Commission (COSO). Expeditors International ofWashington, Inc.’s management is responsible for maintaining effective internal control over financial reportingand for its assessment of the effectiveness of internal control over financial reporting, included in the accompany-ing Management Report on Internal Control Over Financial Reporting under Item 9A. Our responsibility is toexpress an opinion on the Company’s internal control over financial reporting based on our audit.
We conducted our audit in accordance with the standards of the Public Company Accounting Oversight Board(United States). Those standards require that we plan and perform the audit to obtain reasonable assuranceabout whether effective internal control over financial reporting was maintained in all material respects. Our auditincluded obtaining an understanding of internal control over financial reporting, assessing the risk that a materialweakness exists, and testing and evaluating the design and operating effectiveness of internal control based onthe assessed risk. Our audit also included performing such other procedures as we considered necessary in thecircumstances. We believe that our audit provides a reasonable basis for our opinion.
A company’s internal control over financial reporting is a process designed to provide reasonable assuranceregarding the reliability of financial reporting and the preparation of financial statements for external purposes inaccordance with generally accepted accounting principles. A company’s internal control over financial reportingincludes those policies and procedures that (1) pertain to the maintenance of records that, in reasonable detail,accurately and fairly reflect the transactions and dispositions of the assets of the company; (2) provide reasonableassurance that transactions are recorded as necessary to permit preparation of financial statements in accord-ance with generally accepted accounting principles, and that receipts and expenditures of the company are beingmade only in accordance with authorizations of management and directors of the company; and (3) provide rea-sonable assurance regarding prevention or timely detection of unauthorized acquisition, use, or disposition of thecompany’s assets that could have a material effect on the financial statements.
Because of its inherent limitations, internal control over financial reporting may not prevent or detect misstate-ments. Also, projections of any evaluation of effectiveness to future periods are subject to the risk that controlsmay become inadequate because of changes in conditions, or that the degree of compliance with the policies orprocedures may deteriorate.
In our opinion, Expeditors International of Washington, Inc. maintained, in all material respects, effective internalcontrol over financial reporting as of December 31, 2010, based on criteria established in Internal Control –Integrated Framework issued by the Committee of Sponsoring Organizations of the Treadway Commission.
We also have audited, in accordance with the standards of the Public Company Accounting Oversight Board(United States), the consolidated balance sheets of Expeditors International of Washington, Inc. and subsidiariesas of December 31, 2010 and 2009, and the related consolidated statements of earnings, equity and comprehensiveincome, and cash flows for each of the years in the three-year period ended December 31, 2010 and our reportdated February 28, 2011 expressed an unqualified opinion on those consolidated financial statements.
/s/ KPMG LLP
Seattle, WashingtonFebruary 28, 2011
| F-2.

Consolidated Balance Sheets
In thousands except share data
December 31, 2010 2009
Current Assets:
Cash and cash equivalents . . . . . . . . . . . . . . . . . . . . . . . . . . . . . . . . . . . . . . . . . . . . . . . . . . . $ 1,084,465 925,929
Short-term investments . . . . . . . . . . . . . . . . . . . . . . . . . . . . . . . . . . . . . . . . . . . . . . . . . . . . . 524 655
Accounts receivable, less allowance for doubtful
accounts of $14,636 in 2010 and $14,235 in 2009 . . . . . . . . . . . . . . . . . . . . . . . . . . . . . . . 1,003,884 810,369
Deferred Federal and state income taxes . . . . . . . . . . . . . . . . . . . . . . . . . . . . . . . . . . . . . . . 8,706 8,338
Other . . . . . . . . . . . . . . . . . . . . . . . . . . . . . . . . . . . . . . . . . . . . . . . . . . . . . . . . . . . . . . . . . . . . . 42,776 42,539
Total current assets . . . . . . . . . . . . . . . . . . . . . . . . . . . . . . . . . . . . . . . . . . . . . . . . . . 2,140,355 1,787,830
Property and Equipment:
Land . . . . . . . . . . . . . . . . . . . . . . . . . . . . . . . . . . . . . . . . . . . . . . . . . . . . . . . . . . . . . . . . . . . . . . 163,291 165,528
Buildings and leasehold improvements . . . . . . . . . . . . . . . . . . . . . . . . . . . . . . . . . . . . . . . . 372,788 372,470
Furniture, fixtures, equipment and purchased software . . . . . . . . . . . . . . . . . . . . . . . . . . 215,054 205,817
Construction in progress . . . . . . . . . . . . . . . . . . . . . . . . . . . . . . . . . . . . . . . . . . . . . . . . . . . . 29,166 16,258
Property and equipment, at cost . . . . . . . . . . . . . . . . . . . . . . . . . . . . . . . . . . . . . . . . 780,299 760,073
Less: accumulated depreciation and amortization . . . . . . . . . . . . . . . . . . . . . . . . . . . . . . . 281,651 264,372
Property and equipment, net . . . . . . . . . . . . . . . . . . . . . . . . . . . . . . . . . . . . . . . . . . . . . . . . . 498,648 495,701
Goodwill, net . . . . . . . . . . . . . . . . . . . . . . . . . . . . . . . . . . . . . . . . . . . . . . . . . . . . . . . . . . . . . . . 7,927 7,927
Other intangibles, less accumulated amortization of $18,921 in 2010 and $17,143 in
2009 . . . . . . . . . . . . . . . . . . . . . . . . . . . . . . . . . . . . . . . . . . . . . . . . . . . . . . . . . . . . . . . . . . . . 3,716 4,938
Other assets, net . . . . . . . . . . . . . . . . . . . . . . . . . . . . . . . . . . . . . . . . . . . . . . . . . . . . . . . . . . . 28,533 27,326
Total assets . . . . . . . . . . . . . . . . . . . . . . . . . . . . . . . . . . . . . . . . . . . . . . . . . . . . . . $ 2,679,179 2,323,722
F-3. |

December 31, 2010 2009
Current Liabilities:
Accounts payable . . . . . . . . . . . . . . . . . . . . . . . . . . . . . . . . . . . . . . . . . . . . . . . . . . . . . . . . . . $ 652,161 546,675
Accrued expenses, primarily salaries and related costs . . . . . . . . . . . . . . . . . . . . . . . . . . 177,869 145,545
Federal, state, and foreign income taxes . . . . . . . . . . . . . . . . . . . . . . . . . . . . . . . . . . . . . . . 31,948 16,166
Total current liabilities . . . . . . . . . . . . . . . . . . . . . . . . . . . . . . . . . . . . . . . . . . . . . 861,978 708,386
Deferred Federal and state income taxes . . . . . . . . . . . . . . . . . . . . . . . . . . . . . . . . . . . . . . . 69,047 53,989
Commitments and contingencies
Shareholders’ Equity:
Preferred stock, par value $.01 per share
Authorized 2,000,000 shares; none issued . . . . . . . . . . . . . . . . . . . . . . . . . . . . . . . . . . . — —
Common stock, par value $.01 per share
Authorized 320,000,000 shares;
issued and outstanding 212,047,774 shares at
December 31, 2010 and 212,025,494 shares at
December 31, 2009 . . . . . . . . . . . . . . . . . . . . . . . . . . . . . . . . . . . . . . . . . . . . . . . . . . . . . . . 2,120 2,120
Additional paid-in capital . . . . . . . . . . . . . . . . . . . . . . . . . . . . . . . . . . . . . . . . . . . . . . . . . . . . 13,412 18,265
Retained earnings . . . . . . . . . . . . . . . . . . . . . . . . . . . . . . . . . . . . . . . . . . . . . . . . . . . . . . . . . . 1,717,249 1,532,018
Accumulated other comprehensive income . . . . . . . . . . . . . . . . . . . . . . . . . . . . . . . . . . . . 8,125 604
Total shareholders’ equity . . . . . . . . . . . . . . . . . . . . . . . . . . . . . . . . . . . . . . . . . . . . . . . . 1,740,906 1,553,007
Noncontrolling interest . . . . . . . . . . . . . . . . . . . . . . . . . . . . . . . . . . . . . . . . . . . . . . . . . . . . . . 7,248 8,340
Total equity . . . . . . . . . . . . . . . . . . . . . . . . . . . . . . . . . . . . . . . . . . . . . . . . . . . . . . . . . . . . . 1,748,154 1,561,347
Total liabilities and equity . . . . . . . . . . . . . . . . . . . . . . . . . . . . . . . . . . . . . . . . . . . . . $ 2,679,179 2,323,722
See accompanying notes to consolidated financial statements.
| F-4.

Consolidated Statements of Earnings
In thousands except share data
Years ended December 31, 2010 2009 2008
Revenues:
Airfreight services . . . . . . . . . . . . . . . . . . . . . . . . . . . . . . . . . . . . . . . . . . . . . . . $ 2,821,828 1,831,317 2,541,377
Ocean freight and ocean services . . . . . . . . . . . . . . . . . . . . . . . . . . . . . . . . . . 1,955,400 1,297,685 1,990,983
Customs brokerage and other services . . . . . . . . . . . . . . . . . . . . . . . . . . . . . 1,190,345 963,281 1,101,518
Total revenues . . . . . . . . . . . . . . . . . . . . . . . . . . . . . . . . . . . . . . . . . . . . . . . 5,967,573 4,092,283 5,633,878
Operating Expenses:
Airfreight consolidation . . . . . . . . . . . . . . . . . . . . . . . . . . . . . . . . . . . . . . . . . . 2,181,598 1,341,842 1,962,621
Ocean freight consolidation . . . . . . . . . . . . . . . . . . . . . . . . . . . . . . . . . . . . . . 1,569,877 973,462 1,596,346
Customs brokerage and other services . . . . . . . . . . . . . . . . . . . . . . . . . . . . . 523,312 394,193 471,650
Salaries and related costs . . . . . . . . . . . . . . . . . . . . . . . . . . . . . . . . . . . . . . . . 894,132 774,214 863,846
Rent and occupancy costs . . . . . . . . . . . . . . . . . . . . . . . . . . . . . . . . . . . . . . . . 77,209 74,324 76,984
Depreciation and amortization . . . . . . . . . . . . . . . . . . . . . . . . . . . . . . . . . . . . 36,900 40,035 40,003
Selling and promotion . . . . . . . . . . . . . . . . . . . . . . . . . . . . . . . . . . . . . . . . . . . 32,055 26,295 37,778
Other . . . . . . . . . . . . . . . . . . . . . . . . . . . . . . . . . . . . . . . . . . . . . . . . . . . . . . . . . . 105,260 82,917 111,514
Total operating expenses . . . . . . . . . . . . . . . . . . . . . . . . . . . . . . . . . . . . . 5,420,343 3,707,282 5,160,742
Operating income . . . . . . . . . . . . . . . . . . . . . . . . . . . . . . . . . . . . . . . . . . . . 547,230 385,001 473,136
F-5. |

Years ended December 31, 2010 2009 2008
Other Income (Expense):
Interest income . . . . . . . . . . . . . . . . . . . . . . . . . . . . . . . . . . . . . . . . . . . . 7,002 10,177 21,077
Interest expense . . . . . . . . . . . . . . . . . . . . . . . . . . . . . . . . . . . . . . . . . . . (576) (499) (183)
Other, net . . . . . . . . . . . . . . . . . . . . . . . . . . . . . . . . . . . . . . . . . . . . . . . . . 10,412 8,193 5,542
Other income, net . . . . . . . . . . . . . . . . . . . . . . . . . . . . . . . . . . . . . . . 16,838 17,871 26,436
Earnings before income taxes . . . . . . . . . . . . . . . . . . . . . . . . . . . . . . . 564,068 402,872 499,572
Income tax expense . . . . . . . . . . . . . . . . . . . . . . . . . . . . . . . . . . . . . . . . 219,863 162,475 196,593
Net earnings . . . . . . . . . . . . . . . . . . . . . . . . . . . . . . . . . . . . . . . . . . . 344,205 240,397 302,979
Less: net earnings attributable to the noncontrolling interest . . . . 33 180 1,965
Net earnings attributable to shareholders . . . . . . . . . . . . . . . . . . $ 344,172 240,217 301,014
Diluted earnings attributable to shareholders per share . . . . . . . . . $ 1.59 1.11 1.37
Basic earnings attributable to shareholders per share . . . . . . . . . . . $ 1.62 1.13 1.41
Weighted average diluted shares outstanding . . . . . . . . . . . . . . . . . 216,446,656 216,533,240 219,170,003
Weighted average basic shares outstanding . . . . . . . . . . . . . . . . . . . 212,283,966 212,112,744 212,755,946
See accompanying notes to consolidated financial statements.
| F-6.

Consolidated Statements of Equity and Comprehensive Income
In thousands except share dataYears ended December 31, 2010, 2009 and 2008
Common stock
Shares Par Value
Balance at December 31, 2007 . . . . . . . . . . . . . . . . . . . . . . . . . . . . . . . . . . . . . . . . . . . . . . . . . 212,996,776 $2,130Exercise of stock options . . . . . . . . . . . . . . . . . . . . . . . . . . . . . . . . . . . . . . . . . . . . . . . . . . . . 2,140,819 22Issuance of shares under stock purchase plan . . . . . . . . . . . . . . . . . . . . . . . . . . . . . . . . . . 732,719 7Shares repurchased under provisions of stock repurchase plans . . . . . . . . . . . . . . . . . . (3,896,937) (39)Stock compensation expense . . . . . . . . . . . . . . . . . . . . . . . . . . . . . . . . . . . . . . . . . . . . . . . . . — —Tax benefits from stock plans . . . . . . . . . . . . . . . . . . . . . . . . . . . . . . . . . . . . . . . . . . . . . . . . — —Comprehensive income
Net earnings . . . . . . . . . . . . . . . . . . . . . . . . . . . . . . . . . . . . . . . . . . . . . . . . . . . . . . . . . — —Foreign currency translation adjustments, net of tax of $25,018 . . . . . . . . . . . . . . — —
Total comprehensive income . . . . . . . . . . . . . . . . . . . . . . . . . . . . . . . . . . . . . . . . . . . . . . . . . — —
Dividends paid ($.32 per share) . . . . . . . . . . . . . . . . . . . . . . . . . . . . . . . . . . . . . . . . . . . . . . . — —
Distributions or declaration of dividends to noncontrolling interest . . . . . . . . . . . . . . . . — —
Balance at December 31, 2008 . . . . . . . . . . . . . . . . . . . . . . . . . . . . . . . . . . . . . . . . . . . . . . . . . 211,973,377 $2,120Exercise of stock options and release of restricted shares . . . . . . . . . . . . . . . . . . . . . . . . 2,068,603 20Issuance of shares under stock purchase plan . . . . . . . . . . . . . . . . . . . . . . . . . . . . . . . . . . 714,799 7Shares repurchased under provisions of stock repurchase plans . . . . . . . . . . . . . . . . . . (2,731,285) (27)Stock compensation expense . . . . . . . . . . . . . . . . . . . . . . . . . . . . . . . . . . . . . . . . . . . . . . . . . — —Tax benefits from stock plans . . . . . . . . . . . . . . . . . . . . . . . . . . . . . . . . . . . . . . . . . . . . . . . . — —Purchase of noncontrolling interest . . . . . . . . . . . . . . . . . . . . . . . . . . . . . . . . . . . . . . . . . . . — —Comprehensive income
Net earnings . . . . . . . . . . . . . . . . . . . . . . . . . . . . . . . . . . . . . . . . . . . . . . . . . . . . . . . . . — —Foreign currency translation adjustments, net of tax of $8,672 . . . . . . . . . . . . . . . — —
Total comprehensive income . . . . . . . . . . . . . . . . . . . . . . . . . . . . . . . . . . . . . . . . . . . . . . . . . — —
Dividends paid ($.38 per share) . . . . . . . . . . . . . . . . . . . . . . . . . . . . . . . . . . . . . . . . . . . . . . . — —Distributions or declaration of dividends to noncontrolling interest . . . . . . . . . . . . . . . . — —
Balance at December 31, 2009 . . . . . . . . . . . . . . . . . . . . . . . . . . . . . . . . . . . . . . . . . . . . . . . . . 212,025,494 2,120Exercise of stock options and release of restricted shares . . . . . . . . . . . . . . . . . . . . . . . . 4,781,971 48Issuance of shares under stock purchase plan . . . . . . . . . . . . . . . . . . . . . . . . . . . . . . . . . . 694,329 7Shares repurchased under provisions of stock repurchase plans . . . . . . . . . . . . . . . . . . (5,454,020) (55)Stock compensation expense . . . . . . . . . . . . . . . . . . . . . . . . . . . . . . . . . . . . . . . . . . . . . . . . . — —Tax benefits from stock plans . . . . . . . . . . . . . . . . . . . . . . . . . . . . . . . . . . . . . . . . . . . . . . . . — —Comprehensive income
Net earnings . . . . . . . . . . . . . . . . . . . . . . . . . . . . . . . . . . . . . . . . . . . . . . . . . . . . . . . . . — —Foreign currency translation adjustments, net of tax of $4,122 . . . . . . . . . . . . . . . — —
Total comprehensive income . . . . . . . . . . . . . . . . . . . . . . . . . . . . . . . . . . . . . . . . . . . . . . . . . — —
Dividends paid ($.40 per share) . . . . . . . . . . . . . . . . . . . . . . . . . . . . . . . . . . . . . . . . . . . . . . . — —Distributions or declaration of dividends to noncontrolling interest . . . . . . . . . . . . . . . . — —
Balance at December 31, 2010 . . . . . . . . . . . . . . . . . . . . . . . . . . . . . . . . . . . . . . . . . . . . . . . . . 212,047,774 2,120
F-7. |

Additionalpaid-incapital
Retainedearnings
Accumulated othercomprehensive
income (loss)
Totalshareholders’
equityNoncontrolling
interestTotal
equity
50,006 1,143,464 30,971 1,226,571 16,748 1,243,31929,322 — — 29,344 — 29,34422,109 — — 22,116 — 22,116
(150,120) (4,019) — (154,178) — (154,178)44,879 — — 44,879 — 44,87910,954 — — 10,954 — 10,954
— 301,014 — 301,014 1,965 302,979— — (46,179) (46,179) (336) (46,515)
— — — 254,835 1,629 256,464
— (68,103) — (68,103) — (68,103)
— — — — (879) (879)
7,150 1,372,356 (15,208) 1,366,418 17,498 1,383,91626,393 — — 26,413 — 26,41320,505 — — 20,512 — 20,512
(84,482) — — (84,509) — (84,509)39,135 — — 39,135 — 39,1355,726 — — 5,726 — 5,7263,838 — — 3,838 (4,306) (468)
— 240,217 — 240,217 180 240,397— — 15,812 15,812 (634) 15,178
— — — 256,029 (454) 255,575
— (80,555) — (80,555) — (80,555)— — — — (4,398) (4,398)
18,265 1,532,018 604 1,553,007 8,340 1,561,34779,186 — — 79,234 — 79,23420,543 — — 20,550 — 20,550
(172,188) (74,069) — (246,312) — (246,312)43,743 — — 43,743 — 43,74323,863 — — 23,863 — 23,863
— 344,172 — 344,172 33 344,205— — 7,521 7,521 (74) 7,447
— — — 351,693 (41) 351,652
— (84,872) — (84,872) — (84,872)— — — — (1,051) (1,051)
13,412 1,717,249 8,125 1,740,906 7,248 1,748,154
| F-8.
Seeaccompanyingnotes toconsolidatedfinancialstatements.

Consolidated Statements of Cash Flows
In thousands
Years ended December 31, 2010 2009 2008
Operating Activities:
Net earnings . . . . . . . . . . . . . . . . . . . . . . . . . . . . . . . . . . . . . . . . . . . . . . . . . . . . . . . . $ 344,205 240,397 302,979Adjustments to reconcile net earnings to net cash provided by operating
activities:
Provision for losses on accounts receivable . . . . . . . . . . . . . . . . . . . . . . . . . . 3,414 804 1,976
Deferred income tax expense (benefit) . . . . . . . . . . . . . . . . . . . . . . . . . . . . . . . 10,569 (1,609) 16,350
Excess tax benefits from stock plans . . . . . . . . . . . . . . . . . . . . . . . . . . . . . . . . (23,863) (5,726) (10,954)
Stock compensation expense . . . . . . . . . . . . . . . . . . . . . . . . . . . . . . . . . . . . . . 43,743 39,135 44,879
Depreciation and amortization . . . . . . . . . . . . . . . . . . . . . . . . . . . . . . . . . . . . . 36,900 40,035 40,003
Gain on sale of assets . . . . . . . . . . . . . . . . . . . . . . . . . . . . . . . . . . . . . . . . . . . . . (321) (42) (699)
Amortization of other intangible assets . . . . . . . . . . . . . . . . . . . . . . . . . . . . . . 1,413 1,520 1,618
Changes in operating assets and liabilities: . . . . . . . . . . . . . . . . . . . . . . . . . .
(Increase) decrease in accounts receivable . . . . . . . . . . . . . . . . . . . . . . . (188,823) (1,077) 85,841
Increase (decrease) in accounts payable and accrued expenses . . . . . 130,138 29,910 (66,470)
Decrease (increase) in income taxes payable, net . . . . . . . . . . . . . . . . . . 39,495 (12,706) (5,552)
(Increase) decrease in other current assets . . . . . . . . . . . . . . . . . . . . . . . (1,352) 159 (1,005)
Net cash provided by operating activities . . . . . . . . . . . . . . . . . . . . . . . . . . . . . . . . 395,518 330,800 408,966
F-9. |

2010 2009 2008
Investing Activities:
Decrease (increase) in short-term investments . . . . . . . . . . . . . . . . . . . . . . . 188 26 (72)Purchase of property and equipment . . . . . . . . . . . . . . . . . . . . . . . . . . . . . . . . (42,408) (34,700) (59,726)Proceeds from sale of property and equipment . . . . . . . . . . . . . . . . . . . . . . . . 360 276 369Prepayment on long-term land lease, net . . . . . . . . . . . . . . . . . . . . . . . . . . . . . 0 (5,049) 0Other . . . . . . . . . . . . . . . . . . . . . . . . . . . . . . . . . . . . . . . . . . . . . . . . . . . . . . . . . . . (319) (1,901) 204
Net cash used in investing activities . . . . . . . . . . . . . . . . . . . . . . . . . . . . . . . . . (42,179) (41,348) (59,225)
Financing Activities:
Proceeds from issuance of common stock . . . . . . . . . . . . . . . . . . . . . . . . . . . 99,784 46,925 51,460Repurchases of common stock . . . . . . . . . . . . . . . . . . . . . . . . . . . . . . . . . . . . . (246,312) (84,509) (154,178)Excess tax benefits from stock plans . . . . . . . . . . . . . . . . . . . . . . . . . . . . . . . . . 23,863 5,726 10,954Dividends paid . . . . . . . . . . . . . . . . . . . . . . . . . . . . . . . . . . . . . . . . . . . . . . . . . . . (84,872) (80,555) (68,103)Distributions to noncontrolling interest . . . . . . . . . . . . . . . . . . . . . . . . . . . . . . (1,051) (1,084) (879)Purchase of noncontrolling interest . . . . . . . . . . . . . . . . . . . . . . . . . . . . . . . . . 0 (3,851) 0
Net cash used in financing activities . . . . . . . . . . . . . . . . . . . . . . . . . . . . . . . . . (208,588) (117,348) (160,746)
Effect of exchange rate changes on cash and cash equivalents . . . . . . . . . . 13,785 12,797 (22,566)
Increase in cash and cash equivalents . . . . . . . . . . . . . . . . . . . . . . . . . . . . . . . 158,536 184,901 166,429Cash and cash equivalents at beginning of year . . . . . . . . . . . . . . . . . . . . . . . 925,929 741,028 574,599
Cash and cash equivalents at end of year . . . . . . . . . . . . . . . . . . . . . . . . . . . . $ 1,084,465 925,929 741,028
Interest and Taxes Paid:
Interest . . . . . . . . . . . . . . . . . . . . . . . . . . . . . . . . . . . . . . . . . . . . . . . . . . . . . . . . . . $ 110 497 173Income taxes . . . . . . . . . . . . . . . . . . . . . . . . . . . . . . . . . . . . . . . . . . . . . . . . . . . . . 171,618 158,745 172,146
See accompanying notes to consolidated financial statements.
| F-10.

NOTES TO CONSOLIDATED FINANCIAL STATEMENTS
NOTE 1. SUMMARY OF SIGNIFICANT ACCOUNTING POLICIES
A. | Basis of Presentation
Expeditors International of Washington, Inc. (“the Company”) is a non-asset based provider of global logisticsservices operating through a worldwide network of offices, international service centers and exclusive ornon-exclusive agents. The Company’s customers include retailing and wholesaling, electronics, and manufactur-ing companies around the world.
International trade is influenced by many factors, including economic and political conditions in the UnitedStates and abroad, currency exchange rates, and laws and policies relating to tariffs, trade restrictions, foreigninvestments and taxation. Periodically, governments consider a variety of changes to current tariffs and traderestrictions. The Company cannot predict which, if any, of these proposals may be adopted, nor can the Companypredict the effects adoption of any such proposal will have on the Company’s business. Doing business in foreignlocations also subjects the Company to a variety of risks and considerations not normally encountered by domes-tic enterprises. In addition to being influenced by governmental policies concerning international trade, theCompany’s business may also be affected by political developments and changes in government personnel orpolicies as well as economic turbulence or security concerns in the nations in which it does business.
The consolidated financial statements have been prepared pursuant to the rules and regulations of theSecurities and Exchange Commission in accordance with accounting principles generally accepted in the UnitedStates (U.S. GAAP). The consolidated financial statements include the accounts of the Company and its sub-sidiaries stated in U.S. dollars, the Company’s reporting currency. In addition, the consolidated financial state-ments also include the accounts of operating entities where the Company maintains a parent-subsidiaryrelationship through unilateral control over assets and operations together with responsibility for payment of allliabilities, notwithstanding a lack of technical majority ownership of the subsidiary common stock. Certain 2009and 2008 amounts have been reclassified to conform with the 2010 presentation. All dollar amounts in the notesare presented in thousands except for share data.
All significant intercompany accounts and transactions have been eliminated in consolidation.
B. | Cash Equivalents
All highly liquid investments with a maturity of three months or less at date of purchase are considered to be cashequivalents.
C. | Short-term Investments
Short-term investments have a maturity date of greater than three months at date of purchase and are designatedas available-for-sale. Cost approximates market at December 31, 2010 and 2009.
D. | Accounts Receivable
The Company maintains an allowance for doubtful accounts, which is reviewed at least monthly for estimatedlosses resulting from the inability of its customers to make required payments for services andadvances. Additional allowances may be necessary in the future if the ability of its customers to pay deteriorates.The Company has recorded an allowance for doubtful accounts in the amounts of $14,636, $14,235 and $14,414 asof December 31, 2010, 2009 and 2008, respectively. Additions and write-offs have not been significant in any ofthese years.
F-11. |

E. | Long-Lived Assets, Depreciation and Amortization
Property and equipment are recorded at cost and are depreciated or amortized on the straight-line method overthe shorter of the assets’ estimated useful lives or lease terms. Useful lives for major categories of property andequipment are as follows:
Land Improvements . . . . . . . . . . . . . . . . . . . . . . . . . . . . . . . . . . . . . . . . . . . . . . . . . . . . . . . . . . . . . . . . . . . . 50 yearsBuildings . . . . . . . . . . . . . . . . . . . . . . . . . . . . . . . . . . . . . . . . . . . . . . . . . . . . . . . . . . . . . . . . . . . . . . . . . . . . . 28 to 40 yearsFurniture, fixtures, equipment and purchased software . . . . . . . . . . . . . . . . . . . . . . . . . . . . . . . . . . . . . . 3 to 5 years
Expenditures for maintenance, repairs, and replacements of minor items are charged to earnings asincurred. Major upgrades and improvements that extend the life of the asset are capitalized. Upon disposition, thecost and related accumulated depreciation are removed from the accounts and the resulting gain or loss isincluded in income for the period.
For the years ended December 31, 2010 and 2009, the Company performed the required goodwill annualimpairment test during the fourth quarter and determined that no impairment had occurred.
Other intangibles consist principally of payments made to purchase customer lists of agents in countrieswhere the Company established its own presence by opening offices. Other intangibles assets are amortized overtheir estimated useful lives for periods up to 15 years and are reviewed for impairment if an event or circumstanceindicates that an impairment loss may be been incurred. The estimated annual amortization expense for each ofthe next five years is not significant.
F. | Revenues and Revenue Recognition
The Company derives its revenues from three principal sources: 1) airfreight services, 2) ocean freight and oceanservices, and 3) customs brokerage and other services. These are the revenue categories presented in the finan-cial statements.
As a non-asset based carrier, the Company does not own transportation assets. Rather, the Companygenerates the major portion of its air and ocean freight revenues by purchasing transportation services fromdirect (asset-based) carriers and reselling those services to its customers. The difference between the rate billedto customers (the sell rate), and the rate paid to the carrier (the buy rate) is termed “net revenue” or “yield”. Byconsolidating shipments from multiple customers and concentrating its buying power, the Company is able tonegotiate favorable buy rates from the direct carriers, while at the same time offering lower sell rates thancustomers would otherwise be able to negotiate themselves.
Airfreight services revenues include the charges to the Company for carrying the shipments when theCompany acts as a freight consolidator. Ocean freight services revenues include the charges to the Company forcarrying the shipments when the Company acts as a Non-Vessel Operating Common Carrier (NVOCC). In eachcase the Company is acting as an indirect carrier. When acting as an indirect carrier, the Company will issue aHouse Airway Bill (HAWB) or a House Ocean Bill of Lading (HOBL) to customers as the contract of carriage. Inturn, when the freight is physically tendered to a direct carrier, the Company receives a contract of carriage knownas a Master Airway Bill for airfreight shipments and a Master Ocean Bill of Lading for ocean shipments. At thispoint, the risk of loss passes to the carrier, however, in order to claim for any such loss, the customer is first obli-gated to pay the freight charges.
Based upon the terms in the contract of carriage, revenues related to shipments where the Companyissues an HAWB or an HOBL are recognized at the time the freight is tendered to the direct carrier at ori-gin. Costs related to the shipments are also recognized at this same time.
Revenues realized in other capacities, for instance, when the Company acts as an agent for the shipper,and does not issue an HAWB or an HOBL, include only the commissions and fees earned for the services per-formed. These revenues are recognized upon completion of the services.
| F-12.

Customs brokerage and other services involves providing services at destination, such as helping custom-ers clear shipments through customs by preparing required documentation, calculating and providing for pay-ment of duties and other taxes on behalf of the customers as well as arranging for any required inspections bygovernmental agencies, and arranging for delivery. This is a complicated function requiring technical knowledgeof customs rules and regulations in the multitude of countries in which the Company has offices. Revenuesrelated to customs brokerage and other services are recognized upon completion of the services. Arranginginternational shipments is a complex task. Each actual movement can require multiple services. In someinstances, the Company is asked to perform only one of these services. However, in most instances, the Companymay perform multiple services. These services include destination breakbulk services and value added ancillaryservices such as local transportation, export customs formalities, distribution services and logistics manage-ment. Each of these services has an associated fee which is recognized as revenue upon completion of the serv-ice.
Typically, the fees for each of these services are quoted as separate components, however, customers onoccasion will request an all-inclusive rate for a set of services known in the industry as “door-to-doorservice.” This means that the customer is billed a single rate for all services from pickup at origin to delivery atdestination. In these instances, the revenue for origin and destination services, as well as revenue that will becharacterized as freight charges, is allocated to branches as set by preexisting Company policy perhaps supple-mented by customer specific negotiations between the offices involved. Each of the Company’s branches areseparate profit centers and the primary compensation for the branch management group comes in the form ofincentive-based compensation calculated directly from the operating income of that branch. This compensationstructure ensures that the allocation of revenue and expense among components of services, when providedunder an all-inclusive rate, is done in an objective manner on a relative selling price basis.
The Company presents revenues net of sales and value-added taxes.
G. | Income Taxes
Income taxes are accounted for under the asset and liability method of accounting. Under this method, deferredtax assets and liabilities are recognized for the future tax consequences attributed to differences between thefinancial statement carrying amounts of existing assets and liabilities and their respective tax bases, the tax effectof loss carryforwards and tax credit carryforwards. Deferred tax assets and liabilities are measured using enactedtax rates expected to apply to taxable income in the years in which those temporary differences are expected to berecovered or settled. The effect on deferred tax assets and liabilities of a change in tax rates is recognized inincome in the period that includes the enactment date. A valuation allowance is established when necessary toreduce deferred tax assets to amounts expected to be realized. The Company recognizes interest expense relatedto unrecognized tax benefits or underpayment of income taxes in interest expense and recognizes penalties inoperating expenses.
H. | Net Earnings Attributable to Shareholders per Common Share
Diluted earnings attributable to shareholders per share is computed using the weighted average number ofcommon shares and dilutive potential common shares outstanding. Dilutive potential common shares representoutstanding stock options and stock purchase rights. Basic earnings attributable to shareholders per share iscalculated using the weighted average number of common shares outstanding without taking into considerationdilutive potential common shares outstanding.
I. | Stock Plans
The Company recognizes stock compensation expense based on an estimate of the fair value of awards grantedto employees and directors under the Company’s stock option, director restricted stock and employee stockpurchase rights plans. This expense, adjusted for expected forfeitures, is recognized on a straight-line basis overthe stock awards vesting periods.
F-13. |

J. | Foreign Currency
Foreign currency amounts attributable to foreign operations have been translated into U.S. dollars using year-endexchange rates for assets and liabilities, historical rates for equity, and weighted average rates for revenues andexpenses. Translation adjustments resulting from this process are recorded as components of other compre-hensive income. Currency fluctuations are a normal operating factor in the conduct of the Company’s businessand exchange transaction gains and losses are included in revenues and operating expenses. Also, the Companyis exposed to foreign currency exchange fluctuations on monetary assets and liabilities denominated in curren-cies that are not the local functional currency. Foreign exchange gains and losses on such balances are recog-nized in net earnings as other income.
The Company follows a policy of accelerating international currency settlements to manage its foreignexchange exposure. Accordingly, the Company enters into foreign currency hedging transactions only in limitedlocations where there are regulatory or commercial limitations on the Company’s ability to move money freelyaround the world. Such hedging activity during 2010, 2009, and 2008 was insignificant. Net foreign currency gainsin 2010 and 2009 were $2,026 and $1,418, respectively. Net foreign currency losses in 2008 were $191. The Companyhad no foreign currency derivatives outstanding at December 31, 2010 and 2009.
K. | Comprehensive Income
Comprehensive income consists of net earnings and other gains and losses affecting equity that, under U.S.GAAP, are excluded from net earnings. For the Company, these consist of foreign currency translation gains andlosses, net of related income tax effects and comprehensive income or loss attributable to noncontrolling interest.
Accumulated other comprehensive income consisted entirely of foreign currency translation adjustments,net of related income tax effects, as of December 31, 2010 and 2009.
L. | Segment Reporting
The Company is organized functionally in geographic operating segments. Accordingly, management focuses itsattention on revenues, net revenues, operating income, identifiable assets, capital expenditures, depreciation andamortization and equity generated in each of these geographical areas when evaluating effectiveness of geo-graphic management. The Company charges its subsidiaries and affiliates for services rendered in the UnitedStates on a cost recovery basis. Transactions among the Company’s various offices are conducted using thesame arms-length pricing methodologies the Company uses when its offices transact business with independentagents.
M. | Use of Estimates
The preparation of financial statements in conformity with U.S. GAAP requires management to make estimatesand assumptions that affect the reported amounts of the assets and liabilities and disclosure of contingent assetsand liabilities at the date of the financial statements and the reported amounts of revenues and expenses duringthe period. The Company uses estimates primarily in the following areas: accounts receivable valuation, accrualof costs related to ancillary services the Company provides, accrual of insurance liabilities for the portion of thefreight related exposure which the Company has self-insured, accrual of various tax liabilities, accrual of losscontingencies and calculation of share-based compensation expense. Actual results could differ from thoseestimates.
N. | Recent Accounting Pronouncements
In October 2009, the Financial Accounting Standards Board issued Accounting Standards Update (ASU) 2009–No. 13 “Multiple-Deliverable Revenue Arrangements”, which amends Accounting Standards Codification Topic
| F-14.

605 –“Revenue Recognition”. This update provides amendments to the criteria for separating deliverables, measur-ing and allocating arrangement consideration to one or more units of accounting. This update establishes a sell-ing price hierarchy for determining the selling price of a deliverable. ASU 2009–No. 13 is effective for revenuearrangements entered into or materially modified in fiscal years beginning on or after June 15, 2010. The Companyis required to and plans to adopt the provisions of this update beginning in the first quarter of 2011. The Companyhas assessed the impact of the adoption of ASU 2009–No. 13 it is not expecting this update will have a materialeffect on the Company’s results of operations.
NOTE 2. SHAREHOLDERS’ EQUITY
A. | Stock Repurchase Plans
The Company has a Non-Discretionary Stock Repurchase Plan, originally approved by the Board of Directors inNovember 1993, under which management is authorized to repurchase up to 40,000,000 shares of the Company’scommon stock in the open market with the proceeds received from the exercise of employee and director stockoptions.
In November 2001, the Board of Directors expanded the Company’s Discretionary Stock Repurchase Planto allow for the repurchase of such shares as may be necessary to reduce the issued and outstanding stock to200,000,000 shares of common stock.
The following table summarizes by repurchase plan the Company’s repurchasing activity:
Cumulative sharesrepurchased
Average priceper share
Non-Discretionary Plan . . . . . . . . . . . . . . . . . . . . . . . . . . . . . . . . . . . . . . . . . . . . . . . . .(1994 through 2010)
21,870,052 $ 21.24
Discretionary Plan . . . . . . . . . . . . . . . . . . . . . . . . . . . . . . . . . . . . . . . . . . . . . . . . . . . . .(2001 through 2010)
20,067,005 $ 34.37
B. | Stock Option Plans
At December 31, 2010, the Company has two stock option plans (the “1985 Plan” and the “2010 Plan”) under whichthe Board of Directors may grant officers and employees options to purchase common stock at prices equal to orgreater than market value on the date of grant. On May 5, 2010, the shareholders approved the Company’s 2010Plan, which made available a total of 3,000,000 shares of the Company’s common stock for purchase uponexercise of options granted under the 2010 Plan. The 1985 Plan provides for non-qualified grants. The 2010 Planprovides for qualified and non-qualified grants. Grants under the 2010 Plan are limited to not more than 100,000shares per person. No additional shares can be granted under the 2010 Plan after April 30, 2011. Outstandingoptions generally vest and become exercisable over periods up to five years from the date of grant and expire nomore than 10 years from the date of grant.
Upon the exercise of non-qualified stock options and disqualifying dispositions of incentive stock options,the Company derives a tax deduction measured by the excess of the market value over the option price at the dateof exercise or disqualifying disposition. The portion of the benefit from the deduction which equals the estimatedfair value of the options (previously recognized as compensation expense) is recorded as a credit to the deferredtax asset for non-qualified stock options and is recorded as a credit to current tax expense for any disqualifieddispositions of incentive stock options. All of the tax benefit received upon option exercise for the tax deductionin excess of the estimated fair value of the options is credited to additional paid-in capital.
F-15. |

The following table summarizes by plan stock option activity and shares available for granting of options:
1985Plan
2007Plan
2008Plan
2009Plan
2010Plan
Balance at December 31, 2007 . . . . . . . . . . . . . . . . . . 6,912 1,196,740 — — —
Options authorized . . . . . . . . . . . . . . . . . . . . . . . . . . . — — 3,000,000 — —Options granted . . . . . . . . . . . . . . . . . . . . . . . . . . . . . 0 0 (2,088,415) — —Options not granted . . . . . . . . . . . . . . . . . . . . . . . . . . — (1,196,740) — — —
Balance at December 31, 2008 . . . . . . . . . . . . . . . . . . 6,912 — 911,585 — —
Options authorized . . . . . . . . . . . . . . . . . . . . . . . . . . . — — — 3,000,000 —Options granted . . . . . . . . . . . . . . . . . . . . . . . . . . . . . 0 — 0 (2,449,200)Options not granted . . . . . . . . . . . . . . . . . . . . . . . . . . — — (911,585) —
Balance at December 31, 2009 . . . . . . . . . . . . . . . . . . 6,912 — — 550,800
Options authorized . . . . . . . . . . . . . . . . . . . . . . . . . . . — — — — 3,000,000Options granted . . . . . . . . . . . . . . . . . . . . . . . . . . . . . 0 — — 0 (2,634,885)Options not granted . . . . . . . . . . . . . . . . . . . . . . . . . . — — — (550,800) —
Balance at December 31, 2010 . . . . . . . . . . . . . . . . . . 6,912 — — — 365,115
C. | Stock Purchase Plan
In May 2002, the shareholders approved the Company’s 2002 Employee Stock Purchase Plan (“2002 Plan”), whichbecame effective August 1, 2002. The Company’s amended 2002 Plan provides for 9,305,452 shares of the Compa-ny’s common stock to be reserved for issuance upon exercise of purchase rights granted to employees who electto participate through regular payroll deductions beginning August 1 of each year. The purchase rights areexercisable on July 31 of the following year at a price equal to the lesser of (1) 85% of the fair market value of theCompany’s stock on the last trading day in July or (2) 85% of the fair market value of the Company’s stock on thefirst trading day in August of the preceding year. A total of 5,901,973 shares have been issued under the 2002 Planand $12,080 have been withheld from employees at December 31, 2010 in connection with the plan year endingJuly 31, 2011.
D. | Director Restricted Stock Plan
In May 2008, the shareholders approved the Company’s 2008 Directors’ Restricted Stock Plan (the 2008 Directors’Plan), which provides for annual awards of restricted stock to non-employee directors and makes 200,000 sharesof the Company’s common stock available for grant. The 2008 Directors’ Plan replaced the 1993 Directors’Non-qualified Stock Option Plan. The plan provides for an annual grant of restricted stock awards with a fairmarket value equal to $200,000 to each participant on June 1st of each year. There are 118,902 shares available forgrant under the 2008 Directors’ Plan as of December 31, 2010. Each restricted stock award under the 2008 Direc-tors’ Plan vests in equal amounts monthly over one year. Restricted shares entitle the grantees to all shareholderrights once vested, except for cash dividends and transfer rights which are forfeited until the final vesting date ofthe award. If a non-employee director’s service is terminated, any unvested portion of an award will be forfeitedunless the Compensation Committee of the Board of Directors determines otherwise.
| F-16.

E. | Stock Option Activity
The following table summarizes information about stock options:
Number ofshares
Weightedaverage
exercise priceper share
Weightedaverage
remainingcontractual life
Aggregateintrinsic value
(in thousands)
Outstanding at December 31, 2009 . . . . . . . . . . . . . . . 18,834,620 $ 28.96Options granted . . . . . . . . . . . . . . . . . . . . . . . . . . . . . . . 2,634,885 $ 40.64Options exercised . . . . . . . . . . . . . . . . . . . . . . . . . . . . . (4,752,741) $ 16.67Options forfeited . . . . . . . . . . . . . . . . . . . . . . . . . . . . . . (347,031) $ 41.50Options cancelled . . . . . . . . . . . . . . . . . . . . . . . . . . . . . (76,062) $ 41.55
Outstanding at December 31, 2010 . . . . . . . . . . . . . . . 16,293,671 $ 34.11 5.79 years $ 333,824
Exercisable at December 31, 2010 . . . . . . . . . . . . . . . . 8,195,427 $ 26.78 3.58 years $ 227,981
F. | Share-Based Compensation Expense
The fair value of each option grant is estimated on the date of grant using the Black-Scholes option pricing modelwith the following assumptions:
For the years ended December 31,
2010 2009 2008
Dividend yield . . . . . . . . . . . . . . . . . . . . . . . . . . . . . . . . . . . . . . . . . . . . . . . . . . . 1.07 – 1.08% 1.22 – 1.25% .72 – .76%Volatility – stock option plans . . . . . . . . . . . . . . . . . . . . . . . . . . . . . . . . . . . . . . 38 – 40% 38 – 39% 34 – 37%Volatility – stock purchase rights plans . . . . . . . . . . . . . . . . . . . . . . . . . . . . . . 29% 59% 45%Risk-free interest rates . . . . . . . . . . . . . . . . . . . . . . . . . . . . . . . . . . . . . . . . . . . . .29 – 2.86% 0.48 – 3.37% 2.28 – 3.46%Expected life (years) – stock option plans . . . . . . . . . . . . . . . . . . . . . . . . . . . . 5.44 – 6.90 6.09 – 7.86 6.37 – 7.99Expected life (years) – stock purchase rights plans . . . . . . . . . . . . . . . . . . . . 1 1 1Weighted average fair value of stock options granted during the
period . . . . . . . . . . . . . . . . . . . . . . . . . . . . . . . . . . . . . . . . . . . . . . . . . . . . $ 14.51 $ 13.84 $ 17.84Weighted average fair value of stock purchase rights granted during the
period . . . . . . . . . . . . . . . . . . . . . . . . . . . . . . . . . . . . . . . . . . . . . . . . . . . . $ 11.16 $ 12.78 $ 11.12
The Company’s expected volatility assumptions are based on the historical volatility of the Company’sstock. The expected life assumption is primarily based on historical employee exercise patterns and employeepost-vesting termination behavior. The risk-free interest rate for the expected term of the option is based on thecorresponding yield curve in effect at the time of grant for U.S. Treasury bonds having the same term as theexpected life of the option, i.e. a ten year bond rate is used for valuing an option with a ten year expected life. Theexpected dividend yield is based on the Company’s historical experience. The forfeiture assumption used tocalculate compensation expense is primarily based on historical pre-vesting employee forfeiture patterns.
The compensation for restricted stock awards is based on the fair market value of the Company’s share ofcommon stock on the date of grant. In 2010, 26,735 restricted shares were granted with a fair value per share of$37.40.
The total intrinsic value of options exercised during the years ended December 31, 2010, 2009 and 2008 wasapproximately $135 million, $38 million and $61 million, respectively.
As of December 31, 2010, the total unrecognized compensation cost related to unvested stock options,unvested restricted stock awards and stock purchase rights is $78 million and the weighted average period overwhich that cost is expected to be recognized is 3.0 years.
F-17. |

Total stock compensation expense and the total related tax benefit recognized are as follows:
For the years ended December 31,
2010 2009 2008
Stock compensation expense . . . . . . . . . . . . . . . . . . . . . . . . . . . . . . . . . . . . . . $ 43,743 $ 39,135 $ 44,879Recognized tax benefit . . . . . . . . . . . . . . . . . . . . . . . . . . . . . . . . . . . . . . . . . . . . $ 187 $ 258 $ 1,283
Shares issued as a result of stock option exercises, restricted stock awards and employee stock plan pur-chases are issued as new shares outstanding by the Company’s transfer agent.
NOTE 3. BASIC AND DILUTED EARNINGS PER SHARE
The following table reconciles the numerator and the denominator of the basic and diluted per share computa-tions for earnings attributable to shareholders per share.
Net earningsattributable toshareholders
Weightedaverageshares
Earningsper share
2010
Basic earnings attributable to shareholders . . . . . . . . . . . . . . . . . . . . . . . . . $ 344,172 212,283,966 $ 1.62Effect of dilutive potential common shares . . . . . . . . . . . . . . . . . . . . . . . . . . — 4,162,690 —
Diluted earnings attributable to shareholders . . . . . . . . . . . . . . . . . . . . . . . $ 344,172 216,446,656 $ 1.59
2009
Basic earnings attributable to shareholders . . . . . . . . . . . . . . . . . . . . . . . . . $ 240,217 212,112,744 $ 1.13Effect of dilutive potential common shares . . . . . . . . . . . . . . . . . . . . . . . . . . — 4,420,496 —
Diluted earnings attributable to shareholders . . . . . . . . . . . . . . . . . . . . . . . $ 240,217 216,533,240 $ 1.11
2008
Basic earnings attributable to shareholders . . . . . . . . . . . . . . . . . . . . . . . . . $ 301,014 212,755,946 $ 1.41Effect of dilutive potential common shares . . . . . . . . . . . . . . . . . . . . . . . . . . — 6,414,057 —
Diluted earnings attributable to shareholders . . . . . . . . . . . . . . . . . . . . . . . $ 301,014 219,170,003 $ 1.37
The following shares have been excluded from the computation of diluted earnings per share because theeffect would have been antidilutive:
Years ended December 31, 2010 2009 2008
Shares . . . . . . . . . . . . . . . . . . . . . . . . . . . . . . . . . . . . . . . . . . . . . . . . . . . . . . . . . . . 10,675,403 8,698,730 6,604,623
| F-18.

NOTE 4. INCOME TAXES
Income tax expense includes the following components:
Federal State Foreign Total
2010
Current . . . . . . . . . . . . . . . . . . . . . . . . . . . . . . . . . . . . . . . . . . . . . . $ 76,745 13,558 118,991 209,294Deferred . . . . . . . . . . . . . . . . . . . . . . . . . . . . . . . . . . . . . . . . . . . . . 10,197 372 — 10,569
$ 86,942 13,930 118,991 219,863
2009
Current . . . . . . . . . . . . . . . . . . . . . . . . . . . . . . . . . . . . . . . . . . . . . . $ 62,865 10,908 90,311 164,084Deferred . . . . . . . . . . . . . . . . . . . . . . . . . . . . . . . . . . . . . . . . . . . . . (1,388) (221) — (1,609)
$ 61,477 10,687 90,311 162,475
2008
Current . . . . . . . . . . . . . . . . . . . . . . . . . . . . . . . . . . . . . . . . . . . . . . $ 65,867 12,489 101,887 180,243Deferred . . . . . . . . . . . . . . . . . . . . . . . . . . . . . . . . . . . . . . . . . . . . . 15,996 354 — 16,350
$ 81,863 12,843 101,887 196,593
Income tax expense differs from amounts computed by applying the United States Federal income tax rateof 35% to earnings before income taxes as a result of the following:
2010 2009 2008
Computed “expected” tax expense . . . . . . . . . . . . . . . . . . . . . . . . . . . . . . . . . . . . . $ 197,424 141,005 174,850
Increase in income taxes resulting from:State income taxes, net of Federal income tax benefit . . . . . . . . . . . . . . . 9,054 6,947 8,347Nondeductible stock compensation expense, net . . . . . . . . . . . . . . . . . . 10,254 11,586 12,768Other, net . . . . . . . . . . . . . . . . . . . . . . . . . . . . . . . . . . . . . . . . . . . . . . . . . . . . 3,131 2,937 628
$ 219,863 162,475 196,593
The components of earnings before income taxes are as follows:
2010 2009 2008
United States . . . . . . . . . . . . . . . . . . . . . . . . . . . . . . . . . . . . . . . . . . . . . . . . . . . . . . . $ 196,382 117,889 126,659Foreign . . . . . . . . . . . . . . . . . . . . . . . . . . . . . . . . . . . . . . . . . . . . . . . . . . . . . . . . . . . . 367,686 284,983 372,913
$ 564,068 402,872 499,572
F-19. |

The tax effects of temporary differences and tax credits that give rise to significant portions of deferred taxassets and deferred tax liabilities at December 31, 2010 and 2009 are as follows:
Years ended December 31, 2010 2009
Deferred Tax Assets:
Accrued third party charges, deductible for taxes upon economic performance(i.e. actual payment) . . . . . . . . . . . . . . . . . . . . . . . . . . . . . . . . . . . . . . . . . . . . . . . . . . . . . . $ 6,503 4,853
Provision for doubtful accounts receivable . . . . . . . . . . . . . . . . . . . . . . . . . . . . . . . . . . . . . . . . 1,561 2,301Excess of financial statement over tax depreciation . . . . . . . . . . . . . . . . . . . . . . . . . . . . . . . . . 8,079 7,550Retained liability for cargo claims . . . . . . . . . . . . . . . . . . . . . . . . . . . . . . . . . . . . . . . . . . . . . . . . 713 1,286Capital loss . . . . . . . . . . . . . . . . . . . . . . . . . . . . . . . . . . . . . . . . . . . . . . . . . . . . . . . . . . . . . . . . . . . 0 598Deductible stock compensation expense, net . . . . . . . . . . . . . . . . . . . . . . . . . . . . . . . . . . . . . . 5,450 9,870
Total gross deferred tax assets . . . . . . . . . . . . . . . . . . . . . . . . . . . . . . . . . . . . . . . . . . . . . . . . . . 22,306 26,458
Deferred Tax Liabilities:
Unremitted foreign earnings, net of related foreign tax credits . . . . . . . . . . . . . . . . . . . . . . . . (78,112) (71,675)Foreign currency translation adjustment . . . . . . . . . . . . . . . . . . . . . . . . . . . . . . . . . . . . . . . . . . (4,453) (331)Other . . . . . . . . . . . . . . . . . . . . . . . . . . . . . . . . . . . . . . . . . . . . . . . . . . . . . . . . . . . . . . . . . . . . . . . . . (82) (103)
Total gross deferred tax liabilities . . . . . . . . . . . . . . . . . . . . . . . . . . . . . . . . . . . . . . . . . . . . . . . . $ (82,647) (72,109)
Net deferred tax liabilities . . . . . . . . . . . . . . . . . . . . . . . . . . . . . . . . . . . . . . . . . . . . . . . . . . . . . . . $ (60,341) (45,651)
Current deferred tax assets . . . . . . . . . . . . . . . . . . . . . . . . . . . . . . . . . . . . . . . . . . . . . . . . . . . . . . $ (8,706) (8,338)
Noncurrent deferred tax liabilities . . . . . . . . . . . . . . . . . . . . . . . . . . . . . . . . . . . . . . . . . . . . . . . . $ (69,047) (53,989)
Based on management’s review of the Company’s tax positions, the Company had no significant unrecog-nized tax benefits as of December 31, 2010 and 2009.
The Company or one of its subsidiaries files income tax returns in the U.S. federal jurisdiction and variousstate, local and foreign jurisdictions. The Company is no longer subject to U.S. federal income tax examinationsby tax authorities for years prior to 2007. With respect to state and local jurisdictions and countries outside of theUnited States, with limited exceptions, the Company and its subsidiaries are no longer subject to income taxaudits for years prior to 2001. In the normal course of business, the Company is subject to examination by taxingauthorities throughout the world. Although the outcome of tax audits is always uncertain, the Company believesthat adequate amounts of tax, interest and penalties have been provided for any adjustments that may result fromthese open tax years. Any interest and penalties expensed in relation to the underpayment of income taxes wereinsignificant for the years ended December 31, 2010, 2009 and 2008.
| F-20.
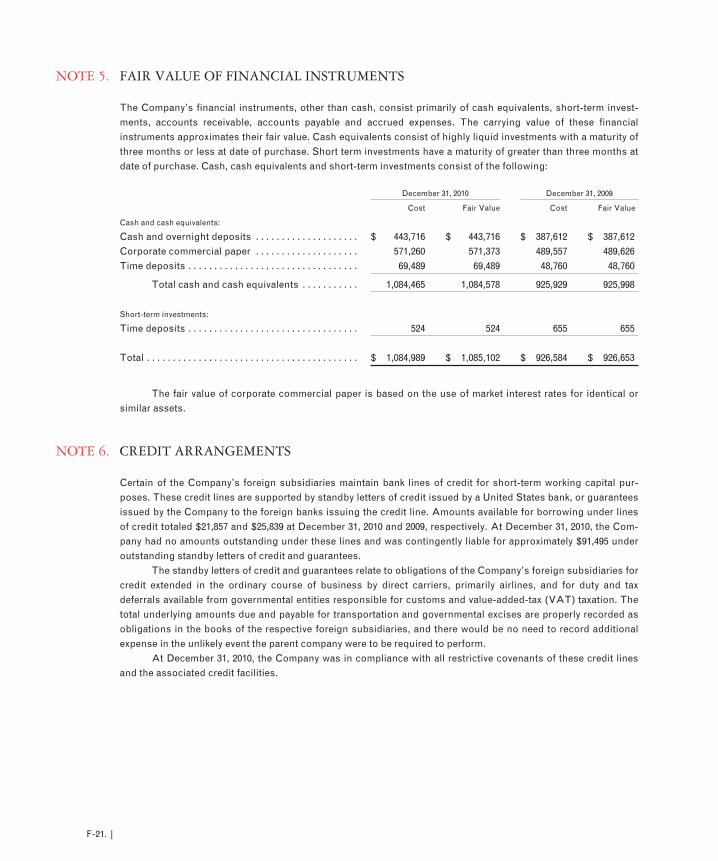
NOTE 5. FAIR VALUE OF FINANCIAL INSTRUMENTS
The Company’s financial instruments, other than cash, consist primarily of cash equivalents, short-term invest-ments, accounts receivable, accounts payable and accrued expenses. The carrying value of these financialinstruments approximates their fair value. Cash equivalents consist of highly liquid investments with a maturity ofthree months or less at date of purchase. Short term investments have a maturity of greater than three months atdate of purchase. Cash, cash equivalents and short-term investments consist of the following:
December 31, 2010 December 31, 2009
Cost Fair Value Cost Fair Value
Cash and cash equivalents:
Cash and overnight deposits . . . . . . . . . . . . . . . . . . . . $ 443,716 $ 443,716 $ 387,612 $ 387,612Corporate commercial paper . . . . . . . . . . . . . . . . . . . . 571,260 571,373 489,557 489,626Time deposits . . . . . . . . . . . . . . . . . . . . . . . . . . . . . . . . . 69,489 69,489 48,760 48,760
Total cash and cash equivalents . . . . . . . . . . . 1,084,465 1,084,578 925,929 925,998
Short-term investments:
Time deposits . . . . . . . . . . . . . . . . . . . . . . . . . . . . . . . . . 524 524 655 655
Total . . . . . . . . . . . . . . . . . . . . . . . . . . . . . . . . . . . . . . . . . $ 1,084,989 $ 1,085,102 $ 926,584 $ 926,653
The fair value of corporate commercial paper is based on the use of market interest rates for identical orsimilar assets.
NOTE 6. CREDIT ARRANGEMENTS
Certain of the Company’s foreign subsidiaries maintain bank lines of credit for short-term working capital pur-poses. These credit lines are supported by standby letters of credit issued by a United States bank, or guaranteesissued by the Company to the foreign banks issuing the credit line. Amounts available for borrowing under linesof credit totaled $21,857 and $25,839 at December 31, 2010 and 2009, respectively. At December 31, 2010, the Com-pany had no amounts outstanding under these lines and was contingently liable for approximately $91,495 underoutstanding standby letters of credit and guarantees.
The standby letters of credit and guarantees relate to obligations of the Company’s foreign subsidiaries forcredit extended in the ordinary course of business by direct carriers, primarily airlines, and for duty and taxdeferrals available from governmental entities responsible for customs and value-added-tax (VAT) taxation. Thetotal underlying amounts due and payable for transportation and governmental excises are properly recorded asobligations in the books of the respective foreign subsidiaries, and there would be no need to record additionalexpense in the unlikely event the parent company were to be required to perform.
At December 31, 2010, the Company was in compliance with all restrictive covenants of these credit linesand the associated credit facilities.
F-21. |

NOTE 7. COMMITMENTS
A. | Leases
The Company occupies office and warehouse facilities under terms of operating leases expiring up to 2020. TheCompany also has two long term operating lease arrangements to use land, for which the usage rights wereentirely prepaid in 2009 and 2007. Usage rights for those arrangements are recognized in rent expense over thelease terms up to 2057. Total rent expense for all operating leases in 2010, 2009 and 2008 was $54,024, $52,581 and$54,059, respectively.
At December 31, 2010, future minimum annual lease payments under all noncancelable leases are as fol-lows:
2011 . . . . . . . . . . . . . . . . . . . . . . . . . . . . . . . . . . . . . . . . . . . . . . . . . . . . . . . . . . . . . . . . . . . . . . . . . . . . . . . . . . . $ 39,2442012 . . . . . . . . . . . . . . . . . . . . . . . . . . . . . . . . . . . . . . . . . . . . . . . . . . . . . . . . . . . . . . . . . . . . . . . . . . . . . . . . . . . 30,7402013 . . . . . . . . . . . . . . . . . . . . . . . . . . . . . . . . . . . . . . . . . . . . . . . . . . . . . . . . . . . . . . . . . . . . . . . . . . . . . . . . . . . 23,2822014 . . . . . . . . . . . . . . . . . . . . . . . . . . . . . . . . . . . . . . . . . . . . . . . . . . . . . . . . . . . . . . . . . . . . . . . . . . . . . . . . . . . 15,4142015 . . . . . . . . . . . . . . . . . . . . . . . . . . . . . . . . . . . . . . . . . . . . . . . . . . . . . . . . . . . . . . . . . . . . . . . . . . . . . . . . . . . 8,031Thereafter . . . . . . . . . . . . . . . . . . . . . . . . . . . . . . . . . . . . . . . . . . . . . . . . . . . . . . . . . . . . . . . . . . . . . . . . . . . . . . 11,443
$ 128,154
B. | Unconditional Purchase Obligations
The Company enters into short-term agreements with asset-based providers reserving space on a guaranteedbasis. The pricing of these obligations varies to some degree with market conditions. The Company only entersinto agreements that management believes the Company can fulfill with relative ease. Historically, the Companyhas not paid for guaranteed space that it has not used. Management believes, in line with historical experience,committed purchase obligations outstanding as of December 31, 2010 of $180,202, will be fulfilled during 2011 inthe Company’s ordinary course of business.
C. | Employee Benefits
The Company has employee savings plans under which the Company provides a discretionary matching con-tribution. In 2010, 2009 and 2008, the Company’s contributions under the plans were $6,127, $6,100, and $6,196,respectively.
NOTE 8. CONTINGENCIES
On October 10, 2007, the U. S. Department of Justice (DOJ) issued a subpoena ordering the Company to producecertain information and records relating to an investigation of alleged anti-competitive behavior amongst air cargofreight forwarders. The Company has retained the services of a law firm to assist in complying with the DOJ’ssubpoena. As part of this process, the Company has met with and continues to co-operate with the DOJ. TheCompany expects to incur additional costs during the course of this ongoing investigation, which could includefines and/or penalties if the DOJ concludes that the Company has engaged in anti-competitive behavior and suchfines and/or penalties could have a material impact on the Company’s financial position, results of operations andoperating cash flows.
On January 3, 2008, the Company was named as a defendant, with seven other European and NorthAmerican-based global logistics providers, in a Federal antitrust class action lawsuit filed in the United StatesDistrict Court of the Eastern District of New York, Precision Associates, Inc. et al v. Panalpina World Transport,
| F-22.

No. 08-CV0042. On July 21, 2009, the plaintiffs filed an amended complaint adding a number of new third partydefendants and various claims which they assert to violate the Sherman Act. The plaintiffs’ amended complaint,which purports to be brought on behalf of a class of customers (and has not yet been certified), asserts claimsthat the defendants engaged in price fixing regarding eight discrete surcharges in violation of the Sherman Act.The allegations concerning the Company relate to two of these surcharges. The amended complaint seeksunspecified damages and injunctive relief. The Company believes that these allegations are without merit andintends to vigorously defend itself. On August 13, 2009, the Company filed a motion to dismiss the amendedcomplaint for failure to state a claim, which is currently pending before the Court. Plaintiffs filed their oppositionto the Company’s motion on January 30, 2010 and the motion is currently pending before the Court.
On June 18, 2008, the European Commission (EC) issued a request for information to the Company’s UKsubsidiary, Expeditors International (UK) Ltd., requesting certain information relating to an ongoing investigationof freight forwarders. The Company replied to the request. On February 18, 2009, the EC issued another requestfor information to the same subsidiary requesting certain additional information in connection with the EC’songoing investigation of freight forwarders. The Company replied to the request. On February 10, 2010, the Com-pany and its Hong Kong subsidiary, Expeditors Hong Kong Limited, received a Statement of Objections (SO) fromthe EC. The SO initiates a proceeding against the Company alleging anti-competitive behavior contrary to Euro-pean Union rules on competition. Specific to the Company, the allegations in the SO are limited to the period fromAugust 2005 to June 2006 and only concern airfreight trade lanes between South China/Hong Kong and the Euro-pean Economic Area. The Company filed a response to the allegations in the SO on April 12, 2010 and partici-pated in an oral hearing on July 6, 2010. On January 20, 2011, the EC issued another request for information to theCompany and its Hong Kong subsidiary requesting certain additional information in connection with its on-goinginvestigation of freight forwarders. The Company replied to the request. The Company continues to vigorouslydefend itself against the allegations. The Company expects to incur additional costs during the course of thisongoing proceeding, which could include administrative fines if the EC concludes that the Company has engagedin anti-competitive behavior and such fines could have a material impact on the Company’s financial position,results of operations and operating cash flows.
On August 17, 2010, the Company and its Brazilian subsidiary, Expeditors Internacional do Brasil Ltdareceived an Administrative Proceeding (AP) from the Brazilian Ministry of Justice (MOJ). The AP initiates aproceeding against the Company and one of its employees, alleging possible anti-competitive behavior. TheCompany intends to vigorously defend itself against the allegations. The Company expects to incur additionalcosts during the course of this proceeding, which could include administrative fines if the MOJ concludes thatthe Company has engaged in anti-competitive behavior and such fines could have a material impact on theCompany’s financial position, results of operations and operating cash flows.
The Company has incurred approximately $1 million, less than $1 million and $10 million for the yearsended December 31, 2010, 2009 and 2008, respectively, in legal and associated costs on the above matters. Sincethe beginning of the proceedings in 2007, the Company has incurred approximately $15 million in legal and asso-ciated costs on the above matters. At this time the Company is unable to estimate the range of loss or damages, ifany, that might result as an outcome of any of these proceedings. These government investigations and therelated litigation matters are subject to inherent uncertainties, and unfavorable rulings could occur. Anunfavorable ruling could include substantial monetary damages and, in matters in which injunctive relief or otherconduct remedies are sought, an injunction or other order relating to business conduct. Were unfavorable finaloutcomes to occur, the Company’s business, financial position, results of operations, and operating cash flowscould be materially harmed.
The Company is involved in other claims and lawsuits which arise in the ordinary course of business, noneof which currently, in management’s opinion, will have a significant effect on the Company’s operations or finan-cial position.
F-23. |

[THIS PAGE INTENTIONALLY LEFT BLANK]
| F-24.

NOTE 9. BUSINESS SEGMENT INFORMATION
Financial information regarding 2010, 2009 and 2008 operations by the Company’s designated geographic areasare as follows:
United States
OtherNorth
America
2010
Revenues from unaffiliated customers . . . . . . . . . . . . . . . . . . . . . . . . . . . . . . . . . . . . . . . . $ 1,348,259 163,750Transfers between geographic areas . . . . . . . . . . . . . . . . . . . . . . . . . . . . . . . . . . . . . . . . . 99,547 10,836
Total revenues . . . . . . . . . . . . . . . . . . . . . . . . . . . . . . . . . . . . . . . . . . . . . . . . . . . . . . . . . . . . . $ 1,447,806 174,586
Net revenues . . . . . . . . . . . . . . . . . . . . . . . . . . . . . . . . . . . . . . . . . . . . . . . . . . . . . . . . . . . . . . $ 666,669 77,079Operating income . . . . . . . . . . . . . . . . . . . . . . . . . . . . . . . . . . . . . . . . . . . . . . . . . . . . . . . . . . $ 198,393 23,521Identifiable assets at year end . . . . . . . . . . . . . . . . . . . . . . . . . . . . . . . . . . . . . . . . . . . . . . . . $ 1,343,098 95,298Capital expenditures . . . . . . . . . . . . . . . . . . . . . . . . . . . . . . . . . . . . . . . . . . . . . . . . . . . . . . . . $ 18,128 574Depreciation and amortization . . . . . . . . . . . . . . . . . . . . . . . . . . . . . . . . . . . . . . . . . . . . . . . $ 20,125 1,344Equity . . . . . . . . . . . . . . . . . . . . . . . . . . . . . . . . . . . . . . . . . . . . . . . . . . . . . . . . . . . . . . . . . . . . $ 1,089,053 46,601
2009
Revenues from unaffiliated customers . . . . . . . . . . . . . . . . . . . . . . . . . . . . . . . . . . . . . . . . $ 982,103 129,272Transfers between geographic areas . . . . . . . . . . . . . . . . . . . . . . . . . . . . . . . . . . . . . . . . . 75,964 7,344
Total revenues . . . . . . . . . . . . . . . . . . . . . . . . . . . . . . . . . . . . . . . . . . . . . . . . . . . . . . . . . . . . . $ 1,058,067 136,616
Net revenues . . . . . . . . . . . . . . . . . . . . . . . . . . . . . . . . . . . . . . . . . . . . . . . . . . . . . . . . . . . . . . $ 547,879 65,331Operating income . . . . . . . . . . . . . . . . . . . . . . . . . . . . . . . . . . . . . . . . . . . . . . . . . . . . . . . . . . $ 117,908 20,253Identifiable assets at year end . . . . . . . . . . . . . . . . . . . . . . . . . . . . . . . . . . . . . . . . . . . . . . . . $ 1,188,111 82,166Capital expenditures . . . . . . . . . . . . . . . . . . . . . . . . . . . . . . . . . . . . . . . . . . . . . . . . . . . . . . . . $ 24,908 724Depreciation and amortization . . . . . . . . . . . . . . . . . . . . . . . . . . . . . . . . . . . . . . . . . . . . . . . $ 21,010 1,391Equity . . . . . . . . . . . . . . . . . . . . . . . . . . . . . . . . . . . . . . . . . . . . . . . . . . . . . . . . . . . . . . . . . . . . $ 965,620 40,421
2008
Revenues from unaffiliated customers . . . . . . . . . . . . . . . . . . . . . . . . . . . . . . . . . . . . . . . . $ 1,269,858 162,730Transfers between geographic areas . . . . . . . . . . . . . . . . . . . . . . . . . . . . . . . . . . . . . . . . . 108,864 10,205
Total revenues . . . . . . . . . . . . . . . . . . . . . . . . . . . . . . . . . . . . . . . . . . . . . . . . . . . . . . . . . . . . . $ 1,378,722 172,935
Net revenues . . . . . . . . . . . . . . . . . . . . . . . . . . . . . . . . . . . . . . . . . . . . . . . . . . . . . . . . . . . . . . $ 622,367 75,376Operating income . . . . . . . . . . . . . . . . . . . . . . . . . . . . . . . . . . . . . . . . . . . . . . . . . . . . . . . . . . $ 119,115 20,094Identifiable assets at year end . . . . . . . . . . . . . . . . . . . . . . . . . . . . . . . . . . . . . . . . . . . . . . . . $ 978,189 64,652Capital expenditures . . . . . . . . . . . . . . . . . . . . . . . . . . . . . . . . . . . . . . . . . . . . . . . . . . . . . . . . $ 25,640 2,149Depreciation and amortization . . . . . . . . . . . . . . . . . . . . . . . . . . . . . . . . . . . . . . . . . . . . . . . $ 21,558 1,347Equity . . . . . . . . . . . . . . . . . . . . . . . . . . . . . . . . . . . . . . . . . . . . . . . . . . . . . . . . . . . . . . . . . . . . $ 773,565 32,530
F-25. |

LatinAmerica Asia Pacific
Europe andAfrica
MiddleEast and
India Eliminations Consolidated
74,327 3,349,960 729,022 302,255 — 5,967,57316,932 32,837 40,778 16,184 (217,114) —
91,259 3,382,797 769,800 318,439 (217,114) 5,967,573
50,937 543,869 264,663 89,569 — 1,692,78615,985 222,944 63,115 23,272 — 547,23051,326 612,085 432,019 144,043 1,310 2,679,1791,320 5,743 14,383 2,260 — 42,408
880 7,511 4,661 2,379 — 36,90027,462 371,610 160,428 84,456 (31,456) 1,748,154
64,060 2,101,323 582,759 232,766 — 4,092,28313,520 26,771 27,699 14,602 (165,900) —
77,580 2,128,094 610,458 247,368 (165,900) 4,092,283
44,182 413,627 229,432 82,335 — 1,382,78612,538 167,299 43,953 23,050 — 385,00142,478 493,338 387,494 128,690 1,445 2,323,722
688 2,772 3,407 2,201 — 34,7001,087 8,106 5,968 2,473 — 40,035
17,809 341,991 148,592 77,566 (30,652) 1,561,347
81,586 3,056,168 789,442 274,094 — 5,633,87815,742 30,044 44,721 17,598 (227,174) —
97,328 3,086,212 834,163 291,692 (227,174) 5,633,878
52,334 486,243 280,229 86,712 — 1,603,26115,059 229,917 63,156 25,795 — 473,13644,377 500,183 392,820 116,167 4,451 2,100,8391,158 20,869 7,074 2,836 — 59,7261,177 7,177 6,470 2,274 — 40,003
26,030 376,448 138,710 60,504 (23,871) 1,383,916
| F-26.

In 2010, the Company changed its geographical area organization by incorporating the management of itsAustralasia region with its Asia region. Accordingly, the financial information of the Company’s Asia and Aus-tralasia segments, previously reported separately, have been combined in the Asia Pacific operating segment forall periods presented.
Other than the United States, only the People’s Republic of China, including Hong Kong, representedmore than 10% of the Company’s total revenue, net revenue or total identifiable assets in any period presented asnoted in the table below.
2010 2009 2008
Total revenues . . . . . . . . . . . . . . . . . . . . . . . . . . . . . . . . . . . . . . . . . . . . . . . . . . . . . . . . . . . . . . . . . . . 37% 34% 36%Net revenues . . . . . . . . . . . . . . . . . . . . . . . . . . . . . . . . . . . . . . . . . . . . . . . . . . . . . . . . . . . . . . . . . . . . . 19% 17% 16%Identifiable assets at year end . . . . . . . . . . . . . . . . . . . . . . . . . . . . . . . . . . . . . . . . . . . . . . . . . . . . . . 13% 13% 14%
NOTE 10. QUARTERLY RESULTS (UNAUDITED)
1st 2nd 3rd 4th
2010
Revenues . . . . . . . . . . . . . . . . . . . . . . . . . . . . . . . . . . . . . . . . . . . . $ 1,201,109 1,516,770 1,667,559 1,582,135Net revenues . . . . . . . . . . . . . . . . . . . . . . . . . . . . . . . . . . . . . . . . . 361,823 418,858 458,743 453,362Net earnings . . . . . . . . . . . . . . . . . . . . . . . . . . . . . . . . . . . . . . . . . 61,310 90,409 96,038 96,448Net earnings attributable to shareholders . . . . . . . . . . . . . . . . 61,247 90,318 96,105 96,502Diluted earnings attributable to shareholders per share . . . . .28 .42 .44 .45Basic earnings attributable to shareholder per share . . . . . . . .29 .43 .45 .45
2009
Revenues . . . . . . . . . . . . . . . . . . . . . . . . . . . . . . . . . . . . . . . . . . . . $ 912,685 895,360 1,037,327 1,246,911Net revenues . . . . . . . . . . . . . . . . . . . . . . . . . . . . . . . . . . . . . . . . . 336,515 330,047 346,512 369,712Net earnings . . . . . . . . . . . . . . . . . . . . . . . . . . . . . . . . . . . . . . . . . 59,369 53,814 57,564 69,650Net earnings attributable to shareholders . . . . . . . . . . . . . . . . 59,260 54,070 57,752 69,135Diluted earnings attributable to shareholder per share . . . . . .27 .25 .27 .32Basic earnings attributable to shareholder per share . . . . . . . .28 .25 .27 .33
Net revenues are determined by deducting transportation expenses from total revenues. The sum of quarterly per share data may not equal the
per share total reported for the year.
F-27. |

Directors
Peter J. RoseChairman of the Board and Chief Executive OfficerDirector
James L. K. WangPresidentAsia PacificDirector
R. Jordan GatesPresident and Chief Operating OfficerDirector
Mark A. EmmertDirectorPresident National Collegiate Athletic Association
Dan P. KourkoumelisDirector
Michael J. MaloneDirector
John W. MeisenbachDirectorPresidentMCM, A Financial Services Company
Robert R. WrightDirectorPresident and Chief Executive Officer Matthew G. Norton Co.,A Real Estate Firm
Executive Officers
Timothy C. BarberPresident Global Sales and Marketing
Rommel C. SaberPresident Europe, Africa, Near/Middle East and Indian Sub-continent
Robert L. VillanuevaPresident The Americas
Eugene K. AlgerExecutive Vice President North America
Philip M. CoughlinExecutive Vice PresidentNorth America
Rosanne EspositoExecutive Vice President Global Customs
Jeffrey S. MusserExecutive Vice President and Chief Information Officer
Bradley S. PowellChief Financial Officer
Jose A. UbedaSenior Vice PresidentAir Cargo
Charles J. LynchSenior Vice PresidentCorporate Controller
Daniel R. WallSenior Vice PresidentOcean Services
Amy J. TangemanVice PresidentGeneral Counsel and Secretary
Directors & Executive Officers

Product & Service Managers Geographic Managers
Global and Product Services
Erin M. ThomassonSenior Vice PresidentInsurance
William A. Romberger IIISenior Vice PresidentGlobal Transcon Services
Bret C. BackmanVice PresidentResearch and Development
Richard P. BallantyneVice PresidentGlobal Distribution Services
Samuel R. BokorVice PresidentTraining and Personnel Development
Sean M. FranciscoVice PresidentAir Cargo, The Americas
Rebecca A. CatesVice PresidentTreasurer
Steven J. GrimmerVice PresidentAccount Management
Scott M. KellyVice President Global Ocean Services
Carol KijacVice President The Americas, Sales and Marketing
Deanna L. WilsonVice President Global Business Processes
Todd R. N. BrownVice PresidentSecurity, Health and Safety
Christopher J. McClincyVice PresidentInformation Services
Asia
David HsiehSenior Vice President Asia Pacific
Andrew GohSenior Vice President South East Asia
Paul ArthurSenior Vice PresidentSouth Pacific, Indo China and Philippines
Alan LoRegional Vice President South China, Hong Kong and Macao
Allen WangRegional Vice PresidentNorthern China
Mong Pheng KohRegional Vice PresidentCentral China and Taiwan
Simon LiuManaging DirectorHong Kong
Wilson YangManaging DirectorThailand
Simon JungManaging DirectorKorea
Megan JengManaging Director Taiwan
Lim Khoon LingManaging DirectorSingapore
Mary YaoManaging DirectorShanghai, China
Danny LeeManaging DirectorVietnam
Seiichi SasakiManaging DirectorJapan
Kaiser LamGeneral ManagerShenzhen, South China
Aris YeapGeneral ManagerPenang, Malaysia
Junnosuke DojoGeneral Manager Tokyo, Japan
Gary ChenGeneral Manager Jakarta, Indonesia
Syed Ershad AhmedGeneral ManagerBangladesh
Aristotle AnicetoGeneral ManagerPhilippines
Kounthea ThoGeneral Manager Cambodia

North America
Brian R. CarrabesRegional Vice PresidentSoutheast Region
Joseph P. CooganRegional Vice President Northeast Region
Karl C. FranciscoRegional Vice PresidentSouthwest Region
Todd A. HinkleRegional Vice PresidentNorth Central Region
J. Ross HurstRegional Vice PresidentCanada
Roger A. IdiartRegional Vice PresidentNorthwest Region
Bruce J. KrebsRegional Vice PresidentSouthern Border and Mexico
Bryan K. LillyRegional Vice PresidentSouth Central Region
Richard H. RostanRegional Vice PresidenMidwest Region
Craig WilwerdingRegional Vice PresidentMid-Atlantic Region
Geographic Managers
Europe & Africa
Kurt MeisterRegional Vice PresidentSouth Europe
Henrik HedensioRegional Vice PresidentNorth Europe
Barry L. BaronRegional Vice PresidentUnited Kingdom, Ireland and South Africa
Kees WagenaarRegional DirectorBenelux and Central Europe
Paolo DomanteManaging DirectorItaly and Switzerland
Rainer KirschnerRegional DirectorGermany and Austria
Magdolna AcsManaging DirectorHungary
Rene GrabmullerManaging Director Czech Republic
Frank SchaefferCountry ManagerFrance
Ingeborg DruecklerDirectorEuropean Agents
Billy GriffithsDirectorAfrican States
Rickard SohlRegional DirectorNordic

Geographic Managers (continued)
Near/Middle East & Indian Sub-continent
Tony HelayelRegional Vice PresidentEast Mediterranean and North Africa
David MacphersonRegional Vice PresidentGulf States, Pakistan, India and Nepal
Samir GhaouiManaging DirectorLevant
Afsar MahmoodManaging DirectorPakistan
K. MuraliManaging DirectorIndia
Suleyman TureManaging DirectorTurkey
Latin America
Guillermo AyerbeRegional Vice PresidentLatin America
Diego EstrinRegional DirectorAndean Countries
Jose Antonio BedoyaCountry ManagerPeru
Paulo FernandesCountry ManagerBrazil

Corporate Information
Corporate HeadquartersExpeditors Internationalof Washington, Inc.1015 Third Avenue12th FloorSeattle, WA 98104
Information is available onhttp://www.expeditors.com
Transfer Agent and Registrar, Dividend Disbursing Agent
Computershare TrustCompany, N.A.250 Royall Street
Shareholder Services(877) 498-8861
Hearing Impaired / TDD (800) 952-9245
Websitehttp://www.expeditors.com
Independent RegisteredPublic Accounting Firm
KPMG, LLP801 Second AvenueSuite 900Seattle, WA 98104
Offices and Agents
A directory can be viewed on our website at http://www.expeditors.com.
Annual Meeting
The annual meeting of shareholders is Wednesday, May 4, 2011, at 2:00 pm at:
Expeditors’ Corporate Headquarters1015 Third AvenueSeattle, WA 98104
Investor Relations
Further information about the Company, additional copies of this report, Form 10-K or other financial information may be obtained without charge by writing:
Bradley S. Powell,Chief Financial OfficerExpeditors Internationalof Washington, Inc.1015 Third Avenue12th FloorSeattle, WA 98104
Stock Price and Dividend Data
The following table sets forth the high and low sale prices for the Company’s common stock as reported by The NASDAQ Global Select Market under the symbol EXPD.
Common Stock
Quarter High Low
2010
First $ 38.93 32.36Second 42.39 34.46Third 47.58 33.65Fourth 57.15 45.23
2009
First $ 34.59 23.86Second 38.10 27.26Third 37.04 24.50Fourth 35.83 31.27
There were 1,347 shareholders of record as of February 18, 2011. This figure does not include a substantially greater number of beneficial shareholders of the Company’s common stock, whose Shares are held of record by banks, brokers and other financial institutions.
In 2010 and 2009, the Board of Directors declared a semi-annual dividend of $.20 per and $.19 per share, respectively, which was paid as follows:
2010 15 June 15 December
2009 15 June 15 December