Our Journey to Discharge to Assess (D2A) - Welcome to … · discharge co-ordination team ... The...
24
Our Journey to Discharge to Assess (D2A) Jane Ives Director of Operations South Warwickshire NHS Foundation Trust Wendy Lane Senior Partner Transformation & Innovation Arden Commissioning Support Zoe Bogg Strategic Commissioning Service Manager, Integration Older People, Warwickshire County Council
Transcript of Our Journey to Discharge to Assess (D2A) - Welcome to … · discharge co-ordination team ... The...
Our Journey to Discharge to Assess (D2A)
Jane IvesDirector of Operations
South Warwickshire NHS Foundation Trust
Wendy Lane Senior Partner Transformation & Innovation
Arden Commissioning Support
Zoe BoggStrategic Commissioning Service Manager, Integration Older
People, Warwickshire County Council
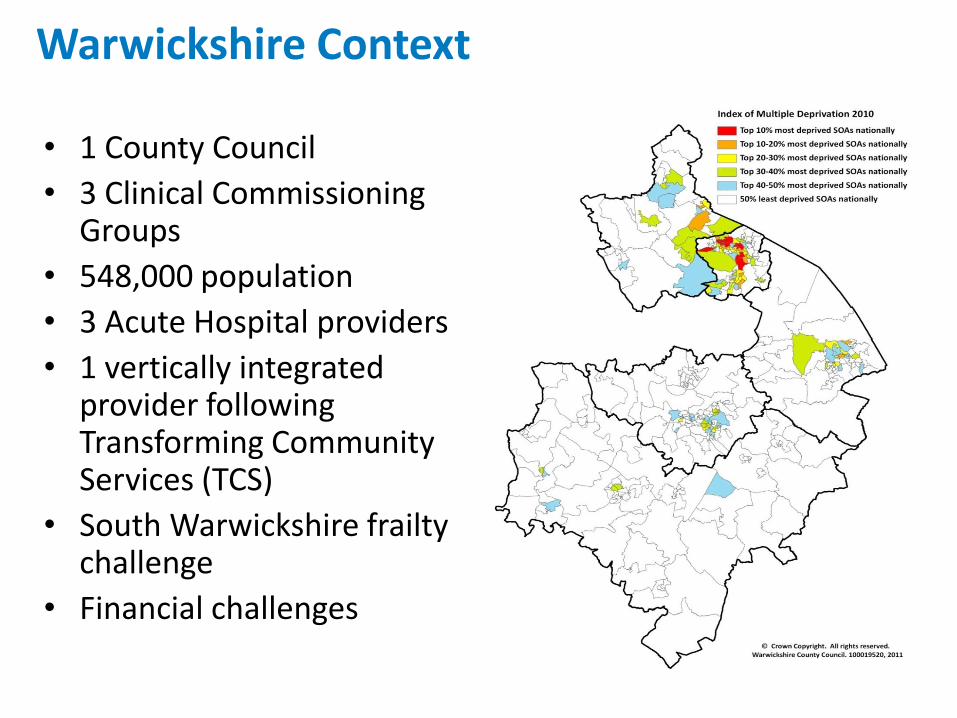
Warwickshire Context
• 1 County Council
• 3 Clinical Commissioning Groups
• 548,000 population
• 3 Acute Hospital providers
• 1 vertically integrated provider following Transforming Community Services (TCS)
• South Warwickshire frailty challenge
• Financial challenges
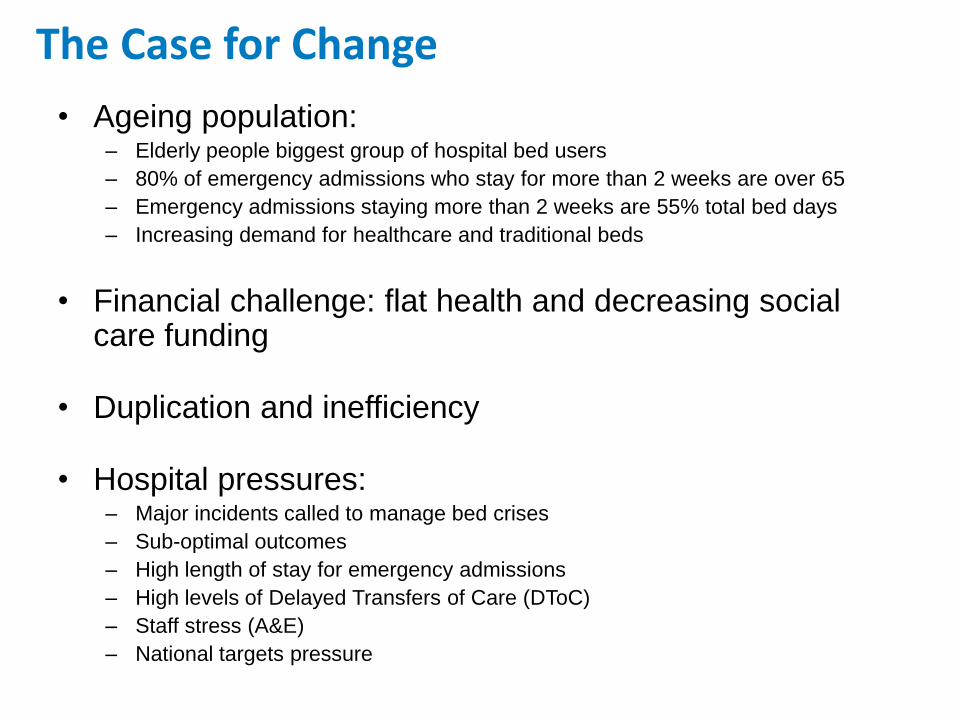
• Ageing population:– Elderly people biggest group of hospital bed users
– 80% of emergency admissions who stay for more than 2 weeks are over 65
– Emergency admissions staying more than 2 weeks are 55% total bed days
– Increasing demand for healthcare and traditional beds
• Financial challenge: flat health and decreasing social care funding
• Duplication and inefficiency
• Hospital pressures:– Major incidents called to manage bed crises
– Sub-optimal outcomes
– High length of stay for emergency admissions
– High levels of Delayed Transfers of Care (DToC)
– Staff stress (A&E)
– National targets pressure
The Case for Change
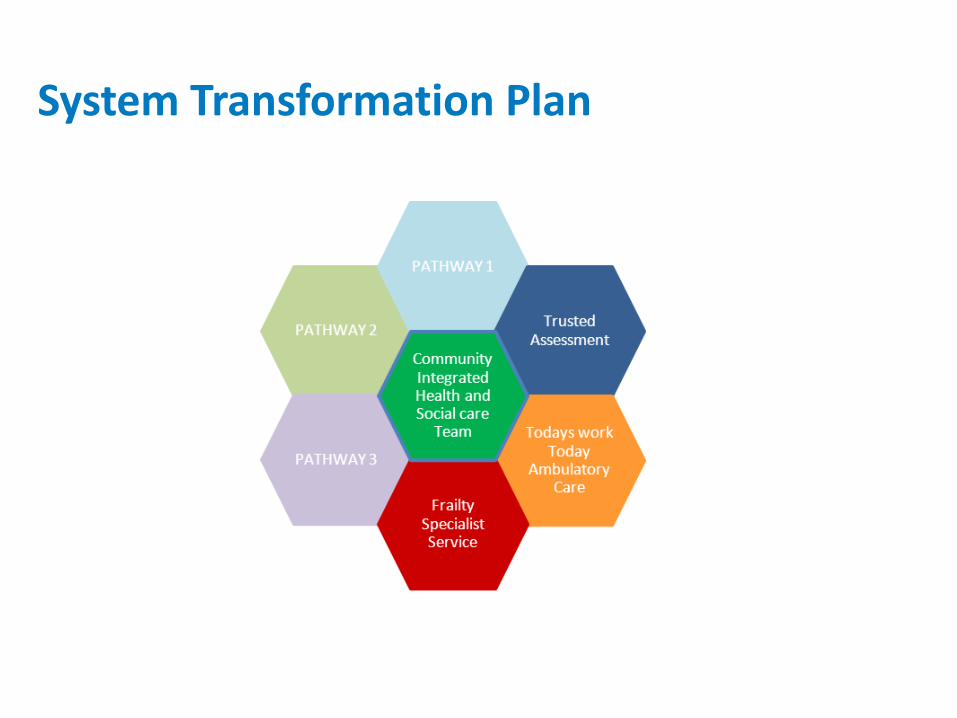
System Transformation Plan
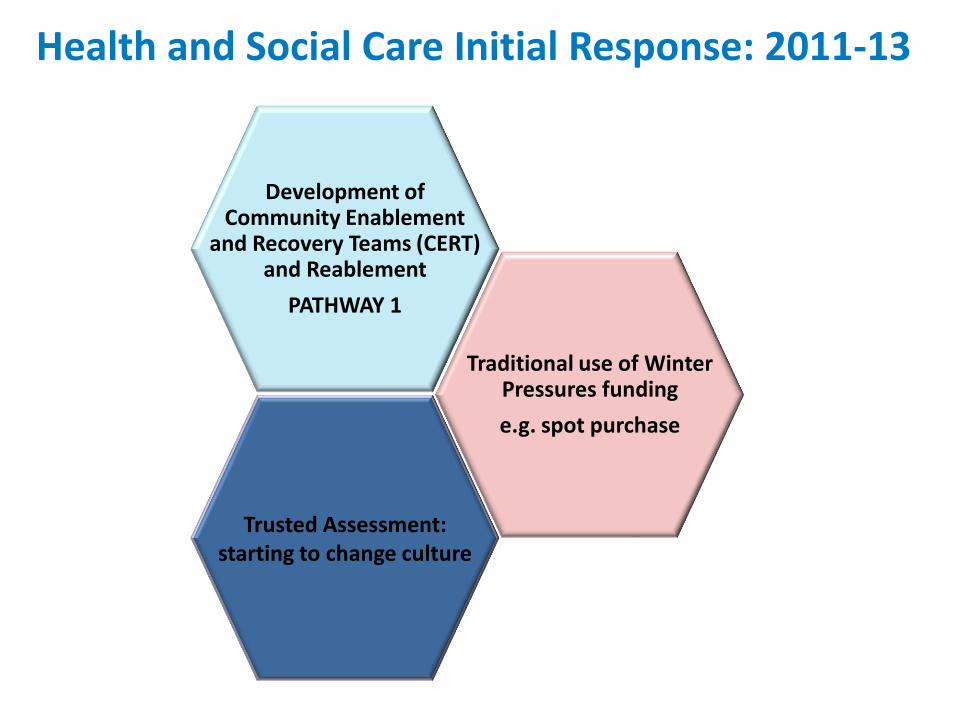
Health and Social Care Initial Response: 2011-13
Traditional use of Winter Pressures funding
e.g. spot purchase
Development of Community Enablement
and Recovery Teams (CERT) and Reablement
PATHWAY 1
Trusted Assessment: starting to change culture
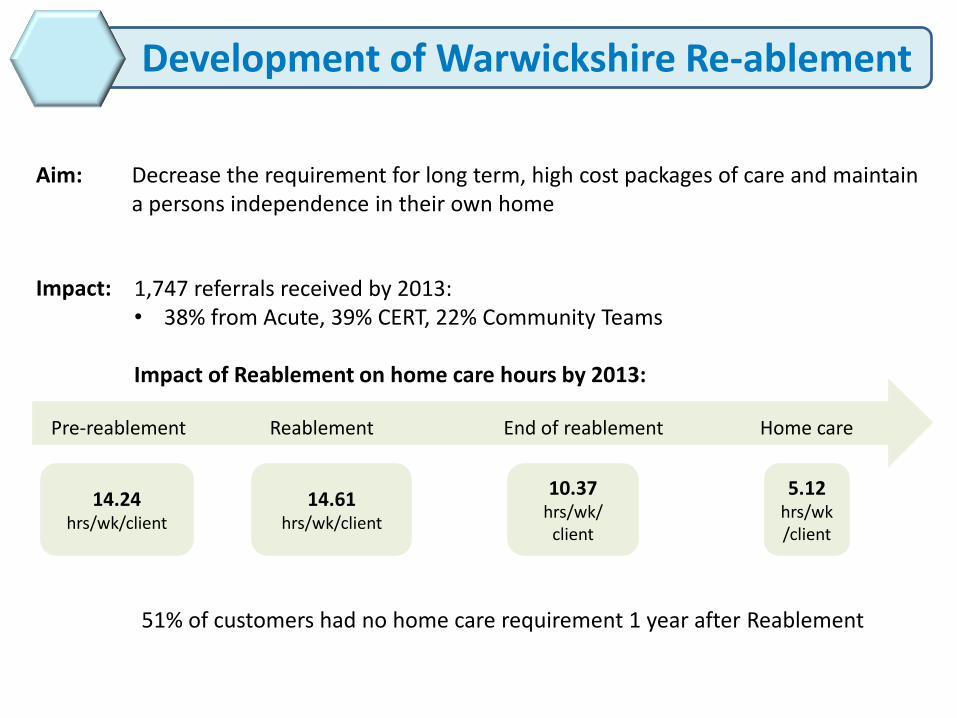
Development of Warwickshire Re-ablement
Aim: Decrease the requirement for long term, high cost packages of care and maintain a persons independence in their own home
Impact: 1,747 referrals received by 2013:• 38% from Acute, 39% CERT, 22% Community Teams
Impact of Reablement on home care hours by 2013:
51% of customers had no home care requirement 1 year after Reablement
Pre-reablement Reablement End of reablement Home care
14.24hrs/wk/client
10.37hrs/wk/
client
5.12hrs/wk/client
14.61hrs/wk/client
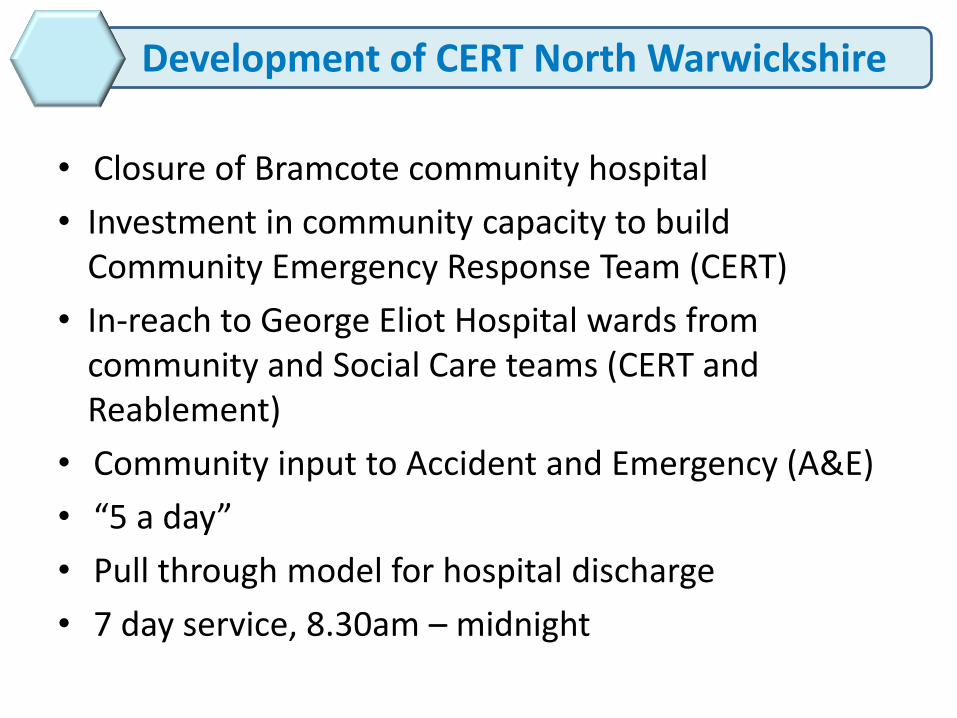
Development of CERT North Warwickshire
• Closure of Bramcote community hospital
• Investment in community capacity to build Community Emergency Response Team (CERT)
• In-reach to George Eliot Hospital wards from community and Social Care teams (CERT and Reablement)
• Community input to Accident and Emergency (A&E)
• “5 a day”
• Pull through model for hospital discharge
• 7 day service, 8.30am – midnight
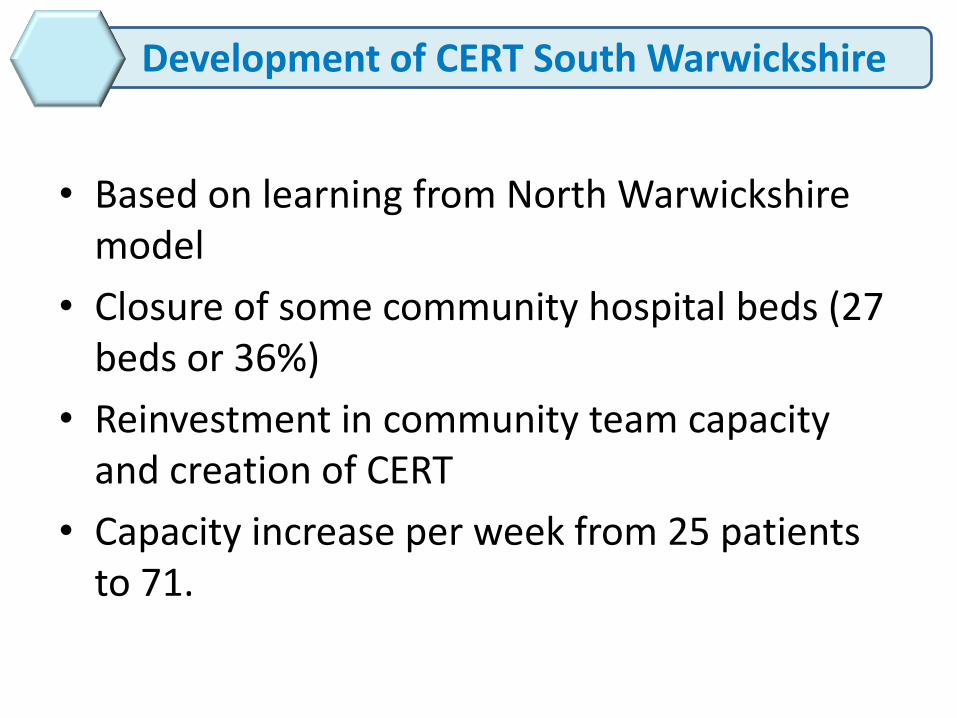
Development of CERT South Warwickshire
• Based on learning from North Warwickshire model
• Closure of some community hospital beds (27 beds or 36%)
• Reinvestment in community team capacity and creation of CERT
• Capacity increase per week from 25 patients to 71.
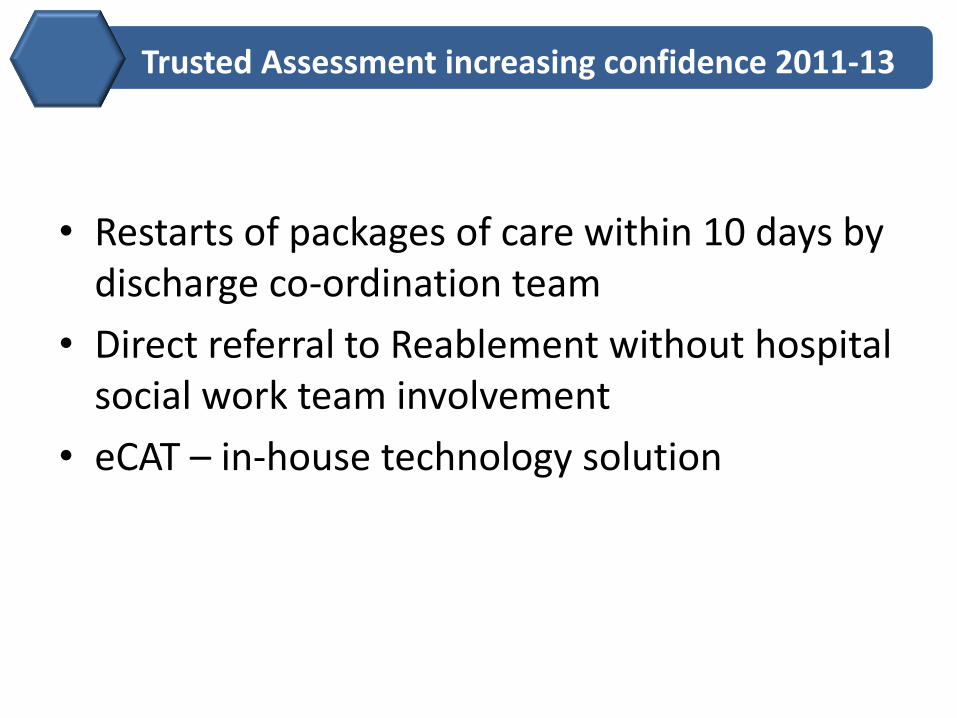
Trusted Assessment increasing confidence 2011-13
• Restarts of packages of care within 10 days by discharge co-ordination team
• Direct referral to Reablement without hospital social work team involvement
• eCAT – in-house technology solution
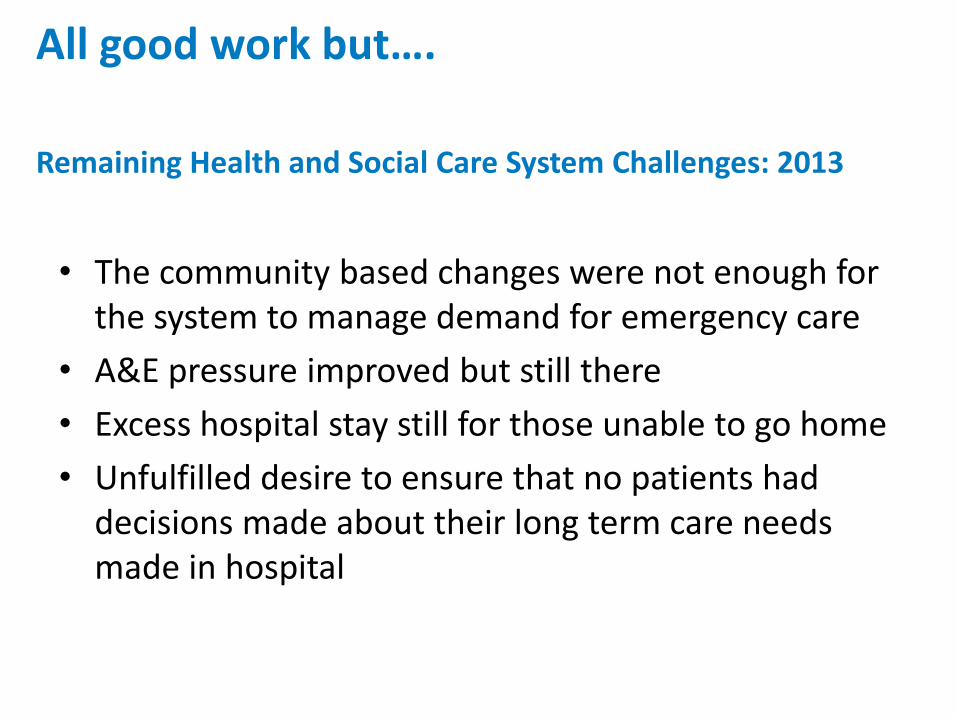
• The community based changes were not enough for the system to manage demand for emergency care
• A&E pressure improved but still there
• Excess hospital stay still for those unable to go home
• Unfulfilled desire to ensure that no patients had decisions made about their long term care needs made in hospital
Remaining Health and Social Care System Challenges: 2013
All good work but….
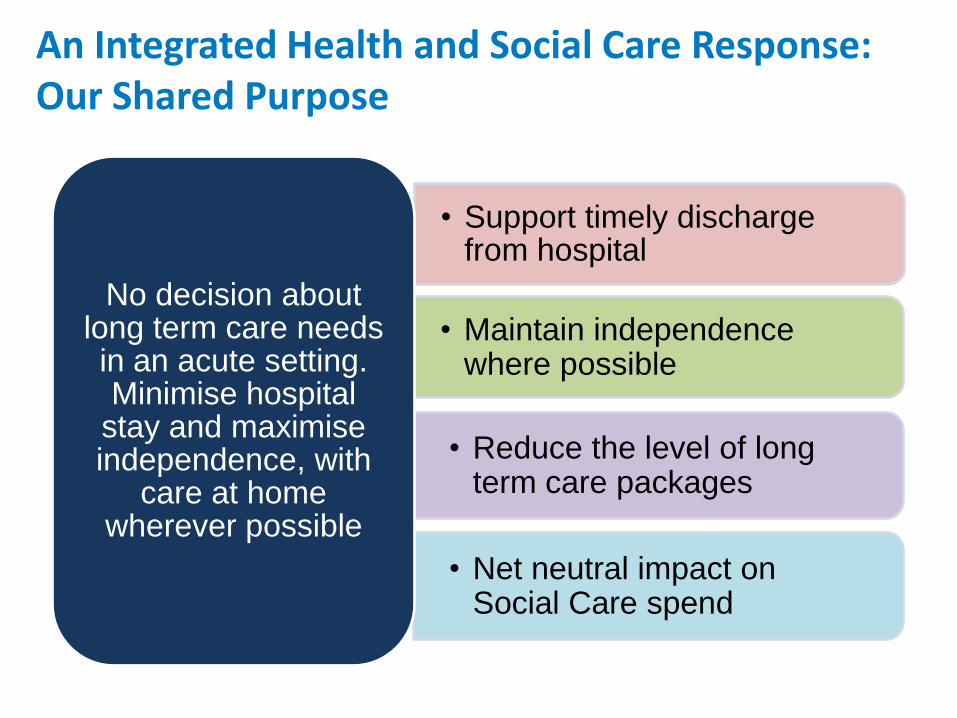
• Net neutral impact on Social Care spend
• Reduce the level of long term care packages
• Maintain independence where possible
• Support timely discharge from hospital
No decision about long term care needs in an acute setting. Minimise hospital
stay and maximise independence, with
care at home wherever possible
An Integrated Health and Social Care Response:Our Shared Purpose
• Benefits don’t always accrue to where the cost is incurred
• Commissioner cost is not the same as provider cost
• Risk share and gain share needs to be fully explored
Shared Understanding of Risk to be Managed
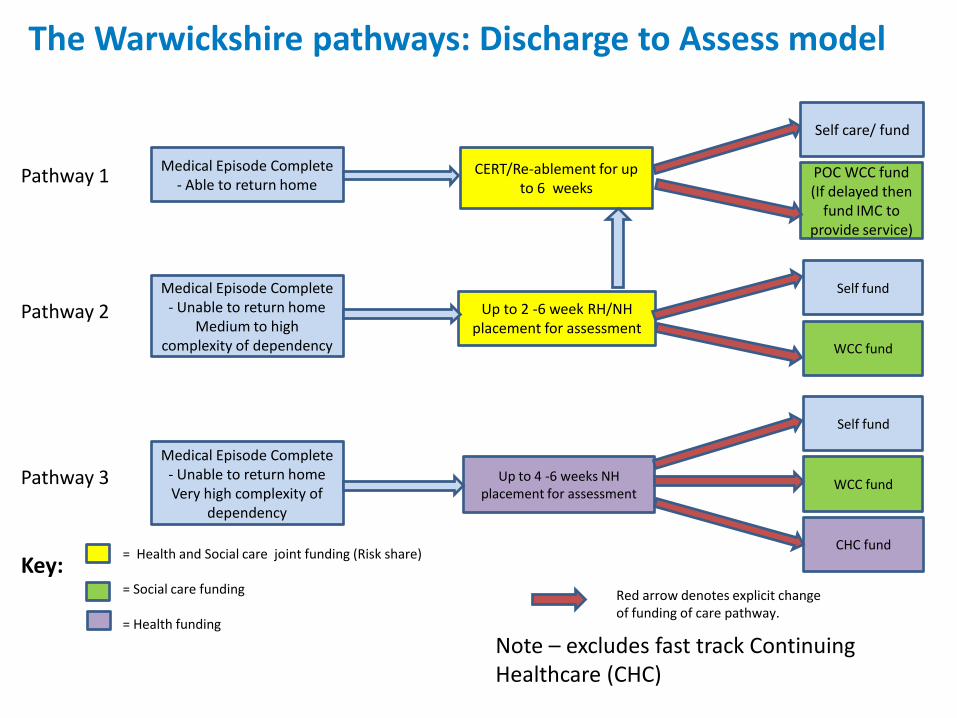
Pathway 3
Pathway 2
Medical Episode Complete - Unable to return homeVery high complexity of
dependency
Up to 4 -6 weeks NH placement for assessment
Self fund
WCC fund
CHC fund= Health and Social care joint funding (Risk share)
= Social care funding
= Health funding
Note – excludes fast track Continuing Healthcare (CHC)
Medical Episode Complete - Unable to return home
Medium to high complexity of dependency
Up to 2 -6 week RH/NH placement for assessment
Self fund
WCC fund
Red arrow denotes explicit change of funding of care pathway.
Medical Episode Complete - Able to return home
CERT/Re-ablement for up to 6 weeks
POC WCC fund (If delayed then
fund IMC to provide service)
Self care/ fund
Pathway 1
Key:
The Warwickshire pathways: Discharge to Assess model
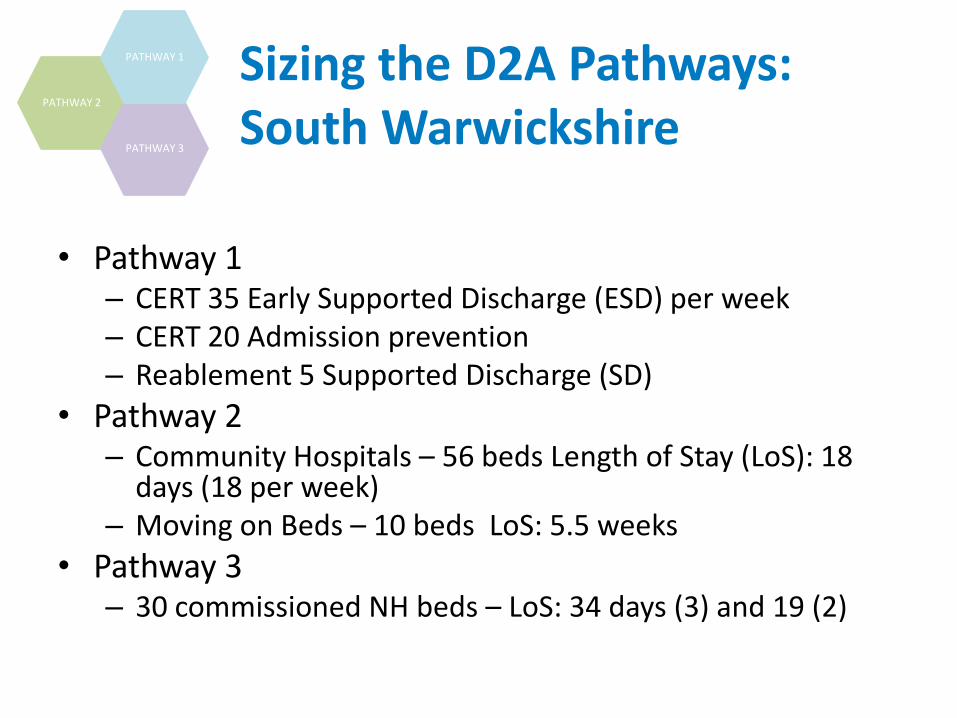
• Pathway 1– CERT 35 Early Supported Discharge (ESD) per week– CERT 20 Admission prevention– Reablement 5 Supported Discharge (SD)
• Pathway 2– Community Hospitals – 56 beds Length of Stay (LoS): 18
days (18 per week)– Moving on Beds – 10 beds LoS: 5.5 weeks
• Pathway 3– 30 commissioned NH beds – LoS: 34 days (3) and 19 (2)
PATHWAY 2
PATHWAY 3
PATHWAY 1 Sizing the D2A Pathways: South Warwickshire
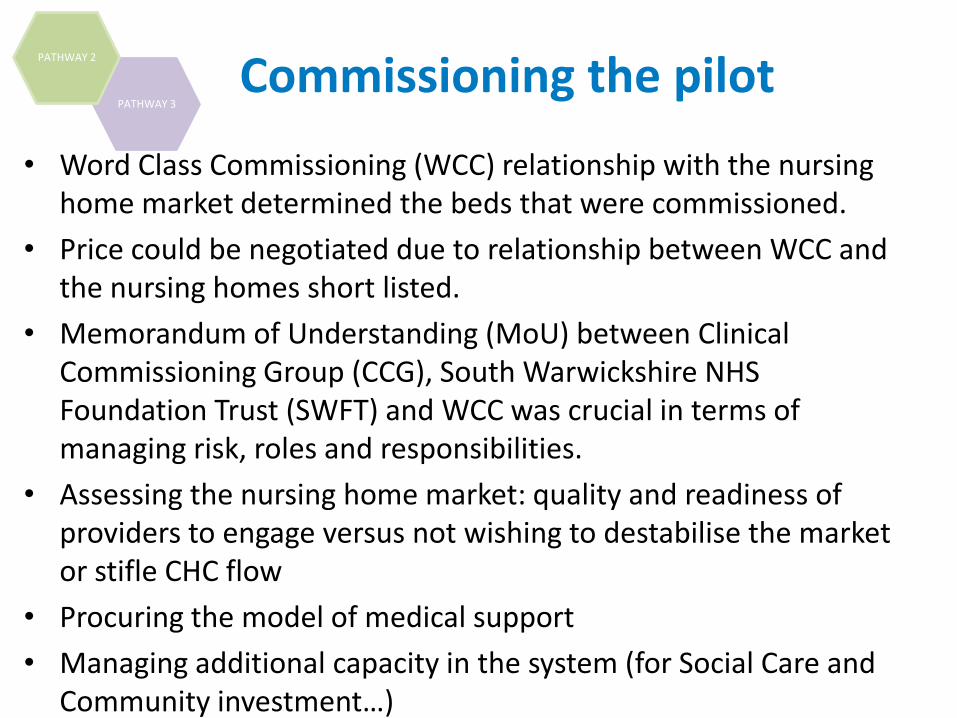
• Word Class Commissioning (WCC) relationship with the nursing home market determined the beds that were commissioned.
• Price could be negotiated due to relationship between WCC and the nursing homes short listed.
• Memorandum of Understanding (MoU) between Clinical Commissioning Group (CCG), South Warwickshire NHS Foundation Trust (SWFT) and WCC was crucial in terms of managing risk, roles and responsibilities.
• Assessing the nursing home market: quality and readiness of providers to engage versus not wishing to destabilise the market or stifle CHC flow
• Procuring the model of medical support
• Managing additional capacity in the system (for Social Care and Community investment…)
PATHWAY 3
PATHWAY 2
Commissioning the pilot
Early days to assess full impact
Three areas of measures:
• Cost and Flow
• Quality
• Culture
Emerging D2A Outcomes
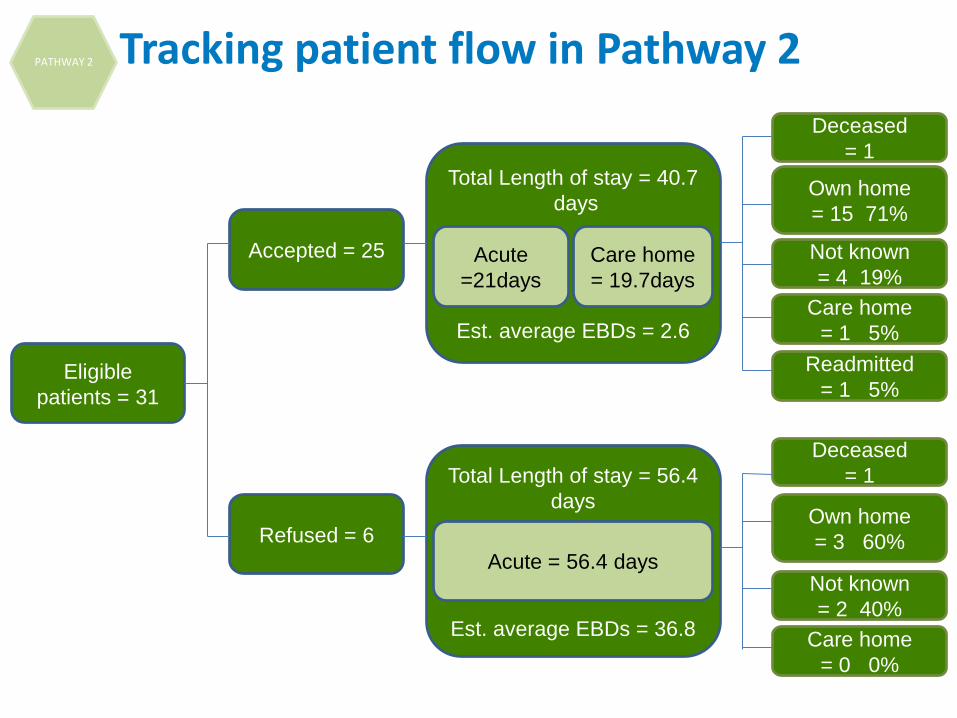
Eligible
patients = 31
Accepted = 25
Refused = 6
Total Length of stay = 40.7
days
Est. average EBDs = 2.6
Total Length of stay = 56.4
days
Est. average EBDs = 36.8
Acute
=21days
Acute = 56.4 days
Care home
= 19.7days
Deceased
= 1
Care home
= 0 0%
Own home
= 3 60%
Not known
= 2 40%
Deceased
= 1
Care home
= 1 5%
Own home
= 15 71%
Not known
= 4 19%
Readmitted
= 1 5%
PATHWAY 2 Tracking patient flow in Pathway 2
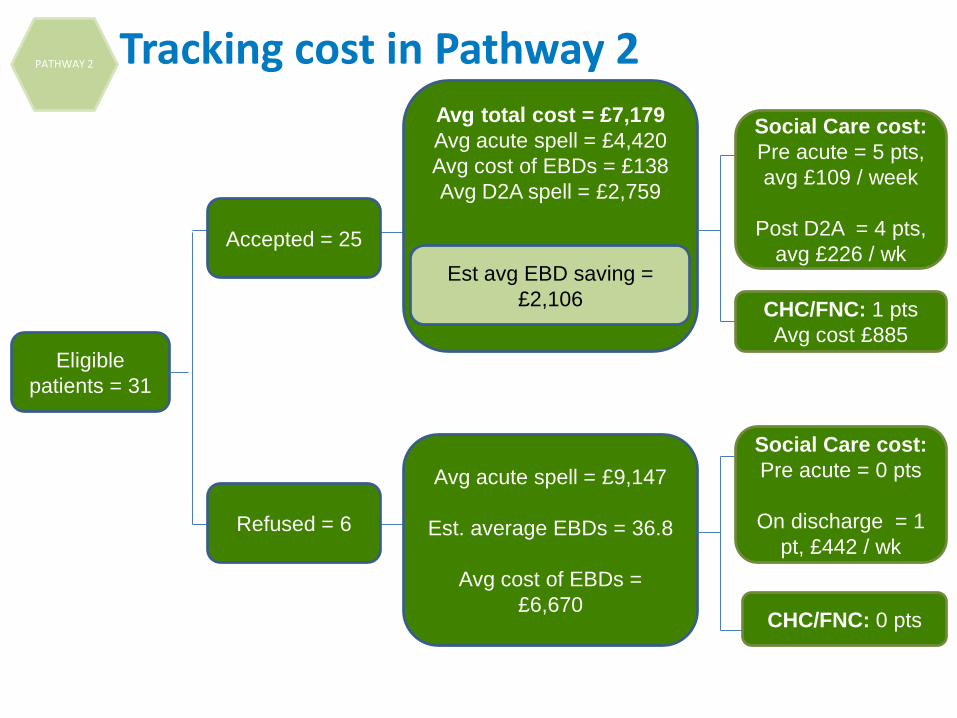
Eligible
patients = 31
Accepted = 25
Refused = 6
Avg total cost = £7,179
Avg acute spell = £4,420
Avg cost of EBDs = £138
Avg D2A spell = £2,759
Avg acute spell = £9,147
Est. average EBDs = 36.8
Avg cost of EBDs =
£6,670
Social Care cost:
Pre acute = 5 pts,
avg £109 / week
Post D2A = 4 pts,
avg £226 / wk
CHC/FNC: 1 pts
Avg cost £885
Est avg EBD saving =
£2,106
Social Care cost:
Pre acute = 0 pts
On discharge = 1
pt, £442 / wk
CHC/FNC: 0 pts
PATHWAY 2 Tracking cost in Pathway 2
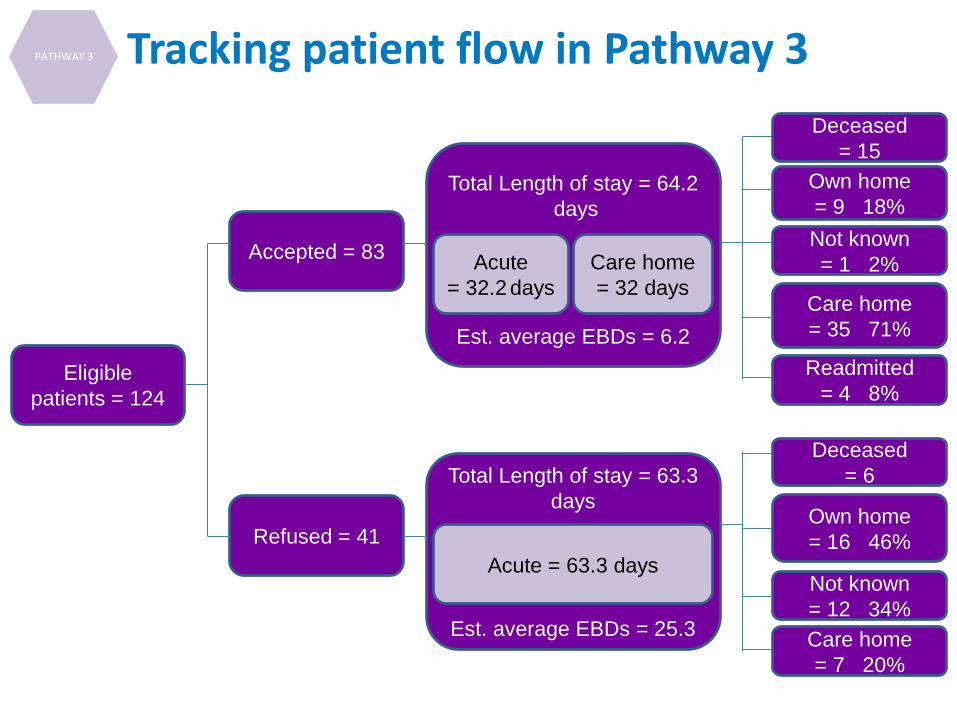
Eligible
patients = 124
Accepted = 83
Refused = 41
Total Length of stay = 64.2
days
Est. average EBDs = 6.2
Total Length of stay = 63.3
days
Est. average EBDs = 25.3
Acute
= 32.2 days
Acute = 63.3 days
Care home
= 32 days
Deceased
= 6
Care home
= 7 20%
Own home
= 16 46%
Not known
= 12 34%
Deceased
= 15
Care home
= 35 71%
Own home
= 9 18%
Not known
= 1 2%
Readmitted
= 4 8%
PATHWAY 3 Tracking patient flow in Pathway 3
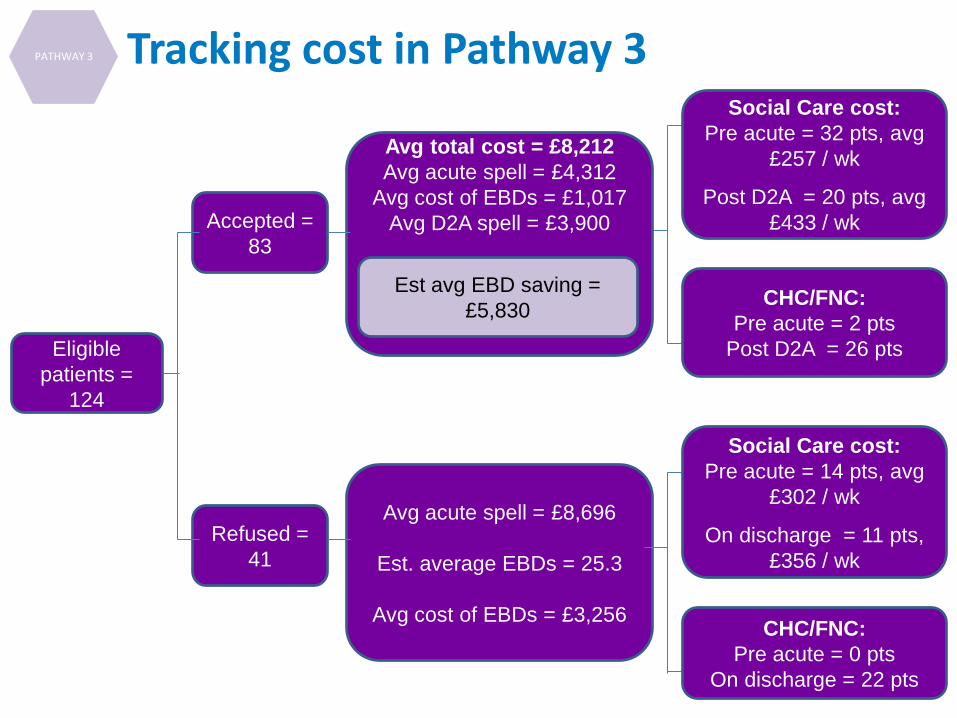
Eligible
patients =
124
Accepted =
83
Refused =
41
Avg total cost = £8,212
Avg acute spell = £4,312
Avg cost of EBDs = £1,017
Avg D2A spell = £3,900
Avg acute spell = £8,696
Est. average EBDs = 25.3
Avg cost of EBDs = £3,256
Est avg EBD saving =
£5,830
CHC/FNC:
Pre acute = 0 pts
On discharge = 22 pts
Social Care cost:
Pre acute = 14 pts, avg
£302 / wk
On discharge = 11 pts,
£356 / wk
Social Care cost:
Pre acute = 32 pts, avg
£257 / wk
Post D2A = 20 pts, avg
£433 / wk
CHC/FNC:
Pre acute = 2 pts
Post D2A = 26 pts
PATHWAY 3 Tracking cost in Pathway 3
• CHC – early days but the increase in CHC spend on new CHC patient has been halted (but not yet reversed)
• WCC – Admission to residential care has decreased slightly over the past 12 months (P1 & 2 and early discharge will give real benefit here)
• Total length of stay is not increased by the Discharge to Assess (D2A) pathway
PATHWAY 2
PATHWAY 3
PATHWAY 1
Emerging Cost and Flow 2014
• System– Quality metrics for Hospital mortality and harm have
improved– Urgent care system has functioned all Winter
• Patient Experience– Less patient ward moves– Positive patient stories
• Staff Experience– Staff survey results amongst the best in the country– Positive staff stories
PATHWAY 2
PATHWAY 3
PATHWAY 1
Emerging Quality Outcomes 2014
• The close working relationships between WCC commissioners, providers and the CCG have helped make D2A a success. Constructive challenge!
• This will be a long journey: early indications are less blame of other sectors for system pressure, more proactive working together.
• The nursing home market is keen to engage with new initiatives such as D2A – and this is not just based on cost!
• GPs involved have reported being excited about the potential to make a real impact on pathway 2 patients
Trusted Assessment
PATHWAY 2
PATHWAY 3
PATHWAY 1
Culture
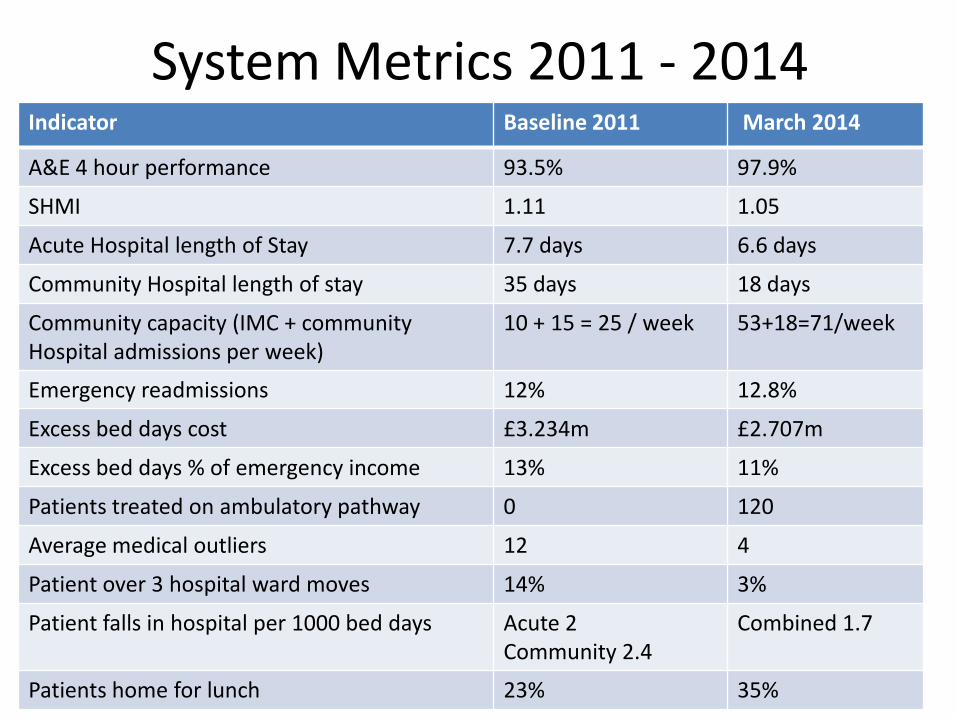
System Metrics 2011 - 2014Indicator Baseline 2011 March 2014
A&E 4 hour performance 93.5% 97.9%
SHMI 1.11 1.05
Acute Hospital length of Stay 7.7 days 6.6 days
Community Hospital length of stay 35 days 18 days
Community capacity (IMC + community Hospital admissions per week)
10 + 15 = 25 / week 53+18=71/week
Emergency readmissions 12% 12.8%
Excess bed days cost £3.234m £2.707m
Excess bed days % of emergency income 13% 11%
Patients treated on ambulatory pathway 0 120
Average medical outliers 12 4
Patient over 3 hospital ward moves 14% 3%
Patient falls in hospital per 1000 bed days Acute 2Community 2.4
Combined 1.7
Patients home for lunch 23% 35%