OTP Bank Plc. Consolidated Financial Statements and ...
171
OTP Bank Plc. Consolidated Financial Statements and Jndependent Auditor 's Report December 31, 2020
Transcript of OTP Bank Plc. Consolidated Financial Statements and ...
OTP Bank Plc.
Consolidated Financial Statements
and
Jndependent Auditor 's Report
December 31, 2020
Deloitte.
INDEPENDENT AUDITOR'S REPORT
To the Shareholders of OTP Bank Plc.
Report on the Audit ofthe Consolidated Financial Statements
Opinion
Deloitte Auditing and Consulting Ltd. H-1 068 Budapest, Dózsa Györgf út 84/C. Hungary H-1438 Budapest, P.O.Box 471 , Hungary
Phone: + 36 (1) 428-6800 Fax: +36 (1) 428-6801 www.deloitte.hu
Registered by the Capital Court of Registration Company Registration Number: 01-09-071057
We have audited the consolidated financial statements of OTP Bank Plc. (the "Bank") and its subsidiaries (the "Group") for the year 2020 which comprise the consolidated statement of financial position as at December 31, 2020 - which shows total assets of HUF 23,335,841 million - , the related consolidated statement of profit or loss and the consolidated statement of comprehensive income - which shows a net profit for the period of HUF 259,636 million - , consolidated statement of changes in equity, and the consolidated statement of cash-flows for the year then ended, and notes to the consolidated financial statements, including a surnmary of significant accounting policies.
ln our opinion, the accompanying consolidated financial statements give a true and fair view of the consolidated financial position of the Group as at December 31, 2020 and of its consolidated financial performance and its consolidated cash-flows for the year then ended in accordance with International Financial Reporting Standards as adopted by the European Union (the "EU IFRS"), and the consolidated financial statements were prepared in all material respects in accordance with the provisions ofthe effective Hungarian Act C of 2000 on Accounting (the "Accounting Act") relevant to the entities preparing consolidated financial statements in accordance with EU IFRS.
Basis f or Opinion
We conducted our audit in accordance with the Hungarian National Standards on Auditing and the effective Hungarian laws and other regulations on audits. Our responsibilities under these standards are further described in the "The Auditor's Responsibilities for the Audit of the Consolidated Financial Statements" section of our report.
We are independent of the Group in compliance with the relevant effective Hungarian regulations and the "Rules of conduct ( ethical rules) of the auditor profession and the disciplinary process" of the Chamber of Hungarian Auditors and, in respect of matters not regulated therein, the Code of Ethics for Professional Accountants (including Intemational Independence Standards) issued by the Intemational Ethics Standards Board for Accountants (the IESBA Code), and we have fulfilled our other ethical responsibilities in accordance with the same ethical requirements.
We believe that the audit evidence we have obtained is sufficient and appropriate to provide a hasis for our opinion.
Key Audit Matters
Key audit matters are those matters that, in our professional judgement, were of most significance in our audit of the consolidated financial statements of the current period. These matters were addressed in the context of our audit of the consolidated financial statements as a whole, and in forming our opinion thereon, and we do not provide a separate opinion on these matters.
1/6
2/6
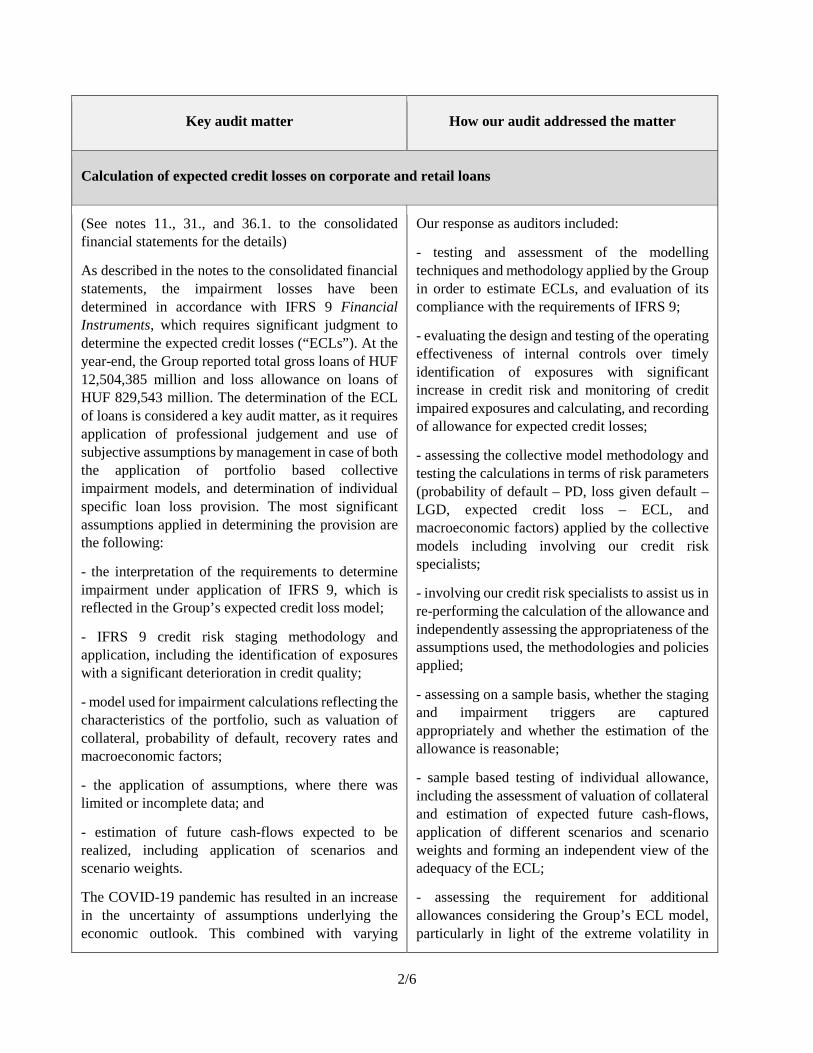
Key audit matter How our audit addressed the matter
Calculation of expected credit losses on corporate and retail loans
(See notes 11., 31., and 36.1. to the consolidated financial statements for the details)
As described in the notes to the consolidated financial statements, the impairment losses have been determined in accordance with IFRS 9 Financial Instruments, which requires significant judgment to determine the expected credit losses (“ECLs”). At the year-end, the Group reported total gross loans of HUF 12,504,385 million and loss allowance on loans of HUF 829,543 million. The determination of the ECL of loans is considered a key audit matter, as it requires application of professional judgement and use of subjective assumptions by management in case of both the application of portfolio based collective impairment models, and determination of individual specific loan loss provision. The most significant assumptions applied in determining the provision are the following:
- the interpretation of the requirements to determine impairment under application of IFRS 9, which is reflected in the Group’s expected credit loss model;
- IFRS 9 credit risk staging methodology and application, including the identification of exposures with a significant deterioration in credit quality;
- model used for impairment calculations reflecting the characteristics of the portfolio, such as valuation of collateral, probability of default, recovery rates and macroeconomic factors;
- the application of assumptions, where there was limited or incomplete data; and
- estimation of future cash-flows expected to be realized, including application of scenarios and scenario weights.
The COVID-19 pandemic has resulted in an increase in the uncertainty of assumptions underlying the economic outlook. This combined with varying
Our response as auditors included:
- testing and assessment of the modelling techniques and methodology applied by the Group in order to estimate ECLs, and evaluation of its compliance with the requirements of IFRS 9;
- evaluating the design and testing of the operating effectiveness of internal controls over timely identification of exposures with significant increase in credit risk and monitoring of credit impaired exposures and calculating, and recording of allowance for expected credit losses;
- assessing the collective model methodology and testing the calculations in terms of risk parameters (probability of default – PD, loss given default – LGD, expected credit loss – ECL, and macroeconomic factors) applied by the collective models including involving our credit risk specialists;
- involving our credit risk specialists to assist us in re-performing the calculation of the allowance and independently assessing the appropriateness of the assumptions used, the methodologies and policies applied;
- assessing on a sample basis, whether the staging and impairment triggers are captured appropriately and whether the estimation of the allowance is reasonable;
- sample based testing of individual allowance, including the assessment of valuation of collateral and estimation of expected future cash-flows, application of different scenarios and scenario weights and forming an independent view of the adequacy of the ECL;
- assessing the requirement for additional allowances considering the Group’s ECL model, particularly in light of the extreme volatility in
3/6
government responses, has raised the complexity of assessing and monitoring customers' financial health, necessitating an elevated level of judgement required by the Group in calculating the ECL.
economic scenarios caused by the current COVID-19 pandemic and government responses;
- testing of loan facilities to customers in industries significantly impacted by the pandemic;
- performing loan portfolio analysis to identify unexpected or anti-trend movements in the loan portfolio regarding stage migration and loss allowance movements; and
- assessing the adequacy of the disclosures in the consolidated financial statements.
Other Information
Other information comprises the information included in the section called “Management’s Analysis” of the annual report and the consolidated business report of the Group which we obtained prior to the date of this auditor’s report, and the sections called “Message to the shareholders”, “Corporate Governance” and “Macroeconomic and financial environment in 2020” of the annual report, which is expected to be made available to us after that date, but does not include the consolidated financial statements and our independent auditor’s report thereon. Management is responsible for the other information and for the preparation of the consolidated business report in accordance with the relevant provisions of the Accounting Act and other regulations. Our opinion on the consolidated financial statements provided in the section of our independent auditor’s report entitled "Opinion" does not apply to the other information.
Our responsibility in connection with our audit of the consolidated financial statements is to read the other information identified above and, in doing so, consider whether the other information is materially inconsistent with the consolidated financial statements or our knowledge obtained in the audit or otherwise appears to be materially misstated.
Furthermore, in accordance with the Accounting Act, our responsibilities regarding the consolidated business report also include reviewing the consolidated business report to assess whether the consolidated business report was prepared in accordance with the relevant provisions of the Accounting Act and other regulations, if any, including the assessment whether the consolidated business report complies with the requirements of Section 95/B (2) e) and f) of the Accounting Act, and to express an opinion on the above and on whether the consolidated business report is consistent with the consolidated financial statements. Furthermore, in accordance with the Accounting Act we shall make a statement whether the information referred to in Section 95/B. (2) a)-d), g) and h) has been provided in the consolidated business report, and whether the consolidated business report contains the non-financial statement provided for in Section 134 (5).
In our opinion, the consolidated business report of the Group for 2020 corresponds to the consolidated financial statements of the Group for 2020 and the relevant provisions of the Accounting Act in all material respects. The information referred to in Section 95/B. (2) a)-d), g) and h) of the Accounting Act has been provided and the consolidated business report contains the non-financial statement provided for in Section 134 (5).
As the Group is not subject to additional requirements under any other regulation in connection with the consolidated business report, we have not formulated an opinion on this matter.

4/6
In addition to the above, based on the information obtained about the Group and its environment, we must report on whether we became aware of any material misstatements in the other information and, if so, on the nature of such material misstatements. We have nothing to report in this regard.
When we read the sections of the annual report, which had not yet been made available to us at the date of this report, if we conclude that there is a material misstatement therein, we are required to communicate the matter to those charged with governance.
Responsibilities of management and those charged with governance for the consolidated financial statements
Management is responsible for the preparation and fair presentation of the consolidated financial statements in accordance with the International Financial Reporting Standards as adopted by the European Union, and for such internal control as management determines is necessary to enable the preparation of consolidated financial statements that are free from material misstatement, whether due to fraud or error.
In preparing the consolidated financial statements, management is responsible for assessing the Group’s ability to continue as a going concern, disclosing, as applicable, matters related to going concern and using the going concern basis of accounting unless management either intends to liquidate the Group or to cease operations, or has no realistic alternative but to do so.
Those charged with governance are responsible for overseeing the Group's financial reporting process. The Auditor’s Responsibilities for the Audit of the Consolidated Financial Statements Our objectives during the audit are to obtain reasonable assurance about whether the consolidated financial statements as a whole are free from material misstatement, whether due to fraud or error, and to issue, on the basis of the above, an auditor’s report that includes our opinion. Reasonable assurance is a high level of assurance, but is not a guarantee that an audit conducted in accordance with the Hungarian National Standards on Auditing and the effective Hungarian laws and other regulations on audits will always detect a material misstatement when it exists. Misstatements can arise from fraud or error, and they are considered material if, individually or in the aggregate, they could reasonably be expected to influence the economic decisions of users taken on the basis of these consolidated financial statements.
As part of an audit in accordance with the Hungarian National Standards on Auditing and the effective Hungarian laws and other regulations on audits, we exercise professional judgement and maintain professional scepticism throughout the audit. We also:
• Identify and assess the risks of material misstatement of the consolidated financial statements, whether due to fraud or error, design and perform audit procedures responsive to those risks, and obtain audit evidence that is sufficient and appropriate to provide a basis for our opinion. The risk of not detecting a material misstatement resulting from fraud is higher than for one resulting from error, as fraud may involve collusion, forgery, intentional omissions, misrepresentations, or the override of internal control.
• Obtain an understanding of internal control relevant to the audit in order to design audit procedures that are appropriate in the circumstances, but not for the purpose of expressing an opinion on the effectiveness of the Group's internal control.
• Evaluate the appropriateness of accounting policies used and the reasonableness of accounting estimates and related disclosures made by management.
• Conclude on the appropriateness of management’s use of the going concern basis of accounting and, based on the audit evidence obtained, whether a material uncertainty exists related to events

5/6
or conditions that may cast significant doubt on the Group's ability to continue as a going concern. If we conclude that a material uncertainty exists, we are required to draw attention in the auditor’s report to the related disclosures in the consolidated financial statements or, if such disclosures are inadequate, to modify the opinion. Our conclusions are based on the audit evidence obtained up to the date of our auditor’s report. However, future events or conditions may cause the Group to cease to continue as a going concern.
• Evaluate the overall presentation, structure and content of the consolidated financial statements, including the notes to the consolidated financial statements, and whether the consolidated financial statements represent the underlying transactions and events in a manner that achieves fair presentation.
• Obtain sufficient appropriate audit evidence regarding the financial information of the entities or business activities within the Group to express an opinion on the consolidated financial statements. We are responsible for the direction, supervision and performance of the group audit. We remain solely responsible for our audit opinion.
We communicate with those charged with governance regarding, among other matters, the planned scope and timing of the audit and significant audit findings, including any significant deficiencies in the Group's internal control that we identify during the audit. We also provide those charged with governance with a statement that we have complied with relevant ethical requirements regarding independence, and to communicate with them all relationships and other matters that may reasonably be thought to bear on our independence, and where applicable, related safeguards. From the matters communicated with those charged with governance, we determine those matters that were of most significance in the audit of the consolidated financial statements of the current period and are therefore the key audit matters. We describe these matters in our auditor’s report unless law or regulation precludes public disclosure about the matter or when, in extremely rare circumstances, we determine that a matter should not be communicated in our report because the adverse consequences of doing so would reasonably be expected to outweigh the public interest benefits of such communication. Report on Other Legal and Regulatory Requirements In compliance with Article 10 (2) of Regulation (EU) No. 537/2014 of the European Parliament and the Council, we provide the following information in our independent auditor’s report, which is required in addition to the requirements of International Standards on Auditing: Appointment of the Auditor and the Period of Engagement We were appointed as the auditors of OTP Bank Plc. on April 30, 2020 and our uninterrupted engagement has lasted for 28 years. Consistence with the Additional Report to the Audit Committee We confirm that our audit opinion on the consolidated financial statements expressed herein is consistent with the additional report to the Audit Committee of OTP Bank Plc., which we issued on March 17, 2021 in accordance with Article 11 of Regulation (EU) No. 537/2014 of the European Parliament and the Council. Provision of Non-audit Services We declare that no prohibited non-audit services referred to in Article 5 (1) of Regulation (EU) No. 537/2014 of the European Parliament and the Council were provided by us to the Group. In addition, there are no other non-audit services, which were provided by us to the OTP Bank Plc. and its controlled undertakings which have not been disclosed in the consolidated business report.

The engagement partner on the audit resulting in this independent auditor' s report is the statutory registered auditor signing this report.
Budapest, March 17, 2021
..... J.~.~~~„ ................ . Horváth Tamás
on behalf of Deloitte Auditing and Consulting Ltd. and as statutory registered auditor
Deloitte Auditing and Consulting Ltd. 1068 Budapest, Dózsa György út 84/C. Registration number: 000083
Registration number of statutory registered auditor: 003449
616

Annex 1
OTP BANK PLC.
CONSOLIDATED FINANCIAL STATEMENTS
IN ACCORDANCE WITH
INTERNATIONAL FINANCIAL REPORTING
STANDARDS AS ADOPTED BY THE EUROPEAN UNION AND
INDEPENDENT AUDITORS’ REPORT
FOR THE YEAR ENDED
31 DECEMBER 2020
TABLE OF CONTENT
CONSOLIDATED STATEMENT OF FINANCIAL POSITION AS AT 31 DECEMBER 2020 ......................... 4
CONSOLIDATED STATEMENT OF PROFIT OR LOSS FOR THE YEAR ENDED 31 DECEMBER 2020 ... 5
CONSOLIDATED STATEMENT OF COMPREHENSIVE INCOME FOR THE YEAR ENDED 31
DECEMBER 2020 .................................................................................................................................................. 6
CONSOLIDATED STATEMENT OF CHANGES IN EQUITY FOR THE YEAR ENDED 31 DECEMBER
2020 ........................................................................................................................................................................ 7
CONSOLIDATED STATEMENT OF CASH-FLOWS FOR THE YEAR ENDED 31 DECEMBER 2020 ......... 8
CONSOLIDATED STATEMENT OF CASH-FLOWS FOR THE YEAR ENDED 31 DECEMBER 2020 ......... 9
NOTE 1: ORGANIZATION AND BASIS OF CONSOLIDATED FINANCIAL STATEMENTS .......... 10
1.1. General information ..................................................................................................................... 10
1.2. Basis of Accounting ..................................................................................................................... 10
NOTE 2: SUMMARY OF SIGNIFICANT ACCOUNTING POLICIES ................................................... 12
2.1. Basis of Presentation.................................................................................................................... 12
2.2. Foreign currency translation ........................................................................................................ 12
2.3. Principles of consolidation........................................................................................................... 13
2.4. Accounting for acquisitions ......................................................................................................... 13
2.5. Securities at amortized cost ......................................................................................................... 14
2.6. Financial assets at fair value through profit or loss ..................................................................... 14
2.7. Hedge accounting ........................................................................................................................ 16
2.8. Offsetting ..................................................................................................................................... 17
2.9. Embedded derivatives .................................................................................................................. 17
2.10. Securities at fair value through other comprehensive income ..................................................... 17
2.11. Loans, placements with other banks, repo receivables and loss allowance for loan and
placements and repo receivable losses ......................................................................................... 18
2.12. Modified assets ............................................................................................................................ 19
2.13. Purchased or originated credit impaired financial assets ............................................................. 19
2.14. Loss allowance ............................................................................................................................ 20
2.15. Sale and repurchase agreements, security lending ....................................................................... 22
2.16. Associates and other investments ................................................................................................ 22
2.17. Property and equipment, Intangible assets ................................................................................... 23
2.18. Inventories ................................................................................................................................... 23
2.19. Financial liabilities....................................................................................................................... 24
2.20. Leases .......................................................................................................................................... 24
2.21. Investment properties ................................................................................................................... 25
2.22. Share capital ................................................................................................................................ 25
2.23. Treasury shares ............................................................................................................................ 25
2.24. Non-current assets held-for-sale and discontinued operations .................................................... 26
2.25. Interest income and income similar to interest income and interest expense .............................. 26
2.26. Fees and Commissions ................................................................................................................ 26
2.27. Dividend income .......................................................................................................................... 27
2.28. Income tax ................................................................................................................................... 27
2.29. Banking tax .................................................................................................................................. 27
2.30. Off-balance sheet commitments and contingent liabilities .......................................................... 27
2.31. Share-based payment ................................................................................................................... 28
2.32. Employee benefits ...................................................................................................................... 28
2.33. Consolidated Statement of Cash-flows ....................................................................................... 28
2.34. Segment reporting ....................................................................................................................... 28
2.35. Comparative figures..................................................................................................................... 28
NOTE 3: SIGNIFICANT ACCOUNTING ESTIMATES AND DECISIONS IN THE APPLICATION OF
ACCOUNTING POLICIES ........................................................................................................ 32
3.1. Loss allowances on financial instruments exposed to credit risk ................................................. 32
3.2. Valuation of instruments without direct quotations ..................................................................... 32
3.3. Provisions .................................................................................................................................... 32
3.4. Impairment on goodwill .............................................................................................................. 33
3.5. Business model ............................................................................................................................ 33
NOTE 4: IMPACT OF CORONA VIRUS ( COVID-19) .......................................................................... 34
NOTE 5: CASH, AMOUNTS DUE FROM BANKS AND BALANCES WITH THE NATIONAL
BANKS (in HUF mn) .................................................................................................................. 41
NOTE 6: PLACEMENTS WITH OTHER BANKS, NET OF LOSS ALLOWANCE FOR PLACEMENTS
(in HUF mn) ................................................................................................................................ 41
NOTE 7: REPO RECEIVABLES (in HUF mn) ......................................................................................... 42
NOTE 8: FINANCIAL ASSETS AT FAIR VALUE THROUGH PROFIT OR LOSS (in HUF mn) ....... 43
NOTE 9: SECURITIES AT FAIR VALUE THROUGH OTHER COMPREHENSIVE INCOME (in HUF
mn) ............................................................................................................................................... 46
NOTE 10: SECURITIES AT AMORTIZED COST (in HUF mn) ............................................................... 48
NOTE 11: LOANS AT AMORTIZED COST AND AT FAIR VALUE (in HUF mn) ................................ 50
NOTE 12: A SSOCIATES AND OTHER INVESTMENTS (in HUF mn) .................................................. 52
NOTE 13: PROPERTY, EQUIPMENT AND INTANGIBLE ASSETS (in HUF mn) ................................ 53
NOTE 14: INVESTMENT PROPERTIES (in HUF mn) .............................................................................. 60
NOTE 15: POSITIVE FAIR VALUE OF DERIVATIVE FINANCIAL ASSETS DESIGNATED AS
HEDGE ACCOUNTING (in HUF mn) ....................................................................................... 62
NOTE 16: OTHER ASSETS (in HUF mn) ................................................................................................... 62
NOTE 17: AMOUNTS DUE TO BANKS, THE NATIONAL GOVERNMENTS, DEPOSITS FROM THE
NATIONAL BANKS AND OTHER BANKS (in HUF mn) ...................................................... 63
NOTE 18: REPO LIABILITIES (in HUF mn) ............................................................................................. 64
NOTE 19: FINANCIAL LIABILITIES DESIGNATED AT FAIR VALUE THROUGH PROFIT OR LOSS
(in HUF mn) ................................................................................................................................ 64
NOTE 20: DEPOSITS FROM CUSTOMERS (in HUF mn) ........................................................................ 65
NOTE 21: LIABILITIES FROM ISSUED SECURITIES (in HUF mn) ...................................................... 66
NOTE 22: DERIVATIVE FINANCIAL LIABILITIES HELD FOR TRADING (in HUF mn) .................. 71
NOTE 23: NEGATIVE FAIR VALUE OF DERIVATIVE FINANCIAL LIABILITIES DESIGNATED AS
HEDGE ACCOUNTING (in HUF mn) ....................................................................................... 71
NOTE 24: OTHER LIABILITIES (in HUF mn) .......................................................................................... 71
NOTE 25: SUBORDINATED BONDS AND LOANS (in HUF mn) .......................................................... 73
NOTE 26: SHARE CAPITAL (in HUF mn) ................................................................................................. 75
NOTE 27: RETAINED EARNINGS AND RESERVES (in HUF mn) ........................................................ 75
NOTE 28: TREASURY SHARES (in HUF mn) .......................................................................................... 78
NOTE 29: NON-CONTROLLING INTEREST (in HUF mn) ..................................................................... 78
NOTE 30: INTEREST INCOME, INCOME SIMILAR TO INTEREST INCOME AND ......................... 79
EXPENSE (in HUF mn) .............................................................................................................. 79
NOTE 31: LOSS ALLOWANCES / IMPAIRMENT AND PROVISIONS (in HUF mn) ........................... 80
NOTE 32: NET PROFIT FROM FEES AND COMMISSIONS (in HUF mn) ............................................ 81
NOTE 33: OTHER OPERATING INCOME AND EXPENSES AND OTHER ADMINISTRATIVE
EXPENSES (in HUF mn) ............................................................................................................ 83
NOTE 34: INCOME TAXES (in HUF mn) .................................................................................................. 85
NOTE 35: LEASE (in HUF mn) ................................................................................................................... 87
NOTE 36: FINANCIAL RISK MANAGEMENT (in HUF mn) .................................................................. 90
36.1. Credit risk .................................................................................................................................... 90
36.2. Maturity analysis of assets, liabilities and liquidity risk ............................................................ 105
36.3. Net foreign currency position and foreign currency risk ........................................................... 110
36.4. Interest rate risk management .................................................................................................... 110
36.5. Market risk ................................................................................................................................. 115
36.6. Capital management .................................................................................................................. 118
NOTE 37: RECLASSIFICATION AND TRANSFER OF FINANCIAL INSTRUMENTS ...................... 120
(in HUF mn) .............................................................................................................................. 120
NOTE 38: OFF-BALANCE SHEET ITEMS AND DERIVATIVE FINANCIAL INSTRUMENTS (in HUF
mn) ............................................................................................................................................. 121
NOTE 39: SHARE-BASED PAYMENTS AND EMPLOYEE BENEFITS (in HUF mn) ........................ 123
NOTE 40: RELATED PARTY TRANSACTIONS (in HUF mn) .............................................................. 128
NOTE 41: ACQUISITION (in HUF mn) .................................................................................................... 131
NOTE 42: SIGNIFICANT SUBSIDIARIES AND ASSOCIATES (in HUF mn) ...................................... 136
NOTE 43: TRUST ACTIVITIES (in HUF mn) .......................................................................................... 137
NOTE 44: CONCENTRATION OF ASSETS AND LIABILITIES ........................................................... 138
NOTE 45: EARNINGS PER SHARE (in HUF mn) .................................................................................. 138
NOTE 46: NET GAIN OR LOSS REALIZED ON FINANCIAL INSTRUMENTS (in HUF mn) ........... 140
NOTE 47: FAIR VALUE OF FINANCIAL INSTRUMENTS (in HUF mn) ............................................. 142
NOTE 48: SEGMENT REPORTING BY BUSINESS AND GEOGRAPHICAL SEGMENTS ............... 158
(in HUF mn) ............................................................................................................................ 158
NOTE 49: DISCONTINUED OPERATIONS (in HUF mn) ...................................................................... 162
NOTE 50: SIGNIFICANT EVENTS DURING THE YEAR ENDED 31 DECEMBER 2020 .................. 163
NOTE 51: POST BALANCE SHEET EVENTS ........................................................................................ 163
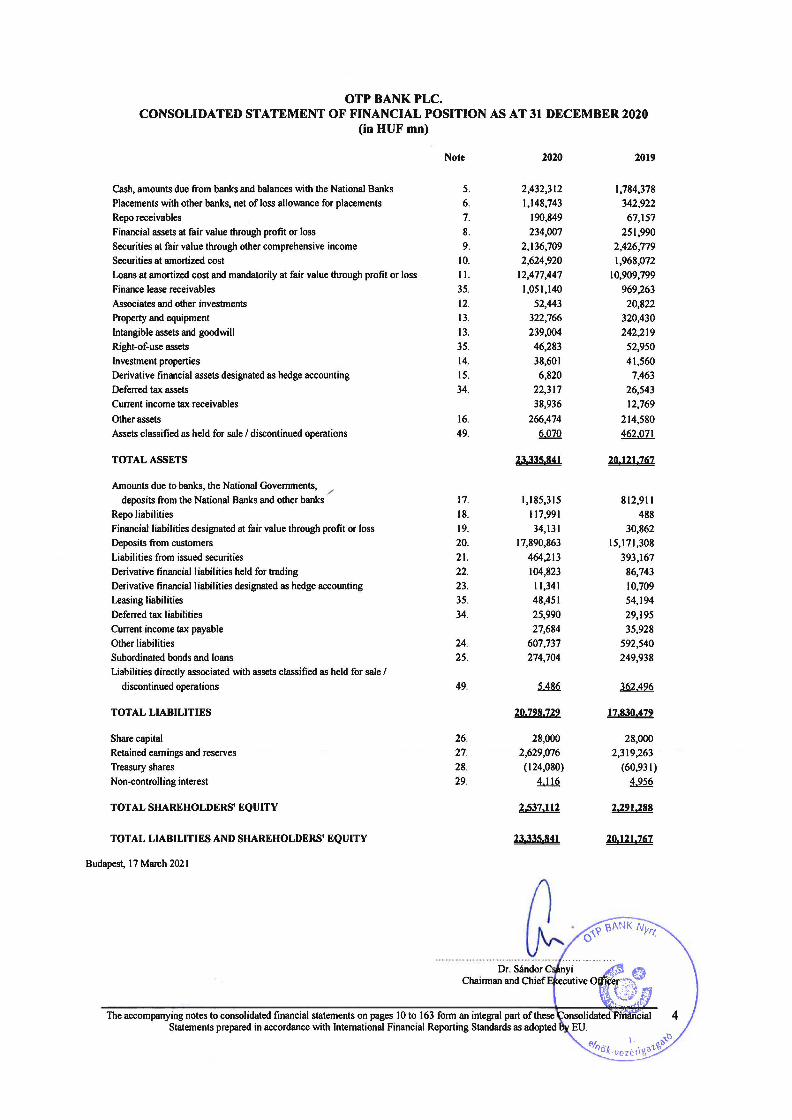
OTP BANK PLC. CONSOLIDATED STATEMENT OF FINANCIAL POSITION AS AT 31DECEMBER2020
(in HUF mn)
Note
Cash, amounts due from banks and balances with the National Banks 5.
Placements with other banks, net of loss allowance for placements 6.
Repo receivables 7.
Financial assets at fair value through profit or loss 8.
Securities at fair value through other comprehensive income 9.
Securities at amortiz.ed cost 10.
Loans at amortized cost and mandatorily at fair value through profit or loss 11.
Finance lease receivables 35.
Associates and other investments 12.
Property and equipment 13.
lntangible assets and goodwill 13.
Right-of-use assets 35.
Investment properties 14.
Derivative financial assets designated as hedge accounting 15.
Deferred tax assets 34.
Current income tax receivables
Other assets
Assets classified as held for sale I discontinued operations
TOTAL ASSETS
Amounts due to banks, the National Govemments, /
deposits from the National Banks and other banks
Repo liabilities
Financial liabilities designated at fair value through profit or loss
Deposits from customers
Liabilities from issued securities
Derivative financial liabilities held for trading
Derivative financial liabilities designated as hedge accounting
Leasing liabilities
Deferred tax liabilities
Current income tax payable
Other liabilities
Subordinated bonds and loans
Liabilities directly associated with assets classified as held for sale I discontinued operations
TOT AL LIABILITIES
Share capital
Retained earnings and reserves
Treasury shares
Non-controlling interest
TOTAL SHAREHOLDERS' EQUITY
TOTAL LIABILITIES AND SHAREHOLDERS' EQUITY
Budapest, 17 March 2021
16.
49.
17.
18.
19.
20.
21. 22.
23.
35.
34.
24.
25.
49.
26.
27.
28.
29.
2020
2,432,312
1,148,743
190,849
234,007
2,136,709
2,624,920
12,477,447
1,051,140
52,443
322,766
239,004
46,283
38,601
6,820
22,317
38,936
266,474
6070
23335 841
1,185,315
117,991
34,131
17,890,863
464,213
104,823
11,341
48,451
25,990
27,684
607,737
274,704
~
2!!,721!,722
28,000
2,629,076
(124,080)
4.116
2,537,112
23.335.841
~ · The accompanying notes to consolidated financial statements on pages 10 to 163 forrn an integral part of these
Statements prepared in accordance with Intemational Financial Reporting Standards as adopted
2019
1,784,378
342,922
67,157
251,990
2,426,779
1,968,072
10,909,799
969,263
20,822
320,430
242,219
52,950
41,560
7,463
26,543
12,769
214,580
462.071
20 121 767
812,911
488
30,862
15,171,308
393,167
86,743
10,709
54,194
29,195
35,928
592,540
249,938
ill..422
17,830,472
28,000
2,319,263
(60,931)
4.956
2,291,288
20.121 767
The accompanying notes to consolidated financial statements on pages 10 to 163 form an integral part of these Consolidated Financial Statements prepared in accordance with International Financial Reporting Standards as adopted by EU.
5
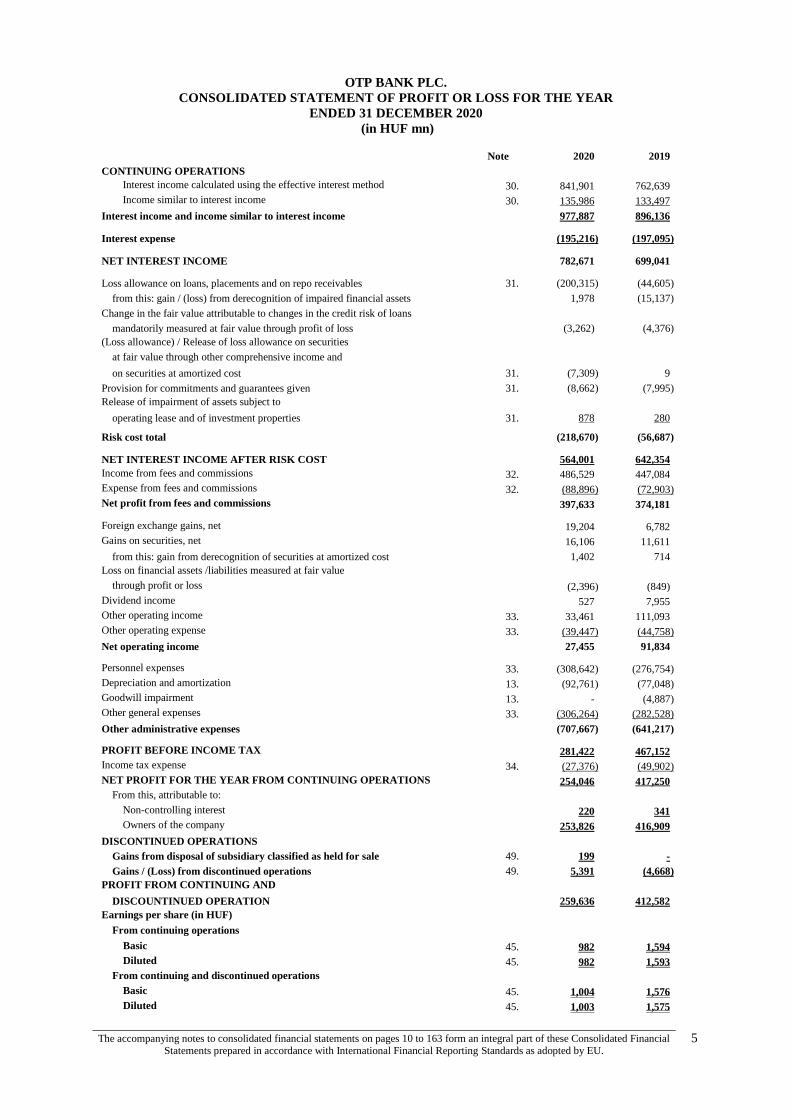
OTP BANK PLC.
CONSOLIDATED STATEMENT OF PROFIT OR LOSS FOR THE YEAR
ENDED 31 DECEMBER 2020
(in HUF mn)
Note 2020 2019
CONTINUING OPERATIONS
Interest income calculated using the effective interest method 30. 841,901 762,639
Income similar to interest income 30. 135,986 133,497
Interest income and income similar to interest income
977,887 896,136
Interest expense
(195,216) (197,095)
NET INTEREST INCOME
782,671 699,041
Loss allowance on loans, placements and on repo receivables 31. (200,315) (44,605)
from this: gain / (loss) from derecognition of impaired financial assets
1,978 (15,137)
Change in the fair value attributable to changes in the credit risk of loans
mandatorily measured at fair value through profit of loss (3,262) (4,376)
(Loss allowance) / Release of loss allowance on securities
at fair value through other comprehensive income and
on securities at amortized cost 31. (7,309) 9
Provision for commitments and guarantees given 31. (8,662) (7,995)
Release of impairment of assets subject to
operating lease and of investment properties 31. 878 280
Risk cost total (218,670) (56,687)
NET INTEREST INCOME AFTER RISK COST
564,001 642,354
Income from fees and commissions 32. 486,529 447,084
Expense from fees and commissions 32. (88,896) (72,903)
Net profit from fees and commissions
397,633 374,181
Foreign exchange gains, net
19,204 6,782
Gains on securities, net
16,106 11,611
from this: gain from derecognition of securities at amortized cost
1,402 714
Loss on financial assets /liabilities measured at fair value
through profit or loss
(2,396) (849)
Dividend income
527 7,955
Other operating income 33. 33,461 111,093
Other operating expense 33. (39,447) (44,758)
Net operating income
27,455 91,834
Personnel expenses 33. (308,642) (276,754)
Depreciation and amortization 13. (92,761) (77,048)
Goodwill impairment 13. - (4,887)
Other general expenses 33. (306,264) (282,528)
Other administrative expenses
(707,667) (641,217)
PROFIT BEFORE INCOME TAX
281,422 467,152
Income tax expense 34. (27,376) (49,902)
NET PROFIT FOR THE YEAR FROM CONTINUING OPERATIONS
254,046 417,250
From this, attributable to:
Non-controlling interest
220 341
Owners of the company
253,826 416,909
DISCONTINUED OPERATIONS
Gains from disposal of subsidiary classified as held for sale 49. 199 -
Gains / (Loss) from discontinued operations 49. 5,391 (4,668)
PROFIT FROM CONTINUING AND
DISCOUNTINUED OPERATION
259,636 412,582
Earnings per share (in HUF)
From continuing operations
Basic 45. 982 1,594
Diluted 45. 982 1,593
From continuing and discontinued operations
Basic 45. 1,004 1,576
Diluted 45. 1,003 1,575

The accompanying notes to consolidated financial statements on pages 10 to 163 form an integral part of these Consolidated Financial Statements prepared in accordance with International Financial Reporting Standards as adopted by EU.
6
OTP BANK PLC.
CONSOLIDATED STATEMENT OF COMPREHENSIVE INCOME FOR
THE YEAR ENDED 31 DECEMBER 2020
(in HUF mn)
Note 2020 2019
NET PROFIT FOR THE YEAR
259,636 412,582
Items that may be reclassified subsequently to profit or loss:
Fair value adjustment of securities at fair value
through other comprehensive income
(3,175) 26,164
Deferred tax related to fair value adjustment of securities
at fair value through other comprehensive income
918 (2,915)
Derivative financial instruments designated as cash flow hedge
(2) 11
Net investment hedge in foreign operations
(9,440) (2,776)
Deferred tax related to net investment hedge
in foreign operations 27. 849 250
Foreign currency translation difference
68,593 79,440
Items that will not be reclassified subsequently to profit or loss:
Fair value changes of equity instruments at fair value
through other comprehensive income
(2,890) 7,619
Deferred tax related to equity instruments at
fair value through other comprehensive income 27. 383 (644)
Remeasurement of net defined benefit asset / (liability)
143 (173)
Deferred tax related to remeasurement of net defined
benefit asset / (liability) 27. 1 12
Subtotal
55,380 106,988
NET COMPREHENSIVE INCOME
315,016 519,570
From this, attributable to:
Non-controlling interest
(223) 768
Owners of the company
315,239 518,802
The accompanying notes to consolidated financial statements on pages 10 to 163 form an integral part of these Consolidated Financial Statements prepared in accordance with International Financial Reporting Standards as adopted by EU.
7
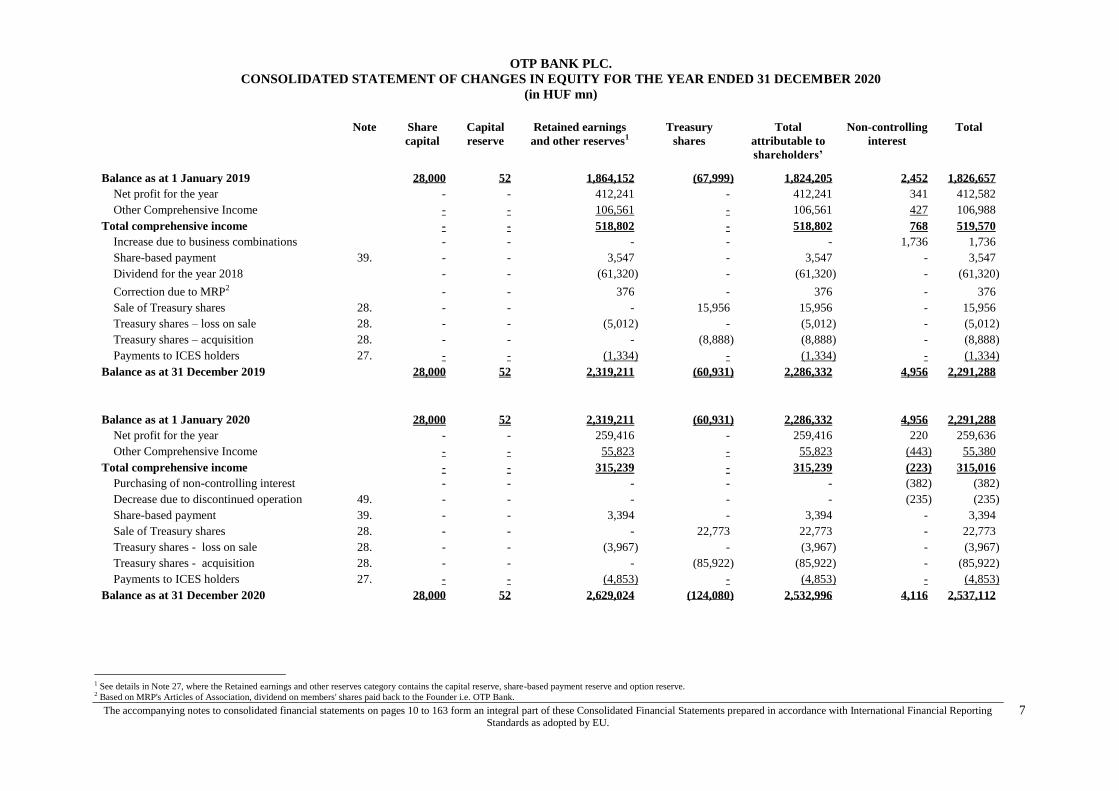
OTP BANK PLC.
CONSOLIDATED STATEMENT OF CHANGES IN EQUITY FOR THE YEAR ENDED 31 DECEMBER 2020
(in HUF mn)
Note Share
capital
Capital
reserve
Retained earnings
and other reserves1
Treasury
shares
Total
attributable to
shareholders’
Non-controlling
interest
Total
Balance as at 1 January 2019
28,000 52 1,864,152 (67,999) 1,824,205 2,452 1,826,657
Net profit for the year
- - 412,241 - 412,241 341 412,582
Other Comprehensive Income
- - 106,561 - 106,561 427 106,988
Total comprehensive income
- - 518,802 - 518,802 768 519,570
Increase due to business combinations
- - - - - 1,736 1,736
Share-based payment 39. - - 3,547 - 3,547 - 3,547
Dividend for the year 2018
- - (61,320) - (61,320) - (61,320)
Correction due to MRP2
- - 376 - 376 - 376
Sale of Treasury shares 28. - - - 15,956 15,956 - 15,956
Treasury shares – loss on sale 28. - - (5,012) - (5,012) - (5,012)
Treasury shares – acquisition 28. - - - (8,888) (8,888) - (8,888)
Payments to ICES holders 27. - - (1,334) - (1,334) - (1,334)
Balance as at 31 December 2019
28,000 52 2,319,211 (60,931) 2,286,332 4,956 2,291,288
Balance as at 1 January 2020
28,000 52 2,319,211 (60,931) 2,286,332 4,956 2,291,288
Net profit for the year
- - 259,416 - 259,416 220 259,636
Other Comprehensive Income
- - 55,823 - 55,823 (443) 55,380
Total comprehensive income
- - 315,239 - 315,239 (223) 315,016
Purchasing of non-controlling interest
- - - - - (382) (382)
Decrease due to discontinued operation 49. - - - - - (235) (235)
Share-based payment 39. - - 3,394 - 3,394 - 3,394
Sale of Treasury shares 28. - - - 22,773 22,773 - 22,773
Treasury shares - loss on sale 28. - - (3,967) - (3,967) - (3,967)
Treasury shares - acquisition 28. - - - (85,922) (85,922) - (85,922)
Payments to ICES holders 27. - - (4,853) - (4,853) - (4,853)
Balance as at 31 December 2020
28,000 52 2,629,024 (124,080) 2,532,996 4,116 2,537,112
1 See details in Note 27, where the Retained earnings and other reserves category contains the capital reserve, share-based payment reserve and option reserve. 2 Based on MRP's Articles of Association, dividend on members' shares paid back to the Founder i.e. OTP Bank.
The accompanying notes to consolidated financial statements on pages 10 to 163 form an integral part of these Consolidated Financial Statements prepared in accordance with International Financial Reporting Standards as adopted by EU.
8
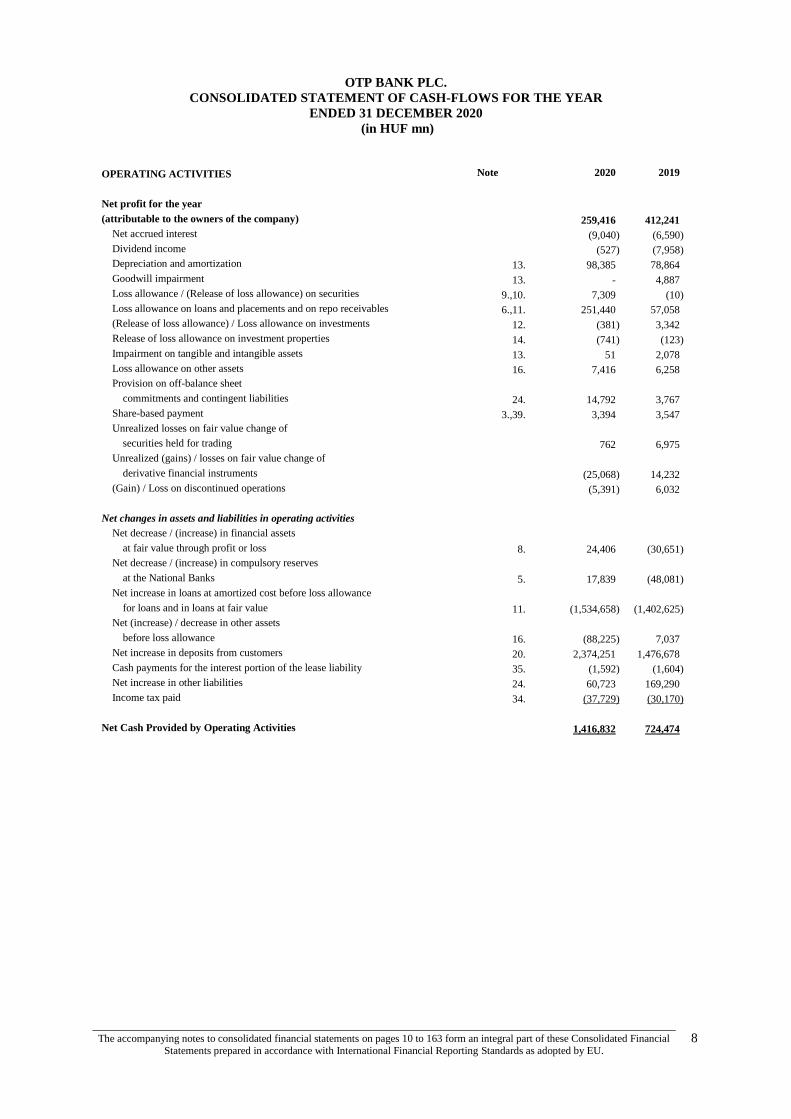
OTP BANK PLC.
CONSOLIDATED STATEMENT OF CASH-FLOWS FOR THE YEAR
ENDED 31 DECEMBER 2020
(in HUF mn)
OPERATING ACTIVITIES Note 2020 2019
Net profit for the year
(attributable to the owners of the company)
259,416 412,241
Net accrued interest
(9,040) (6,590)
Dividend income
(527) (7,958)
Depreciation and amortization 13. 98,385 78,864
Goodwill impairment 13. - 4,887
Loss allowance / (Release of loss allowance) on securities 9.,10. 7,309 (10)
Loss allowance on loans and placements and on repo receivables 6.,11. 251,440 57,058
(Release of loss allowance) / Loss allowance on investments 12. (381) 3,342
Release of loss allowance on investment properties 14. (741) (123)
Impairment on tangible and intangible assets 13. 51 2,078
Loss allowance on other assets 16. 7,416 6,258
Provision on off-balance sheet
commitments and contingent liabilities 24. 14,792 3,767
Share-based payment 3.,39. 3,394 3,547
Unrealized losses on fair value change of
securities held for trading
762 6,975
Unrealized (gains) / losses on fair value change of
derivative financial instruments
(25,068) 14,232
(Gain) / Loss on discontinued operations
(5,391) 6,032
Net changes in assets and liabilities in operating activities
Net decrease / (increase) in financial assets
at fair value through profit or loss 8. 24,406 (30,651)
Net decrease / (increase) in compulsory reserves
at the National Banks 5. 17,839 (48,081)
Net increase in loans at amortized cost before loss allowance
for loans and in loans at fair value 11. (1,534,658) (1,402,625)
Net (increase) / decrease in other assets
before loss allowance 16. (88,225) 7,037
Net increase in deposits from customers 20. 2,374,251 1,476,678
Cash payments for the interest portion of the lease liability 35. (1,592) (1,604)
Net increase in other liabilities 24. 60,723 169,290
Income tax paid 34. (37,729) (30,170)
Net Cash Provided by Operating Activities 1,416,832 724,474
The accompanying notes to consolidated financial statements on pages 10 to 163 form an integral part of these Consolidated Financial Statements prepared in accordance with International Financial Reporting Standards as adopted by EU.
9
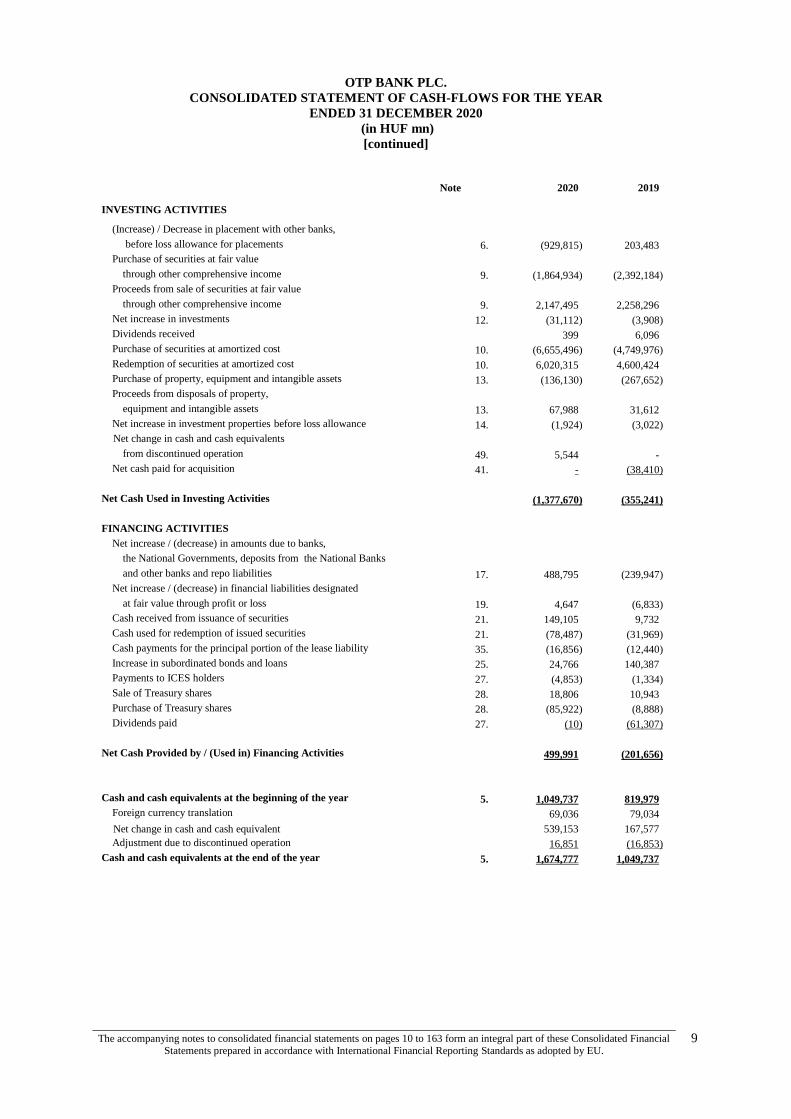
OTP BANK PLC.
CONSOLIDATED STATEMENT OF CASH-FLOWS FOR THE YEAR
ENDED 31 DECEMBER 2020
(in HUF mn)
[continued]
Note 2020 2019
INVESTING ACTIVITIES
(Increase) / Decrease in placement with other banks,
before loss allowance for placements 6. (929,815) 203,483
Purchase of securities at fair value
through other comprehensive income 9. (1,864,934) (2,392,184)
Proceeds from sale of securities at fair value
through other comprehensive income 9. 2,147,495 2,258,296
Net increase in investments 12. (31,112) (3,908)
Dividends received
399 6,096
Purchase of securities at amortized cost 10. (6,655,496) (4,749,976)
Redemption of securities at amortized cost 10. 6,020,315 4,600,424
Purchase of property, equipment and intangible assets 13. (136,130) (267,652)
Proceeds from disposals of property,
equipment and intangible assets 13. 67,988 31,612
Net increase in investment properties before loss allowance 14. (1,924) (3,022)
Net change in cash and cash equivalents
from discontinued operation 49. 5,544 -
Net cash paid for acquisition 41. - (38,410)
Net Cash Used in Investing Activities
(1,377,670) (355,241)
FINANCING ACTIVITIES
Net increase / (decrease) in amounts due to banks,
the National Governments, deposits from the National Banks
and other banks and repo liabilities 17. 488,795 (239,947)
Net increase / (decrease) in financial liabilities designated
at fair value through profit or loss 19. 4,647 (6,833)
Cash received from issuance of securities 21. 149,105 9,732
Cash used for redemption of issued securities 21. (78,487) (31,969)
Cash payments for the principal portion of the lease liability 35. (16,856) (12,440)
Increase in subordinated bonds and loans 25. 24,766 140,387
Payments to ICES holders 27. (4,853) (1,334)
Sale of Treasury shares 28. 18,806 10,943
Purchase of Treasury shares 28. (85,922) (8,888)
Dividends paid 27. (10) (61,307)
Net Cash Provided by / (Used in) Financing Activities
499,991 (201,656)
5. Cash and cash equivalents at the beginning of the year 1,049,737 819,979
Foreign currency translation
69,036 79,034
Net change in cash and cash equivalent 539,153 167,577
Adjustment due to discontinued operation 16,851 (16,853)
Cash and cash equivalents at the end of the year 5. 1,674,777 1,049,737
OTP BANK PLC.
NOTES TO THE CONSOLIDATED FINANCIAL STATEMENTS
FOR THE YEAR ENDED 31 DECEMBER 2020
10
NOTE 1: ORGANIZATION AND BASIS OF CONSOLIDATED FINANCIAL STATEMENTS
1.1. General information
OTP Bank Plc. (the “Bank” or “OTP Bank”) was established on 31 December 1990, when the previously State-
owned company was transformed into a public liability company.
The Bank’s registered office address is 16, Nador Street, Budapest 1051.
In 1995, the shares of the Bank were introduced on the Budapest and the Luxembourg Stock Exchanges and
were also traded on the SEAQ board on the London Stock Exchange and on PORTAL in the USA.
These Consolidated Financial Statements were approved by the Board of Directors and authorised for issue on
17 March 2021.
The structure of the Share capital by shareholders (%):
2020 2019
Domestic and foreign private and
institutional investors 97% 99%
Employees 1% 1%
Treasury shares 2% -
Total 100% 100%
The Bank’s Registered Capital consists of 280.000.010 pieces of ordinary shares with the nominal value of HUF
100 each, representing the same rights to the shareholders.
The Bank and its subsidiaries (“Entities of the Group“, together the “Group”) provide a full range of commercial
banking services through a wide network of 1,530 branches in the following countries Hungary, Bulgaria,
Serbia, Croatia, Russia, Romania, Ukraine, Albania, Montenegro, Moldova and Slovenia, as well as provides
other services in the Netherlands, Cyprus and Malta.
The number of the active employees without long-term breaks, and with part-time employees taken into account
proportionately, at the Group:
2020 2019
The number of employees at the Group 38,626 39,971
The average number of employees at the Group 39,943 40,795
1.2. Basis of Accounting
These Consolidated Financial Statements were prepared based on the assumptions of the Management that the
Bank will remain in business for the foreseeable future and that the Bank won’t be forced to halt operations and
liquidate its assets in the near term at what may be very low fire-sale prices.
The Entities of the Group maintain their accounting records and prepare their statutory accounts in accordance
with the commercial, banking and fiscal regulations prevailing in Hungary and in case of foreign subsidiaries in
accordance with the commercial, banking and fiscal regulations of the country in which they are domiciled.
The Bank’s functional currency is the Hungarian Forint (“HUF”). It is also presentation currency for the Group.
The financial statements of the subsidiaries used during the preparation of Consolidated Financial Statements of
the Group have the same reporting period – starting from 1 January ending as at 31 December – like the
reporting period of the Group.
Due to the fact that the Bank is listed on international and national stock exchanges, the Bank is obliged to
present its financial statements in accordance with International Financial Reporting Standards (“IFRS”) as
adopted by the European Union (the “EU”).
Certain adjustments have been made to the Entities’ statutory accounts in order to present the Consolidated
Financial Statements of the Group in accordance with all standards and interpretations approved by the
International Accounting Standards Board (“IASB”).
The Consolidated Financial Statements have been prepared in accordance with IFRS as adopted by the EU.
OTP BANK PLC.
NOTES TO THE CONSOLIDATED FINANCIAL STATEMENTS
FOR THE YEAR ENDED 31 DECEMBER 2020
11
NOTE 1: ORGANIZATION AND BASIS OF CONSOLIDATED FINANCIAL STATEMENTS
[continued]
1.2. Basis of Accounting [continued]
1.2.1. The effect of adopting new and revised International Financial Reporting Standards effective from
1 January 2020
The following amendments to the existing standards and new interpretation issued by the International
Accounting Standards Board (IASB) and adopted by the EU are effective for the current reporting period:
- Amendments to References to the Conceptual Framework in IFRS Standards – adopted by EU on 29
November 2019 (effective for annual periods beginning on or after 1 January 2020),
- Amendments to IAS 1 “Presentation of Financial Statements” and IAS 8 “Accounting Policies,
Changes in Accounting Estimates and Errors” - Definition of Material – adopted by EU on 29
November 2019 (effective for annual periods beginning on or after 1 January 2020),
- Amendments to IFRS 9 “Financial Instruments”, IAS 39 “Financial Instruments: Recognition and
Measurement”, IFRS 7 “Financial Instruments: Disclosures” – Interest rate Benchmark Reform –
adopted by EU on 15 January 2020 (effective for annual periods beginning on or after 1 January 2020),
- Amendments to IFRS 16 “Leases” – Covid 19-Related Rent Concessions adopted by EU on 9 October
2020 (effective for annual periods beginning on or after 1 June 2020),
- Amendments to IFRS 3 “Business Combinations” – adopted by EU on 21 April 2020 (effective for
annual periods beginning on or after 1 January 2020).
The adoption of these amendments to the existing standards has not led to any material changes in the Group’s
consolidated financial statements.
1.2.2. New and revised Standards and Interpretations issued by IASB and adopted by the EU but not yet
effective
At the date of authorization of these financial statements there are new standards, amendments to the existing
standards nor interpretations which are issued by IASB and adopted by the EU which are not yet effective:
- Amendments to IFRS 9, IAS 39, IFRS 7, IFRS 4 and IFRS 16 “Interest Rate Benchmark Reform –
Phase 2 adopted by EU on 13 January 2021 (effective for annual periods beginning on or after 1 January
2021),
- Amendments to IFRS 4 “Insurance Contracts” deferral of IFRS 9 adopted by EU on 15 December
2020 (effective for annual periods beginning on or after 1 January 2021).
The Group does not adopt these new standards and amendments to existing standards before their effective date.
The Group anticipates that the adoption of these new standards, amendments to the existing standards and new
interpretations will have no material impact on the consolidated financial statements of the Group in the period
of initial application.
1.2.3. Standards and Interpretations issued by IASB, but not yet adopted by the EU
At present, IFRS as adopted by the EU do not significantly differ from regulations adopted by the International
Accounting Standards Board (IASB) except for the following new standards, amendments to the existing
standards and new interpretation, which were not endorsed for use in EU as at the publication of these
consolidated financial statements:
- IFRS 17 “Insurance Contracts” including amendments to IFRS 17 (effective for annual periods
beginning on or after 1 January 2023),
- Amendments to IFRS 3 “Business Combinations”; IAS 16 “Property, Plant and Equipment”; IAS
37 “Provisions, Contingent Liabilities and Contingent Assets” - Annual Improvements (effective for
annual periods beginning on or after 1 January 2022),
- Amendments to IAS 1 “Presentation of Financial Statements” - Classification of Liabilities as Current
or Non-Current (effective for annual periods beginning on or after 1 January 2023),
- Amendments to IAS 1 “Presentation of Financial Statements” and IFRS Practice Statement 2 –
Disclosure of Accounting policies (effective for annual periods beginning on or after 1 January 2023),
OTP BANK PLC.
NOTES TO THE CONSOLIDATED FINANCIAL STATEMENTS
FOR THE YEAR ENDED 31 DECEMBER 2020
12
NOTE 1: ORGANIZATION AND BASIS OF CONSOLIDATED FINANCIAL STATEMENTS
[continued]
1.2. Basis of Accounting [continued]
1.2.3. Standards and Interpretations issued by IASB, but not yet adopted by the EU [continued]
- Amendments to IAS 8 “Accounting policies, Changes in Accounting Estimates and Errors” –
Definition of Accounting Estimates (effective for annual periods beginning on or after 1 January 2023),
- Amendments to IFRS 10 “Consolidated Financial Statements” and IAS 28 “Investments in
Associates and Joint Ventures” – Sale or Contribution of Assets between an Investor and its Associate
or Joint Venture and further amendments (effective date deferred indefinitely until the research project on
the equity method has been concluded).
The Group anticipates that the adoption of these new standards, amendments to the existing Standards and new
interpretations will have no significant impact on the Consolidated Financial Statements of the Group in the
period of initial application.
NOTE 2: SUMMARY OF SIGNIFICANT ACCOUNTING POLICIES
Significant accounting policies applied in the preparation of the accompanying Consolidated Financial
Statements are summarized below:
2.1. Basis of Presentation
These Consolidated Financial Statements have been prepared under the historical cost convention with the
exception of certain financial instruments, which are recorded at fair value. Revenues and expenses are recorded
in the period in which they are earned or incurred. The Group does not offset assets and liabilities or income and
expenses unless it is required or permitted by an IFRS standard.
The presentation of Consolidated Financial Statements in conformity with IFRS as adopted by the EU requires
the Management of the Group to make estimates and assumptions that affect the reported amounts of assets and
liabilities and disclosure of contingent assets and liabilities as of the date of the financial statements and their
reported amounts of revenues and expenses during the reporting period. Actual results could differ from those
estimates.
Future changes in economic conditions, business strategies, regulatory requirements, accounting rules and other
factors could result in a change in estimates that could have a material impact on future financial statements.
2.2. Foreign currency translation
In preparing the financial statements of each individual group entity, transactions in currencies other than the
entity's functional currencies are translated into functional currencies at the rates of exchange prevailing at the
dates of the transactions. At the end of each reporting period, monetary items denominated in foreign currencies
are retranslated at the exchange rates quoted by the National Bank of Hungary (“NBH”), or if there is no official
rate, at exchange rates quoted by OTP Bank as at the date of the Consolidated Financial Statements.
Non-monetary items carried at fair value that are denominated in foreign currencies are retranslated at the rates
prevailing at the date when the fair value was determined. Non-monetary items that are measured in terms of
historical cost in a foreign currency are not retranslated.
Exchange differences on monetary items are recognized in profit or loss in the period in which they arise except
for:
- exchange differences on foreign currency borrowings relating to assets under construction for future
productive use, which are included in the cost of those assets when they are regarded as an adjustment to
interest costs on those foreign currency borrowings;
- exchange differences on transactions entered into in order to hedge certain foreign currency risks (see note
2.7. below for hedging accounting policies); and
- exchange differences on monetary items receivable from or payable to a foreign operation for which
settlement is neither planned nor likely to occur (therefore forming part of the net investment in the foreign
operation), which are recognized initially in Other Comprehensive Income and reclassified from equity to
profit or loss on repayment of the monetary items.
OTP BANK PLC.
NOTES TO THE CONSOLIDATED FINANCIAL STATEMENTS
FOR THE YEAR ENDED 31 DECEMBER 2020
13
NOTE 2: SUMMARY OF SIGNIFICANT ACCOUNTING POLICIES [continued]
2.2. Foreign currency translation [continued]
For the purposes of presenting Consolidated Financial Statements, the assets and liabilities of the Group's foreign
operations are translated into HUF using exchange rates prevailing at the end of each reporting period. Income
and expense items are translated at the average exchange rates for the period, unless exchange rates fluctuate
significantly during that period, in which case the exchange rates at the dates of the transactions are used.
Exchange differences arising, if any, are recognized in Other Comprehensive Income and accumulated in equity
(attributed to non-controlling interests as appropriate).
On the disposal of a foreign operation (i.e. a disposal of the Group's entire interest in a foreign operation, or a
disposal involving loss of control over a subsidiary that includes a foreign operation, a disposal involving loss of
joint control over a jointly controlled entity that includes a foreign operation, or a disposal involving loss of
significant influence over an associate that includes a foreign operation), all of the exchange differences
accumulated in equity in respect of that operation attributable to the owners of the Group are reclassified to
profit or loss.
In addition, in relation to a partial disposal of a subsidiary that does not result in the Group losing control over
the subsidiary, the proportionate share of accumulated exchange differences are re-attributed to non-controlling
interests and are not recognized in profit or loss.
Goodwill and fair value adjustments on identifiable assets and liabilities acquired arising on the acquisition of a
foreign operation are treated as assets and liabilities of the foreign operation and translated at the rate of
exchange prevailing at the end of each reporting period. Exchange differences arising are recognized in Other
Comprehensive Income and accumulated in equity.
2.3. Principles of consolidation
As the ultimate parent, OTP Bank is preparing Consolidated Financial Statements of the Group.
These Consolidated Financial Statements combine the assets, liabilities, equity, income, expenses and cash flows
of the Bank and of those subsidiaries of the Bank in which the Bank exercises control.
All intra-group transactions are consolidated fully on a line-by-line basis while under equity method other
consolidation rules are applied. Determination of the entities which are involved into the consolidation
procedures based on the determination of the Group’s Control over another entity. The control exists when the
Bank has power over the investee, is able to use this power and is exposed or has right to variable returns.
Consolidation of a subsidiary should begin from the date when the Group obtains control and cease when the
Group loses control. Therefore, income and expenses of a subsidiary should be included in the Consolidated
Financial Statements from the date the Group gains control of the subsidiary until the date when the Group
ceases to have control of the subsidiary.
The list of the major fully consolidated subsidiaries, the percentage of issued capital owned by the Bank and the
description of their activities is provided in Note 42.
2.4. Accounting for acquisitions
Business combinations are accounted for using acquisition method. Any goodwill arising on acquisition is
recognized in the Consolidated Statement of Financial Position and accounted for as indicated below.
The acquisition date is the date on which the acquirer effectively obtains control over the acquiree. Before this
date, it should be presented as Advance for investments within Other assets.
Goodwill, which represents the residual cost of the acquisition after obtaining the control over the acquiree in the
fair value of the identifiable assets acquired and liabilities assumed is held as an intangible asset and recorded at
cost less any accumulated impairment losses in the Consolidated Financial Statements. The Group tests goodwill
for impairment by comparing its recoverable amount with its carrying amount, and recognising any excess of the
carrying amount over the recoverable amount an impairment loss. The recoverable amount of goodwill is the
higher of its fair value less costs of disposal and its value in use.
If the Group loses control of a subsidiary, derecognizes the assets (including any goodwill) and liabilities of the
subsidiary at their carrying amounts at the date when control is lost and recognizes any difference as a gain or
loss on the sale attributable to the parent in Statement of Profit or Loss on Net income from discontinued
operation.
OTP BANK PLC.
NOTES TO THE CONSOLIDATED FINANCIAL STATEMENTS
FOR THE YEAR ENDED 31 DECEMBER 2020
14
NOTE 2: SUMMARY OF SIGNIFICANT ACCOUNTING POLICIES [continued]
2.4. Accounting for acquisitions [continued]
Goodwill acquired in a business combination is tested for impairment annually or more frequently if events or
changes in circumstances indicate. The goodwill is allocated to the cash-generating units that are expected to
benefit from the synergies of the combinations.
The Group calculates the fair value of identified assets and liabilities assumed on discounted cash-flow model.
The 3 year period explicit cash-flow model serves as a basis for the impairment test by which the Group defines
the impairment need on goodwill based on the strategic factors and financial data of its cash-generating units.
The Group, in its strategic plan, has taken into consideration the effects of the present global economic situation,
the present economic growth and outlook, the associated risks and their possible effect on the financial sector as
well as the current and expected availability of wholesale funding.
Negative goodwill (gain from bargain purchase), when the interest of the acquirer in the net fair value of the
acquired identifiable net assets exceeds the cost of the business combination, is recognized immediately in the
Consolidated Statement of Profit or Loss as other income.
2.5. Securities at amortized cost
The Group measures at amortized cost those securities which are held for contractual cash collecting purposes,
and contractual terms of these securities give rise to cash flows that are solely payment of principal and interest
on the principal amount outstanding. The Group initially recognizes these securities at fair value. Securities at
amortized cost are subsequently measured using the effective interest (EIR) method and are subject to
impairment. The amortisation of any discount or premium on the acquisition of a security at amortized cost is
part of the amortized cost and is recognized as interest income so that the revenue recognized in each period
represents a constant yield on the investment. Securities at amortized cost are accounted for on a trade date basis.
Such securities comprise mainly securities issued by the Hungarian and foreign Governments, corporate bonds
and discounted treasury bills.
2.6. Financial assets at fair value through profit or loss
2.6.1. Securities held for trading
Investments in securities are accounted for on a trade date basis and are initially measured at fair value.
Securities held for trading are measured at subsequent reporting dates at fair value, so unrealized gains and
losses on held for trading securities are recognized in profit or loss and included in the Consolidated Statement
of Profit or Loss for the period. The Group holds held for trading securities within the business model to obtain
short-term gains, consequently realized and unrealized gains and losses are recognized in the net operating
income, while interest income is recognized in income similar to interest income. The Group applies the FIFO1
inventory valuation method for securities held for trading.
Such securities consist of equity instruments, shares in investment funds, Hungarian and foreign government
bonds, discounted treasury bills and other securities.
2.6.2. Financial assets designated as fair value through profit or loss
The Group may - at initial recognition - irrevocable designate a financial asset as measured at fair value through
profit or loss that would otherwise be measured at fair value through other comprehensive income or at
amortized cost.
The Group may use fair value designation only in the following cases:
- if the classification eliminates or significantly reduces a measurement or recognition inconsistency that
would otherwise arise from measuring assets or liabilities or recognising the gains and losses on them on
different bases (‘accounting mismatch’)
The use of the fair value designation is based only on direct decision of management of the Group.
1 First In First Out
OTP BANK PLC.
NOTES TO THE CONSOLIDATED FINANCIAL STATEMENTS
FOR THE YEAR ENDED 31 DECEMBER 2020
15
NOTE 2: SUMMARY OF SIGNIFICANT ACCOUNTING POLICIES [continued]
2.6. Financial assets at fair value through profit or loss [continued]
2.6.3. Derivative financial instruments
In the normal course of business, the Group is a party to contracts for derivative financial instruments, which
represent a low initial investment compared to the notional value of the contract and their value depends on
value of underlying asset and are settled in the future. The derivative financial instruments used include interest
rate forward or swap agreements and currency forward or swap agreements and options. These financial
instruments are used by the Group both for trading purposes and to hedge interest rate risk and currency
exposures associated with its transactions in the financial markets.
Derivative financial instruments are accounted for on a trade date basis and are initially measured at fair value
and at subsequent reporting dates also at fair value. Fair values are obtained from quoted market prices,
discounted cash-flow models and option pricing models as appropriate. The Group adopts multi curve valuation
approach for calculating the net present value of future cash-flows – based on different curves used for
determining forward rates and used for discounting purposes. It shows the best estimation of such derivative
deals that are collateralised as the Group has almost all of its open derivative transactions collateralised.
Changes in the fair value of derivative financial instruments that do not qualify for hedge accounting are
recognized in profit or loss and are included in the Consolidated Statement of Profit or Loss for the period. Each
derivative deal is determined as asset when fair value is positive and as liability when fair value is negative.
Certain derivative transactions, while providing effective economic hedges under the risk management policy of
the Group, do not qualify for hedge accounting under the specific rules of IFRS 9 and are therefore treated as
derivatives held for trading with fair value gains and losses charged directly to the Consolidated Statement of
Profit or Loss.
Foreign currency contracts
Foreign currency contracts are agreements to exchange specific amounts of currencies at a specified rate of
exchange, at a spot date (settlement occurs two days after the trade date) or at a forward date (settlement occurs
more than two days after the trade date). The notional amount of these forward contracts does not represent the
actual market or credit risk associated with these contracts.
Foreign currency contracts are used by the Group for risk management and trading purposes. The risk
management foreign currency contracts of the Group were used to hedge the exchange rate fluctuations of loans
and deposits to credit institutions denominated in foreign currency.
Foreign exchange swaps and interest rate swaps
The Group enters into foreign exchange swap and interest rate swap (“IRS”) transactions. The swap transaction
is an agreement concerning the swap of certain financial instruments, which usually consists of spot and one or
more forward contracts.
IRS transactions oblige two parties to exchange one or more payments calculated with reference to fixed or
periodically reset rates of interest applied to a specific notional principal amount (the base of the interest
calculation). Notional principal is the amount upon which interest rates are applied to determine the payment
streams under IRS transactions. Such notional principal amounts often are used to express the volume of these
transactions but are not actually exchanged between the counterparties.
IRS transactions are used by the Group for risk management and trading purposes.
Cross-currency interest rate swaps
The Group enters into cross-currency interest rate swap (CCIRS) transactions which have special attributes, i.e.
the parties exchange the notional amount at the beginning and also at the maturity of the transaction. A special
type of these deals is the mark-to-market CCIRS agreements. At this kind of deals the parties – in accordance
with the foreign exchange prices – revalue the notional amount during lifetime of the transaction.
OTP BANK PLC.
NOTES TO THE CONSOLIDATED FINANCIAL STATEMENTS
FOR THE YEAR ENDED 31 DECEMBER 2020
16
NOTE 2: SUMMARY OF SIGNIFICANT ACCOUNTING POLICIES [continued]
2.6. Financial assets at fair value through profit or loss [continued]
2.6.3 Derivative financial instruments [continued]
Equity and commodity swaps
Equity swaps obligate two parties to exchange more payments calculated with reference periodically reset rates
of interest and performance of indexes. A specific notional principal amount is the base of the interest
calculation. The payment of index return is calculated on the basis of current market price compared to the
previous market price. In case of commodity swaps payments are calculated on the basis of the strike price of a
predefined commodity compared to its average market price in a period.
Forward rate agreements (FRA)
A forward rate agreement is an agreement to settle amounts at a specified future date based on the difference
between an interest rate index and an agreed upon fixed rate. Market risk arises from changes in the market value
of contractual positions caused by movements in interest rates.
The Group limits its exposure to market risk by entering into generally matching or offsetting positions and by
establishing and monitoring limits on unmatched positions. Credit risk is managed through approval procedures
that establish specific limits for individual counterparties. The Group’s forward rate agreements were transacted
for management of interest rate exposures and have been accounted for at mark-to-market fair value.
Foreign exchange options
A foreign exchange option is a derivative financial instrument that gives the owner the right to exchange money
denominated in one currency into another currency at a pre-agreed exchange rate at a specified future date. The
transaction, for a fee, guarantees a worst-case exchange rate for the futures purchase of one currency for another.
These options protect against unfavourable currency movements while preserving the ability to participate in
favourable movements.
2.7. Hedge accounting
Derivative financial instruments designated as a fair-value hedge
Changes in the fair value of derivatives that are designated and qualify as hedging instruments in fair value
hedges and that prove to be highly effective in relation to the hedged risk, are recorded in the Consolidated
Statement of Profit or Loss along with the corresponding change in fair value of the hedged asset or liability that
is attributable to the specific hedged risk. Changes in the fair value of hedging instrument in fair value hedges is
charged directly to the Consolidated Statement of Profit or Loss.
The conditions of hedge accounting applied by the Bank are the following: formally designated as hedge
relationship, proper hedge documentation is prepared, effectiveness test is performed and based on it the hedge is
qualified as effective.
The Group implemented hedge accounting rules prescribed by IFRS 9 in 2018.
Derivative financial instruments designated as cash flow hedge
Changes in fair value of derivatives that are designated and qualify as hedging instrument in cash-flow hedges
and that prove to be highly effective in relation to the hedged risk are recognized in their effective portion as
reserve in Other Comprehensive Income. The ineffective element of the changes in fair value of hedging
instrument is charged directly to the Consolidated Statement of Profit or Loss.
The Group terminates the hedge relationship if the hedging instrument expires or is sold, terminated or
exercised, or the hedge no longer meets the criteria for hedge accounting. In case of cash-flow hedges – in line
with the standard -hedge accounting is still applied by the Group as long as the underlying asset is derecognized.

OTP BANK PLC.
NOTES TO THE CONSOLIDATED FINANCIAL STATEMENTS
FOR THE YEAR ENDED 31 DECEMBER 2020
17
NOTE 2: SUMMARY OF SIGNIFICANT ACCOUNTING POLICIES [continued]
2.7. Hedge accounting [continued]
Net investment hedge in foreign operations
Hedges of a net investment in a foreign operation, including a hedge of a monetary item that is accounted for as
part of the net investment, shall be accounted for similarly to cash flow hedges.
On disposal of the foreign operation, the cumulative value of any gains and losses recognized in Other
Comprehensive Income is transferred to the Consolidated Statement of Profit or Loss.
2.8. Offsetting
Financial assets and liabilities are offset and the net amount is reported in the Consolidated Statement of
Financial Position when the Group has a legally enforceable right to set off the recognized amounts and the
transactions are intended to be reported in the Consolidated Statement of Financial Position on a net basis. The
Group does not offset any financial assets and financial liabilities.
2.9. Embedded derivatives
Sometimes, a derivative may be a component of a combined or hybrid contracts that includes a host contract and
a derivative (the embedded derivative) affecting cash-flows or otherwise modifying the characteristics of the
host instrument. An embedded derivative must be separated from the host instrument and accounted for as a
separate derivative if, and only if:
The economic characteristics and risks of the embedded derivative are not closely related to the economic
characteristics and risks of the host contract;
A separate financial instrument with the same terms as the embedded derivative would meet the definition
of a derivative as a stand-alone instrument; and
The host instrument is not measured at fair value or is measured at fair value but changes in fair value are
recognized in Other Comprehensive Income.
As long as a hybrid contract contains a host that is a financial asset the general accounting rules for
classification, recognition and measurement of financial assets are applicable for the whole contract and no
embedded derivative is separated.
Derivatives that are required to be separated are measured at fair value at initial recognition and subsequently.If
the Group is unable to measure the embedded derivative separately either at acquisition or at the end of a
subsequent financial reporting period, the Group shall designate the entire hybrid contract as at fair value
through profit or loss. The Group shall assess whether an embedded derivative is required to be separated from
the host contract and accounted for as a derivative when the Bank first becomes a party to the contract.
2.10. Securities at fair value through other comprehensive income
Securities at fair value through other comprehensive income are held within a business model whose objective is
achieved by both collecting of contractual cash flows and selling securities. Furthermore contractual terms of
these securities give rise on specified dates to cash flows that are solely payment of principal and interest on the
principal amount outstanding.
Debt instruments
Investments in debt securities are accounted for on a trade date basis and are initially measured at fair value.
Securities at fair value through other comprehensive income are measured at subsequent reporting dates at fair
value. Unrealized gains and losses on securities at fair value through other comprehensive income are recognized
directly in Other Comprehensive Income, except for interest and foreign exchange gains/losses on monetary
items, unless such financial asset at fair value through other comprehensive income is part of an effective hedge.
Such gains and losses are reported when realized in Consolidated Statement of Profit or Loss for the applicable
period. The Group applies the FIFO1 inventory valuation method for securities at fair value through other
comprehensive income.
1 First In First Out
OTP BANK PLC.
NOTES TO THE CONSOLIDATED FINANCIAL STATEMENTS
FOR THE YEAR ENDED 31 DECEMBER 2020
18
NOTE 2: SUMMARY OF SIGNIFICANT ACCOUNTING POLICIES [continued]
2.10. Securities at fair value through other comprehensive income [continued]
Debt instruments [continued]
For debt securities at fair value through other comprehensive income the loss allowance is calculated based on
expected credit loss model. The expected credit loss is accounted for against Other Comprehensive Income.
Securities at fair value through other comprehensive income are remeasured at fair value based on quoted prices
or amounts derived from cash-flow models. In circumstances where the quoted market prices are not readily
available, the fair value of debt securities is estimated using the present value of future cash-flows and the fair
value of any unquoted equity instruments are calculated using the EPS ratio.
Such securities consist of Hungarian and foreign government bonds, corporate bonds, mortgage bonds,
discounted Treasury bills and other securities.
Fair value through other comprehensive income option for equity instruments
The Group has elected to present in the Statement of Other Comprehensive Income changes of fair value of
those equity instruments which are neither held for trading nor recognized under IFRS 3.
In some cases the Group made an irrevocable election at initial recognition for certain equity instruments to
present subsequent changes in fair value of these securities in the consolidated other comprehensive income
instead of in profit or loss.
The use of the fair value option is based only on direct decision of management of the Group.
2.11. Loans, placements with other banks, repo receivables and loss allowance for loan and placements
and repo receivable losses
The Group measures at amortized cost those Loans and placements with other banks and repo receivables, which
are held to collect contractual cash flows, and contractual terms of these assets give rise on specified dates to
cash flows that are solely payments of principal and interest on the principal amount outstanding. The Group
recognizes as loans measured at fair value through profit or loss those financial assets, which are held for trading
or the contractual cash flows that are not solely payments of principal and interest on the principal amount
outstanding.
Those Loans and placements with other banks and repo receivables that are accounted at amortized cost, stated
at the principal amounts outstanding (including accrued interest), net of allowance for loan or placement losses,
respectively.
Transaction fees and charges adjust the carrying amount at initial recognition and are included in effective
interest calculation.
Loans and placements with other banks and repo receivables are derecognized when the contractual rights to the
cash-flows expire or they are transferred. When a financial asset is derecognized the difference of the carrying
amount and the consideration received is recognized in the profit or loss. When the contractual cash flows of a
financial asset are modified and the modification does not result in the derecognition of the financial asset the
Bank recalculate the gross carrying amount of the financial asset by discounting the expected future cash flows
with the original effective interest rate of the asset. The difference between the carrying amount and the present
value of the expected cash flows is recognized as a modification gain or loss in the profit or loss.
Interest and amortized cost are accounted using effective interest rate method.
Initially financial assets shall be recognized at fair value which is usually equal to transaction value in case of
loans and placements. However, when the amounts are not equal, the initial fair value difference should be
recognized. This difference is amortized with effective interest rate.
Initial fair value of loans lent at interest below market conditions is lower than their transaction price. As a
consequence the Group is deferring the difference between the fair value at initial recognition and the transaction
price relating to loans and receivables because input data for measuring the fair values are not available on
observable markets.
The Group recognizes a loss allowance for expected credit losses on a financial asset at each reporting date. The
loss allowance for a financial asset equals to 12-month expected credit loss or equals to the lifetime expected
credit losses. The maximum period over which expected credit losses shall be measured is the maximum
contractual period over which the Group is exposed to credit risk.
OTP BANK PLC.
NOTES TO THE CONSOLIDATED FINANCIAL STATEMENTS
FOR THE YEAR ENDED 31 DECEMBER 2020
19
NOTE 2: SUMMARY OF SIGNIFICANT ACCOUNTING POLICIES [continued]
2.11. Loans, placements with other banks, repo receivables and loss allowance for loan and placements
and repo receivable losses [continued]
If the credit risk on a financial asset has not increased significantly since initial recognition then 12-month
expected credit losses, otherwise (in case of significant credit risk increase) lifetime expected credit losses
should be calculated. The expected credit loss is the present value of the difference between the contractual cash
flows that are due to the Group under the contract and the cash flows that the Group expects to receive.
Write-offs are generally recorded after all reasonable restructuring or collection activities have taken place and
the possibility of further recovery is considered to be remote. The loan is written off against the related account
“Loss allowance on loans, placements and on repo receivables / from this: gain / loss from derecognition” in the
Consolidated Statement of Profit or Loss.
The Group applies partial or full write-off for loans based on the definitions and prescriptions of financial
instruments in accordance with IFRS 9. If the Group has no reasonable expectations regarding a financial asset
(loan) to be recovered, it will be written off partially or fully at the time of emergence.
The gross amount and impairment loss of the loans shall be written off in the same amount to the estimated
maximum recovery amount while the net carrying value remains unchanged. In those cases when on the
previously partially or fully written-off loans or placements, which perhaps were derecognized from the books
no having been reasonable expectations later nevertheless recoveries could be determined then it will be reversal
of loss allowance in the Consolidated Statement of Profit or Loss on “Income from recoveries of written-off, but
legally existing loans”.
2.12. Modified assets
If the net present value of the contracted cash flows changes due to the modification of the contractual terms and
it is not qualified as derecognition, modification gain or loss should be calculated and accounted for in the
consolidated statement of profit or loss.
Among the possible contract amendments, the Group considers as a derecognition and a new recognition when
the discounted present value – discounted at the original effective interest rate – of the cash flows under the new
terms is at least 10 per cent different from the discounted present value of the remaining cash flows. In case of
derecognition and new recognition the unamortized fees of the derecognized asset should be presented as Income
similar to interest income. The newly recognized financial asset is initially measured at fair value and is placed
in stage 1 if the derecognized financial asset was in stage 1 or stage 2 portfolio. The newly recognized financial
asset will be purchased or originated credit impaired financial asset (“POCI”) if the derecognized financial asset
was in stage 3 portfolio or it was POCI.
The modification gain or loss shall be calculated at each contract amendments unless they are handled as a
derecognition and new recognition. In case of modification the Group recalculates the gross carrying amount of
the financial asset. To do this, the new contractual cash flows should be discounted using the financial asset’s
original effective interest rate (or credit-adjusted effective interest rate for POCI financial asset). Any costs or
fees incurred adjust the carrying amount of the modified financial asset are amortized over the remaining term of
the modified financial asset.
2.13. Purchased or originated credit impaired financial assets
Purchased or originated financial assets are credit-impaired on initial recognition. A financial asset is credit-
impaired when one or more events that have a detrimental impact on the estimated future cash flows of that
financial asset have occurred.
A purchased credit-impaired asset is likely to be acquired at a deep discount. In unusual circumstances, it may be
possible that an entity originates a credit-impaired asset, for example, following a substantial modification of a
distressed financial asset that resulted in the derecogniton of the original financial asset.
In the case of POCI financial assets, interest income is always recognized by applying the credit-adjusted
effective interest rate.
OTP BANK PLC.
NOTES TO THE CONSOLIDATED FINANCIAL STATEMENTS
FOR THE YEAR ENDED 31 DECEMBER 2020
20
NOTE 2: SUMMARY OF SIGNIFICANT ACCOUNTING POLICIES [continued]
2.13. Purchased or originated credit impaired financial assets [continued]
For POCI financial assets, in subsequent reporting periods an entity is required to recognize:
- the cumulative changes in lifetime expected credit losses since initial recognition as a loss allowance,
- the impairment gain or loss which is the amount of any change in lifetime expected credit losses.
An impairment gain is recognized (with the parallel increase of the net amortized cost of receivable) if due
to the favourable changes after initial recognition the lifetime expected credit loss estimation is becoming
lower than the original estimated credit losses at initial recognition.
The POCI qualification remains from initial recognition to derecognition in the Group’s books.
2.14. Loss allowance
Loss allowance for loans and placements with other banks and repo receivables is recognized by the Group
based on the expected credit loss model in accordance with IFRS 9. Based on the three stage model the
recognized loss allowance equals to 12-month expected credit loss from the initial recognition. On financial
assets with significantly increased credit risk or credit impaired financial assets (based on objective evidences)
the recognized loss allowance is the lifetime expected credit loss.
In case of purchased or originated credit impaired financial assets loss allowance is recognized in amount of
lifetime expected credit loss since initial recognition. Impairment gain in the Consolidated Statement of Profit or
Loss is recognized if lifetime expected credit loss for purchased or originated credit impaired financial assets at
measurement date are less than the estimated credit loss at initial recognition.
Loss allowance for loans and placements with other banks and repo receivables represent Management
assessment for potential losses in relation to these activities.
Impairment losses on credit and placement losses are determined at a level that provides coverage for
individually identified credit losses. For loans for which it is not possible to determine the amount of the
individually identified credit loss in the absence of objective evidence, a collective impairment loss is
recognized. With this, the Bank reduces the carrying amount of financial asset portfolios with similar credit risk
characteristics to the amount expected to be recovered based on historical experience.
At subsequent measurement the Group recognizes impairment gain or loss through “Impairement gain on POCI
loans” in the Consolidated Statement of Profit or Loss as an amount of expected credit losses or reversal that is
required to adjust the loss allowance at the reporting date to the amount that is required to be recognized in
accordance with IFRS 9.
If a financial asset, for which previously there were no indicators of significant increase in credit risk (i.e.
classified in Stage 1) is subsequently classified in Stage 2 or Stage 3 then loss allowance is adjusted to lifetime
expected credit loss. If a financial asset, which previously was classified in Stage 2 or Stage 3 is subsequently
classified in Stage 1 then loss allowance is adjusted to the level of 12 month expected credit loss.
Classification into risk classes
According to the requirements of the IFRS9 standard Group classifies the financial assets measured at amortized
cost, at fair value through other comprehensive income and loan commitments and financial guarantees into the
following stages:
- stage 1 – performing financial instruments without significant increase in credit risk since initial
recognition
- stage 2 – performing financial instruments with significant increase in credit risk since initial recognition
but not credit-impaired
- stage 3 – non-performing, credit-impaired financial instruments
- POCI – purchased or originated credit impaired
OTP BANK PLC.
NOTES TO THE CONSOLIDATED FINANCIAL STATEMENTS
FOR THE YEAR ENDED 31 DECEMBER 2020
21
NOTE 2: SUMMARY OF SIGNIFICANT ACCOUNTING POLICIES [continued]
2.14. Loss allowance [continued]
Classification into risk classes [continued]
In the case of trade receivables and contract assets the Group applies the simplified approach and calculates only
lifetime expected credit loss. Simplified approach is the following:
- for the past 3 years the average annual balance of receivables under simplified approach is calculated,
- the written-off receivables under simplified approach are determined in the past 3 years,
- the loss allowance ratio will be the sum of the written-off amounts divided by the sum of the average
balances,
- the loss allowance is multiplied by the end-of-year balance and it will be the actual loss allowance on these
receivables,
- loss allowance should be recalculated annually.
Stage 1: financial instruments for which the events and conditions specified in respect of Stage 2 and Stage 3 do
not exist on the reporting date.
A client or loan must be qualified as default if one or both the following two conditions occur:
The client delays more than 90 days. This is considered a hard trigger.
There is reasonable probability that the client will not pay all of its obligation. This condition is examined
on the basis of probability criteria of default.
The subject of default qualification is that exposure (on-balance and off-balance) which originates credit risk (so
originated from loan commitments, risk-taking contracts).
A financial instruments shows significant increase in credit risk, and is allocated to stage 2, if in respect of which
any of the following triggers exist on the reporting date, without fulfilling any of the conditions for the allocation
to the non-performing stage (stage 3):
the payment delay exceeds 30 days,
it is classified as performing forborne,
based on individual decision, its currency suffered a significant "shock" since the disbursement of the
loan,
the transaction/client rating exceeds a predefined value or falls into a determined range, or compared to
the historic value it deteriorates to a predefined degree,
in the case retail mortgage loans, the loan-to-value ratio exceeds a predefined rate,
default on another loan of the retail client, if no cross-default exists,
monitoring classification of corporate and municipal clients above different thresholds defined on group
level (without aiming to give an exhaustive list):
- financial difficulties at the debtor (capital adequacy, liquidity, deterioration of the instrument
quality),
- significant decrease of the liquidity or the activity on the active market of the financial instrument
can be observed,
- the rating of the client reflects high risk but it is better than the default one,
- significantly decrease in the value of the recovery from which the debtor would disburse the loan,
- clients under liquidation.
A financial instrument is non-performing and it is allocated to Stage 3 when any of the following events or
conditions exists on the reporting date:
defaulted (based on the group level default definition),
classified as non-performing forborne (based on the group level forborne definition),
the monitoring classification of corporate and municipal clients above different thresholds defined on
group level (including but not limited to):
- breaching of contracts,
- significant financial difficulties of the debtor (like capital adequacy, liquidity, deterioration of the
instrument quality),
- bankruptcy, liquidation, debt settlement processes against debtor,
OTP BANK PLC.
NOTES TO THE CONSOLIDATED FINANCIAL STATEMENTS
FOR THE YEAR ENDED 31 DECEMBER 2020
22
NOTE 2: SUMMARY OF SIGNIFICANT ACCOUNTING POLICIES [continued]
2.14. Loss allowance [continued]
Classification into risk classes [continued]
- forced strike-off started against debtor,
- termination of loan contract by the bank,
- occurrence of fraud event,
- termination of the active market of the financial instrument.
-
If the exposure is no longer considered as credit impaired, the Group allocates this exposure to Stage 2.
When loss allowance is calculated at exposures categorized into stages the following process is needed by
stages:
- stage 1 (performing): loss allowance at an amount equal to 12-month expected credit loss should be
recognized,
- stage 2 (significant increase in credit risk): loss allowance at an amount equal to lifetime expected credit
loss should be recognized,
- stage 3 (non-performing): loss allowance at an amount equal to lifetime expected credit loss should be
recognized.
For lifetime expected credit losses, an entity shall estimate the risk of a default occurring on the financial
instrument during its expected life. 12-month expected credit losses are a portion of the lifetime expected credit
losses and represent the lifetime cash shortfalls that will result if a default occurs in the 12 months after the
reporting date (or a shorter period if the expected life of a financial instrument is less than 12 months), weighted
by the probability of that default occurring.
An entity shall measure expected credit losses of a financial instrument in a way that reflects:
- an unbiased and probability-weighted amount that is determined by evaluating a range of possible
outcomes
- the time value of money and
- reasonable and supportable information that is available without undue cost or effort at the reporting
date about past events, current conditions and forecasts of future economic conditions.
2.15. Sale and repurchase agreements, security lending
Where debt or equity securities are sold under a commitment to repurchase them at a pre-determined price, they
remain on the Consolidated Statement of Financial Position and the consideration received is recorded in Other
liabilities or Amounts due to banks, the National Governments, deposits from the National Banks and other
banks. Conversely, debt or equity securities purchased under a commitment to resell are not recognized in the
Consolidated Statement of Financial Position and the consideration paid is recorded either in Placements with
other banks or Deposits from customers. Interest is accrued based on the effective interest method evenly over
the life of the repurchase agreement.
In the case of security lending transactions the Group doesn’t recognize or derecognize the securities because
believes that the transferor retains substantially all the risks and rewards of the ownership of the securities. Only
a financial liability or financial receivable is recognized for the consideration amount.
2.16. Associates and other investments
Companies where the Bank has the ability to exercise significant influence are accounted for using the equity
method. Subsidiaries and associated companies that were not accounted for using the equity method and other
investments where the Bank does not hold a significant interest are recorded according to IFRS 9.
Under the equity method, the investment is initially recognized at cost, and the carrying amount is adjusted
subsequently for:
- the Group’s share of the post-acquisition profits or losses of the investee, which are recognized in the
Group’s profit or loss; and
- the distributions received from the investee, which reduce the carrying amount of the investment.

OTP BANK PLC.
NOTES TO THE CONSOLIDATED FINANCIAL STATEMENTS
FOR THE YEAR ENDED 31 DECEMBER 2020
23
NOTE 2: SUMMARY OF SIGNIFICANT ACCOUNTING POLICIES [continued]
2.16. Associates and other investments [continued]
The Group’s share of the profits or losses of the investee, or other changes in the investee’s equity, is determined
on the basis of its proportionate ownership interest. The Group recognizes its share of the investee’s income and
losses based on the percentage of the equity interest owned by the Group.
Gains and losses on the sale of investments are determined on the basis of the specific identification of the cost
of each investment.
2.17. Property and equipment, Intangible assets
Property and equipment and Intangible assets are stated at cost, less accumulated depreciation and amortization
and impairment, if any. The depreciable amount (book value less residual value) of the non-current assets must
be allocated over the useful lives.
Depreciation and amortization are computed using the straight-line method over the estimated useful lives of the
assets based on the following annual percentages:
Depreciation and amortization on Property and equipment and Intangible assets commence on the day such
assets are ready to use.
At each balance sheet date, the Group reviews the carrying value of its Property and equipment and Intangible
assets to determine if there is any indication that those assets have suffered an impairment loss. If any such
indication exists, the recoverable amount of the asset is estimated to determine the extent (if any) of the
impairment loss.
Where it is not possible to estimate the recoverable amount of an individual asset, the Group estimates the
recoverable amount of the cash-generating unit to which the asset belongs.
Where the carrying value of Property and equipment and Intangible assets is greater than the estimated
recoverable amount, it is impaired immediately to the estimated recoverable amount.
The Group may conclude contracts for purchasing property, equipment and intangible assets, where the purchase
price is settled in foreign currency. By entering into such agreements, firm commitment in foreign currency due
on a specified future date arises at the Group.
Reducing the foreign currency risk caused by firm commitment, forward foreign currency contracts may be
concluded to ensure the amount payable in foreign currency on a specified future date on one hand and to
eliminate the foreign currency risk arising until settlement date of the contract on the other hand.
In the case of an effective hedge the realized profit or loss of the hedging instrument is stated as the part of the
cost of the hedged asset as it has arisen until recognizing the asset.
2.18. Inventories
The inventories shall be measured at the lower of cost and net realisable value. The cost of inventories shall
comprise all costs of purchase, costs of conversion and other costs incurred in bringing the inventories to their
present location and condition.
The Group uses generally FIFO formulas to the measurement of inventories.
Inventories shall be removed from books when they are sold, unusable or destroyed. When inventories are sold,
the carrying amount of those inventories shall be recognized as an expense in the period in which the related
revenue is recognized.
Repossessed assets are classified as inventories.
Intangible assets
Software 3.33%-52.63%
Property rights 1.25%-50.0%
Property 0.1%-33.3%
Office equipment and vehicles 1-50%
Vehicle 5.63% - 48%
OTP BANK PLC.
NOTES TO THE CONSOLIDATED FINANCIAL STATEMENTS
FOR THE YEAR ENDED 31 DECEMBER 2020
24
NOTE 2: SUMMARY OF SIGNIFICANT ACCOUNTING POLICIES [continued]
2.19. Financial liabilities
The financial liabilities are presented within financial liabilities at fair value through profit or loss or financial
liabilities measured at amortized cost.
The Group at initial recognition measures financial liabilities at fair value plus or minus – in the case of a
financial liability not at fair value through profit or loss – transaction costs that are directly attributable to the
acquisition or issue of the financial liability.
Financial liabilities at fair value through profit or loss are either financial liabilities held for trading or they are
designated upon initial recognition as at fair value through profit or loss.
In connection to the derivative financial liabilities measured at fair value through profit or loss, the Group
presents the amount of change in their fair value originated from the changes of market conditions and business
environment.
The Group designated some financial liabilities upon initial recognition to measure at fair value through profit or
loss. This classification eliminates or significantly reduces a measurement or recognition inconsistency that
would otherwise arise from measuring assets or liabilities or recognising the gains and losses on them on
different bases (“accounting mismatch”).
In the case of financial liabilities measured at amortized cost fees and commissions related to the origination of
the financial liability are recognized through profit or loss during the maturity of the instrument using effective
interest method. In certain cases the Group repurchases a part of financial liabilities (mainly issued securities or
subordinated bonds) and the difference between the carrying amount of the financial liability and the amount
paid for it is recognized in the net profit or loss for the period and included in other operating income.
2.20. Leases
The Group as a lessor
Leases are classified as finance leases whenever the terms of the lease transfer substantially all the risks and
rewards of ownership to the lessee. All other leases are classified as operating leases. Lease classification is
made at the inception date and is reassessed only if there is a lease modification.
Finance leases
At the commencement date, a lessor derecognizes the assets held under a finance lease in its statement of
financial position and present them as a receivable at an amount equal to the net investment in the lease. The
lessor shall use the interest rate implicit in the lease to measure the net investment in the lease. Direct costs such
as commissions are included in the initial measurement of the finance lease receivables.
The Group as a lessor recognizes finance income over the lease term, based on a pattern reflecting a constant
periodic rate of return on the Group’s net investment in the lease. The Group applies the lease payments relating
to the period against the gross investment in the lease to reduce both the principal and the unearned finance
income.
The Group applies the derecognition and impairment requirements in IFRS 9 to the net investment in the lease.
Operating leases
The Group as a lessor recognizes lease payments from operating leases as income on either a straight-line basis
or another systematic basis.
The depreciation policy for depreciable underlying assets subject to operating leases is consistent with the
Group’s normal depreciation policy for similar assets. The Group accounts for a modification to an operating
lease as a new lease from the effective date of the modification, considering any prepaid or accrued lease
payments relating to the original lease as part of the lease payments for the new lease.
The Group as a lessee
The Group recognizes a right-of-use asset and a lease liability at the commencement of the lease term except for
short-term leases and leases, where the underlying asset is of low value (less than USD 5,000). For these leases,
the Group recognizes the lease payments as an expense on either a straight-line basis over the lease term or
another systematic basis if that basis is more representative of the pattern of the lessee’s benefit.

OTP BANK PLC.
NOTES TO THE CONSOLIDATED FINANCIAL STATEMENTS
FOR THE YEAR ENDED 31 DECEMBER 2020
25
NOTE 2: SUMMARY OF SIGNIFICANT ACCOUNTING POLICIES [continued]
2.20. Leases [continued]
The Group as a lessee [continued]
Deferred tax implication if the Group is lessee: At inception of the lease, there is no net lease asset or liability, no
tax base and, therefore, no temporary difference. Subsequently, as depreciation on the right-of-use asset initially
exceeds the rate at which the debt reduces, a net liability arises resulting in a deductible temporary difference on
which a deferred tax asset should be recognized if recoverable. Assuming that the lease liability is not repaid in
advance, the total discounted cash outflows should equal the total rental payments deductible for income tax
purposes.
Right-of-use asset
The right-of-use assets are initially measured at cost, subsequently the Group applies cost model and these assets
are depreciated on a straight line basis from the commencement date to the earlier of the end of the useful life of
the right-of-use asset or the end of the lease term. If the lease transfers ownership of the underlying asset to the
Group by the end of the lease term or if the cost of the right-of-use asset reflects that the Group will exercise a
purchase option, the right-of-use asset are depreciated from the commencement date to the end of the useful life
of the underlying asset.
Lease liability
At the commencement date, the lease liability is measured at the present value of the lease payments that are not
paid at that date discounted by using the rate implicit in the lease, or if this cannot be determined, by using the
incremental borrowing rate of the Group.Variable lease payments that do not depend on an index or a rate but
e.g. on revenues or usage are recognized as an expense. The Group always separates the non-lease components
of the lease contracts and accounts them as an expense. Lease payments must be included in the measurement of
the lease liability without value added taxes. Non-deductible VAT is recognized as other expense.
The lease liability is remeasured in case of reassessment of the lease liability or lease modification
2.21. Investment properties
Investment properties of the Group are land, buildings, part of buildings which held (as the owner or as the
lessee under a finance lease) to earn rentals or for capital appreciation or both, rather than for use in the
production or supply of services or for administrative purposes or sale in the ordinary course of business. The
Group measures the investment properties at cost less accumulated depreciation and impairment, if any.
The depreciable amount (book value less residual value) of the investment properties must be allocated over
their useful lives. The depreciation and amortization are computed using the straight-line method over the
estimated useful lives of the assets.
The Group discloses the fair value of the investment properties in Note 14 established mainly by external
experts.
2.22. Share capital
Share capital is the capital determined in the Articles of Association and registered by the Budapest-Capital
Regional Court. Share capital is the capital the Bank raised by issuing common stocks at the date the shares were
issued. The amount of share capital has not changed over the current period.
2.23. Treasury shares
Treasury shares are shares which are purchased on the stock exchange and the over-the-counter market by the
Bank and its subsidiaries and are presented in the Consolidated Financial Position at cost as a deduction from
Consolidated Shareholders’ Equity.
Gains and losses on the sale of treasury shares are credited or charged directly to shareholder’s equity.
Derecognition of treasury shares is based on the FIFO method.

OTP BANK PLC.
NOTES TO THE CONSOLIDATED FINANCIAL STATEMENTS
FOR THE YEAR ENDED 31 DECEMBER 2020
26
NOTE 2: SUMMARY OF SIGNIFICANT ACCOUNTING POLICIES [continued]
2.24. Non-current assets held-for-sale and discontinued operations
The Group classifies a non-current asset (or disposal group) as held for sale if its carrying amount will be
recovered principally through a sale transaction rather than through continuing use. The Group does not account
for a non-current asset that has been temporarily taken out of use as if it had been abandoned.
The Group measures a non-current asset (or disposal group) classified as held for sale at the lower of its carrying
amount and fair value less costs to sell. When the sale is expected to occur beyond one year, the Group measures
the costs to sell at their present value. Any increase in the present value of the costs to sell that arises from the
passage of time shall be presented in profit or loss. Immediately before the initial classification of the asset (or
disposal group) as held for sale, the carrying amounts of the asset (or all the assets and liabilities in the group)
shall be measured in accordance with applicable IFRS.
The Group does not depreciate (or amortize) a non-current asset while it is classified as held for sale or while it
is part of a disposal group classified as held for sale. Interest and other expenses attributable to the liabilities of a
disposal group classified as held for sale shall continue to be recognized.
If the Group has classified an asset (or disposal group) as held for sale, but the criteria for that are no longer met,
the Group ceases to classify the asset (or disposal group) as held for sale. The Group measures a non-current
asset that ceases to be classified as held for sale (or ceases to be included in a disposal group classified as held
for sale) at the lower of:
- its carrying amount before the asset (or disposal group) was classified as held for sale, adjusted for any
depreciation, amortisation or revaluations that would have been recognized had the asset (or disposal group)
not been classified as held for sale, and
- its recoverable amount at the date of the subsequent decision not to sell.
The Group presents a non-current asset classified as held for sale and the assets of a disposal group classified as
held for sale separately from other assets in the Consolidated Statement of Financial Position. The liabilities of a
disposal group classified as held for sale is presented separately from other liabilities in the Statement of
Financial Position. Those assets and liabilities shall not be offset and presented as a single amount. The major
classes of assets and liabilities classified as held for sale shall be separately disclosed in the Notes.
The Group presents separately any cumulative income or expense recognized in other comprehensive income
relating to a non-current asset (or disposal group) classified as held for sale. Results from discontinued
operations are reported separately in the consolidated statement of profit or loss as result from discontinued
operations.
2.25. Interest income and income similar to interest income and interest expense
Interest income and expense are recognized in profit or loss in the period to which they relate, using the effective
interest rate method. The time-proportional income similar to interest income of derivative financial instruments
is calculated without using the effective interest method and the positive fair value adjustment of interest rate
swaps are included in income similar to interest income.
Interest from loans and deposits are accrued on a daily basis. Interest income and expense include certain
transaction costs and the amortisation of any discount or premium between the initial carrying amount of an
interest-bearing instrument and its amount at maturity calculated on an effective interest rate basis.
All interest income and expense recognized are arising from loans, placements with other banks, repo
receivables, securities at fair value through other comprehensive income, securities at amortized cost and
amounts due to banks, repo liabilities, deposits from customers, liabilities from issued securities, subordinated
bonds and loans are presented under these lines of financial statements.
2.26. Fees and Commissions
Fees and commissions that are not involved in the amortized cost model are recognized in the Consolidated
Statement of Profit or Loss on an accrual basis according to IFRS 15 Revenue from contracts with customers
(see more details in Note 32). These fees are related to deposits, cash withdrawals, security trading, bank card
etc.
OTP BANK PLC.
NOTES TO THE CONSOLIDATED FINANCIAL STATEMENTS
FOR THE YEAR ENDED 31 DECEMBER 2020
27
NOTE 2: SUMMARY OF SIGNIFICANT ACCOUNTING POLICIES [continued]
2.27. Dividend income
Dividend income refers to any distribution of an entity earnings to shareholders from stocks or mutual funds that
is owned by the Group. The Group recognizes dividend income in the Consolidated Financial Statements when
its right to receive payment is established.
2.28. Income tax
The annual taxation charge is based on the tax payable under fiscal regulations prevailing in the country where
the company is incorporated, adjusted for deferred taxation.
Deferred taxation is accounted for using the balance sheet liability method in respect of temporary differences
between the tax bases of assets and liabilities and their carrying value for financial reporting purposes, measured
at the tax rates that apply to the future period when the asset is expected to be realized or the liability is settled.
Deferred tax assets are recognized by the Group for the amounts of income taxes that are recoverable in future
periods in respect of deductible temporary differences as well as the carryforward of unused tax losses and the
carryforward of unused tax credits.
The Group recognizes a deferred tax asset for all deductible temporary differences arising from investments in
subsidiaries, branches and associates, and interests in joint arrangements, to the extent that, and only to the extent
that, it is probable that:
- the temporary difference will reverse in the foreseeable future; and
- taxable profit will be available against which the temporary difference can be utilised.
The Group recognizes a deferred tax liability for all taxable temporary differences associated with investments in
subsidiaries, branches and associates, and interests in joint arrangements, except to the extent that both of the
following conditions are satisfied:
- the Bank is able to control the timing of the reversal of the temporary difference, and
- it is probable that the temporary difference will not reverse in the foreseeable future.
2.29. Banking tax
The Bank and some of its subsidiaries are obliged to pay banking tax based on Act LIX of 2006. The calculation
is based on the adjusted total assets as reported in the Separate Financial Statements of the Bank and its entities
for the second period preceding the current tax year (not on the taxable profit). Therefore, the banking tax is
considered as an other administrative expense, not as income tax.
2.30. Off-balance sheet commitments and contingent liabilities
In the ordinary course of its business, the Group enters into off-balance sheet commitments such as guarantees,
letters of credit, commitments to extend credit and transactions with financial instruments. The provision on off-
balance sheet commitments and contingent liabilities is maintained at a level adequate to absorb future cash
outflows which are probable and relate to present obligations.
In case of commitments and contingent liabilities, the management determines the adequacy of the loss
allowance based upon reviews of individual items, recent loss experience, current economic conditions, the risk
characteristics of the various categories of transactions and other pertinent factors. The Group recognizes
provision for off-balance sheet commitment and contingent liabilities in accordance with IAS 37 when it has a
present obligation as a result of a past event; it is probable that an outflow of resources embodying economic
benefits will be required to settle the obligation; and a reliable estimate can be made of the obligation. For
financial guarantees and loan commitments given which are under IFRS 9 the expected credit loss model is
applied when the provision is calculated (see more details in Note 2.14.).
OTP BANK PLC.
NOTES TO THE CONSOLIDATED FINANCIAL STATEMENTS
FOR THE YEAR ENDED 31 DECEMBER 2020
28
NOTE 2: SUMMARY OF SIGNIFICANT ACCOUNTING POLICIES [continued]
2.31. Share-based payment
The Bank has applied the requirements of IFRS 2 Share-based Payment.
The Bank issues equity-settled share-based payment to certain employees. Equity-settled share-based payment is
measured at fair value at the grant date. The fair value determined at the grant date of the equity-settled share-
based payment is expensed on a straight-line basis over the year, based on the Bank’s estimate of shares that will
eventually vest. Share-based payment is recorded in Consolidated Statement of Profit or Loss as Personnel
expenses.
Fair value is measured by use of a binomial model. The expected life used in the model has been adjusted, based
on Management’s best estimate, for the effects of non-transferability, exercise restrictions, and behavioural
considerations.
2.32. Employee benefits
The Group has applied the requirement of IAS 19 Employee Benefits. IAS 19 requires to recognize employee
benefits to be paid as a liability and as an expense in the Consolidated Financial Statements.
2.33. Consolidated Statement of Cash-flows
Cash flows arising from the operating, investing or financing activities are reported in the Statement of Cash-
Flows of the Group primarily on a gross basis. Net basis reporting are applied by the Group in the following
cases:
- when the cash flows reflect the activities of the customer rather than those of the Group, and
- for items in which the turnover is quick, the amounts are large, and the maturities are short.
For the purposes of reporting Consolidated Statement of Cash-flows, cash and cash equivalents include cash, due
from banks and balances with the National Banks, excluding the compulsory reserve established by the National
Banks. Consolidated cash-flows from hedging activities are classified in the same category as the item being
hedged. The unrealized gains and losses from the translation of monetary items to the closing foreign exchange
rates and unrealized gains and losses from derivative financial instruments are presented net in the statement of
cash-flows for the monetary items which have been revaluated.
2.34. Segment reporting
IFRS 8 Operating Segments requires operating segments to be identified on the basis of internal reports about
components of the Group that are regularly reviewed by the chief operating decision maker in order to allocate
resources to the segments and to assess their performance.
Based on the above, the segments identified by the Group are the business and geographical segments.
The Group’s operating segments under IFRS 8 are therefore as follows: OTP Core Hungary, Russia, Ukraine,
Bulgaria, Romania, Serbia, Croatia, Montenegro, Albania, Moldova, Slovenia, Merkantil Group, Asset
Management subsidiaries, Other subsidiaries, Corporate Center.
2.35. Comparative figures
Change in the classification and valuation policy of certain subsidized retail loans and FX margins
In 2020, the Group changed its accounting policy regarding the classification and valuation of a particular class
of subsidized retail loans. The interest payments on the retail loans are determined on the basis of the
government bond reference yields and a multiplier. Previously, in accordance with the Group's accounting
policy, these loans were measured at amortised cost. For the year ended 31 December 2020, the Group classified
this type of loan as measured at fair value through profit or loss. The new accounting policy is in line with the
practices of the majority of the players in the banking sector, thus better facilitating comparability. Therefore, in
the Bank's opinion, the change in accounting policy results in a more reliable, comparable and relevant
presentation of the effects of the loans in question on the Group's financial position and financial performance in
the financial statements.
OTP BANK PLC.
NOTES TO THE CONSOLIDATED FINANCIAL STATEMENTS
FOR THE YEAR ENDED 31 DECEMBER 2020
29
NOTE 2: SUMMARY OF SIGNIFICANT ACCOUNTING POLICIES [continued]
2.35. Comparative figures [continued]
Change in the classification and valuation policy of certain subsidized retail loans and FX margins
[continued]
In parallel with the change in accounting policy, the Group also changed the structure of its balance sheet. In the
statement of financial position, presenting loans in a uniform manner, based on the nature of the instruments, on
the line Loans at amortized cost and mandatorily at fair value through profit or loss, with further details of
classification and valuation category provided in Note 11 and any other notes as appropriate.
The new accounting policy is applied retrospectively by the Group as if it had always applied this accounting
policy. The Group has made the following adjustments to the comparative figures. At the beginning of the
comparative period and at the end of the comparative period, the change in accounting policy did not result in a
material change in the carrying amount of the loans involved or equity. Therefore, the Group did not change the
related balance sheet values for the adjustment relating to periods before those presented, and the Consolidated
Statement of Financial Position contains only the data at the end of the current period and at the end of the
comparative period.
As a result of the change in accounting policy, the Group adjusted the data of the comparative period in the
statement of profit or loss in accordance with the profit or loss items of the fair valuation categories. Due to the
unchanged carrying amounts in the balance sheet, this amendment resulted in the following reclassification
between profit or loss categories:
• The Group recognizes interest income on loans measured at fair value through profit or loss for the period in
the Income similar to Interest Income line at the value corresponding to transactional interest. The
comparative value of the line of interest income calculated using the effective interest rate method has been
reduced accordingly by the interest income of the respective loans determined using the previously applied
effective interest rate method.
• The Group presents the amount of commission income and commission expenses related to loans at fair value
through profit or loss in the Fee and commission income and Fee and commission expense lines.
• The Group presents the change in the fair value of loans measured at fair value through profit or loss, broken
down into two components:
o The Group presents the portion of the change in fair value arising from changes in credit risk within Risk
cost as Change in the fair value attributable to changes in the credit risk of loans mandatorily measured at
fair value through profit of loss. This amount is determined using expected credit loss models used for
loans measured at amortized cost. The comparative amount of Loss allowance on loans, placements and
repo receivables has been reduced accordingly with the loss allowance and reversal amounts for the
respective loans.
o The Group presents the remaining component of the change in fair value under the (Losses) / Gains on
financial instruments at fair value through profit or loss.
The change in accounting policy did not impact the net profit for the comparative period, nor the comparative
earnings per ordinary share.
The other reclassification shown below relates to realized foreign exchange results which were previously
presented within Net operating income. The change in presentation means that the result recognized on these
transactions is now presented in Income from fees and commissions.
In accordance with the new accounting policy, the Bank has amended its respective disclosure notes regarding
the loans at amortized cost. In the comparative figures, the Bank has reduced the previously disclosed amortized
cost, gross carrying amount, impairment and fair value data by the amounts related to the loans concerned. The
Group has also amended its disclosures in the notes on assets at fair value through profit or loss for comparative
information. These amendments have been marked “Revised” by the Bank. The Bank has also revised the
presentation of the detailed notes to the amended profit or loss line items for comparative information in
accordance with the new values in the statement of profit or loss.
OTP BANK PLC.
NOTES TO THE CONSOLIDATED FINANCIAL STATEMENTS
FOR THE YEAR ENDED 31 DECEMBER 2020
30
NOTE 2: SUMMARY OF SIGNIFICANT ACCOUNTING POLICIES [continued]
2.35. Comparative figures [continued]
Change in the classification and valuation policy of certain subsidized retail loans and FX margins
[continued]
Amendments to the information published in the supplementary annexes concerned the following supplementary
notes:
- Note 11 Loans at amortized cost and at fair value
- Note 30 Interest income, income similar to interest income and expenses
- Note 31 Loss allowances / impairment and provisions
- Note 36.1.1. Financial instruments by stages
- Note 36.1.2. Movement table of loss allowance / provision on financial instruments
- Note 36.1.3. Loan portfolio by countries
- Note 36.2. Maturity analysis of assets, liabilities and liquidity risk
- Note 36.4. Interest rate risk management
- Note 46 Net gain or loss realized on financial instruments
- Note 47 a) Fair value of financial assets and liabilities
- Note 48 Segment reporting by business and geographical segments
Except as described above, these consolidated financial statements are prepared in accordance with the same
accounting policies in all respects as the consolidated financial statements prepared in accordance with IFRS as
adopted by the European Union for the year ended 31 December 2019.
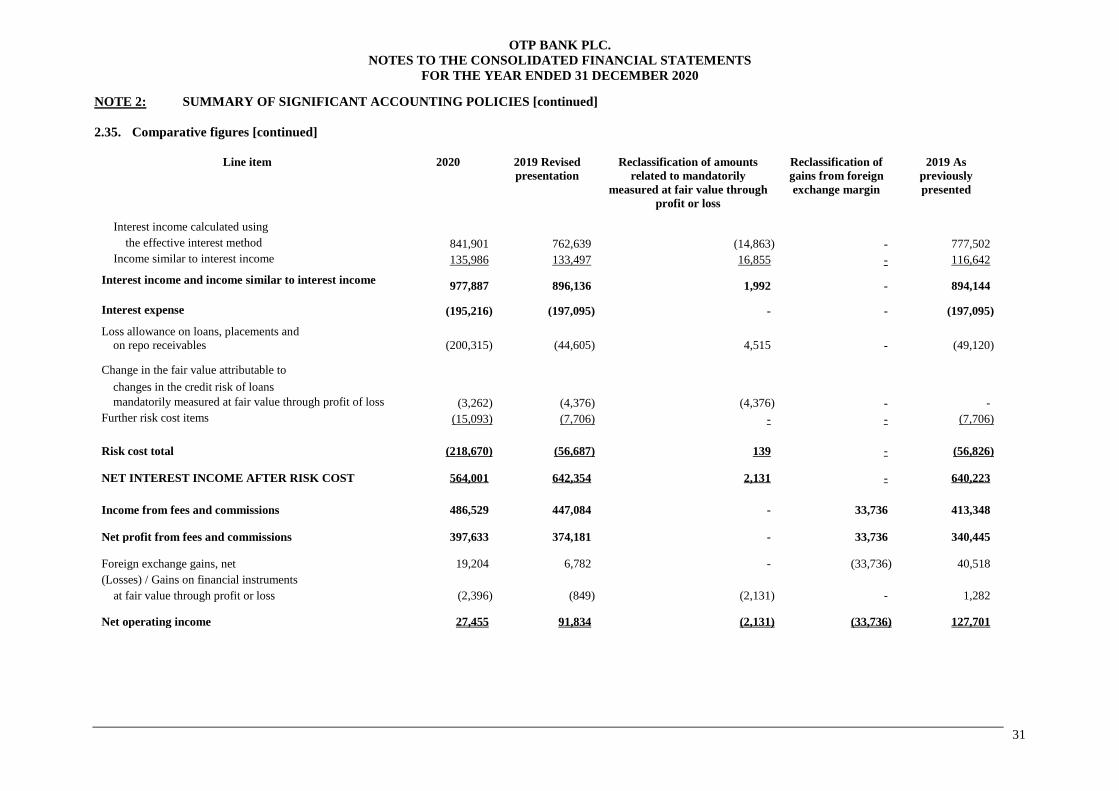
OTP BANK PLC.
NOTES TO THE CONSOLIDATED FINANCIAL STATEMENTS
FOR THE YEAR ENDED 31 DECEMBER 2020
31
NOTE 2: SUMMARY OF SIGNIFICANT ACCOUNTING POLICIES [continued]
2.35. Comparative figures [continued]
Line item 2020 2019 Revised
presentation
Reclassification of amounts
related to mandatorily
measured at fair value through
profit or loss
Reclassification of
gains from foreign
exchange margin
2019 As
previously
presented
Interest income calculated using
the effective interest method 841,901 762,639 (14,863) - 777,502
Income similar to interest income 135,986 133,497 16,855 - 116,642
Interest income and income similar to interest income 977,887 896,136 1,992 - 894,144
Interest expense (195,216) (197,095) - - (197,095)
Loss allowance on loans, placements and
on repo receivables (200,315) (44,605) 4,515 - (49,120)
Change in the fair value attributable to
changes in the credit risk of loans
mandatorily measured at fair value through profit of loss (3,262) (4,376) (4,376) - -
Further risk cost items (15,093) (7,706) - - (7,706)
Risk cost total (218,670) (56,687) 139 - (56,826)
NET INTEREST INCOME AFTER RISK COST 564,001 642,354 2,131 - 640,223
Income from fees and commissions 486,529 447,084 - 33,736 413,348
Net profit from fees and commissions 397,633 374,181 - 33,736 340,445
Foreign exchange gains, net 19,204 6,782 - (33,736) 40,518
(Losses) / Gains on financial instruments
at fair value through profit or loss (2,396) (849) (2,131) - 1,282
Net operating income 27,455 91,834 (2,131) (33,736) 127,701
OTP BANK PLC.
NOTES TO THE CONSOLIDATED FINANCIAL STATEMENTS
FOR THE YEAR ENDED 31 DECEMBER 2020
32
NOTE 3: SIGNIFICANT ACCOUNTING ESTIMATES AND DECISIONS IN THE
APPLICATION OF ACCOUNTING POLICIES
The presentation of financial statements in conformity with IFRS as adopted by EU requires the
Management of the Group to make judgement about estimates and assumptions that affect the reported
amounts of assets and liabilities and the disclosure of contingent assets and liabilities as at the date of the
financial statements and their reported amounts of revenues and expenses during the reporting period.
The estimates and associated assumptions are based on expected loss and other factors that are considered
to be relevant. The estimates and underlying assumptions are reviewed on an ongoing basis. Revisions to
accounting estimates are recognized in the period. Actual results could differ from those estimates.
Significant areas of subjective judgement include:
3.1. Loss allowances on financial instruments exposed to credit risk
The Group regularly assesses its financial instruments portfolio for loss allowance. Management
determines the adequacy of the loss allowances based upon reviews of individual loans and placements,
recent loss experience, current economic conditions, the risk characteristics of the various categories of
loans and other pertinent factors.
The use of the three stage model was implemented for IFRS 9 purposes. The impairment methodology is
used to classify financial instruments in order to determine whether credit risk has significantly
increased since initial recognition and to identify the credit-impaired assets. For instruments with credit-
impairment or significant increase of credit risk lifetime expected losses will be recognized (see more
details in Note 36.1.)
3.2. Valuation of instruments without direct quotations
Financial instruments without direct quotations in an active market are valued using the valuation model
technique. The models are regularly reviewed and each model is calibrated for the most recent available
market data. While the models are built only on available data, their use is subject to certain assumptions
and estimates (e.g. correlations, volatilities, etc.). Changes in the model assumptions may affect the
reported fair value of the relevant financial instruments.
IFRS 13 Fair Value Measurement seeks to increase consistency and comparability in fair value
measurements and related disclosures through a 'fair value hierarchy'. The hierarchy categorises the
inputs used in valuation techniques into three levels. The hierarchy gives the highest priority to
(unadjusted) quoted prices in active markets for identical assets or liabilities and the lowest priority to
unobservable inputs. The objective of a fair value measurement is to estimate the price at which an
orderly transaction to sell the asset or to transfer the liability would take place between market
participants at the measurement date under current market conditions.
3.3. Provisions
Provision is recognized and measured for commitments to extend credit and for warranties arising from
banking activities based on IFRS 9 Financial Instruments. Provision for these instruments is recognized
based on the credit conversion factor, which shows the proportion of the undrawn credit line that will
probably be drawn.
Other provisions are recognized and measured based on IAS 37 Provisions, Contingent Liabilities and
Contingent Assets. The Group is involved in a number of ongoing legal disputes. Based upon historical
experience and expert reports, the Group assesses the developments in these cases, and the likelihood and
the amount of potential financial losses which are appropriately provided for. (See Note 24.)
Other provision includes provision for litigation, provision for retirement and expected liabilities and
provision for confirmed letter of credit.
A provision is recognized by the Group when it has a present obligation as a result of a past event, it is
probable that an outflow of resources embodying economic benefits will be required to settle the
obligation, and a reliable estimate can be made of the amount of the obligation.
OTP BANK PLC.
NOTES TO THE CONSOLIDATED FINANCIAL STATEMENTS
FOR THE YEAR ENDED 31 DECEMBER 2020
33
NOTE 3: SIGNIFICANT ACCOUNTING ESTIMATES AND DECISIONS IN THE
APPLICATION OF ACCOUNTING POLICIES [continued]
3.4. Impairment on goodwill
Goodwill acquired in a business combination is tested for impairment annually or more frequently when
there is an indication that the unit might be impaired, in accordance with IAS 36 “Impairment of assets”.
The Group calculates the fair value based on discounted cash-flow model. The 3 year period explicit
cash-flow model serves as a basis for the impairment test by which the Group defines the impairment
need on goodwill based on the strategic factors and financial data of its cash-generating units. In the
calculation of the goodwill impairment, also the expectations about possible variations in the amount or
timing of those future cash-flows, the time value of money, represented by the current market risk-free
rate of interest and other factors are reflected.
3.5. Business model
The financial assets held by the Group are classified into three categories depending on the business
model within the financial assets are managed.
Business model whose objective is to hold financial assets in order to collect contractual cash
flows. Within this business model the Group manages mainly loans and advances and long term
securities and other financial assets.
Business model whose objective is achieved by both collecting contractual cash flows and
selling financial assets. Within this business model the Group only manages securities.
Business model whose objective is to achieve gains in a short term period. Within this business
model the Group manages securities and derivative financial instrument.
OTP BANK PLC.
NOTES TO THE CONSOLIDATED FINANCIAL STATEMENTS
FOR THE YEAR ENDED 31 DECEMBER 2020
34
NOTE 4: IMPACT OF CORONA VIRUS (COVID-19)
Covid-19 has had substantial implications for the operations of the Group during 2020. Below are some
of the more important Covid-19 related events that occurred by country of operation.
Hungary
On 16 March 2020 the NBH decided to expand the range of eligible collaterals with performing
corporate loans. Effective from 11 May 2020 only corporate loans exceeding HUF 1 billion can be
used as collateral in the liquidity providing operations.
In addition to the 1, 3, 6 and 12-month tenders announced every Monday in the same way, the NBH
announced one-week FX swap tenders providing forint liquidity on a daily basis from 17 March 2020
until further notice, in order to maintain the appropriate level of liquidity for the banking sector.
On 18 March 2020 the NBH took measures to support the operation of banks and strengthen the
banking system. Among others the NBH requested banks and their owners to make sure that
dividends are neither approved, nor paid until the end of September of 2020.
On 18 March 2020 the Prime Minister of Hungary announced the first stage of economic and job
protection measures.The steps, among others, included:
o a blanket debt repayment moratorium;
o the introduction of the annual percentage rate “APR” caps on new consumer loans: pursuant to
the relevant Government Decrees, APR is temporarily capped at central bank base rate + 5
percentage points in the case of loans to consumers that are not collateralized by a mortgage and
are disbursed based on a contract concluded after 19 March 2020. This provision must be applied
until 31 December 2020, then following this deadline the APR set out in the given lender’s
Terms & Conditions effective at the time of the signing of the contract will be applicable;
o the extension of short-term business loans until 30 June.
Pursuant to Government Decree No. 47/2020. (III. 18.) and Government Decree No. 62/2020. (III.
24.), a moratorium on payments was introduced in Hungary concerning both principal, interest and fee
payment obligations arising from both credit, loan and finance lease amounts that have already been
disbursed until 18 March 2020. The moratorium did not involve debt forgiveness element. The first
moratorium was effective until 31 December 2020. The scope of the moratorium included, among
others, both retail and corporate debtors. Regarding details and technical provisions, the non-paid
interest during the payment holiday cannot be capitalized to the outstanding principal (neither during
the moratorium, nor afterwards). The amount of delayed interest accumulated during the moratorium
must be repaid after the moratorium in equal instalments, evenly spread over the remaining years of
the loan tenor, together with the due instalments. Following the moratorium, the tenor will be
prolonged in a way that the sum of the due instalment and the unpaid interest during the moratorium
(which is to be repaid in equal instalments) in total should not exceed the instalment according to the
original contract. Rules applicable to the interest must also be applied to the fees. The borrower’s
participation was automatic, but the moratorium did not affect the debtors’ right to continue to pay
according to the original contractual terms.
On its 24 March 2020 meeting the Monetary Council decided to introduce a new fixed-rate
collateralized loan instrument with maturities of 3, 6 and 12 months and 3 and 5 years. Lending will
be provided by the NBH at a fixed interest rate (the NBH defines the interest rate of the instrument at
each tender, but the rate may not be lower than the base rate).
On 1 April 2020 the NBH decided to announce one-week deposit tenders at a weekly frequency. The
interest rate on the instrument equals to the central bank base rate.
On 1 April 2020 the NBH announced that effective from 1 July the capital buffer requirements for
systemically important banks will be released. The banks must rebuild their capital buffer initially
prescribed for 2020 gradually in three years from 2022 onwards. At the time of the decision the O-SII
buffer applicable for OTP Bank was 2%.
On 4 April 2020 the Minister of Prime Minister's Office revealed that the Government expects banks
to contribute HUF 55 billion into the new epidemic fund. Pursuant to the Government Decree
108/2020 published on 14 April, the new special tax levied on banks is to be paid in the 2020 tax year,
in three equal instalments (in June, September and December). The base of the new special tax is that
part of the adjusted total assets (as defined in the legislation on the “old” bank tax) that exceeds HUF
50 billion. The tax rate is 19 bps.
On 9 June 2020 the law allowing the deductibility of the new special banking levy payable in 2020
was promulgated. The new once-off special banking tax will be returned to the banking system over
the next five years through deductions from the nominal amount of the “old” bank tax (in the form of
tax withholding).
OTP BANK PLC.
NOTES TO THE CONSOLIDATED FINANCIAL STATEMENTS
FOR THE YEAR ENDED 31 DECEMBER 2020
35
NOTE 4: IMPACT OF CORONA VIRUS (COVID-19) [continued]
Hungary [continued]
The new special tax amounts to HUF 14.2 billion in the case of the Hungarian Group members of
OTP Group. Pursuant to IFRS standards, parallel with the accounting of this new bank levy amongst
the other expenses, the Group recognized the net present value of the related tax claims amongst the
other income. Therefore, the new special tax did not materially affect the Group’s bottom line
earnings neither in 2020, nor will it do so over the next 5 years.
On 7 April 2020 the NBH adjusted its policy instruments and modified its operational framework. The
Monetary Council decided to make the interest rate corridor symmetrical, and left the base rate and
the overnight deposit rate unchanged at 0.9% and -0.05%, respectively, and raised the overnight and
one-week collateralized lending rates to 1.85%. The one-week deposit rate, at the time of the
announcement, was equal to the 0.9% base rate; however, the Monetary Council decided to allow the
interest rate on the instrument to deviate from the base rate upward or downward within the interest
rate corridor. The NBH said that it will set the interest rate on the instrument each week, at the time of
the actual tender’s announcement.
As part of the comprehensive set of measures outlined by the NBH on 7 April 2020, it decided to
o launch a government security purchase programme in the secondary market to restore the stable
liquidity position of the government securities market and influence the longer part of the yield
curve, and to relaunch its mortgage bond purchase programme to improve the long-term supply
of funding to the banking sector.
Details of the programmes including the timing and strategic parameters were revealed on 28
April: accordingly, the NBH launched its government securities and mortgage bonds purchase
programmes on 4 May 2020, and it will continue to purchase securities as long as economic and
financial developments arising from the coronavirus pandemic require it.
The NBH did not set a total amount of purchases for either programme.
o The NBH launched the Funding for Growth Scheme Go! scheme on 20 April 2020. Including
HUF 500 billion undrawn under the FGS fix, the NBH made available up to HUF 1,500 billion to
the SME sector under the FGS Go!.
o Within the framework of the Bond Funding for Growth Scheme, the so far unutilized over HUF
200 billion was still available for the NBH to purchase bonds issued by non-financial
corporations headquartered in Hungary.
On 16 April 2020 the Minister of Finance revealed further tax concessions amounting to HUF 200
billion. Among others, the social security contributions payable by employers were cut to 15.5% from
17.5% effective from July 2020.
On 2 July 2020, the NBH decided to expand the loan purposes available in the FGS Go! structure.
On 10 September 2020 the National Bank of Hungary, in the wake of increased uncertainties amid the
pandemic, called upon credit institutions to extend the previously applied restriction on dividend
payments and decisions, which was effective until 30 September 2020, until 1 January 2021.
On 22 September 2020 the NBH increased the available amount under the Bond Funding for Growth
programme from HUF 450 to 750 billion.
As the utilisation of the Funding for Growth Go! scheme exceeded HUF 1,000 billion by mid-
November, on 17 November 2020 the Monetary Council decided to raise the total available amount
by HUF 1,000 billion (to HUF 2,500 billion).
As set out in Government Decree 518/2020. (XI. 25.), published in the Gazette on 25 November 2020,
starting from 1 January 2021 the Hungarian Government provides a non-refundable home renovation
subsidy to families raising or expecting children by way of refunding certain part of their home
renovation costs. Eligible families can get back 50% of their proven improvement expenses following
the completion of the renewal, but maximum HUF 3 million. The subsidy can be applied for within 60
days after completing the home renovation and also paying the bills by the families, or until 31
December 2022 the latest.
OTP BANK PLC.
NOTES TO THE CONSOLIDATED FINANCIAL STATEMENTS
FOR THE YEAR ENDED 31 DECEMBER 2020
36
NOTE 4: IMPACT OF CORONA VIRUS (COVID-19) [continued]
Hungary [continued]
On 19 December 2020 the Prime Minister announced the following measures directly affecting
banking operations:
o Extension of the payment moratorium in unchanged form: pursuant to Government Decree
637/2020. (XII. 22.) those borrowers are eligible for the moratorium effective between 1 January
2021 – 30 June 2021 that have principal, interest and fee payment obligations arising from a
credit contract that have already been disbursed until 18 March 2020 (also considering
Subsection (1) of Section 3 of Act CVII of 2020). With the above Decree the eligibility
conditions stipulated in Act CVII of 2020 (published on 28 October 2020) for retail and
corporate borrowers were repealed.
o Subsidized home renovation loan: in order to help eligible families to take advantage of the non-
refundable home renovation subsidy (for details, see Government Decree 518/2020. (XI. 25.)), a
subsidized home renovation loan (for details, see Government Decree 641/2020 (XII. 22.)) was
introduced by the Government.
On 28 December 2020 the National Bank of Hungary announced that the following decisions were
made:
o The central bank recommended credit institutions not to pay dividends or not to make any
irrevocable commitment to pay dividends after the 2019 and 2020 financial year, or from
previous years’ profits, until 30 September 2021. Furthermore, the central bank suggested that
credit institutions should refrain from treasury share purchases for shareholder remuneration
purposes until the same date (share buybacks for management remuneration purposes are an
exemption). The related guideline was set out in a management circular published on 8 January
2021.
o The NBH decided to amend the relevant detailed guidelines set out in its IFRS circular about the
application of non-performing and forborne categories in connection with the payment
moratorium, and based on this, its guidelines for creating provisions. The amended circular was
released on 22 January 2021.
Effective from 13 January 2021 the National Bank of Hungary extended the available amount for the
Bond Funding for Growth scheme by HUF 750 billion to HUF 1,150 billion. At the same time it
decided to increase the maximum maturity of corporate bonds that can be purchased by the central
bank from 20 to 30 years. Also, the central bank’s exposure limit to a company group was revised
from HUF 50 billion to HUF 70 billion.
On 4 February 2021 the Prime Minister announced an interest-free loan programme for companies in
trouble in the wake of the pandemic. According to Government Resolution 1038/2021. (II. 5.) the
programme will be administered by the Hungarian Development Bank, and the available amount
under the programme will be HUF 100 billion. Companies can take out maximum HUF 10 million
each for the purpose of covering wages and social contributions, overhead costs, general operating
expenses and inventory financing. Client interest rate is 0%, the loan tenor can be up to 10 years, and
the servicing of the loan will start after a 3 year grace period. The scope of eligible entities will be
discussed with the Hungarian Chamber of Commerce and Industry.
Bulgaria
On 19 March 2020 the Bulgarian National Bank (BNB) announced its decisions with the aim to
strengthen the capital and liquidity position of the banking system:
o to cancel the increase of the countercyclical capital buffer to 1% planned for 2020 and to 1.5%
planned for 2021;
o credit institutions shall not distribute dividends from the 2019 realized profit nor distribute other
elements of the capital which are retained from the financial results from previous years.
On 24 March 2020 key tax and spending measures were implemented: it was disallowed to accrue
penalty interest and to carry out any action that may have negative consequences for borrowers due to
non-payment. Legal enforcement and eviction procedures were also frozen during the emergency
period.
On 10 April 2020 the BNB approved the draft of the payment moratorium, which provides specific
terms of the deferred payment. Accordingly, banks could voluntarily offer the moratorium to their
clients. The eligible clients are those private individuals or companies who did not have more than 90
days of delay as at 1 March 2020, and have faced difficulties in meeting their obligations due to the
COVID 19 pandemic. Participation was not automatic, clients had to indicate their intention to
participate.
OTP BANK PLC.
NOTES TO THE CONSOLIDATED FINANCIAL STATEMENTS
FOR THE YEAR ENDED 31 DECEMBER 2020
37
NOTE 4: IMPACT OF CORONA VIRUS (COVID-19) [continued]
Bulgaria [continued]
On 10 July 2020 Bulgaria officially joined the ERM-II currency mechanism.
On 14 July 2020 the Bulgarian National Bank decided to extend the deadlines of the moratorium on
payments. Accordingly, the deadline for submitting a request by customers for postponing payments
and their approval by banks was extended until 30 September 2020; the deadline for postponing
payments was extended until 31 March 2021. The extension of the deadlines applies to exposures for
which no request for moratorium participation was submitted before 22 June 2020.
DSK Bank is supervised by the ECB starting from 1 October 2020.
On 11 December 2020, the National Bank of Bulgaria approved the extension of the debt repayment
moratorium. The deadline to apply for the moratorium is 23 March 2021. Borrowers can take
advantage of the deferral until 31 December 2021, but for maximum nine months altogether. Debtors
who are not more than 90 days past due at the application date can benefit from the moratorium. In
cases where the request for deferral was submitted before 30 September 2020, further deferral is
possible, provided that the total duration of the moratorium does not exceed nine months.
Croatia
On 20 March 2020 the Croatian National Bank (HNB) imposed measures on credit institutions
regarding the retention of net income for 2019.
On 20 March 2020 the HNB reduced the mandatory reserve requirement ratio from 12 to 9%, and
started purchasing Republic of Croatia bonds with an aim of maintaining stability in the market of
government securities.
A payment moratorium on loans has not been implemented in Croatia through legislation. Therefore,
the application for moratorium is voluntary and has to be requested by the client.
However, on 1 April 2020 the Croatian Banking Association outlined a non-binding regime which
could serve as a basis for setting the conditions of banks’ own moratoria offered to their clients.
Furthermore, all banks agreed not to initiate forced collection measures for the collection of debt
from their debtors who, in the period of three months starting from April 2020, failed to meet their
payment obligations. The measure applied to both legal and natural persons.
On 10 July 2020 Croatia officially joined the ERM-II currency mechanism.
On 1 October 2020, the loan repayment moratorium was extended (applications will be accepted
until 31 March 2021.). The extension of the moratorium is available to customers whose primary
source of income is the tourism sector, those living in earthquake-hit areas, and whose income has
decreased by at least 30% compared to 2019. The duration of the moratorium can be up to 9 months
except for those living in the area affected by the earthquake, for those borrowers it is 12 months.
Serbia
On 18 March 2020 the National Bank of Serbia adopted decisions imposing a moratorium on debt
payments:
a) the moratorium was available for all debtors (natural persons, farmers and entrepreneurs,
corporates);
b) it implied a suspension of debt payments for at least 90 days and/or for the duration of the
emergency state;
c) lessors will not charge any default interest on past due outstanding receivables and will not
initiate enforcement or enforced collection procedures, or take other legal actions to collect
receivables from their clients.
On 27 July 2020 National Bank of Serbia has adopted a regulation that offers borrowers one more
suspension in the settlement of their liabilities to banks, maturing in the period between 1 August
2020 and 30 September 2020, as well as a suspension in the payment of liabilities that matured in July
2020, and which the borrower has not settled.
In December 2020 the Serbian central bank decided to introduce the third round of payment
moratorium with an effect between 1 January - 30 June 2021. The participation is opt-in. The deadline
for submitting request by borrowers is 30 April 2021.
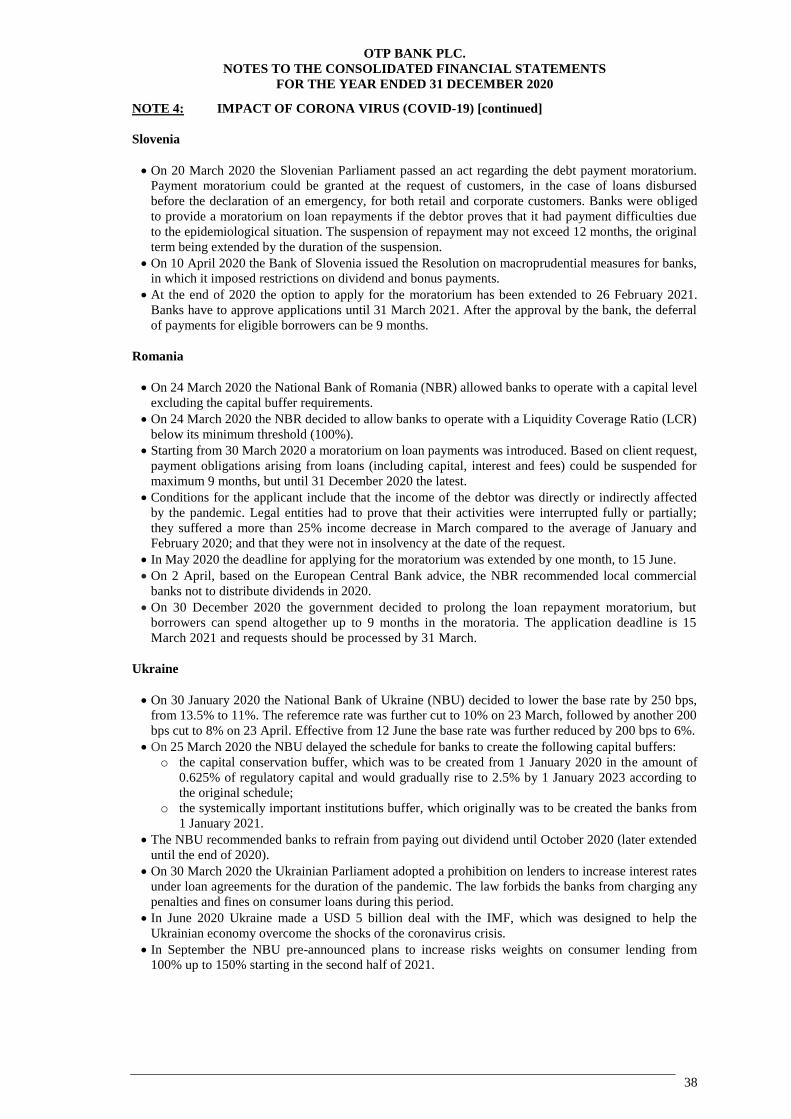
OTP BANK PLC.
NOTES TO THE CONSOLIDATED FINANCIAL STATEMENTS
FOR THE YEAR ENDED 31 DECEMBER 2020
38
NOTE 4: IMPACT OF CORONA VIRUS (COVID-19) [continued]
Slovenia
On 20 March 2020 the Slovenian Parliament passed an act regarding the debt payment moratorium.
Payment moratorium could be granted at the request of customers, in the case of loans disbursed
before the declaration of an emergency, for both retail and corporate customers. Banks were obliged
to provide a moratorium on loan repayments if the debtor proves that it had payment difficulties due
to the epidemiological situation. The suspension of repayment may not exceed 12 months, the original
term being extended by the duration of the suspension.
On 10 April 2020 the Bank of Slovenia issued the Resolution on macroprudential measures for banks,
in which it imposed restrictions on dividend and bonus payments.
At the end of 2020 the option to apply for the moratorium has been extended to 26 February 2021.
Banks have to approve applications until 31 March 2021. After the approval by the bank, the deferral
of payments for eligible borrowers can be 9 months.
Romania
On 24 March 2020 the National Bank of Romania (NBR) allowed banks to operate with a capital level
excluding the capital buffer requirements.
On 24 March 2020 the NBR decided to allow banks to operate with a Liquidity Coverage Ratio (LCR)
below its minimum threshold (100%).
Starting from 30 March 2020 a moratorium on loan payments was introduced. Based on client request,
payment obligations arising from loans (including capital, interest and fees) could be suspended for
maximum 9 months, but until 31 December 2020 the latest.
Conditions for the applicant include that the income of the debtor was directly or indirectly affected
by the pandemic. Legal entities had to prove that their activities were interrupted fully or partially;
they suffered a more than 25% income decrease in March compared to the average of January and
February 2020; and that they were not in insolvency at the date of the request.
In May 2020 the deadline for applying for the moratorium was extended by one month, to 15 June.
On 2 April, based on the European Central Bank advice, the NBR recommended local commercial
banks not to distribute dividends in 2020.
On 30 December 2020 the government decided to prolong the loan repayment moratorium, but
borrowers can spend altogether up to 9 months in the moratoria. The application deadline is 15
March 2021 and requests should be processed by 31 March.
Ukraine
On 30 January 2020 the National Bank of Ukraine (NBU) decided to lower the base rate by 250 bps,
from 13.5% to 11%. The referemce rate was further cut to 10% on 23 March, followed by another 200
bps cut to 8% on 23 April. Effective from 12 June the base rate was further reduced by 200 bps to 6%.
On 25 March 2020 the NBU delayed the schedule for banks to create the following capital buffers:
o the capital conservation buffer, which was to be created from 1 January 2020 in the amount of
0.625% of regulatory capital and would gradually rise to 2.5% by 1 January 2023 according to
the original schedule;
o the systemically important institutions buffer, which originally was to be created the banks from
1 January 2021.
The NBU recommended banks to refrain from paying out dividend until October 2020 (later extended
until the end of 2020).
On 30 March 2020 the Ukrainian Parliament adopted a prohibition on lenders to increase interest rates
under loan agreements for the duration of the pandemic. The law forbids the banks from charging any
penalties and fines on consumer loans during this period.
In June 2020 Ukraine made a USD 5 billion deal with the IMF, which was designed to help the
Ukrainian economy overcome the shocks of the coronavirus crisis.
In September the NBU pre-announced plans to increase risks weights on consumer lending from
100% up to 150% starting in the second half of 2021.
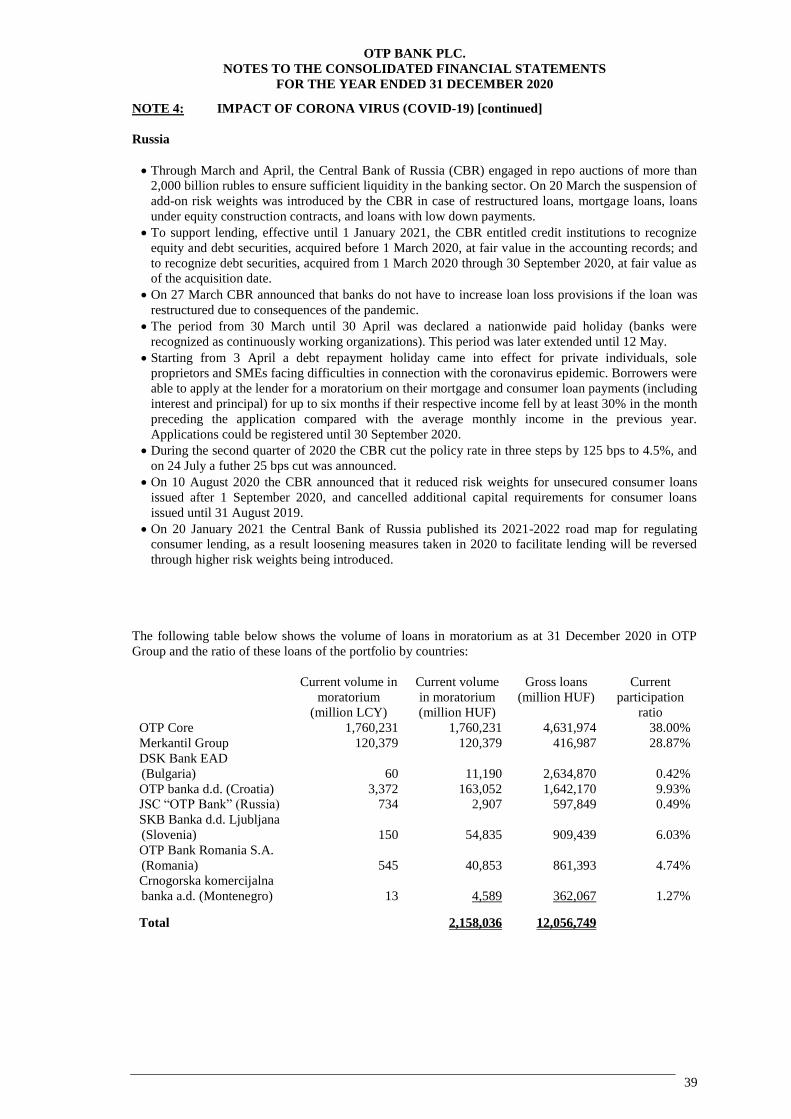
OTP BANK PLC.
NOTES TO THE CONSOLIDATED FINANCIAL STATEMENTS
FOR THE YEAR ENDED 31 DECEMBER 2020
39
NOTE 4: IMPACT OF CORONA VIRUS (COVID-19) [continued]
Russia
Through March and April, the Central Bank of Russia (CBR) engaged in repo auctions of more than
2,000 billion rubles to ensure sufficient liquidity in the banking sector. On 20 March the suspension of
add-on risk weights was introduced by the CBR in case of restructured loans, mortgage loans, loans
under equity construction contracts, and loans with low down payments.
To support lending, effective until 1 January 2021, the CBR entitled credit institutions to recognize
equity and debt securities, acquired before 1 March 2020, at fair value in the accounting records; and
to recognize debt securities, acquired from 1 March 2020 through 30 September 2020, at fair value as
of the acquisition date.
On 27 March CBR announced that banks do not have to increase loan loss provisions if the loan was
restructured due to consequences of the pandemic.
The period from 30 March until 30 April was declared a nationwide paid holiday (banks were
recognized as continuously working organizations). This period was later extended until 12 May.
Starting from 3 April a debt repayment holiday came into effect for private individuals, sole
proprietors and SMEs facing difficulties in connection with the coronavirus epidemic. Borrowers were
able to apply at the lender for a moratorium on their mortgage and consumer loan payments (including
interest and principal) for up to six months if their respective income fell by at least 30% in the month
preceding the application compared with the average monthly income in the previous year.
Applications could be registered until 30 September 2020.
During the second quarter of 2020 the CBR cut the policy rate in three steps by 125 bps to 4.5%, and
on 24 July a futher 25 bps cut was announced.
On 10 August 2020 the CBR announced that it reduced risk weights for unsecured consumer loans
issued after 1 September 2020, and cancelled additional capital requirements for consumer loans
issued until 31 August 2019.
On 20 January 2021 the Central Bank of Russia published its 2021-2022 road map for regulating
consumer lending, as a result loosening measures taken in 2020 to facilitate lending will be reversed
through higher risk weights being introduced.
The following table below shows the volume of loans in moratorium as at 31 December 2020 in OTP
Group and the ratio of these loans of the portfolio by countries:
Current volume in
moratorium
(million LCY)
Current volume
in moratorium
(million HUF)
Gross loans
(million HUF)
Current
participation
ratio
OTP Core 1,760,231 1,760,231 4,631,974 38.00%
Merkantil Group 120,379 120,379 416,987 28.87%
DSK Bank EAD
(Bulgaria) 60 11,190 2,634,870 0.42%
OTP banka d.d. (Croatia) 3,372 163,052 1,642,170 9.93%
JSC “OTP Bank” (Russia) 734 2,907 597,849 0.49%
SKB Banka d.d. Ljubljana
(Slovenia) 150 54,835 909,439 6.03%
OTP Bank Romania S.A.
(Romania) 545 40,853 861,393 4.74%
Crnogorska komercijalna
banka a.d. (Montenegro) 13 4,589 362,067 1.27%
Total 2,158,036 12,056,749
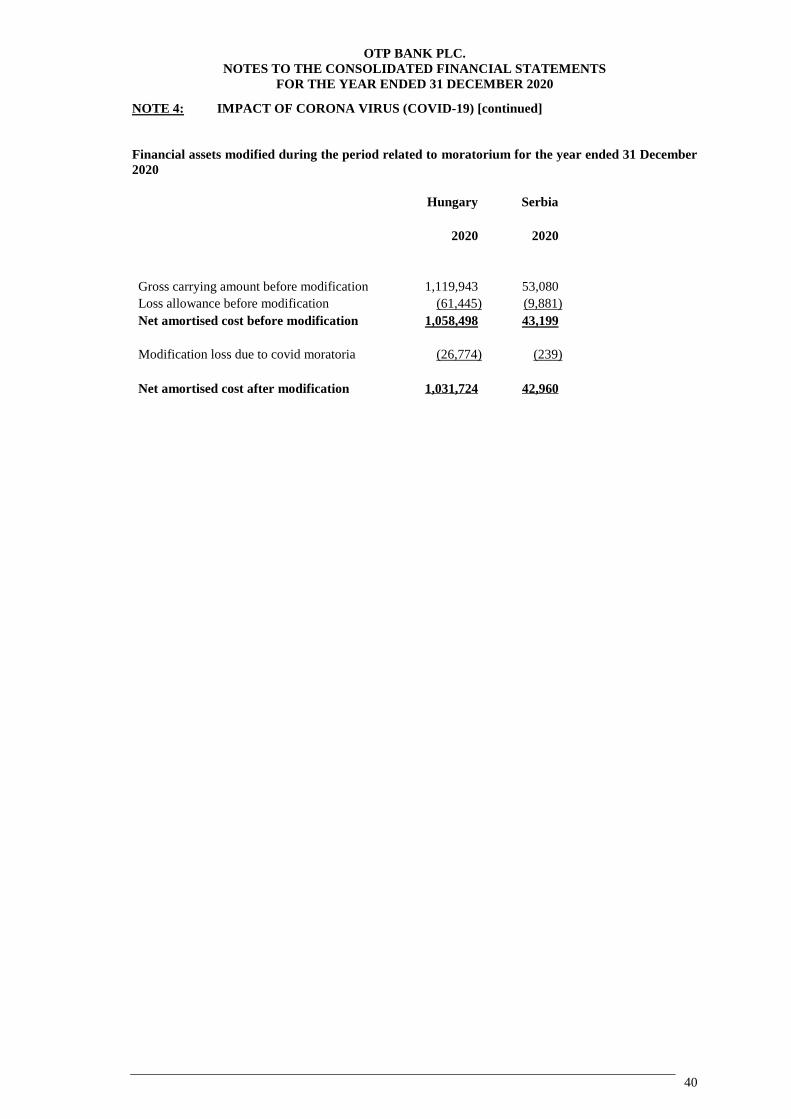
OTP BANK PLC.
NOTES TO THE CONSOLIDATED FINANCIAL STATEMENTS
FOR THE YEAR ENDED 31 DECEMBER 2020
40
NOTE 4: IMPACT OF CORONA VIRUS (COVID-19) [continued]
Financial assets modified during the period related to moratorium for the year ended 31 December
2020
Hungary Serbia
2020 2020
Gross carrying amount before modification 1,119,943 53,080
Loss allowance before modification (61,445) (9,881)
Net amortised cost before modification 1,058,498 43,199
Modification loss due to covid moratoria (26,774) (239)
Net amortised cost after modification 1,031,724 42,960
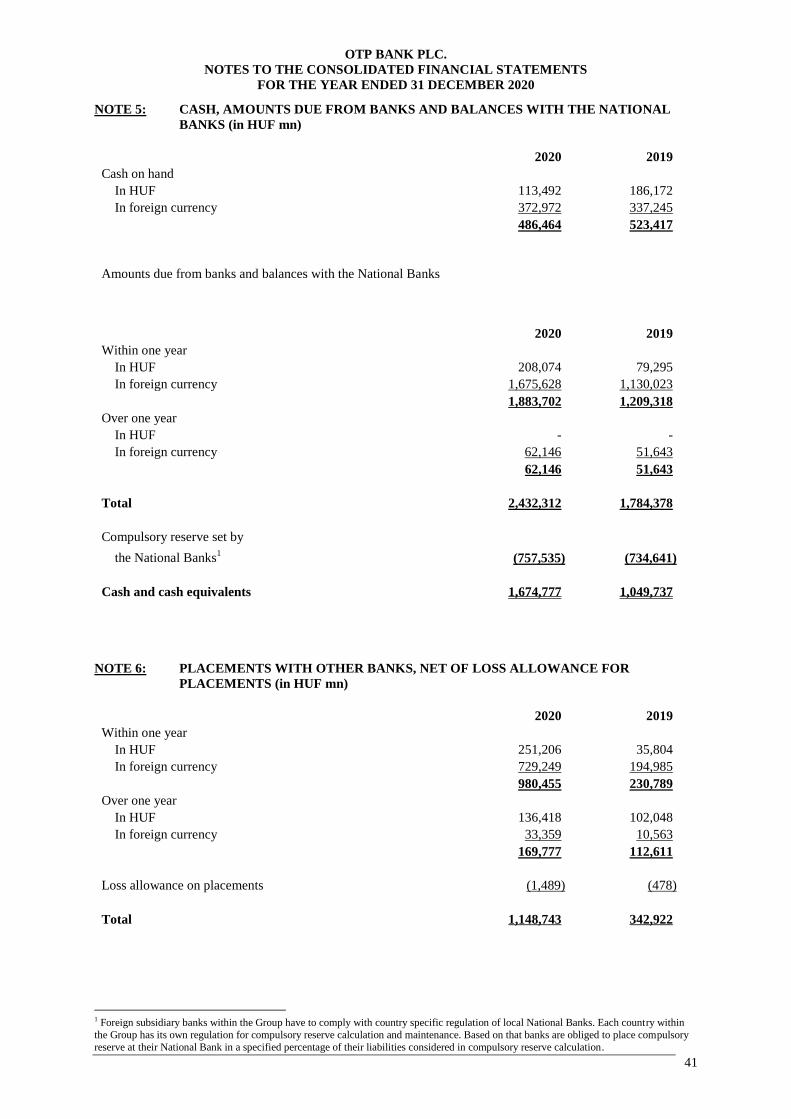
OTP BANK PLC.
NOTES TO THE CONSOLIDATED FINANCIAL STATEMENTS
FOR THE YEAR ENDED 31 DECEMBER 2020
41
NOTE 5: CASH, AMOUNTS DUE FROM BANKS AND BALANCES WITH THE NATIONAL
BANKS (in HUF mn)
2020 2019
Cash on hand
In HUF 113,492 186,172
In foreign currency 372,972 337,245
486,464 523,417
Amounts due from banks and balances with the National Banks
2020 2019
Within one year
In HUF 208,074 79,295
In foreign currency 1,675,628 1,130,023
1,883,702 1,209,318
Over one year
In HUF - -
In foreign currency 62,146 51,643
62,146 51,643
Total 2,432,312 1,784,378
Compulsory reserve set by
the National Banks1 (757,535) (734,641)
Cash and cash equivalents 1,674,777 1,049,737
NOTE 6: PLACEMENTS WITH OTHER BANKS, NET OF LOSS ALLOWANCE FOR
PLACEMENTS (in HUF mn)
2020 2019
Within one year
In HUF 251,206 35,804
In foreign currency 729,249 194,985
980,455 230,789
Over one year
In HUF 136,418 102,048
In foreign currency 33,359 10,563
169,777 112,611
Loss allowance on placements (1,489) (478)
Total 1,148,743 342,922
1 Foreign subsidiary banks within the Group have to comply with country specific regulation of local National Banks. Each country within
the Group has its own regulation for compulsory reserve calculation and maintenance. Based on that banks are obliged to place compulsory
reserve at their National Bank in a specified percentage of their liabilities considered in compulsory reserve calculation.
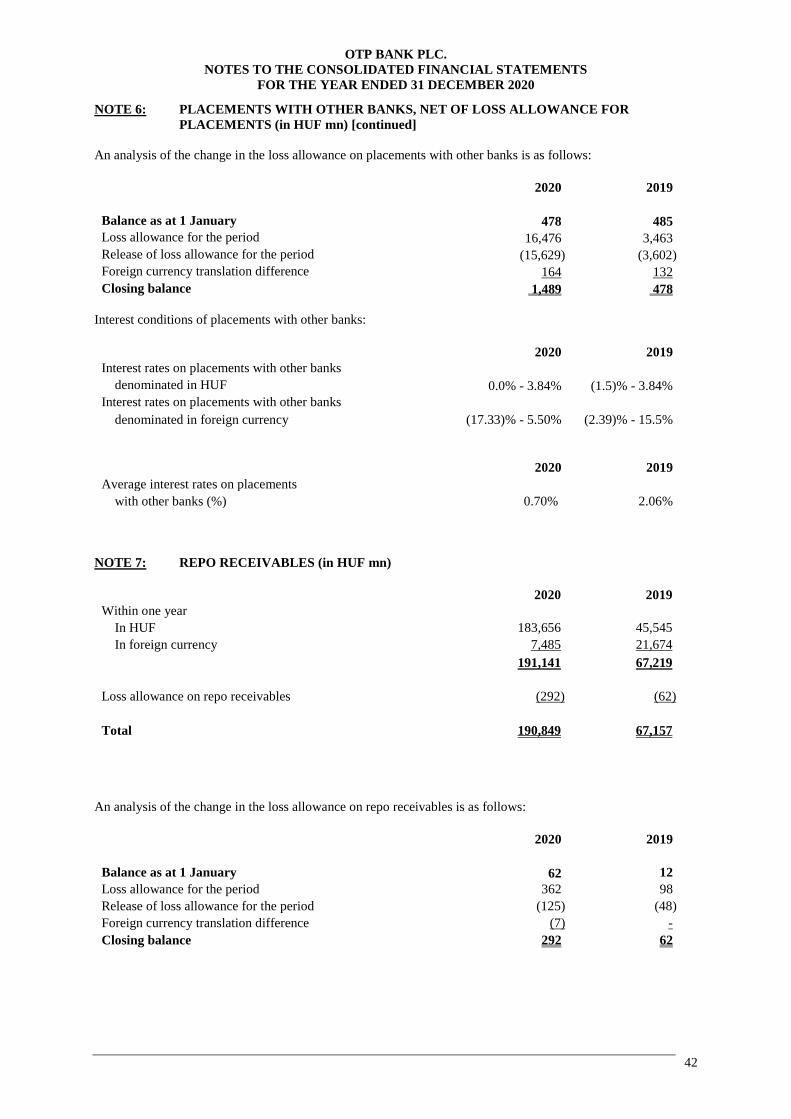
OTP BANK PLC.
NOTES TO THE CONSOLIDATED FINANCIAL STATEMENTS
FOR THE YEAR ENDED 31 DECEMBER 2020
42
NOTE 6: PLACEMENTS WITH OTHER BANKS, NET OF LOSS ALLOWANCE FOR
PLACEMENTS (in HUF mn) [continued]
An analysis of the change in the loss allowance on placements with other banks is as follows:
2020 2019
Balance as at 1 January 478 485
Loss allowance for the period 16,476 3,463
Release of loss allowance for the period (15,629) (3,602)
Foreign currency translation difference 164 132
Closing balance 1,489 478
Interest conditions of placements with other banks:
2020 2019
Interest rates on placements with other banks
denominated in HUF 0.0% - 3.84% (1.5)% - 3.84%
Interest rates on placements with other banks
denominated in foreign currency (17.33)% - 5.50% (2.39)% - 15.5%
2020 2019
Average interest rates on placements
with other banks (%) 0.70% 2.06%
NOTE 7: REPO RECEIVABLES (in HUF mn)
2020 2019
Within one year
In HUF 183,656 45,545
In foreign currency 7,485 21,674
191,141 67,219
Loss allowance on repo receivables (292) (62)
Total 190,849 67,157
An analysis of the change in the loss allowance on repo receivables is as follows:
2020 2019
Balance as at 1 January 62 12
Loss allowance for the period 362 98
Release of loss allowance for the period (125) (48)
Foreign currency translation difference (7) -
Closing balance 292 62
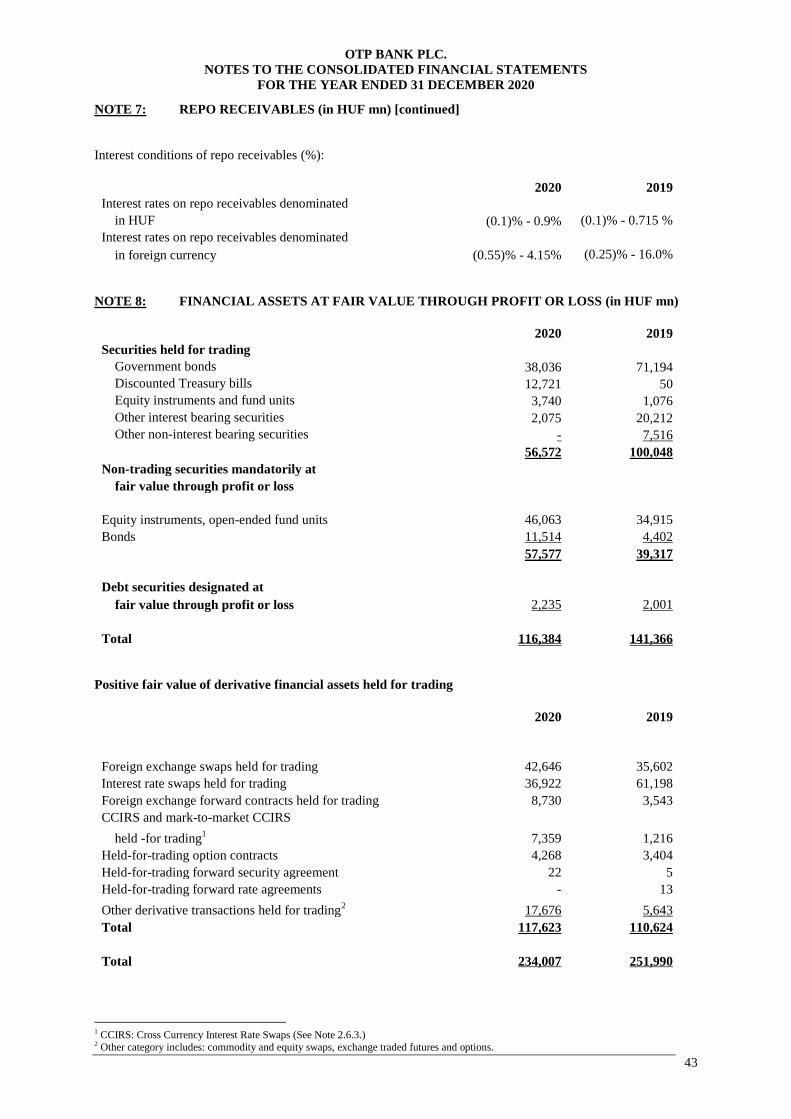
OTP BANK PLC.
NOTES TO THE CONSOLIDATED FINANCIAL STATEMENTS
FOR THE YEAR ENDED 31 DECEMBER 2020
43
NOTE 7: REPO RECEIVABLES (in HUF mn) [continued]
Interest conditions of repo receivables (%):
2020 2019
Interest rates on repo receivables denominated
in HUF (0.1)% - 0.9% (0.1)% - 0.715 %
Interest rates on repo receivables denominated
in foreign currency (0.55)% - 4.15% (0.25)% - 16.0%
NOTE 8: FINANCIAL ASSETS AT FAIR VALUE THROUGH PROFIT OR LOSS (in HUF mn)
2020 2019
Securities held for trading
Government bonds 38,036 71,194
Discounted Treasury bills 12,721 50
Equity instruments and fund units 3,740 1,076
Other interest bearing securities 2,075 20,212
Other non-interest bearing securities - 7,516
56,572 100,048
Non-trading securities mandatorily at
fair value through profit or loss
Equity instruments, open-ended fund units 46,063 34,915
Bonds 11,514 4,402
57,577 39,317
Debt securities designated at
fair value through profit or loss 2,235 2,001
Total 116,384 141,366
Positive fair value of derivative financial assets held for trading
2020 2019
Foreign exchange swaps held for trading 42,646 35,602
Interest rate swaps held for trading 36,922 61,198
Foreign exchange forward contracts held for trading 8,730 3,543
CCIRS and mark-to-market CCIRS
held -for trading1 7,359 1,216
Held-for-trading option contracts 4,268 3,404
Held-for-trading forward security agreement 22 5
Held-for-trading forward rate agreements - 13
Other derivative transactions held for trading2
17,676 5,643
Total 117,623 110,624
Total 234,007 251,990
1 CCIRS: Cross Currency Interest Rate Swaps (See Note 2.6.3.) 2 Other category includes: commodity and equity swaps, exchange traded futures and options.

OTP BANK PLC.
NOTES TO THE CONSOLIDATED FINANCIAL STATEMENTS
FOR THE YEAR ENDED 31 DECEMBER 2020
44
NOTE 8: FINANCIAL ASSETS AT FAIR VALUE THROUGH PROFIT OR LOSS (in HUF mn)
[continued]
An analysis of securities held for trading portfolio by currency (%):
2020 2019
Denominated in HUF 19.7% 27.8%
Denominated in foreign currency 80.3% 72.2%
Total 100.0% 100.0%
An analysis of government bond portfolio by currency (%):
2020 2019
Denominated in HUF 16.9% 25.7%
Denominated in foreign currency 83.1% 74.3%
Total 100.0% 100.0%
Interest conditions of held for trading securities (%):
2020 2019
Interest rates on securities held for trading
denominated in HUF 0.5% - 7.0% 0.16% -7.50%
Interest rates on securities held for trading
denominated in foreign currency 0.38% - 6.38% 0.01% - 8.25%
Interest conditions and the remaining maturities of securities held for trading can be analysed as follows:
2020 2019
Within one year
With variable interest 78 124
With fixed interest 17,147 24,496
17,225 24,620
Over one year
With variable interest 1,370 1,046
With fixed interest 34,237 65,790
35,607 66,836
Non-interest bearing securities 3,740 8,592
Total 56,572 100,048

OTP BANK PLC.
NOTES TO THE CONSOLIDATED FINANCIAL STATEMENTS
FOR THE YEAR ENDED 31 DECEMBER 2020
45
NOTE 8: FINANCIAL ASSETS AT FAIR VALUE THROUGH PROFIT OR LOSS (in HUF mn)
[continued]
Interest conditions and the remaining maturities of non-trading securities mandatorily measured at fair value
through profit or loss are as follows:
2020 2019
Within one year
With variable interest - -
With fixed interest - 866
- 866
Over one year
With variable interest - 25
With fixed interest 5,492 3,511
5,492 3,536
Non-interest bearing securities 52,085 34,915
Total 57,577 39,317
2020 2019
Dividend income from shares measured
at fair value through profit or loss 75 5,728
An analysis of non-trading securities mandatorily measured at fair value through profit or loss portfolio by
currency (%):
2020 2019
Denominated in HUF 57.1% 70.6%
Denominated in foreign currency 42.9% 29.4%
Total 100.0% 100.0%
2020 2019
Interest rates on non-trading securities mandatorily
measured at fair value through profit or loss 0.0% - 2.50% 0.0% - 4.95%

OTP BANK PLC.
NOTES TO THE CONSOLIDATED FINANCIAL STATEMENTS
FOR THE YEAR ENDED 31 DECEMBER 2020
46
NOTE 9: SECURITIES AT FAIR VALUE THROUGH OTHER COMPREHENSIVE INCOME (in
HUF mn)
2020 2019
Securities at fair value through other
comprehensive income
Government bonds 1,855,134 1,772,612
Mortgage bonds 88,272 97,268
Corporate bonds 81,620 73,062
Listed securities:
In HUF 2,968 2,999
In foreign currency 52,633 46,486
55,601 49,485
Non-listed securities:
In HUF 16,782 18,516
In foreign currency 9,237 5,061
26,019 23,577
Discounted Treasury bills 76,358 443,690
Total 2,101,384 2,386,632
2020 2019
Non-trading equity instruments to be measured
at fair value through other comprehensive income
Listed securities:
In HUF - -
In foreign currency 4,931 5,443
4,931 5,443
Non-listed securities:
In HUF 539 539
In foreign currency 29,855 34,165
30,394 34,704
35,325 40,147
Total 2,136,709 2,426,779
An analysis of securities at fair value through other comprehensive income by currency (%):
2020 2019
Denominated in HUF 36.6% 47.8%
Denominated in foreign currency 63.4% 52.2%
Total 100.0% 100.0%
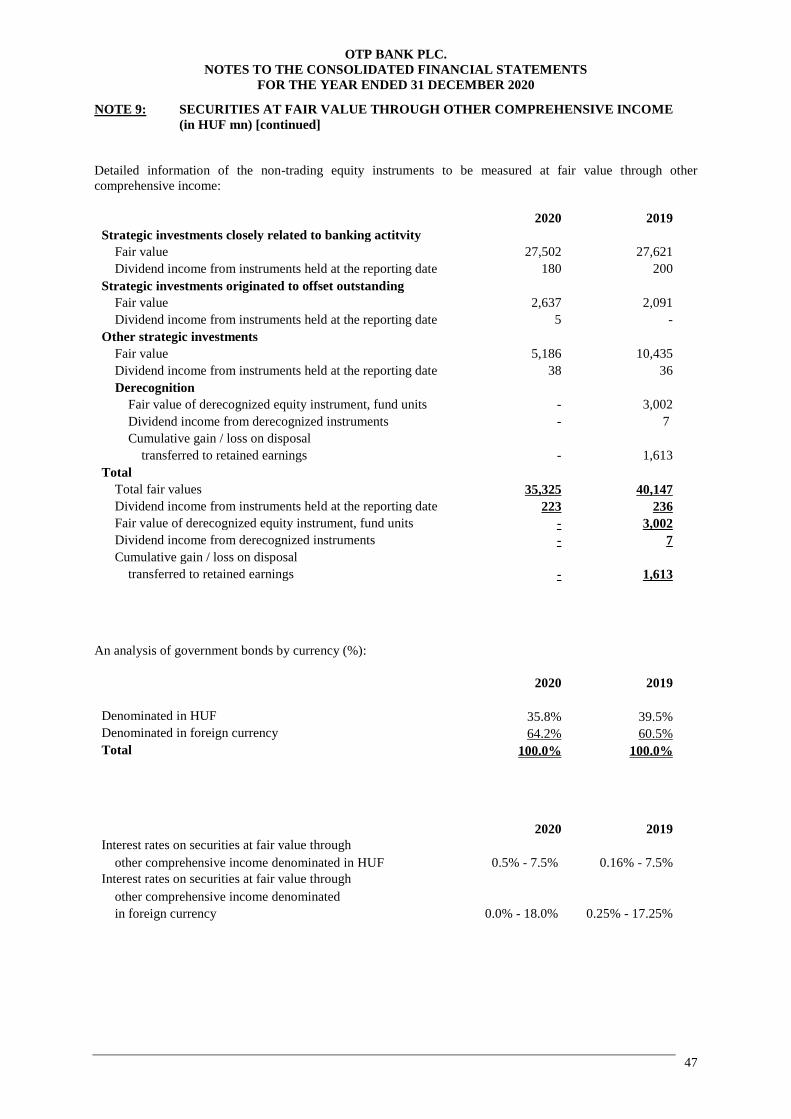
OTP BANK PLC.
NOTES TO THE CONSOLIDATED FINANCIAL STATEMENTS
FOR THE YEAR ENDED 31 DECEMBER 2020
47
NOTE 9: SECURITIES AT FAIR VALUE THROUGH OTHER COMPREHENSIVE INCOME
(in HUF mn) [continued]
Detailed information of the non-trading equity instruments to be measured at fair value through other
comprehensive income:
2020 2019
Strategic investments closely related to banking actitvity
Fair value 27,502 27,621
Dividend income from instruments held at the reporting date 180 200
Strategic investments originated to offset outstanding
Fair value 2,637 2,091
Dividend income from instruments held at the reporting date 5 -
Other strategic investments
Fair value 5,186 10,435
Dividend income from instruments held at the reporting date 38 36
Derecognition
Fair value of derecognized equity instrument, fund units - 3,002
Dividend income from derecognized instruments - 7
Cumulative gain / loss on disposal
transferred to retained earnings - 1,613
Total
Total fair values 35,325 40,147
Dividend income from instruments held at the reporting date 223 236
Fair value of derecognized equity instrument, fund units - 3,002
Dividend income from derecognized instruments - 7
Cumulative gain / loss on disposal
transferred to retained earnings - 1,613
An analysis of government bonds by currency (%):
2020 2019
Denominated in HUF 35.8% 39.5%
Denominated in foreign currency 64.2% 60.5%
Total 100.0% 100.0%
2020 2019
Interest rates on securities at fair value through
other comprehensive income denominated in HUF 0.5% - 7.5% 0.16% - 7.5%
Interest rates on securities at fair value through
other comprehensive income denominated
in foreign currency 0.0% - 18.0% 0.25% - 17.25%

OTP BANK PLC.
NOTES TO THE CONSOLIDATED FINANCIAL STATEMENTS
FOR THE YEAR ENDED 31 DECEMBER 2020
48
NOTE 9: SECURITIES AT FAIR VALUE THROUGH OTHER COMPREHENSIVE INCOME
(in HUF mn) [continued]
2020 2019
Average interest rates securities at fair value through
other comprehensive income denominated in HUF (%) 2.17% 1.96%
Average interest rates on securities at fair value
through other comprehensive income denominated
in foreign currency (%) 2.34% 2.24%
Interest conditions and the remaining maturities of securities at fair value through other comprehensive income
can be analysed as follows:
2020 2019
Within one year
With variable interest 4,780 7,799
With fixed interest 346,928 878,644
351,708 886,443
Over one year
With variable interest 62,068 60,974
With fixed interest 1,687,608 1,439,215
1,749,676 1,500,189
Non-interest bearing securities 35,325 40,147
Total 2,136,709 2,426,779
Certain securities are hedged against interest rate risk. See Note 36.4.
NOTE 10: SECURITIES AT AMORTIZED COST (in HUF mn)
2020 2019
Government bonds 2,545,476 1,933,837
Corporate bonds 74,632 22,719
Discounted Treasury bills 10,469 6,516
Mortgage bonds - 7,739
2,630,577 1,970,811
Loss allowance on securities at amortized cost (5,657) (2,739)
Total 2,624,920 1,968,072
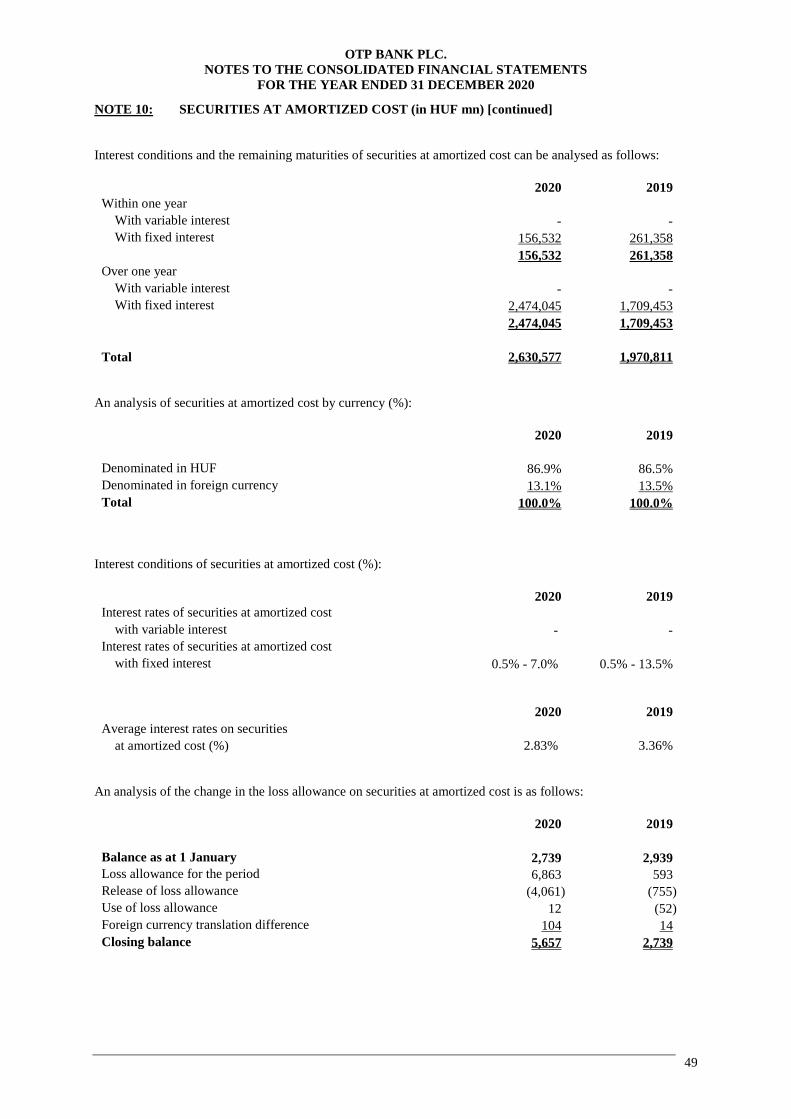
OTP BANK PLC.
NOTES TO THE CONSOLIDATED FINANCIAL STATEMENTS
FOR THE YEAR ENDED 31 DECEMBER 2020
49
NOTE 10: SECURITIES AT AMORTIZED COST (in HUF mn) [continued]
Interest conditions and the remaining maturities of securities at amortized cost can be analysed as follows:
2020 2019
Within one year
With variable interest - -
With fixed interest 156,532 261,358
156,532 261,358
Over one year
With variable interest - -
With fixed interest 2,474,045 1,709,453
2,474,045 1,709,453
Total 2,630,577 1,970,811
An analysis of securities at amortized cost by currency (%):
2020 2019
Denominated in HUF 86.9% 86.5%
Denominated in foreign currency 13.1% 13.5%
Total 100.0% 100.0%
Interest conditions of securities at amortized cost (%):
2020 2019
Interest rates of securities at amortized cost
with variable interest - -
Interest rates of securities at amortized cost
with fixed interest 0.5% - 7.0% 0.5% - 13.5%
2020 2019
Average interest rates on securities
at amortized cost (%) 2.83% 3.36%
An analysis of the change in the loss allowance on securities at amortized cost is as follows:
2020 2019
Balance as at 1 January 2,739 2,939
Loss allowance for the period 6,863 593
Release of loss allowance (4,061) (755)
Use of loss allowance 12 (52)
Foreign currency translation difference 104 14
Closing balance 5,657 2,739
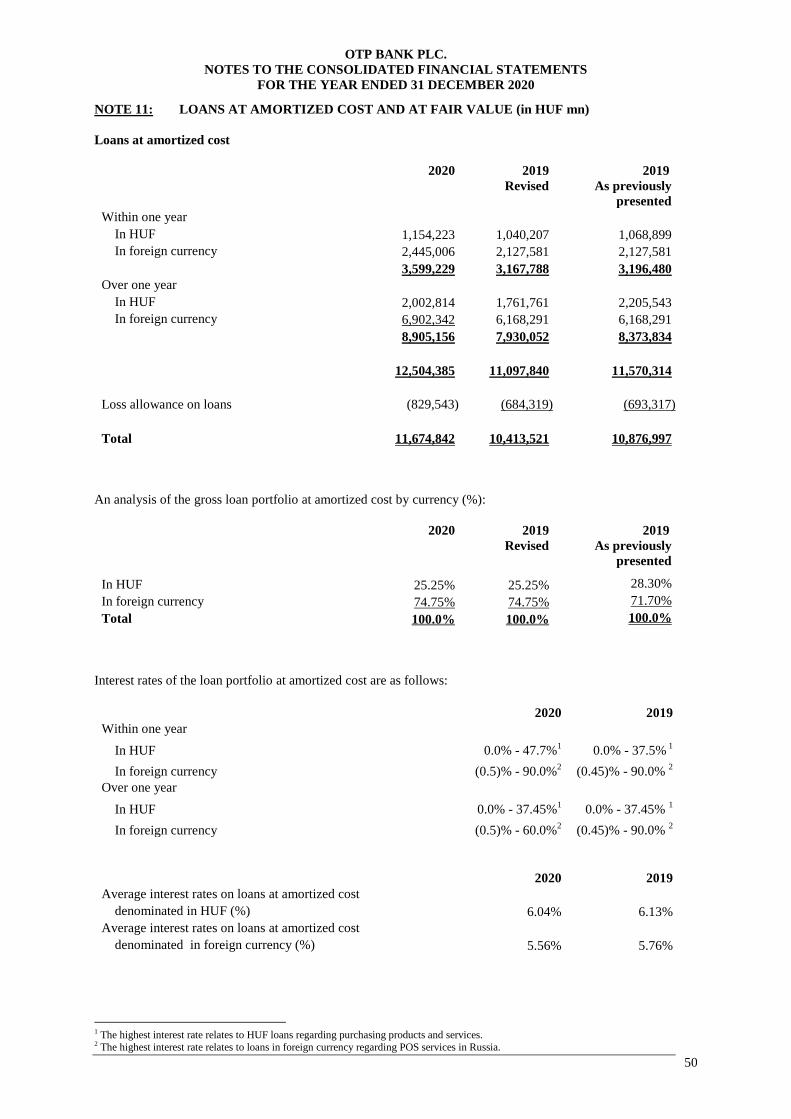
OTP BANK PLC.
NOTES TO THE CONSOLIDATED FINANCIAL STATEMENTS
FOR THE YEAR ENDED 31 DECEMBER 2020
50
NOTE 11: LOANS AT AMORTIZED COST AND AT FAIR VALUE (in HUF mn)
Loans at amortized cost
2020 2019
Revised
2019
As previously
presented
Within one year
In HUF 1,154,223 1,040,207 1,068,899
In foreign currency 2,445,006 2,127,581 2,127,581
3,599,229 3,167,788 3,196,480
Over one year
In HUF 2,002,814 1,761,761 2,205,543
In foreign currency 6,902,342 6,168,291 6,168,291
8,905,156 7,930,052 8,373,834
12,504,385 11,097,840 11,570,314
Loss allowance on loans (829,543) (684,319) (693,317)
Total 11,674,842 10,413,521 10,876,997
An analysis of the gross loan portfolio at amortized cost by currency (%):
2020 2019
Revised
2019
As previously
presented
In HUF 25.25% 25.25% 28.30%
In foreign currency 74.75% 74.75% 71.70%
Total 100.0% 100.0% 100.0%
Interest rates of the loan portfolio at amortized cost are as follows:
2020 2019
Within one year
In HUF 0.0% - 47.7%1 0.0% - 37.5%
1
In foreign currency (0.5)% - 90.0%2 (0.45)% - 90.0%
2
Over one year
In HUF 0.0% - 37.45%1 0.0% - 37.45%
1
In foreign currency (0.5)% - 60.0%2 (0.45)% - 90.0%
2
2020 2019
Average interest rates on loans at amortized cost
denominated in HUF (%) 6.04% 6.13%
Average interest rates on loans at amortized cost
denominated in foreign currency (%) 5.56% 5.76%
1 The highest interest rate relates to HUF loans regarding purchasing products and services. 2 The highest interest rate relates to loans in foreign currency regarding POS services in Russia.

OTP BANK PLC.
NOTES TO THE CONSOLIDATED FINANCIAL STATEMENTS
FOR THE YEAR ENDED 31 DECEMBER 2020
51
NOTE 11: LOANS AT AMORTIZED COST AND AT FAIR VALUE (in HUF mn) [continued]
An analysis of the change in the loss allowance on loans is as follows:
2020 2019
Revised
2019
As previously
presented
Balance as at 1 January 684,319 685,364 685,364
Reclassification - (4,483) -
Opening change due to finance lease - (9,005) (9,005)
Balance as at 1 January 684,319 671,876 676,359
Loss allowance for the period 650,165 488,802 480,962
Release of loss allowance (382,800) (290,134) (277,779)
Use of loss allowance (100,711) (94,458) (94,458)
Partial write-off 1 (12,503) (112,198) (112,198)
Decrease due to IFRS 5 - (27,616) (27,616)
Foreign currency translation difference (8,927) 48,047 48,047
Closing balance 829,543 684,319 693,317
Movement in loss allowance on loans and placements is summarized as below:
2020 2019
Revised
2019
As previously
presented
Loss allowance / (Release of loss allowance) on placements
and gains from write-off and sale of placements 789 (235) (235)
Loss allowance on loans and gains
from write-off and sale of loans 192,506 43,888 44,027
Total 2 193,295 43,653 43,792
Loans mandatorily at fair value through profit or loss
2020 2019
Revised
2019
As previously
presented
Within one year
In HUF 48,770 27,166 2,566
In foreign currency - - -
48,770 27,166 2,566
Over one year
In HUF 750,211 466,042 27,166
In foreign currency 3,624 3,070 3,070
753,835 469,112 30,236
Total 802,605 496,278 32,802
1 See details in Note 2.11. 2 See details in Note 31.

OTP BANK PLC.
NOTES TO THE CONSOLIDATED FINANCIAL STATEMENTS
FOR THE YEAR ENDED 31 DECEMBER 2020
52
NOTE 11: LOANS AT AMORTIZED COST AND AT FAIR VALUE (in HUF mn) [continued]
An analysis of the loan portfolio mandatorily at fair value through profit or loss by currency (%):
2020 2019
Revised
2019
As previously
presented
In HUF 99.55% 99.38% 90.64%
In foreign currency 0.45% 0.62% 9.36%
Total 100.00% 100.00% 100.00%
Interest rates of the loan portfolio mandatorily at fair value through profit or loss are as follows (%):
2020 2019
Interest rates on loans denominated
in HUF 0.77% - 12.83% 1.19% - 10.08%
Interest rates on loans denominated
in foreign currency 2.5% - 7.89% 2.5% - 4.5%
NOTE 12: ASSOCIATES AND OTHER INVESTMENTS (in HUF mn)
2020 2019
Investments
Investments in associates (non-listed) 14,149 14,254
Other investments (non-listed) 44,158 15,384
58,307 29,638
Impairment on investments (5,864) (8,816)
Total 52,443 20,822
The investments in associates and other investments which are not consolidated are not significant neither on
their own as separate entities nor in aggregate.
An analysis of the change in the impairment on investments is as follows:
2020 2019
Balance as at 1 January 8,816 5,592
(Release of impairment ) / Impairment for the period (381) 3,342
Reclassification to securities at fair value
through other comprehensive income (2,654) (80)
Foreign currency translation difference 83 (38)
Closing balance 5,864 8,816

OTP BANK PLC.
NOTES TO THE CONSOLIDATED FINANCIAL STATEMENTS
FOR THE YEAR ENDED 31 DECEMBER 2020
53
NOTE 13: PROPERTY, EQUIPMENT AND INTANGIBLE ASSETS (in HUF mn)
For the year ended 31 December 2020
Cost Intangible
assets
Goodwill Property Office
equipment
Vehicle Construction
in progress
Tangible
assets subject
to operating
lease
Total
Balance as at 1 January 320,749 111,687 279,538 192,369 23,079 22,717 31,799 981,938
Additions 92,313 1,413 7,342 27,533 2,208 36,835 6,586 174,230
Foreign currency
translation differences 7,769 (5,319) 12,987 4,094 215 538 2,602 22,886
Disposals (56,183) (6,388) (14,361) (11,737) (1,609) (36,687) (12,061) (139,026)
Reclassified as held-for-sale (153) - - (154) - - - (307)
Closing balance 364,495 101,393 285,506 212,105 23,893 23,403 28,926 1,039,721
Depreciation and amortization Intangible
assets
Property Office
equipment
Vehicle Tangible assets
subject to
operating lease
Total
Balance as at 1 January 183,026 71,085 139,813 5,508 10,889 410,321
Charge for the period 44,115 8,981 22,195 1,570 5,064 81,925
Foreign currency
translation differences 3,875 2,540 2,681 150 1,113 10,359
Disposals (6,733) (4,853) (9,302) (987) (6,787) (28,662)
Reclassified as held-for-sale (103) - (95) - - (198)
Closing balance 224,180 77,753 155,292 6,241 10,279 473,745
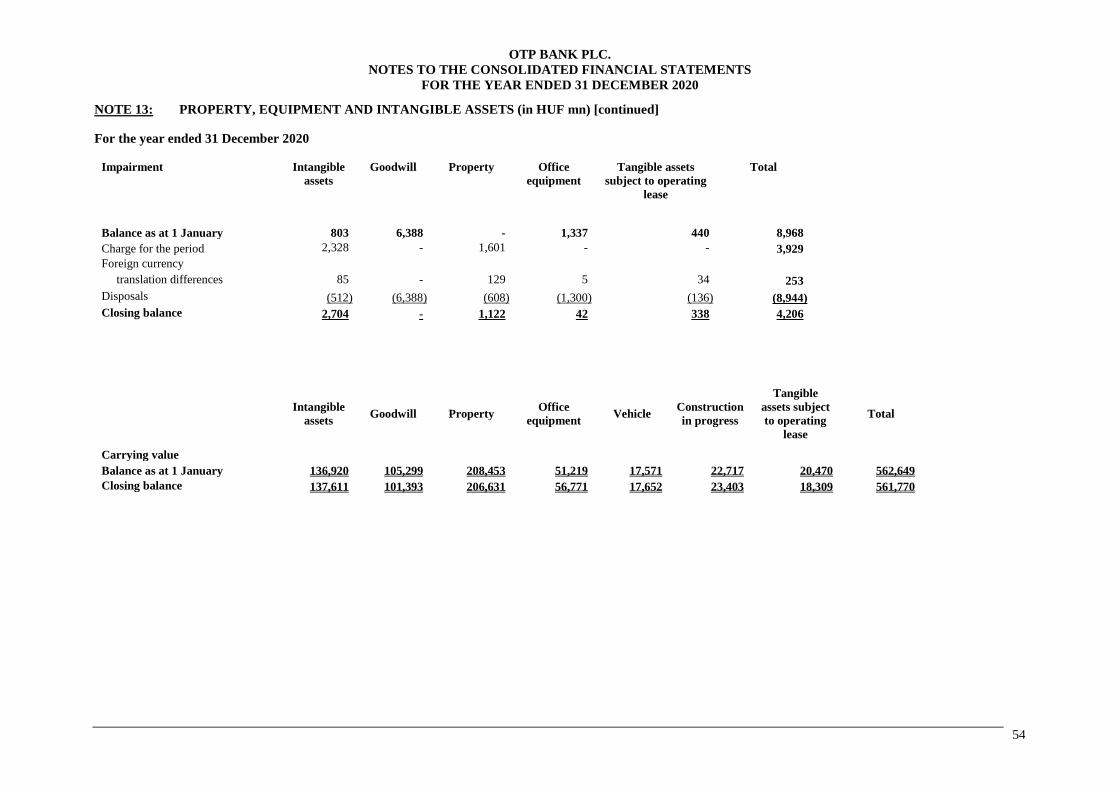
OTP BANK PLC.
NOTES TO THE CONSOLIDATED FINANCIAL STATEMENTS
FOR THE YEAR ENDED 31 DECEMBER 2020
54
NOTE 13: PROPERTY, EQUIPMENT AND INTANGIBLE ASSETS (in HUF mn) [continued]
For the year ended 31 December 2020
Impairment Intangible
assets
Goodwill Property Office
equipment
Tangible assets
subject to operating
lease
Total
Balance as at 1 January 803 6,388 - 1,337 440 8,968
Charge for the period 2,328 - 1,601 - - 3,929
Foreign currency
translation differences 85 - 129 5 34 253
Disposals (512) (6,388) (608) (1,300) (136) (8,944)
Closing balance 2,704 - 1,122 42 338 4,206
Intangible
assets Goodwill Property
Office
equipment Vehicle
Construction
in progress
Tangible
assets subject
to operating
lease
Total
Carrying value
Balance as at 1 January 136,920 105,299 208,453 51,219 17,571 22,717 20,470 562,649
Closing balance 137,611 101,393 206,631 56,771 17,652 23,403 18,309 561,770

OTP BANK PLC.
NOTES TO THE CONSOLIDATED FINANCIAL STATEMENTS
FOR THE YEAR ENDED 31 DECEMBER 2020
55
NOTE 13: PROPERTY, EQUIPMENT AND INTANGIBLE ASSETS (in HUF mn) [continued]
For the year ended 31 December 2020
Carrying value of the investment and goodwill allocated to the appropriate cash generating units
Subsidiaries Carrying amounts
of the subsidiary in
HUF million
Goodwill
values in
HUF million
Goodwill values in
million functional
currency
Type of
functional
currency
Consolidated
ownership
interest
With ownership
adjusted company
value in
HUF million
Applied long
term grow
rate
Applied long
term discount
rate
DSK Bank EAD 1
(Bulgaria) 280,692 42,984 28,541 HUF 99.91% 717,318 3.00% 8.13%
77 BGN
OTP banka d.d.
(Croatia) 205,349 21,196 58 EUR 100% 336,403 2.69% 9.37%
JSC “OTP Bank”
(Russia) 124,410 37,202 9,395 RUB 97.91% 173,315 1.89% 13.26%
POK-DSK Rodina a.d.
(Bulgaria) 943 11 11 HUF 99.75% 941 3.00% 8.13%
611,394 101,393
1 DSK Bank EAD after merge with the previous Expressbank.
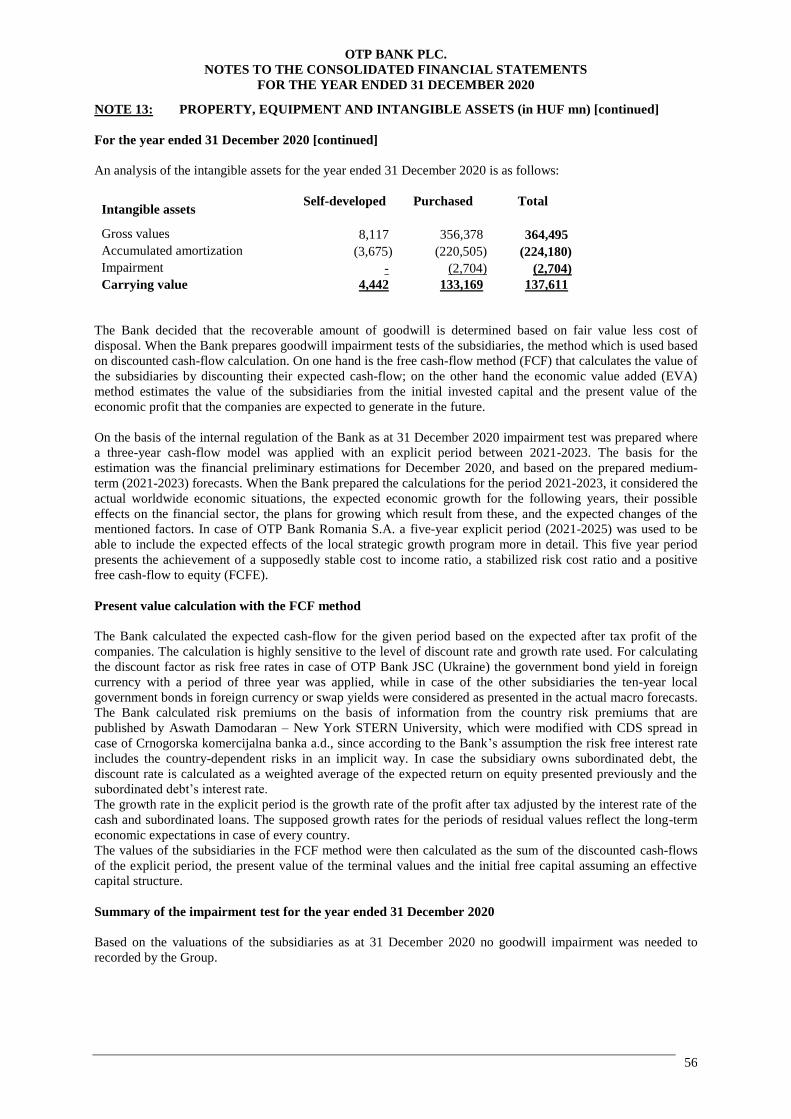
OTP BANK PLC.
NOTES TO THE CONSOLIDATED FINANCIAL STATEMENTS
FOR THE YEAR ENDED 31 DECEMBER 2020
56
NOTE 13: PROPERTY, EQUIPMENT AND INTANGIBLE ASSETS (in HUF mn) [continued]
For the year ended 31 December 2020 [continued]
An analysis of the intangible assets for the year ended 31 December 2020 is as follows:
Intangible assets Self-developed Purchased Total
Gross values 8,117 356,378 364,495
Accumulated amortization (3,675) (220,505) (224,180)
Impairment - (2,704) (2,704)
Carrying value 4,442 133,169 137,611
The Bank decided that the recoverable amount of goodwill is determined based on fair value less cost of
disposal. When the Bank prepares goodwill impairment tests of the subsidiaries, the method which is used based
on discounted cash-flow calculation. On one hand is the free cash-flow method (FCF) that calculates the value of
the subsidiaries by discounting their expected cash-flow; on the other hand the economic value added (EVA)
method estimates the value of the subsidiaries from the initial invested capital and the present value of the
economic profit that the companies are expected to generate in the future.
On the basis of the internal regulation of the Bank as at 31 December 2020 impairment test was prepared where
a three-year cash-flow model was applied with an explicit period between 2021-2023. The basis for the
estimation was the financial preliminary estimations for December 2020, and based on the prepared medium-
term (2021-2023) forecasts. When the Bank prepared the calculations for the period 2021-2023, it considered the
actual worldwide economic situations, the expected economic growth for the following years, their possible
effects on the financial sector, the plans for growing which result from these, and the expected changes of the
mentioned factors. In case of OTP Bank Romania S.A. a five-year explicit period (2021-2025) was used to be
able to include the expected effects of the local strategic growth program more in detail. This five year period
presents the achievement of a supposedly stable cost to income ratio, a stabilized risk cost ratio and a positive
free cash-flow to equity (FCFE).
Present value calculation with the FCF method
The Bank calculated the expected cash-flow for the given period based on the expected after tax profit of the
companies. The calculation is highly sensitive to the level of discount rate and growth rate used. For calculating
the discount factor as risk free rates in case of OTP Bank JSC (Ukraine) the government bond yield in foreign
currency with a period of three year was applied, while in case of the other subsidiaries the ten-year local
government bonds in foreign currency or swap yields were considered as presented in the actual macro forecasts.
The Bank calculated risk premiums on the basis of information from the country risk premiums that are
published by Aswath Damodaran – New York STERN University, which were modified with CDS spread in
case of Crnogorska komercijalna banka a.d., since according to the Bank’s assumption the risk free interest rate
includes the country-dependent risks in an implicit way. In case the subsidiary owns subordinated debt, the
discount rate is calculated as a weighted average of the expected return on equity presented previously and the
subordinated debt’s interest rate.
The growth rate in the explicit period is the growth rate of the profit after tax adjusted by the interest rate of the
cash and subordinated loans. The supposed growth rates for the periods of residual values reflect the long-term
economic expectations in case of every country.
The values of the subsidiaries in the FCF method were then calculated as the sum of the discounted cash-flows
of the explicit period, the present value of the terminal values and the initial free capital assuming an effective
capital structure.
Summary of the impairment test for the year ended 31 December 2020
Based on the valuations of the subsidiaries as at 31 December 2020 no goodwill impairment was needed to
recorded by the Group.

OTP BANK PLC.
NOTES TO THE CONSOLIDATED FINANCIAL STATEMENTS
FOR THE YEAR ENDED 31 DECEMBER 2020
57
NOTE 13: PROPERTY, EQUIPMENT AND INTANGIBLE ASSETS (in HUF mn) [continued]
For the year ended 31 December 2019
Cost Intangible
assets
Goodwill Property Office
equipment
Vehicle Construction
in progress
Tangible
assets subject
to operating
lease
Total
Balance as at 1 January 225,541 97,728 239,639 174,060 20,980 22,881 37,845 818,674
Increase due to acquisition 47,100 - 38,869 7,132 513 2,246 2,197 98,057
Additions 64,019 6,776 16,565 24,827 3,374 53,066 7,301 175,928
Foreign currency
translation differences 12,405 7,298 6,144 4,804 313 448 878 32,290
Disposals (16,407) (115) (12,517) (11,075) (2,101) (55,837) (16,422) (114,474)
Reclassified as held-for-sale (12,692) - (9,188) (7,646) - (91) - (29,617)
Change in consolidation scope 783 - 26 267 - 4 - 1,080
Closing balance 320,749 111,687 279,538 192,369 23,079 22,717 31,799 981,938
Depreciation and amortization Intangible
assets
Property Office
equipment
Vehicle Tangible
assets subject
to operating
lease
Total
Balance as at 1 January 148,396 68,223 130,063 5,439 14,467 366,588
Charge for the period 35,247 7,830 18,944 1,508 5,397 68,926
Foreign currency
translation differences 831 2,932 4,135 140 110 8,148
Disposals - (3,016) (7,473) (1,579) (9,085) (21,153)
Reclassified as held-for-sale (1,619) (4,885) (6,021) - - (12,525)
Change in consolidation scope 171 1 165 - - 337
Closing balance 183,026 71,085 139,813 5,508 10,889 410,321
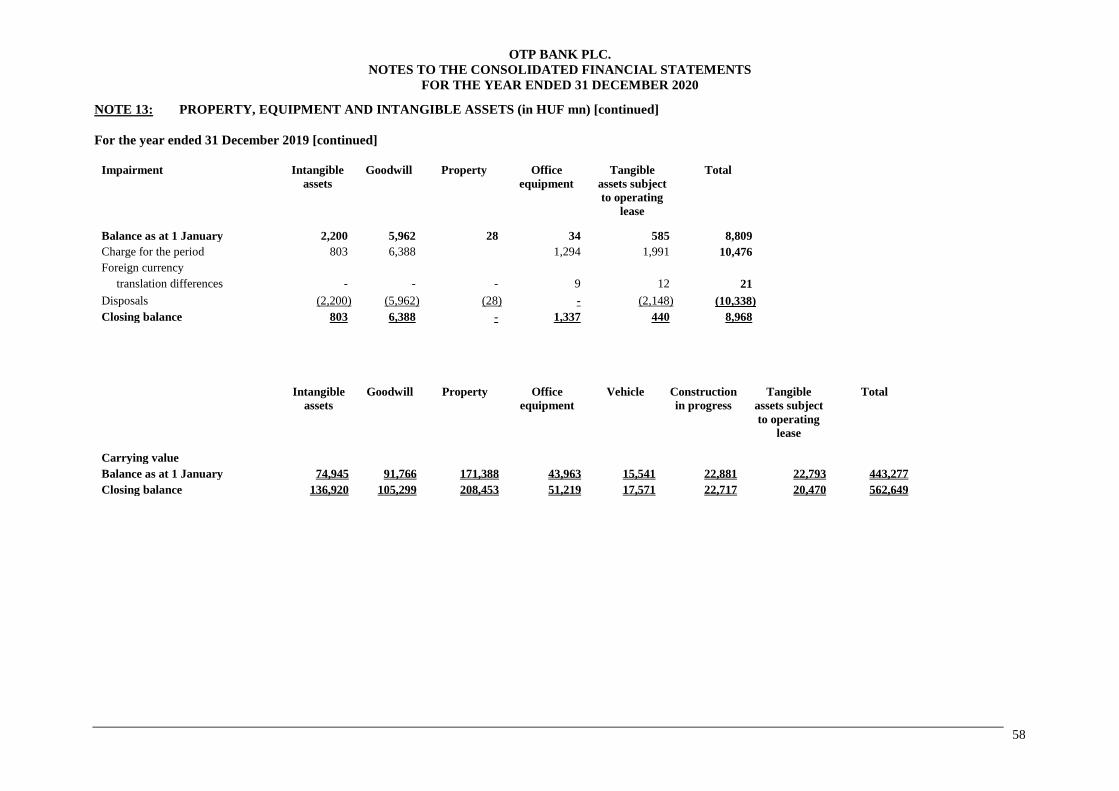
OTP BANK PLC.
NOTES TO THE CONSOLIDATED FINANCIAL STATEMENTS
FOR THE YEAR ENDED 31 DECEMBER 2020
58
NOTE 13: PROPERTY, EQUIPMENT AND INTANGIBLE ASSETS (in HUF mn) [continued]
For the year ended 31 December 2019 [continued]
Impairment Intangible
assets
Goodwill Property Office
equipment
Tangible
assets subject
to operating
lease
Total
Balance as at 1 January 2,200 5,962 28 34 585 8,809
Charge for the period 803 6,388
1,294 1,991 10,476
Foreign currency
translation differences - - - 9 12 21
Disposals (2,200) (5,962) (28) - (2,148) (10,338)
Closing balance 803 6,388 - 1,337 440 8,968
Intangible
assets
Goodwill Property Office
equipment
Vehicle Construction
in progress
Tangible
assets subject
to operating
lease
Total
Carrying value
Balance as at 1 January 74,945 91,766 171,388 43,963 15,541 22,881 22,793 443,277
Closing balance 136,920 105,299 208,453 51,219 17,571 22,717 20,470 562,649

OTP BANK PLC.
NOTES TO THE CONSOLIDATED FINANCIAL STATEMENTS
FOR THE YEAR ENDED 31 DECEMBER 2020
59
NOTE 13: PROPERTY, EQUIPMENT AND INTANGIBLE ASSETS (in HUF mn) [continued]
For the year ended 31 December 2019 [continued]
Carrying value of the investment and goodwill allocated to the appropriate cash generating units
Subsidiaries Carrying amounts
of the subsidiary in
HUF million
Goodwill
values in
HUF million
Goodwill values in
million functional
currency
Type of
functional
currency
Consolidated
ownership
interest
With ownership
adjusted company
value in
HUF million
Applied long
term grow
rate
Applied long
term discount
rate
DSK Bank EAD 1
(Bulgaria) 280,692 28,541 28,541 HUF 100.00% 648,176 3.40% 8.11%
Expressbank AD
(Bulgaria) 177,638 13,030 77 BGN 99.74% 175,023 3.40% 8.11%
OTP banka d.d.
(Croatia) 205,349 19,187 58 EUR 100.00% 418,384 2.69% 8.85%
JSC “OTP Bank”
(Russia) 124,409 44,530 9,395 RUB 97.91% 252,205 1.89% 14.42%
POK-DSK Rodina a.d.
(Bulgaria) 943 11 11 HUF 99.75% 941 3.40% 8.11%
789,031 105,299
1 DSK Bank EAD after merge with the previous Expressbank.
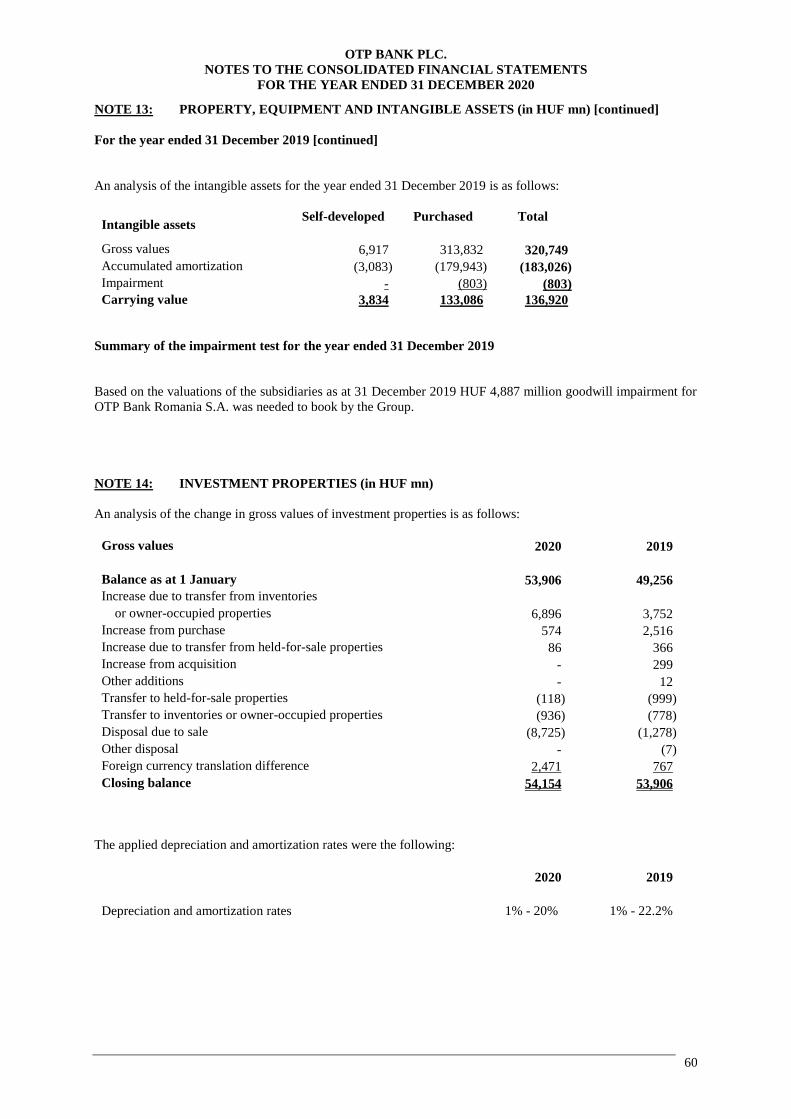
OTP BANK PLC.
NOTES TO THE CONSOLIDATED FINANCIAL STATEMENTS
FOR THE YEAR ENDED 31 DECEMBER 2020
60
NOTE 13: PROPERTY, EQUIPMENT AND INTANGIBLE ASSETS (in HUF mn) [continued]
For the year ended 31 December 2019 [continued]
An analysis of the intangible assets for the year ended 31 December 2019 is as follows:
Intangible assets Self-developed Purchased Total
Gross values 6,917 313,832 320,749
Accumulated amortization (3,083) (179,943) (183,026)
Impairment - (803) (803)
Carrying value 3,834 133,086 136,920
Summary of the impairment test for the year ended 31 December 2019
Based on the valuations of the subsidiaries as at 31 December 2019 HUF 4,887 million goodwill impairment for
OTP Bank Romania S.A. was needed to book by the Group.
NOTE 14: INVESTMENT PROPERTIES (in HUF mn)
An analysis of the change in gross values of investment properties is as follows:
Gross values 2020 2019
Balance as at 1 January 53,906 49,256
Increase due to transfer from inventories
or owner-occupied properties 6,896 3,752
Increase from purchase 574 2,516
Increase due to transfer from held-for-sale properties 86 366
Increase from acquisition - 299
Other additions - 12
Transfer to held-for-sale properties (118) (999)
Transfer to inventories or owner-occupied properties (936) (778)
Disposal due to sale (8,725) (1,278)
Other disposal - (7)
Foreign currency translation difference 2,471 767
Closing balance 54,154 53,906
The applied depreciation and amortization rates were the following:
2020 2019
Depreciation and amortization rates 1% - 20% 1% - 22.2%
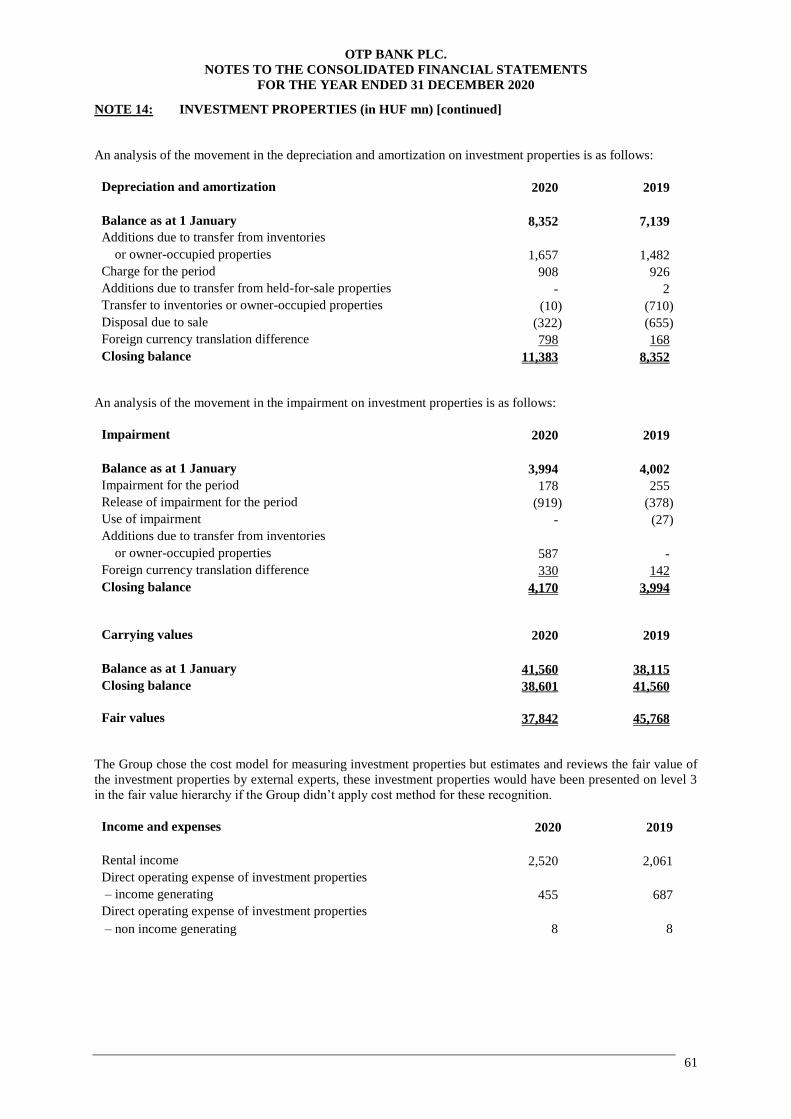
OTP BANK PLC.
NOTES TO THE CONSOLIDATED FINANCIAL STATEMENTS
FOR THE YEAR ENDED 31 DECEMBER 2020
61
NOTE 14: INVESTMENT PROPERTIES (in HUF mn) [continued]
An analysis of the movement in the depreciation and amortization on investment properties is as follows:
Depreciation and amortization 2020 2019
Balance as at 1 January 8,352 7,139
Additions due to transfer from inventories
or owner-occupied properties 1,657 1,482
Charge for the period 908 926
Additions due to transfer from held-for-sale properties - 2
Transfer to inventories or owner-occupied properties (10) (710)
Disposal due to sale (322) (655)
Foreign currency translation difference 798 168
Closing balance 11,383 8,352
An analysis of the movement in the impairment on investment properties is as follows:
Impairment 2020 2019
Balance as at 1 January 3,994 4,002
Impairment for the period 178 255
Release of impairment for the period (919) (378)
Use of impairment - (27)
Additions due to transfer from inventories
or owner-occupied properties 587 -
Foreign currency translation difference 330 142
Closing balance 4,170 3,994
Carrying values 2020 2019
Balance as at 1 January 41,560 38,115
Closing balance 38,601 41,560
Fair values 37,842 45,768
The Group chose the cost model for measuring investment properties but estimates and reviews the fair value of
the investment properties by external experts, these investment properties would have been presented on level 3
in the fair value hierarchy if the Group didn’t apply cost method for these recognition.
Income and expenses 2020 2019
Rental income 2,520 2,061
Direct operating expense of investment properties
– income generating 455 687
Direct operating expense of investment properties
– non income generating 8 8
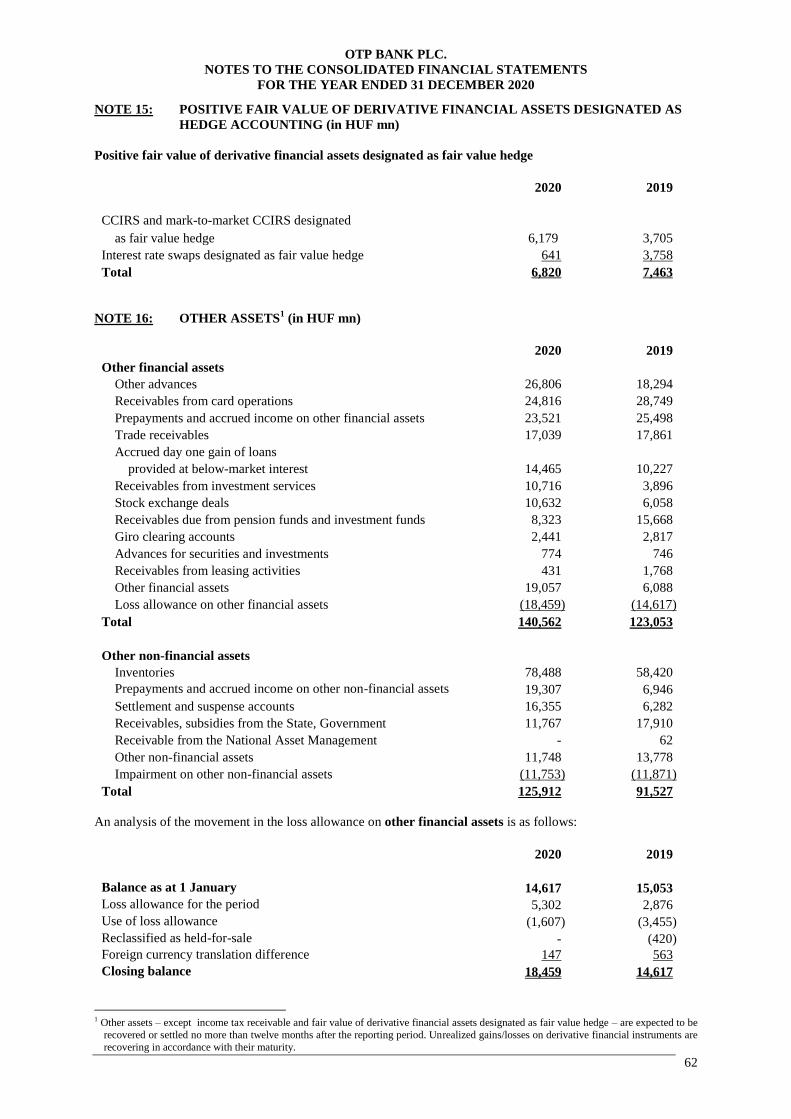
OTP BANK PLC.
NOTES TO THE CONSOLIDATED FINANCIAL STATEMENTS
FOR THE YEAR ENDED 31 DECEMBER 2020
62
NOTE 15: POSITIVE FAIR VALUE OF DERIVATIVE FINANCIAL ASSETS DESIGNATED AS
HEDGE ACCOUNTING (in HUF mn)
Positive fair value of derivative financial assets designated as fair value hedge
2020 2019
CCIRS and mark-to-market CCIRS designated
as fair value hedge 6,179 3,705
Interest rate swaps designated as fair value hedge 641 3,758
Total 6,820 7,463
NOTE 16: OTHER ASSETS1 (in HUF mn)
2020 2019
Other financial assets
Other advances 26,806 18,294
Receivables from card operations 24,816 28,749
Prepayments and accrued income on other financial assets 23,521 25,498
Trade receivables 17,039 17,861
Accrued day one gain of loans
provided at below-market interest 14,465 10,227
Receivables from investment services 10,716 3,896
Stock exchange deals 10,632 6,058
Receivables due from pension funds and investment funds 8,323 15,668
Giro clearing accounts 2,441 2,817
Advances for securities and investments 774 746
Receivables from leasing activities 431 1,768
Other financial assets 19,057 6,088
Loss allowance on other financial assets (18,459) (14,617)
Total 140,562 123,053
Other non-financial assets
Inventories 78,488 58,420
Prepayments and accrued income on other non-financial assets 19,307 6,946
Settlement and suspense accounts 16,355 6,282
Receivables, subsidies from the State, Government 11,767 17,910
Receivable from the National Asset Management - 62
Other non-financial assets 11,748 13,778
Impairment on other non-financial assets (11,753) (11,871)
Total 125,912 91,527
An analysis of the movement in the loss allowance on other financial assets is as follows:
2020 2019
Balance as at 1 January 14,617 15,053
Loss allowance for the period 5,302 2,876
Use of loss allowance (1,607) (3,455)
Reclassified as held-for-sale - (420)
Foreign currency translation difference 147 563
Closing balance 18,459 14,617
1 Other assets – except income tax receivable and fair value of derivative financial assets designated as fair value hedge – are expected to be
recovered or settled no more than twelve months after the reporting period. Unrealized gains/losses on derivative financial instruments are
recovering in accordance with their maturity.
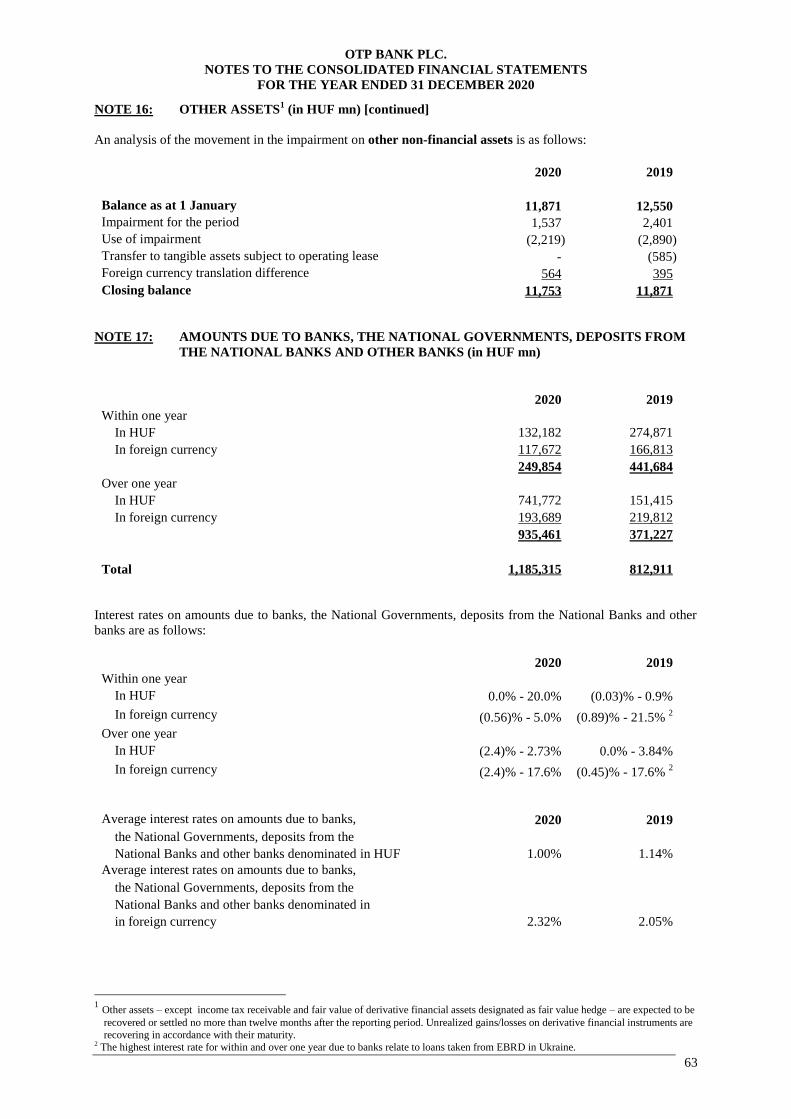
OTP BANK PLC.
NOTES TO THE CONSOLIDATED FINANCIAL STATEMENTS
FOR THE YEAR ENDED 31 DECEMBER 2020
63
NOTE 16: OTHER ASSETS1 (in HUF mn) [continued]
An analysis of the movement in the impairment on other non-financial assets is as follows:
2020 2019
Balance as at 1 January 11,871 12,550
Impairment for the period 1,537 2,401
Use of impairment (2,219) (2,890)
Transfer to tangible assets subject to operating lease - (585)
Foreign currency translation difference 564 395
Closing balance 11,753 11,871
NOTE 17: AMOUNTS DUE TO BANKS, THE NATIONAL GOVERNMENTS, DEPOSITS FROM
THE NATIONAL BANKS AND OTHER BANKS (in HUF mn)
2020 2019
Within one year
In HUF 132,182 274,871
In foreign currency 117,672 166,813
249,854 441,684
Over one year
In HUF 741,772 151,415
In foreign currency 193,689 219,812
935,461 371,227
Total 1,185,315 812,911
Interest rates on amounts due to banks, the National Governments, deposits from the National Banks and other
banks are as follows:
2020 2019
Within one year
In HUF 0.0% - 20.0% (0.03)% - 0.9%
In foreign currency (0.56)% - 5.0% (0.89)% - 21.5% 2
Over one year
In HUF (2.4)% - 2.73% 0.0% - 3.84%
In foreign currency (2.4)% - 17.6% (0.45)% - 17.6% 2
Average interest rates on amounts due to banks, 2020 2019
the National Governments, deposits from the
National Banks and other banks denominated in HUF 1.00% 1.14%
Average interest rates on amounts due to banks,
the National Governments, deposits from the
National Banks and other banks denominated in
in foreign currency 2.32% 2.05%
1 Other assets – except income tax receivable and fair value of derivative financial assets designated as fair value hedge – are expected to be
recovered or settled no more than twelve months after the reporting period. Unrealized gains/losses on derivative financial instruments are
recovering in accordance with their maturity. 2 The highest interest rate for within and over one year due to banks relate to loans taken from EBRD in Ukraine.
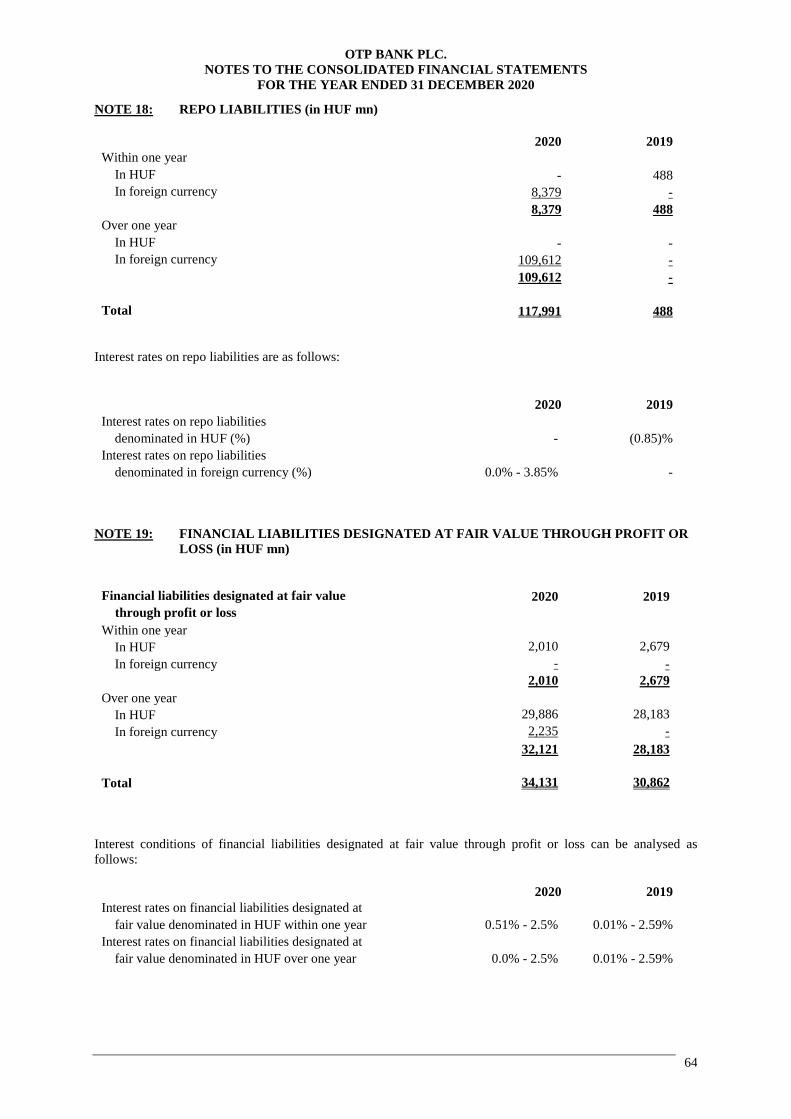
OTP BANK PLC.
NOTES TO THE CONSOLIDATED FINANCIAL STATEMENTS
FOR THE YEAR ENDED 31 DECEMBER 2020
64
NOTE 18: REPO LIABILITIES (in HUF mn)
2020 2019
Within one year
In HUF - 488
In foreign currency 8,379 -
8,379 488
Over one year
In HUF - -
In foreign currency 109,612 -
109,612 -
Total 117,991 488
Interest rates on repo liabilities are as follows:
2020 2019
Interest rates on repo liabilities
denominated in HUF (%) - (0.85)%
Interest rates on repo liabilities
denominated in foreign currency (%) 0.0% - 3.85% -
NOTE 19: FINANCIAL LIABILITIES DESIGNATED AT FAIR VALUE THROUGH PROFIT OR
LOSS (in HUF mn)
Financial liabilities designated at fair value 2020 2019
through profit or loss
Within one year
In HUF 2,010 2,679
In foreign currency - -
2,010 2,679
Over one year
In HUF 29,886 28,183
In foreign currency 2,235 -
32,121 28,183
Total 34,131 30,862
Interest conditions of financial liabilities designated at fair value through profit or loss can be analysed as
follows:
2020 2019
Interest rates on financial liabilities designated at
fair value denominated in HUF within one year 0.51% - 2.5% 0.01% - 2.59%
Interest rates on financial liabilities designated at
fair value denominated in HUF over one year 0.0% - 2.5% 0.01% - 2.59%
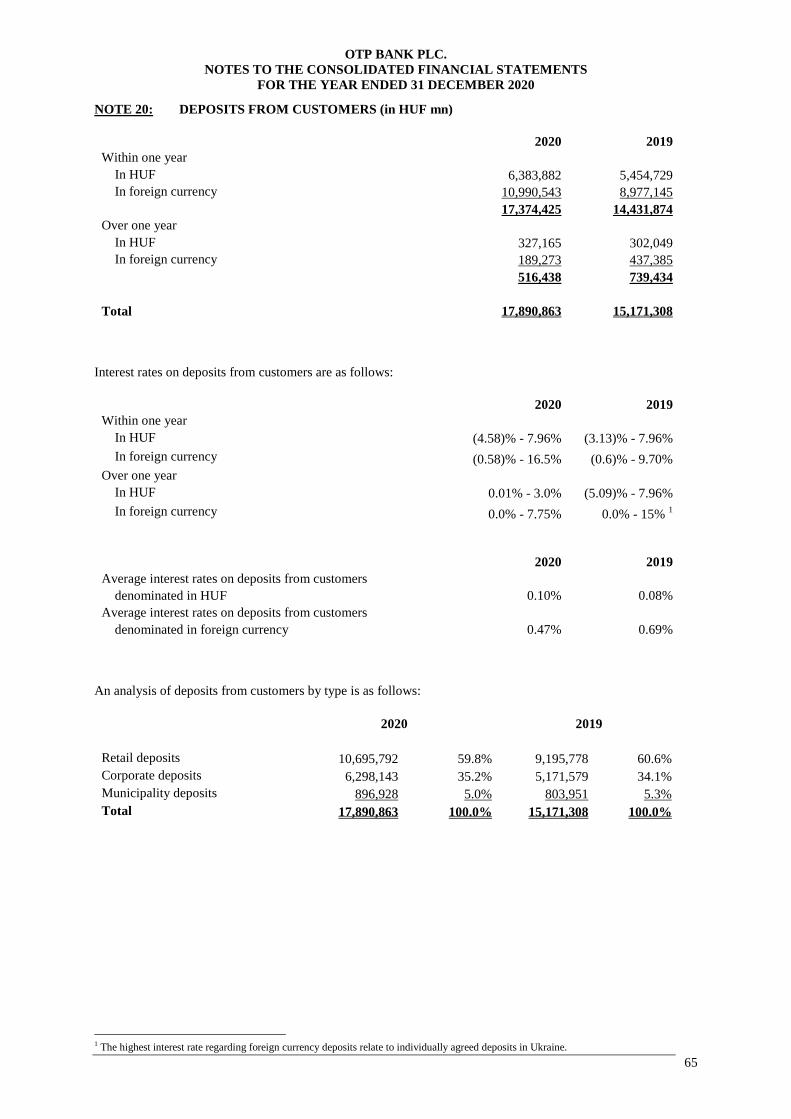
OTP BANK PLC.
NOTES TO THE CONSOLIDATED FINANCIAL STATEMENTS
FOR THE YEAR ENDED 31 DECEMBER 2020
65
NOTE 20: DEPOSITS FROM CUSTOMERS (in HUF mn)
2020 2019
Within one year
In HUF 6,383,882 5,454,729
In foreign currency 10,990,543 8,977,145
17,374,425 14,431,874
Over one year
In HUF 327,165 302,049
In foreign currency 189,273 437,385
516,438 739,434
Total 17,890,863 15,171,308
Interest rates on deposits from customers are as follows:
2020 2019
Within one year
In HUF (4.58)% - 7.96% (3.13)% - 7.96%
In foreign currency (0.58)% - 16.5% (0.6)% - 9.70%
Over one year
In HUF 0.01% - 3.0% (5.09)% - 7.96%
In foreign currency 0.0% - 7.75% 0.0% - 15% 1
2020 2019
Average interest rates on deposits from customers
denominated in HUF 0.10% 0.08%
Average interest rates on deposits from customers
denominated in foreign currency 0.47% 0.69%
An analysis of deposits from customers by type is as follows:
2020 2019
Retail deposits 10,695,792 59.8% 9,195,778 60.6%
Corporate deposits 6,298,143 35.2% 5,171,579 34.1%
Municipality deposits 896,928 5.0% 803,951 5.3%
Total 17,890,863 100.0% 15,171,308 100.0%
1 The highest interest rate regarding foreign currency deposits relate to individually agreed deposits in Ukraine.

OTP BANK PLC.
NOTES TO THE CONSOLIDATED FINANCIAL STATEMENTS
FOR THE YEAR ENDED 31 DECEMBER 2020
66
NOTE 21: LIABILITIES FROM ISSUED SECURITIES (in HUF mn)
2020 2019
With original maturity
Within one year
In HUF 130,676 26,139
In foreign currency 1,366 3,816
132,042 29,955
Over one year
In HUF 332,125 363,159
In foreign currency 46 53
332,171 363,212
Total 464,213 393,167
Interest rates on liabilities from issued securities are as follows:
2020 2019
Issued securities denominated in HUF 0.0% - 2.5% 0.0% - 9.0%
Issued securities denominated in foreign currency 0.01% - 1.11% 0.74% - 6.70%
2020 2019
Average interest rates on issued securities
denominated in HUF 1.82% 1.80%
Average interest rates on issued securities
denominated in foreign currency 1.44% 0.06%
Issued securities denominated in HUF as at 31 December 2020 (in HUF mn)
Name Date of
issue
Maturity Nominal
value
Amortized
cost
Interest conditions Hedged
(in HUF
mn)
(in HUF
mn)
(actual interest rate in %
p.a.)
1 OTPX2021A 01/04/2011 01/04/2021 183 246 indexed NaN hedged
2 OTPX2021B 17/06/2011 21/06/2021 245 370 indexed NaN hedged
3 OTPX2021C 19/09/2011 24/09/2021 231 192 indexed NaN hedged
4 OTPX2021D 21/12/2011 27/12/2021 259 325 indexed NaN hedged
5 OTPX2022A 22/03/2012 23/03/2022 201 214 indexed NaN hedged
6 OTPX2022B 18/07/2012 18/07/2022 172 440 indexed 1.7 hedged
7 OTPX2022C 29/10/2012 28/10/2022 201 233 indexed 1.7 hedged
8 OTPX2022D 28/12/2012 27/12/2022 248 299 indexed 1.7 hedged
9 OTPX2023A 22/03/2013 24/03/2023 324 327 indexed 1.7 hedged
10 OTPX2023B 28/06/2013 26/06/2023 198 225 indexed 0.6 hedged
Subtotal 2,262 2,871
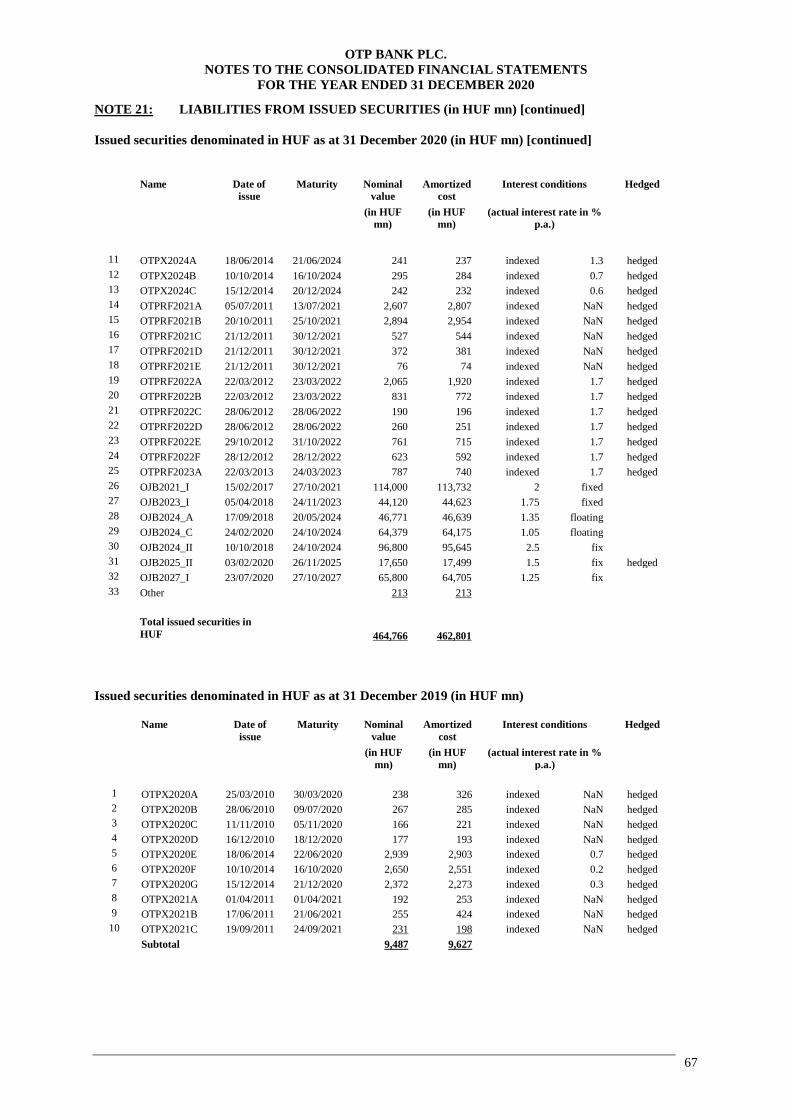
OTP BANK PLC.
NOTES TO THE CONSOLIDATED FINANCIAL STATEMENTS
FOR THE YEAR ENDED 31 DECEMBER 2020
67
NOTE 21: LIABILITIES FROM ISSUED SECURITIES (in HUF mn) [continued]
Issued securities denominated in HUF as at 31 December 2020 (in HUF mn) [continued]
Name Date of
issue
Maturity Nominal
value
Amortized
cost
Interest conditions Hedged
(in HUF
mn)
(in HUF
mn)
(actual interest rate in %
p.a.)
11 OTPX2024A 18/06/2014 21/06/2024 241 237 indexed 1.3 hedged
12 OTPX2024B 10/10/2014 16/10/2024 295 284 indexed 0.7 hedged
13 OTPX2024C 15/12/2014 20/12/2024 242 232 indexed 0.6 hedged
14 OTPRF2021A 05/07/2011 13/07/2021 2,607 2,807 indexed NaN hedged
15 OTPRF2021B 20/10/2011 25/10/2021 2,894 2,954 indexed NaN hedged
16 OTPRF2021C 21/12/2011 30/12/2021 527 544 indexed NaN hedged
17 OTPRF2021D 21/12/2011 30/12/2021 372 381 indexed NaN hedged
18 OTPRF2021E 21/12/2011 30/12/2021 76 74 indexed NaN hedged
19 OTPRF2022A 22/03/2012 23/03/2022 2,065 1,920 indexed 1.7 hedged
20 OTPRF2022B 22/03/2012 23/03/2022 831 772 indexed 1.7 hedged
21 OTPRF2022C 28/06/2012 28/06/2022 190 196 indexed 1.7 hedged
22 OTPRF2022D 28/06/2012 28/06/2022 260 251 indexed 1.7 hedged
23 OTPRF2022E 29/10/2012 31/10/2022 761 715 indexed 1.7 hedged
24 OTPRF2022F 28/12/2012 28/12/2022 623 592 indexed 1.7 hedged
25 OTPRF2023A 22/03/2013 24/03/2023 787 740 indexed 1.7 hedged
26 OJB2021_I 15/02/2017 27/10/2021 114,000 113,732 2 fixed
27 OJB2023_I 05/04/2018 24/11/2023 44,120 44,623 1.75 fixed
28 OJB2024_A 17/09/2018 20/05/2024 46,771 46,639 1.35 floating
29 OJB2024_C 24/02/2020 24/10/2024 64,379 64,175 1.05 floating
30 OJB2024_II 10/10/2018 24/10/2024 96,800 95,645 2.5 fix
31 OJB2025_II 03/02/2020 26/11/2025 17,650 17,499 1.5 fix hedged
32 OJB2027_I 23/07/2020 27/10/2027 65,800 64,705 1.25 fix
33 Other 213 213
Total issued securities in
HUF 464,766 462,801
Issued securities denominated in HUF as at 31 December 2019 (in HUF mn)
Name Date of
issue
Maturity Nominal
value
Amortized
cost
Interest conditions Hedged
(in HUF
mn)
(in HUF
mn)
(actual interest rate in %
p.a.)
1 OTPX2020A 25/03/2010 30/03/2020 238 326 indexed NaN hedged
2 OTPX2020B 28/06/2010 09/07/2020 267 285 indexed NaN hedged
3 OTPX2020C 11/11/2010 05/11/2020 166 221 indexed NaN hedged
4 OTPX2020D 16/12/2010 18/12/2020 177 193 indexed NaN hedged
5 OTPX2020E 18/06/2014 22/06/2020 2,939 2,903 indexed 0.7 hedged
6 OTPX2020F 10/10/2014 16/10/2020 2,650 2,551 indexed 0.2 hedged
7 OTPX2020G 15/12/2014 21/12/2020 2,372 2,273 indexed 0.3 hedged
8 OTPX2021A 01/04/2011 01/04/2021 192 253 indexed NaN hedged
9 OTPX2021B 17/06/2011 21/06/2021 255 424 indexed NaN hedged
10 OTPX2021C 19/09/2011 24/09/2021 231 198 indexed NaN hedged
Subtotal 9,487 9,627
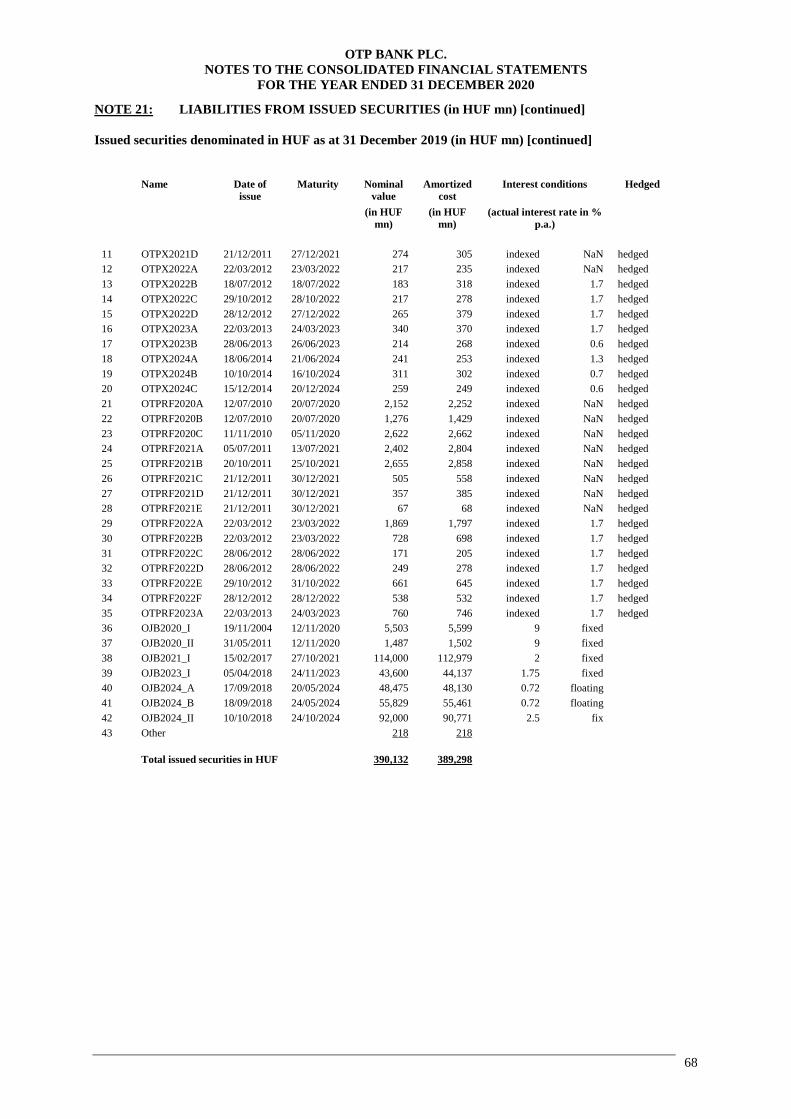
OTP BANK PLC.
NOTES TO THE CONSOLIDATED FINANCIAL STATEMENTS
FOR THE YEAR ENDED 31 DECEMBER 2020
68
NOTE 21: LIABILITIES FROM ISSUED SECURITIES (in HUF mn) [continued]
Issued securities denominated in HUF as at 31 December 2019 (in HUF mn) [continued]
Name Date of
issue
Maturity Nominal
value
Amortized
cost
Interest conditions Hedged
(in HUF
mn)
(in HUF
mn)
(actual interest rate in %
p.a.)
11 OTPX2021D 21/12/2011 27/12/2021 274 305 indexed NaN hedged
12 OTPX2022A 22/03/2012 23/03/2022 217 235 indexed NaN hedged
13 OTPX2022B 18/07/2012 18/07/2022 183 318 indexed 1.7 hedged
14 OTPX2022C 29/10/2012 28/10/2022 217 278 indexed 1.7 hedged
15 OTPX2022D 28/12/2012 27/12/2022 265 379 indexed 1.7 hedged
16 OTPX2023A 22/03/2013 24/03/2023 340 370 indexed 1.7 hedged
17 OTPX2023B 28/06/2013 26/06/2023 214 268 indexed 0.6 hedged
18 OTPX2024A 18/06/2014 21/06/2024 241 253 indexed 1.3 hedged
19 OTPX2024B 10/10/2014 16/10/2024 311 302 indexed 0.7 hedged
20 OTPX2024C 15/12/2014 20/12/2024 259 249 indexed 0.6 hedged
21 OTPRF2020A 12/07/2010 20/07/2020 2,152 2,252 indexed NaN hedged
22 OTPRF2020B 12/07/2010 20/07/2020 1,276 1,429 indexed NaN hedged
23 OTPRF2020C 11/11/2010 05/11/2020 2,622 2,662 indexed NaN hedged
24 OTPRF2021A 05/07/2011 13/07/2021 2,402 2,804 indexed NaN hedged
25 OTPRF2021B 20/10/2011 25/10/2021 2,655 2,858 indexed NaN hedged
26 OTPRF2021C 21/12/2011 30/12/2021 505 558 indexed NaN hedged
27 OTPRF2021D 21/12/2011 30/12/2021 357 385 indexed NaN hedged
28 OTPRF2021E 21/12/2011 30/12/2021 67 68 indexed NaN hedged
29 OTPRF2022A 22/03/2012 23/03/2022 1,869 1,797 indexed 1.7 hedged
30 OTPRF2022B 22/03/2012 23/03/2022 728 698 indexed 1.7 hedged
31 OTPRF2022C 28/06/2012 28/06/2022 171 205 indexed 1.7 hedged
32 OTPRF2022D 28/06/2012 28/06/2022 249 278 indexed 1.7 hedged
33 OTPRF2022E 29/10/2012 31/10/2022 661 645 indexed 1.7 hedged
34 OTPRF2022F 28/12/2012 28/12/2022 538 532 indexed 1.7 hedged
35 OTPRF2023A 22/03/2013 24/03/2023 760 746 indexed 1.7 hedged
36 OJB2020_I 19/11/2004 12/11/2020 5,503 5,599 9 fixed
37 OJB2020_II 31/05/2011 12/11/2020 1,487 1,502 9 fixed
38 OJB2021_I 15/02/2017 27/10/2021 114,000 112,979 2 fixed
39 OJB2023_I 05/04/2018 24/11/2023 43,600 44,137 1.75 fixed 40 OJB2024_A 17/09/2018 20/05/2024 48,475 48,130 0.72 floating
41 OJB2024_B 18/09/2018 24/05/2024 55,829 55,461 0.72 floating
42 OJB2024_II 10/10/2018 24/10/2024 92,000 90,771 2.5 fix
43 Other
218 218
Total issued securities in HUF 390,132 389,298
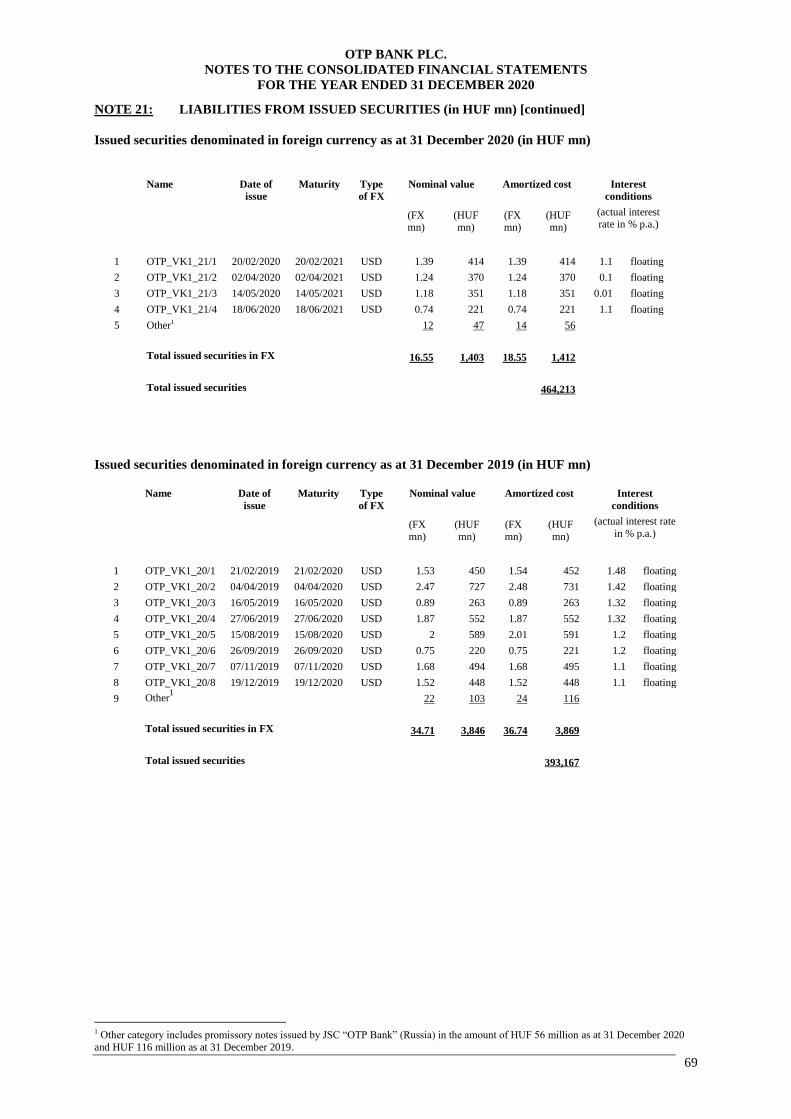
OTP BANK PLC.
NOTES TO THE CONSOLIDATED FINANCIAL STATEMENTS
FOR THE YEAR ENDED 31 DECEMBER 2020
69
NOTE 21: LIABILITIES FROM ISSUED SECURITIES (in HUF mn) [continued]
Issued securities denominated in foreign currency as at 31 December 2020 (in HUF mn)
Name Date of
issue
Maturity Type
of FX
Nominal value Amortized cost Interest
conditions
(FX mn)
(HUF mn)
(FX mn)
(HUF mn)
(actual interest rate in % p.a.)
1 OTP_VK1_21/1 20/02/2020 20/02/2021 USD 1.39 414 1.39 414 1.1 floating
2 OTP_VK1_21/2 02/04/2020 02/04/2021 USD 1.24 370 1.24 370 0.1 floating
3 OTP_VK1_21/3 14/05/2020 14/05/2021 USD 1.18 351 1.18 351 0.01 floating
4 OTP_VK1_21/4 18/06/2020 18/06/2021 USD 0.74 221 0.74 221 1.1 floating
5 Other1 12 47 14 56
Total issued securities in FX 16.55 1,403 18.55 1,412
Total issued securities 464,213
Issued securities denominated in foreign currency as at 31 December 2019 (in HUF mn)
Name Date of
issue
Maturity Type
of FX
Nominal value Amortized cost Interest
conditions
(FX
mn)
(HUF
mn)
(FX
mn)
(HUF
mn)
(actual interest rate
in % p.a.)
1 OTP_VK1_20/1 21/02/2019 21/02/2020 USD 1.53 450 1.54 452 1.48 floating
2 OTP_VK1_20/2 04/04/2019 04/04/2020 USD 2.47 727 2.48 731 1.42 floating
3 OTP_VK1_20/3 16/05/2019 16/05/2020 USD 0.89 263 0.89 263 1.32 floating
4 OTP_VK1_20/4 27/06/2019 27/06/2020 USD 1.87 552 1.87 552 1.32 floating
5 OTP_VK1_20/5 15/08/2019 15/08/2020 USD 2 589 2.01 591 1.2 floating
6 OTP_VK1_20/6 26/09/2019 26/09/2020 USD 0.75 220 0.75 221 1.2 floating
7 OTP_VK1_20/7 07/11/2019 07/11/2020 USD 1.68 494 1.68 495 1.1 floating
8 OTP_VK1_20/8 19/12/2019 19/12/2020 USD 1.52 448 1.52 448 1.1 floating
9 Other1 22 103 24 116
Total issued securities in FX 34.71 3,846 36.74 3,869
Total issued securities
393,167
1 Other category includes promissory notes issued by JSC “OTP Bank” (Russia) in the amount of HUF 56 million as at 31 December 2020
and HUF 116 million as at 31 December 2019.
OTP BANK PLC.
NOTES TO THE CONSOLIDATED FINANCIAL STATEMENTS
FOR THE YEAR ENDED 31 DECEMBER 2020
70
NOTE 21: LIABILITIES FROM ISSUED SECURITIES (in HUF mn) [continued]
Hedge accounting
Certain issued structured securities are hedged by the Bank with interest rate swaps (“IRS”) which exchange the
fixed and floating interest rate with the interest rate of the securities between the parties at a notional amount that
equals the nominal amount of the hedged securities. These are considered as fair value hedge relationships as
they cover the interest rate risk arising from the coupons of the hedged securities. OTP Bank does not intend to
be exposed to the risk embedded in the structured bonds, consequently as part of interest rate swap transaction
the structured interest payments are swapped to floating interest rate.
This hedging relationship meets all of the following hedge effectiveness requirements:
• there is an economic relationship between the hedged item and the hedging instrument
• the effect of credit risk does not dominate the value changes that result from that economic relationship
• the hedge ratio of the hedging relationship is the same as that resulting from the quantity of the hedged
item that the Bank actually hedges and the quantity of the hedging instrument that the Bank actually uses
to hedge that quantity of hedged item
The cash-flows of the fixed rate securities issued by the Bank are exposed to the changes in the HUF/EUR
foreign exchange rate and the volatility of the quoted interest rates of EUR and HUF. The interest rate risk and
foreign exchange risk related to these securities are hedged with EUR and HUF IRS transactions, where the
fixed interests were swapped to payments linked to 3 month HUF BUBOR and EURIBOR, resulting in a
decrease in the interest rate and foreign exchange exposure of issued securities.
Term Note Program in the value of HUF 200 billion for the year of 2020/2021
On 21 April 2020 the Bank initiated term note program in the value of HUF 200 billion with the intention of
issuing registered dematerialized bonds in public. The NBH approved on 9 July 2020 the prospectus of Term
Note Program and the disclosure as at 10 July 2020. The prospectus is valid for 12 months following the
disclosure.
The Issuer can initiate to introduce the bonds issued under the program to the Hungarian and to other stock
exchanges without any obligations.
Term Note Program in the value of HUF 200 billion for the year of 2019/2020
On 23 April 2019 the Bank initiated term note program in the value of HUF 200 billion with the intention of
issuing registered dematerialized bonds in public. The NBH approved on 25 June 2019 the prospectus of Term
Note Program and the disclosure as at 28 June 2019. The prospectus is valid for 12 months following the
disclosure.
The Issuer can initiate to introduce the bonds issued under the program to the Hungarian, Slovakian, Romanian,
Bulgarian and Croatian Stock Exchange without any obligations.

OTP BANK PLC.
NOTES TO THE CONSOLIDATED FINANCIAL STATEMENTS
FOR THE YEAR ENDED 31 DECEMBER 2020
71
NOTE 22: DERIVATIVE FINANCIAL LIABILITIES HELD FOR TRADING (in HUF mn)
Negative fair value of derivative financial liabilities held for trading by type of contracts
2020 2019
Foreign exchange swaps held for trading 39,103 28,453
Interest rate swaps held for trading 32,960 46,717
Foreign exchange forward contracts
held-for-trading 10,750 5,561
CCIRS and mark-to-market CCIRS
held for trading 7,419 1,037
Held for trading option contracts 3,843 3,128
Held-for-trading forward security agreement 116 8
Held-for-trading forward rate agreements - 32
Other derivative transactions held for trading 1 10,632 1,807
Total 104,823 86,743
NOTE 23: NEGATIVE FAIR VALUE OF DERIVATIVE FINANCIAL LIABILITIES
DESIGNATED AS HEDGE ACCOUNTING (in HUF mn)
The negative fair value of derivative financial liabilities designated as hedge accounting by type of
contracts
2020 2019
CCIRS and mark-to-market CCIRS designated
as fair value hedge 6,007 1,870
Interest rate swaps designated as fair value hedge 5,334 8,839
Total 11,341 10,709
NOTE 24: OTHER LIABILITIES2 (in HUF mn)
2020 2019
Other financial liabilities
Liabilities connected to Cafeteria benefits 121,711 80,003
Liabilities from investment services 62,667 101,417
Accrued expense on other financial liabilities 42,212 6,638
Accounts payable 41,460 50,974
Liabilities from card transactions 20,402 20,563
Giro clearing accounts 14,589 3,935
Accrued day one gain of loan liabilities at below-market interest 14,391 10,177
Advances received from customers 11,259 15,555
Liabilities due to short positions 9,131 7,040
Loans from government 3,435 1,291
Dividend payable 119 108
Liabilities due to refunding assets - 9,133
Other financial liabilities 48,526 31,186
Subtotal 389,902 338,020
1 Other category includes: commodity and equity swaps, exchange traded futures and options. 2 Other liabilities – except deferred tax and corporate tax liabilities and fair value of derivative financial liabilities designated as fair value
hedge – are expected to be recovered or settled no more than twelve months after the reporting period. Unrealized gains/losses on derivative financial instruments is recovering in accordance with their maturity. Besides the total other liabilities mentioned above, which
are expected to be recovered or settled more than twelve months after the reporting period are the following: accrued contractual liabilities,
compulsory pension reserve, loans from government and liabilities from preferential dividend shares.
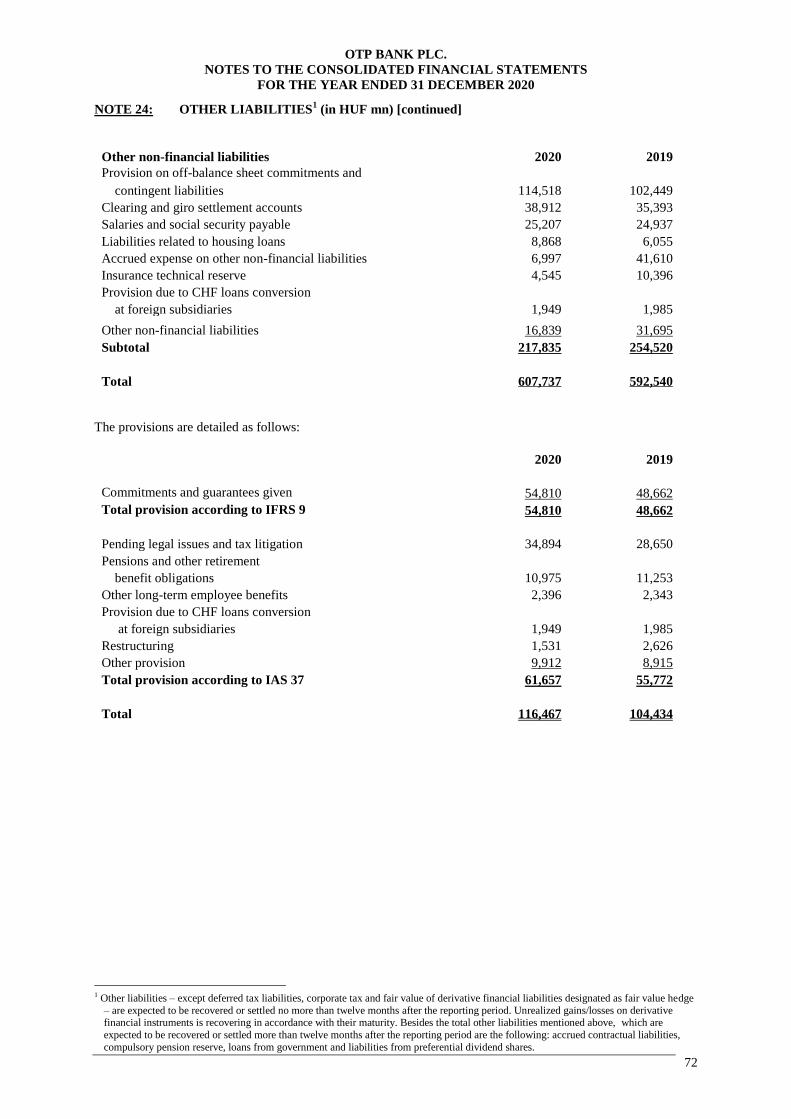
OTP BANK PLC.
NOTES TO THE CONSOLIDATED FINANCIAL STATEMENTS
FOR THE YEAR ENDED 31 DECEMBER 2020
72
NOTE 24: OTHER LIABILITIES1 (in HUF mn) [continued]
Other non-financial liabilities 2020 2019
Provision on off-balance sheet commitments and
contingent liabilities 114,518 102,449
Clearing and giro settlement accounts 38,912 35,393
Salaries and social security payable 25,207 24,937
Liabilities related to housing loans 8,868 6,055
Accrued expense on other non-financial liabilities 6,997 41,610
Insurance technical reserve 4,545 10,396
Provision due to CHF loans conversion
at foreign subsidiaries 1,949 1,985
Other non-financial liabilities 16,839 31,695
Subtotal 217,835 254,520
Total 607,737 592,540
The provisions are detailed as follows:
2020 2019
Commitments and guarantees given 54,810 48,662
Total provision according to IFRS 9 54,810 48,662
Pending legal issues and tax litigation 34,894 28,650
Pensions and other retirement
benefit obligations 10,975 11,253
Other long-term employee benefits 2,396 2,343
Provision due to CHF loans conversion
at foreign subsidiaries 1,949 1,985
Restructuring 1,531 2,626
Other provision 9,912 8,915
Total provision according to IAS 37 61,657 55,772
Total 116,467 104,434
1 Other liabilities – except deferred tax liabilities, corporate tax and fair value of derivative financial liabilities designated as fair value hedge
– are expected to be recovered or settled no more than twelve months after the reporting period. Unrealized gains/losses on derivative financial instruments is recovering in accordance with their maturity. Besides the total other liabilities mentioned above, which are
expected to be recovered or settled more than twelve months after the reporting period are the following: accrued contractual liabilities,
compulsory pension reserve, loans from government and liabilities from preferential dividend shares.
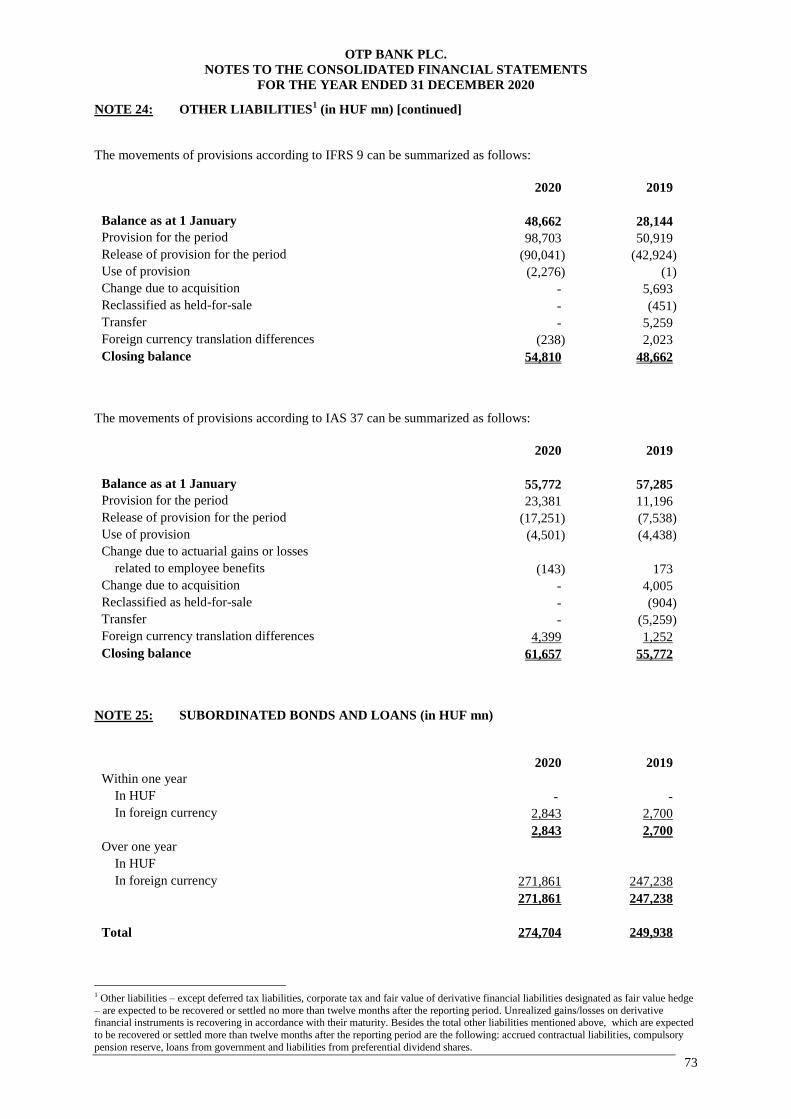
OTP BANK PLC.
NOTES TO THE CONSOLIDATED FINANCIAL STATEMENTS
FOR THE YEAR ENDED 31 DECEMBER 2020
73
NOTE 24: OTHER LIABILITIES1 (in HUF mn) [continued]
The movements of provisions according to IFRS 9 can be summarized as follows:
2020 2019
Balance as at 1 January 48,662 28,144
Provision for the period 98,703 50,919
Release of provision for the period (90,041) (42,924)
Use of provision (2,276) (1)
Change due to acquisition - 5,693
Reclassified as held-for-sale - (451)
Transfer - 5,259
Foreign currency translation differences (238) 2,023
Closing balance 54,810 48,662
The movements of provisions according to IAS 37 can be summarized as follows:
2020 2019
Balance as at 1 January 55,772 57,285
Provision for the period 23,381 11,196
Release of provision for the period (17,251) (7,538)
Use of provision (4,501) (4,438)
Change due to actuarial gains or losses
related to employee benefits (143) 173
Change due to acquisition - 4,005
Reclassified as held-for-sale - (904)
Transfer - (5,259)
Foreign currency translation differences 4,399 1,252
Closing balance 61,657 55,772
NOTE 25: SUBORDINATED BONDS AND LOANS (in HUF mn)
2020 2019
Within one year
In HUF - -
In foreign currency 2,843 2,700
2,843 2,700
Over one year
In HUF
In foreign currency 271,861 247,238
271,861 247,238
Total 274,704 249,938
1 Other liabilities – except deferred tax liabilities, corporate tax and fair value of derivative financial liabilities designated as fair value hedge
– are expected to be recovered or settled no more than twelve months after the reporting period. Unrealized gains/losses on derivative financial instruments is recovering in accordance with their maturity. Besides the total other liabilities mentioned above, which are expected
to be recovered or settled more than twelve months after the reporting period are the following: accrued contractual liabilities, compulsory
pension reserve, loans from government and liabilities from preferential dividend shares.
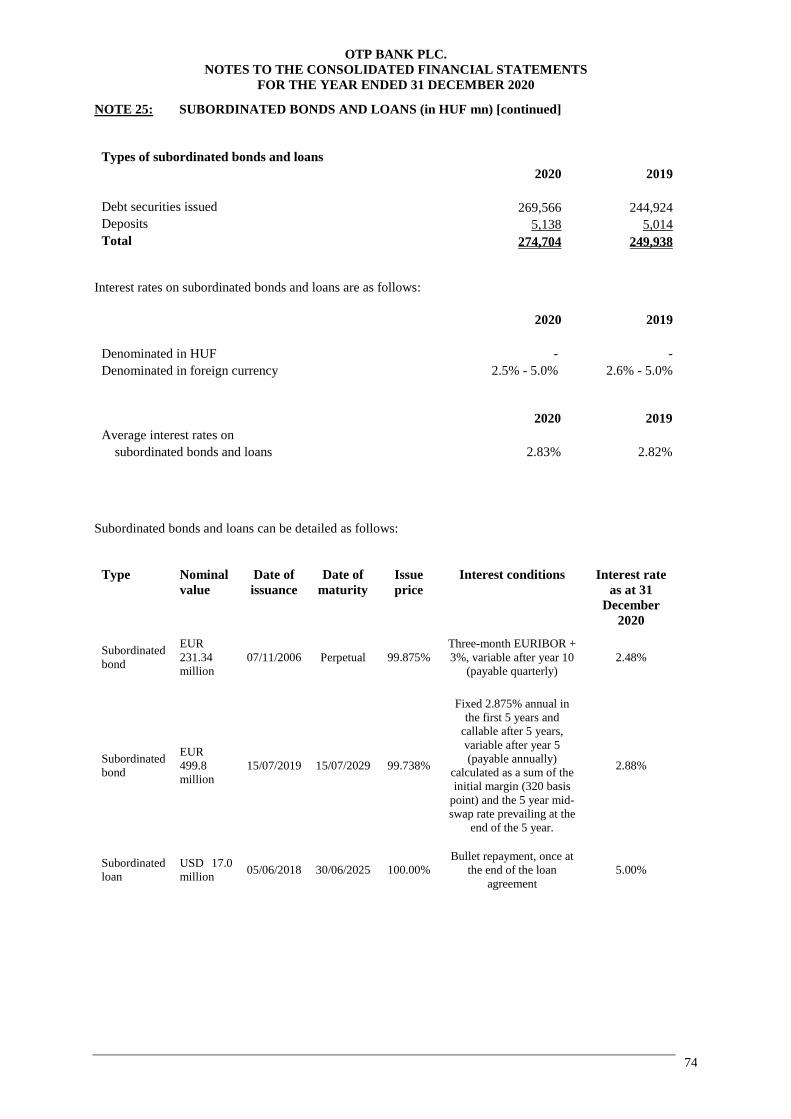
OTP BANK PLC.
NOTES TO THE CONSOLIDATED FINANCIAL STATEMENTS
FOR THE YEAR ENDED 31 DECEMBER 2020
74
NOTE 25: SUBORDINATED BONDS AND LOANS (in HUF mn) [continued]
Types of subordinated bonds and loans
2020 2019
Debt securities issued 269,566 244,924
Deposits 5,138 5,014
Total 274,704 249,938
Interest rates on subordinated bonds and loans are as follows:
2020 2019
Denominated in HUF - -
Denominated in foreign currency 2.5% - 5.0% 2.6% - 5.0%
2020 2019
Average interest rates on
subordinated bonds and loans 2.83% 2.82%
Subordinated bonds and loans can be detailed as follows:
Type Nominal
value
Date of
issuance
Date of
maturity
Issue
price
Interest conditions Interest rate
as at 31
December
2020
Subordinated
bond
EUR
231.34
million
07/11/2006 Perpetual 99.875%
Three-month EURIBOR +
3%, variable after year 10
(payable quarterly)
2.48%
Subordinated
bond
EUR
499.8
million
15/07/2019 15/07/2029 99.738%
Fixed 2.875% annual in
the first 5 years and
callable after 5 years,
variable after year 5
(payable annually)
calculated as a sum of the
initial margin (320 basis
point) and the 5 year mid-
swap rate prevailing at the
end of the 5 year.
2.88%
Subordinated
loan
USD 17.0
million 05/06/2018 30/06/2025 100.00%
Bullet repayment, once at
the end of the loan
agreement
5.00%
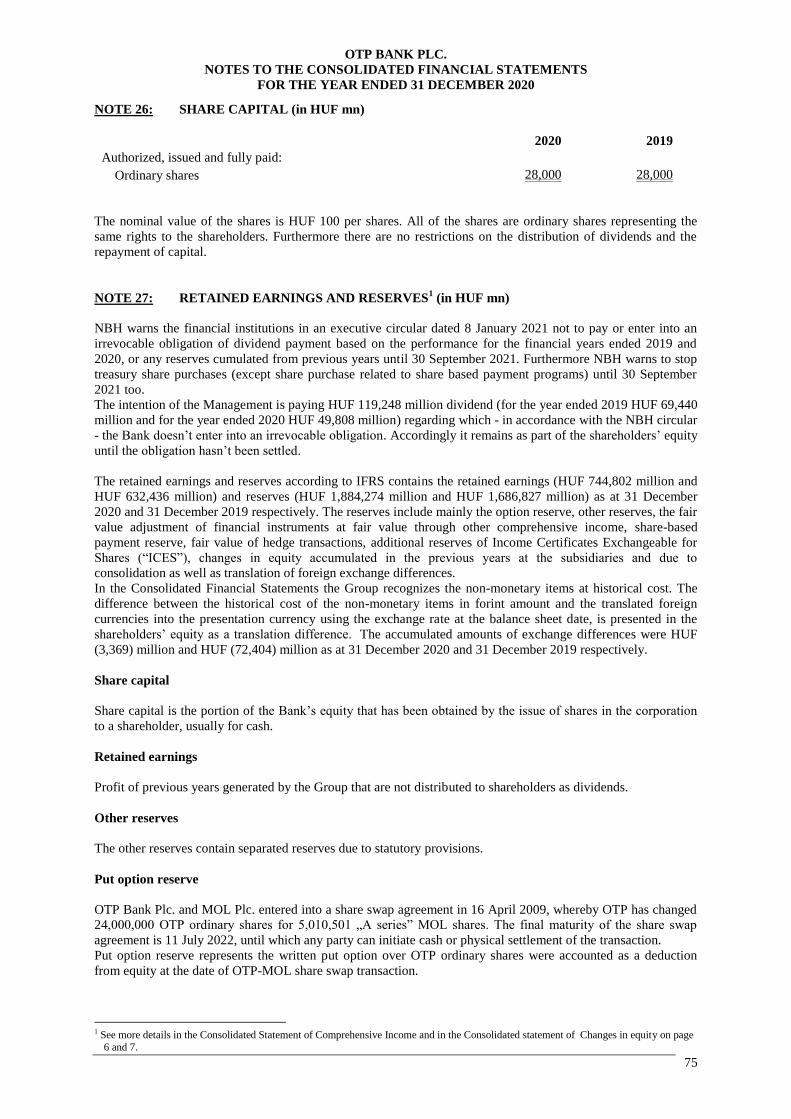
OTP BANK PLC.
NOTES TO THE CONSOLIDATED FINANCIAL STATEMENTS
FOR THE YEAR ENDED 31 DECEMBER 2020
75
NOTE 26: SHARE CAPITAL (in HUF mn)
2020 2019
Authorized, issued and fully paid:
Ordinary shares 28,000 28,000
The nominal value of the shares is HUF 100 per shares. All of the shares are ordinary shares representing the
same rights to the shareholders. Furthermore there are no restrictions on the distribution of dividends and the
repayment of capital.
NOTE 27: RETAINED EARNINGS AND RESERVES1 (in HUF mn)
NBH warns the financial institutions in an executive circular dated 8 January 2021 not to pay or enter into an
irrevocable obligation of dividend payment based on the performance for the financial years ended 2019 and
2020, or any reserves cumulated from previous years until 30 September 2021. Furthermore NBH warns to stop
treasury share purchases (except share purchase related to share based payment programs) until 30 September
2021 too.
The intention of the Management is paying HUF 119,248 million dividend (for the year ended 2019 HUF 69,440
million and for the year ended 2020 HUF 49,808 million) regarding which - in accordance with the NBH circular
- the Bank doesn’t enter into an irrevocable obligation. Accordingly it remains as part of the shareholders’ equity
until the obligation hasn’t been settled.
The retained earnings and reserves according to IFRS contains the retained earnings (HUF 744,802 million and
HUF 632,436 million) and reserves (HUF 1,884,274 million and HUF 1,686,827 million) as at 31 December
2020 and 31 December 2019 respectively. The reserves include mainly the option reserve, other reserves, the fair
value adjustment of financial instruments at fair value through other comprehensive income, share-based
payment reserve, fair value of hedge transactions, additional reserves of Income Certificates Exchangeable for
Shares (“ICES”), changes in equity accumulated in the previous years at the subsidiaries and due to
consolidation as well as translation of foreign exchange differences.
In the Consolidated Financial Statements the Group recognizes the non-monetary items at historical cost. The
difference between the historical cost of the non-monetary items in forint amount and the translated foreign
currencies into the presentation currency using the exchange rate at the balance sheet date, is presented in the
shareholders’ equity as a translation difference. The accumulated amounts of exchange differences were HUF
(3,369) million and HUF (72,404) million as at 31 December 2020 and 31 December 2019 respectively.
Share capital
Share capital is the portion of the Bank’s equity that has been obtained by the issue of shares in the corporation
to a shareholder, usually for cash.
Retained earnings
Profit of previous years generated by the Group that are not distributed to shareholders as dividends.
Other reserves
The other reserves contain separated reserves due to statutory provisions.
Put option reserve
OTP Bank Plc. and MOL Plc. entered into a share swap agreement in 16 April 2009, whereby OTP has changed
24,000,000 OTP ordinary shares for 5,010,501 „A series” MOL shares. The final maturity of the share swap
agreement is 11 July 2022, until which any party can initiate cash or physical settlement of the transaction.
Put option reserve represents the written put option over OTP ordinary shares were accounted as a deduction
from equity at the date of OTP-MOL share swap transaction.
1 See more details in the Consolidated Statement of Comprehensive Income and in the Consolidated statement of Changes in equity on page
6 and 7.

OTP BANK PLC.
NOTES TO THE CONSOLIDATED FINANCIAL STATEMENTS
FOR THE YEAR ENDED 31 DECEMBER 2020
76
NOTE 27: RETAINED EARNINGS AND RESERVES1 (in HUF mn) [continued]
Share-based payment reserve
Share-based payment reserve represents the increase in the equity due to the goods or services were received by
the Bank in an equity-settled share-based payment transaction, valued at the fair value of the goods or services
received (see details in Note 39).
Other comprehensive income
Other comprehensive income comprises items of income and expense (including reclassification adjustments)
that are not recognised in profit or loss as required or permitted by other IFRSs.
Net investment hedge in foreign operations
Reserve presented as net investment hedge in foreign operations in the sharholders’ equity is related to DSK
Bank EAD, OTP banka d.d. and Crnogorska komercijalna banka a.d.
Extra reserves
The result of ICES bond issuance is presented as extra reserve in the consolidation books due to the detailed
conditions below (see the details below in this note) and therefore any payment to the owner of the ICES will be
booked as decreasing item in the reserves.
Changes in equity accumulated in the previous year at the subsidiaries and due to consolidation
The accumulated changes at the subsidiaries contain the accumulated gains and losses of the subsidiaries from
the first day when they were included in the consolidation process. The changes due to consolidation contain the
effect on the result of the eliminations in the consolidation process of the previous years.
2020 2019
Retained earnings 744,802 632,436
Capital reserve 52 52
Option reserve (55,468) (55,468)
Other reserves 93,056 87,035
Fair value of financial instruments measured
at fair value through other comprehensive income 61,396 68,314
Share-based payment reserve 42,573 39,179
Fair value of derivative financial instruments
designated as cash-flow hedge - 2
Net investment hedge in foreign operations (27,405) (18,814)
Extra reserves 89,935 89,935
Net profit for the year 259,416 412,241
Changes in equity accumulated in the previous
year at the subsidiaries and due to consolidation 1,424,088 1,136,755
Foreign currency translation differences (3,369) (72,404)
Retained earnings and other reserves 2,629,076 2,319,263
1 See more details in the Consolidated Statement of Comprehensive Income and in the Consolidated statement of Changes in equity on page
6 and 7.

OTP BANK PLC.
NOTES TO THE CONSOLIDATED FINANCIAL STATEMENTS
FOR THE YEAR ENDED 31 DECEMBER 2020
77
NOTE 27: RETAINED EARNINGS AND RESERVES1 (in HUF mn) [continued]
Fair value adjustment of securities at fair value
through other comprehensive income 2020 2019
Balance as at 1 January 50,272 29,311
Change of fair value correction (10,897) 16,258
Deferred tax related to change of fair value correction 1,403 (1,904)
Transfer to profit or loss due to reclassification
to FVTPL securities (144) (15)
Transfer to profit or loss due to derecognition 3,329 7,382
Deferred tax related to accumulated transfer to profit or loss (472) (760)
Foreign currency translation difference 467 -
Closing balance 43,958 50,272
Expected credit loss on securities at fair value
through other comprehensive income 2020 2019
Balance as at 1 January 2,927 3,360
Increase of loss allowance 6,303 1,368
Release of loss allowance (1,441) (1,652)
Decrease due to sale, derecognition (724) (149)
Foreign currency translation difference (81) -
Closing balance 6,984 2,927
Fair value changes of equity instruments as
at fair value through other comprehensive income
2020 2019
Balance as at 1 January 15,115 10,092
Change of fair value correction (3,336) 4,026
Deferred tax related to change of fair value correction 363 (616)
Transfer to retained earnings due to derecognition (1,746) 1,613
Foreign currency translation difference 58 -
Closing balance 10,454 15,115
Net investment hedge in foreign operations
2020 2019
Balance as at 1 January (18,814) (16,288)
Change of fair value correction on hedging item (9,440) (2,776)
Deferred tax related to change of fair value correction 849 250
Closing balance (27,405) (18,814)
On 19 October 2006, the Bank sold 14.5 million Treasury shares owned by the Group through an issue of ICES.
Within the transaction 10 million shares owned by OTP Bank, and a further 4.5 million shares owned by the
Group were sold during the underwriting period of ICES on the weighted average market price (HUF 7,080) of
the Budapest Stock Exchange. The shares have been purchased by Opus Securities S.A. (“OPUS”), which issued
an exchangeable bond with a total face value of EUR 514,274,000 backed by those shares. The exchangeable
bonds have been sold at a 32% premium over the selling price of the shares. The EUR denominated
exchangeable bonds are perpetual and the investors can exercise the conversion right between years 6 and 10.
The bonds carry a fixed coupon of 3.95% during the first 10 years, and thereafter the Issuer has the right to
redeem the bonds at face value. Following year 10, the bonds carry a coupon of 3 month EURIBOR +3%. OTP
Bank has a discretional right to cancel the interest payments. The interest payable is non-cumulative.
Due to the conditions described above, ICES was accounted as an equity instrument and therefore any payment
was accounted as equity distribution paid to ICES holders.
1 See more details in the Consolidated Statement of Comprehensive Income and in the Consolidated statement of Changes in equity on page
6 and 7.

OTP BANK PLC.
NOTES TO THE CONSOLIDATED FINANCIAL STATEMENTS
FOR THE YEAR ENDED 31 DECEMBER 2020
78
NOTE 28: TREASURY SHARES (in HUF mn)
2020 2019
Nominal value (Ordinary shares) 2,392 1,778
Carrying value at acquisition cost 124,080 60,931
The changes in the carrying value of treasury shares are due to repurchase and sale transactions on market
authorised by the General Assembly.
Change in number of shares:
2020 2019
Number of shares as at 1 January 17,779,845 18,475,833
Additions 8,296,388 906,194
Disposals (2,151,333) (1,602,182)
Closing number of shares 23,924,900 17,779,845
Change in carrying value:
2020 2019
Balance as at 1 January 60,931 67,999
Additions 85,922 8,887
Disposals (22,773) (15,955)
Closing balance 124,080 60,931
NOTE 29: NON-CONTROLLING INTEREST (in HUF mn)
2020 2019
Balance as at 1 January 4,956 2,452
Increase due to business combination - 1,736
Non-controlling interest included in net profit for the year 221 341
Changes due to ownership structure - (10)
Purchase of non-controlling interest (382) -
Decrease due to discontinued operation (235) -
Foreign currency translation difference (444) 437
Closing balance 4,116 4,956
The non-controlling interest is not significant in respect of the whole OTP Group.

OTP BANK PLC.
NOTES TO THE CONSOLIDATED FINANCIAL STATEMENTS
FOR THE YEAR ENDED 31 DECEMBER 2020
79
NOTE 30: INTEREST INCOME, INCOME SIMILAR TO INTEREST INCOME AND
EXPENSE (in HUF mn)
2020 2019
Interest income calculated using
the effective interest method from / on
loans 658,579 599,390
securities at amortized cost 69,905 62,468
finance lease receivables 54,046 40,914
securities at fair value through other
comprehensive income 44,782 46,521
placements with other banks 7,572 8,989
banks and balances with the National Banks 5,103 2,037
liabilities (negative interest expense) 1,628 1,532
repo receivables 286 788
Subtotal 841,901 762,639
Income similar to interest income from
swap deals related to placements with other banks 78,577 78,113
loans mandatorily at fair value through profit or loss 28,251 16,653
swap deals related to credit institutions 20,322 28,710
rental income 8,363 9,819
non-trading securities mandatorily at fair value
through profit or loss 473 202
Subtotal 135,986 133,497
Total interest income and income similar
to interest income 977,887 896,136
2020 2019
Interest expense due to / from / on
swaps related to banks, National Governments
and to deposits from the National Banks 82,301 81,261
deposits from customers 53,196 59,242
swaps related to deposits from customers 17,226 24,789
banks, National Governments and on deposits
from the National Banks 13,785 10,173
issued securities 7,750 6,749
subordinated and supplementary bonds and loans 7,718 4,743
depreciation of assets subject to operating lease
and investment properties 5,624 6,147
on financial assets (negative interest income) 5,014 2,036
leases 1,623 1,652
repo liabilities 653 148
other 326 155
Total interest expense 195,216 197,095
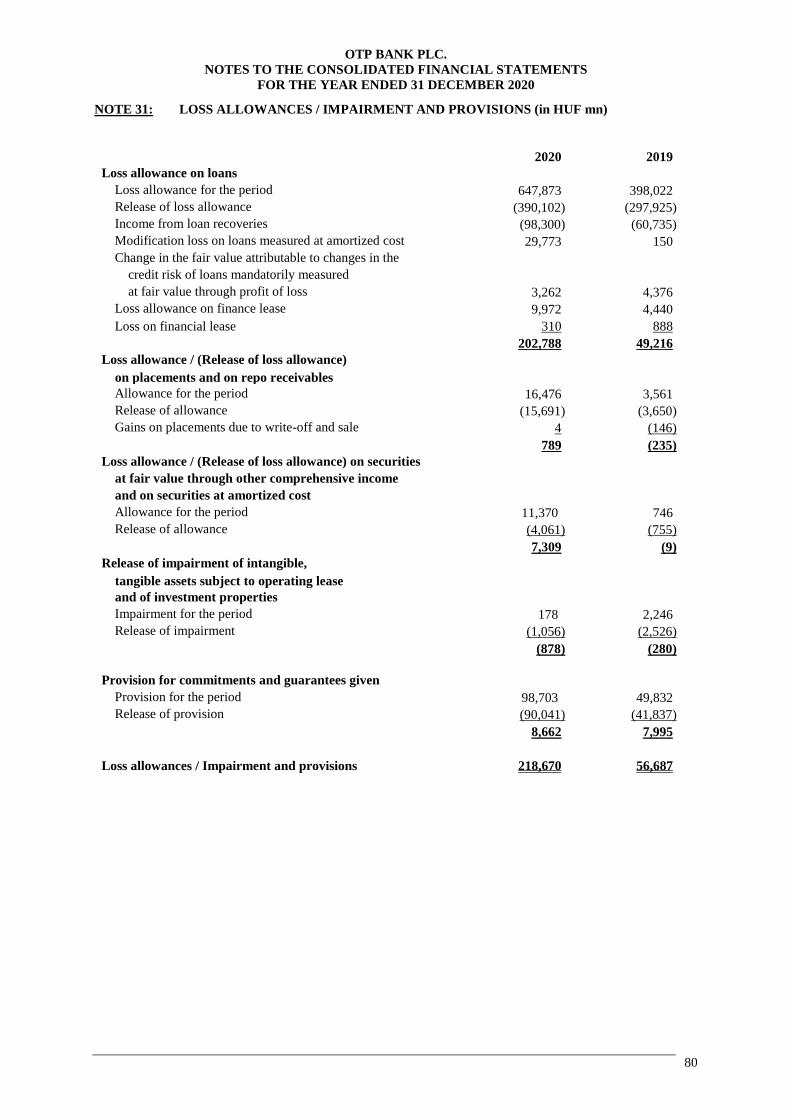
OTP BANK PLC.
NOTES TO THE CONSOLIDATED FINANCIAL STATEMENTS
FOR THE YEAR ENDED 31 DECEMBER 2020
80
NOTE 31: LOSS ALLOWANCES / IMPAIRMENT AND PROVISIONS (in HUF mn)
2020 2019
Loss allowance on loans
Loss allowance for the period 647,873 398,022
Release of loss allowance (390,102) (297,925)
Income from loan recoveries (98,300) (60,735)
Modification loss on loans measured at amortized cost 29,773 150
Change in the fair value attributable to changes in the
credit risk of loans mandatorily measured
at fair value through profit of loss 3,262 4,376
Loss allowance on finance lease 9,972 4,440
Loss on financial lease 310 888
202,788 49,216
Loss allowance / (Release of loss allowance)
on placements and on repo receivables
Allowance for the period 16,476 3,561
Release of allowance (15,691) (3,650)
Gains on placements due to write-off and sale 4 (146)
789 (235)
Loss allowance / (Release of loss allowance) on securities
at fair value through other comprehensive income
and on securities at amortized cost
Allowance for the period 11,370 746
Release of allowance (4,061) (755)
7,309 (9)
Release of impairment of intangible,
tangible assets subject to operating lease
and of investment properties
Impairment for the period 178 2,246
Release of impairment (1,056) (2,526)
(878) (280)
Provision for commitments and guarantees given
Provision for the period 98,703 49,832
Release of provision (90,041) (41,837)
8,662 7,995
Loss allowances / Impairment and provisions 218,670 56,687
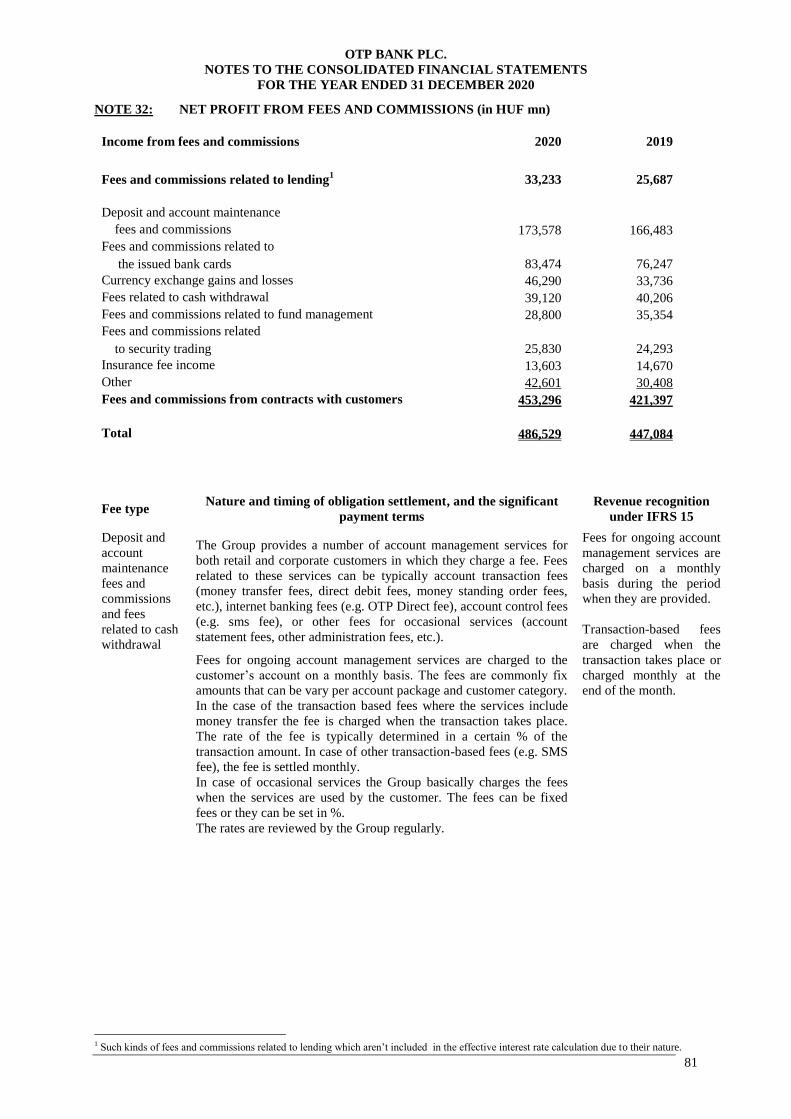
OTP BANK PLC.
NOTES TO THE CONSOLIDATED FINANCIAL STATEMENTS
FOR THE YEAR ENDED 31 DECEMBER 2020
81
NOTE 32: NET PROFIT FROM FEES AND COMMISSIONS (in HUF mn)
Income from fees and commissions 2020 2019
Fees and commissions related to lending1 33,233 25,687
Deposit and account maintenance
fees and commissions 173,578 166,483
Fees and commissions related to
the issued bank cards 83,474 76,247
Currency exchange gains and losses 46,290 33,736
Fees related to cash withdrawal 39,120 40,206
Fees and commissions related to fund management 28,800 35,354
Fees and commissions related
to security trading 25,830 24,293
Insurance fee income 13,603 14,670
Other 42,601 30,408
Fees and commissions from contracts with customers 453,296 421,397
Total 486,529 447,084
Fee type Nature and timing of obligation settlement, and the significant
payment terms
Revenue recognition
under IFRS 15
Deposit and
account
maintenance
fees and
commissions
and fees
related to cash
withdrawal
The Group provides a number of account management services for
both retail and corporate customers in which they charge a fee. Fees
related to these services can be typically account transaction fees
(money transfer fees, direct debit fees, money standing order fees,
etc.), internet banking fees (e.g. OTP Direct fee), account control fees
(e.g. sms fee), or other fees for occasional services (account
statement fees, other administration fees, etc.).
Fees for ongoing account
management services are
charged on a monthly
basis during the period
when they are provided.
Transaction-based fees
are charged when the
transaction takes place or
charged monthly at the
end of the month.
Fees for ongoing account management services are charged to the
customer’s account on a monthly basis. The fees are commonly fix
amounts that can be vary per account package and customer category.
In the case of the transaction based fees where the services include
money transfer the fee is charged when the transaction takes place.
The rate of the fee is typically determined in a certain % of the
transaction amount. In case of other transaction-based fees (e.g. SMS
fee), the fee is settled monthly.
In case of occasional services the Group basically charges the fees
when the services are used by the customer. The fees can be fixed
fees or they can be set in %.
The rates are reviewed by the Group regularly.
1 Such kinds of fees and commissions related to lending which aren’t included in the effective interest rate calculation due to their nature.

OTP BANK PLC.
NOTES TO THE CONSOLIDATED FINANCIAL STATEMENTS
FOR THE YEAR ENDED 31 DECEMBER 2020
82
NOTE 32: NET PROFIT FROM FEES AND COMMISSIONS (in HUF mn) [continued]
Fee type Nature and timing of obligation settlement, and the significant
payment terms
Revenue recognition
under IFRS 15
Fees and
commission
related to the
issued bank
cards
The Group provides a variety of bank cards to its customers, for
which different fees are charged. The fees are basically charged in
connection with the issuance of cards and the related card
transactions.
Fees for ongoing services
are charged on a monthly
basis during the period
when they are provided.
Transaction-based fees
are charged when the
transaction takes place or
charged monthly at the
end of the month.
The annual fees of the cards are charged in advance in a fixed
amount. The amount of the annual card fee depends on the type of
card.
In case of transaction-based fees (e.g. cash withdrawal/payment fee,
merchant fee, interchange fee, etc.), the settlement of the fees will
take place immediately after the transaction or on a monthly basis.
The fee is typically determined in % of the transaction with a fixed
minimum amount.
For all other cases where the Group provides a continuous service to
the customers (e.g. card closing fee), the fees are charged monthly.
The fee is calculated in a fix amount.
The rates are reviewed by the Group regularly.
Fees and
commissions
related to
security
account
management
services
The Group provides its clients security account management services.
Fees will be charged for account management and transactions on
accounts.
Fees for ongoing services
are charged quarterly or
annually during the
period when they are
provided. The fees are
accrued monthly.
Transaction-based fees
are charged when the
transaction takes place.
Account management fees are typically charged quarterly or
annually. The amount is determined in %, based on the stocks of
securities managed by the clients on the account in a given period.
Fees for transactions on the securities account are charged
immediately after the transaction. They are determined in %, based
on the transaction amount.
Fees for complex services provided to clients (e.g. portfolio
management or custody) are typically charged monthly or annually.
The fees are fixed monthly amounts and in some cases a bonus fee
are charged.
Fees and
commissions
related to fund
management
Fees from fund management services provided to investment funds
and from portfolio management provided to insurance companies,
funds. The fee income are calculated on the basis of net asset value of
the portfolio and by the fee rates determined in the contracts about
portfolio management.
Fees for ongoing services
are charged usually on
monthly (mutual funds)
or semi-annually (venture
capital funds) during the
period when they are
provided but accrued
monthly.
Net insurance
fee income
Due to the fact that the Group rarely provides insurance services to
its clients, only acts as an agent, the fee income charged to the
customers and fees payable to the insurance company are presented
net in the fee income.
In addition, agency fee charged for the sale of insurance contracts is
also recorded in this line. The fee is charged on a monthly basis and
determined in %.
Fees for ongoing services
are charged on a monthly
basis during the period
when they are provided.
Other Fees that are not significant in the Group total income are included in
Other fees category. Such fees are safe lease, special procedure fee,
account rent fee, fee of a copy of document, etc.
Other fees may include charges for continuous services or for ad hoc
administration services. Continuous fees are charged monthly (e.g.,
safe lease fees) at the beginning of the period, typically at a fixed
rate. Fees for ad hoc services are charged immediately after the
service obligation were met, usually in a fixed amount.
Fees for ongoing services
are charged on a monthly
basis during the period
when they are provided.
Fees for ad hoc services
are charged when the
transaction takes place.

OTP BANK PLC.
NOTES TO THE CONSOLIDATED FINANCIAL STATEMENTS
FOR THE YEAR ENDED 31 DECEMBER 2020
83
NOTE 32: NET PROFIT FROM FEES AND COMMISSIONS (in HUF mn) [continued]
Expense from fees and commissions 2020 2019
Fees and commissions paid on loans 6,974 3,146
Fees and commissions related to issued bank cards 32,487 29,528
Interchange fees 18,958 15,405
Fees and commissions related to deposits 7,000 5,422
Fees and commissions related to security trading 3,776 3,132
Cash withdrawal transaction fees 3,696 3,642
Fees and commissions related to collection of loans 1,447 948
Insurance fees 1,036 1,122
Postal fees 714 975
Money market transaction fees and commissions 113 73
Other 12,695 9,510
Total 88,896 72,903
Net profit from fees and commissions 397,633 374,181
NOTE 33: OTHER OPERATING INCOME AND EXPENSES AND OTHER ADMINISTRATIVE
EXPENSES (in HUF mn)
Other operating income 2020 2019
Negative goodwill due to acquisition 7,504 80,667
Gains on transactions related to property activities 3,631 8,230
Rental income 1,835 1,308
Income from computer programming 1,529 1,080
Income from real estate management 1,092 446
Gains on transactions related to insurance activity 721 848
Non-repayable assets received 65 174
Other income from non-financial activities 17,084 18,340
Total 33,461 111,093
Other operating expenses 2020 2019
Financial support for sport association and
organization of public utility 12,080 9,568
Provision for off-balance sheet commitments
and contingent liabilities 6,336 3,827
Loss allowance on other financial assets 6,036 3,774
Impairment on other non-financial assets 1,537 2,481
Non-repayable assets contributed 688 3,627
Expense from losses due to foreign currency
loan conversion at foreign subsidiaries 224 274
Impairment on tangible and intangible assets 51 2,358
Fine imposed by Competition Authority 25 143
Release of provision due to foreign currency
loan conversion at foreign subsidiaries (206) (169)
(Release of impairment) / Impairment on investments (381) 3,342
Other 13,057 15,533
Other expense from non-financial activities 5,551 6,361
Other costs 7,506 9,172
Total 39,447 44,758
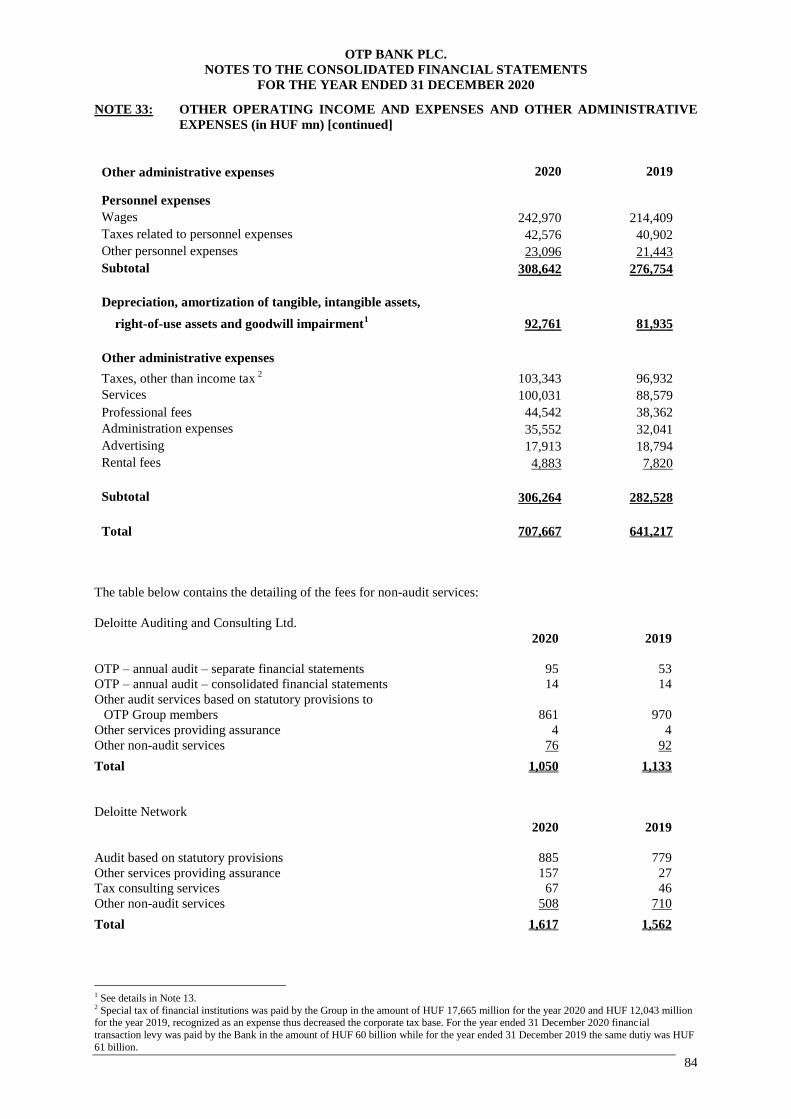
OTP BANK PLC.
NOTES TO THE CONSOLIDATED FINANCIAL STATEMENTS
FOR THE YEAR ENDED 31 DECEMBER 2020
84
NOTE 33: OTHER OPERATING INCOME AND EXPENSES AND OTHER ADMINISTRATIVE
EXPENSES (in HUF mn) [continued]
Other administrative expenses 2020 2019
Personnel expenses
Wages 242,970 214,409
Taxes related to personnel expenses 42,576 40,902
Other personnel expenses 23,096 21,443
Subtotal 308,642 276,754
Depreciation, amortization of tangible, intangible assets,
right-of-use assets and goodwill impairment1 92,761 81,935
Other administrative expenses
Taxes, other than income tax 2
103,343 96,932
Services 100,031 88,579
Professional fees 44,542 38,362
Administration expenses 35,552 32,041
Advertising 17,913 18,794
Rental fees 4,883 7,820
Subtotal 306,264 282,528
Total 707,667 641,217
The table below contains the detailing of the fees for non-audit services:
Deloitte Auditing and Consulting Ltd.
2020 2019
OTP – annual audit – separate financial statements 95 53
OTP – annual audit – consolidated financial statements 14 14
Other audit services based on statutory provisions to
OTP Group members 861 970
Other services providing assurance 4 4
Other non-audit services 76 92
Total 1,050 1,133
Deloitte Network
2020 2019
Audit based on statutory provisions 885 779
Other services providing assurance 157 27
Tax consulting services 67 46
Other non-audit services 508 710
Total 1,617 1,562
1 See details in Note 13. 2 Special tax of financial institutions was paid by the Group in the amount of HUF 17,665 million for the year 2020 and HUF 12,043 million for the year 2019, recognized as an expense thus decreased the corporate tax base. For the year ended 31 December 2020 financial
transaction levy was paid by the Bank in the amount of HUF 60 billion while for the year ended 31 December 2019 the same dutiy was HUF
61 billion.
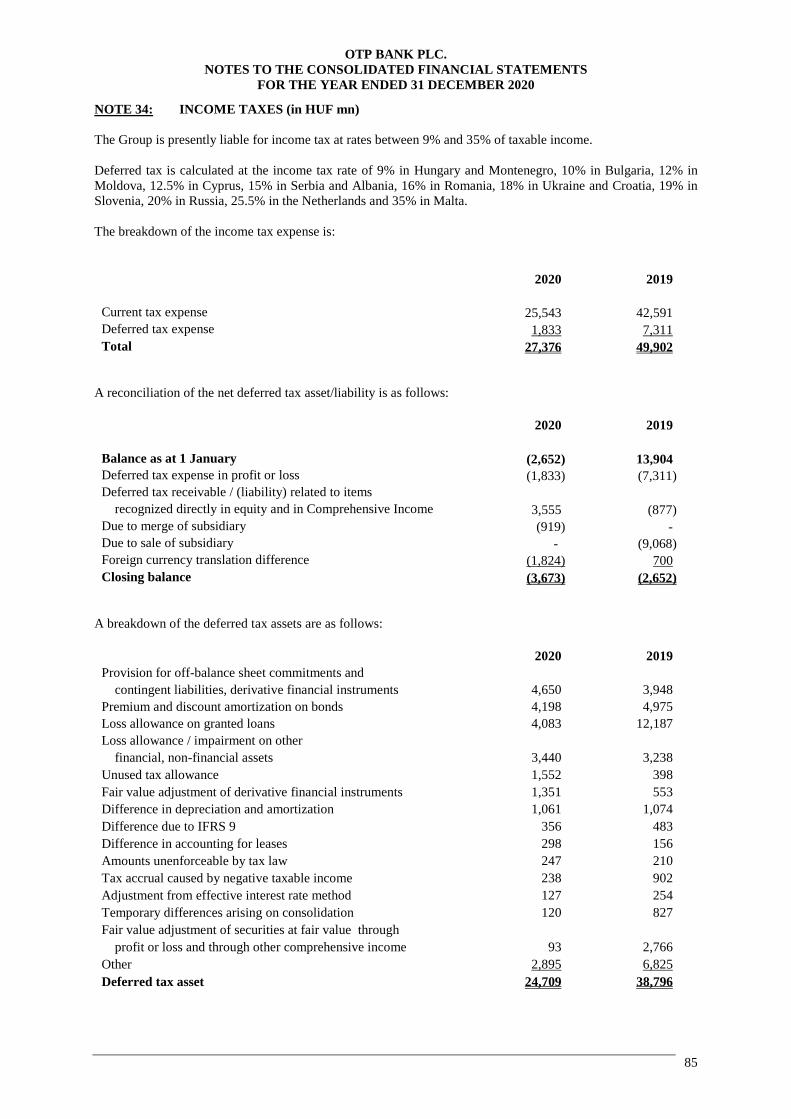
OTP BANK PLC.
NOTES TO THE CONSOLIDATED FINANCIAL STATEMENTS
FOR THE YEAR ENDED 31 DECEMBER 2020
85
NOTE 34: INCOME TAXES (in HUF mn)
The Group is presently liable for income tax at rates between 9% and 35% of taxable income.
Deferred tax is calculated at the income tax rate of 9% in Hungary and Montenegro, 10% in Bulgaria, 12% in
Moldova, 12.5% in Cyprus, 15% in Serbia and Albania, 16% in Romania, 18% in Ukraine and Croatia, 19% in
Slovenia, 20% in Russia, 25.5% in the Netherlands and 35% in Malta.
The breakdown of the income tax expense is:
2020 2019
Current tax expense 25,543 42,591
Deferred tax expense 1,833 7,311
Total 27,376 49,902
A reconciliation of the net deferred tax asset/liability is as follows:
2020 2019
Balance as at 1 January (2,652) 13,904
Deferred tax expense in profit or loss (1,833) (7,311)
Deferred tax receivable / (liability) related to items
recognized directly in equity and in Comprehensive Income 3,555 (877)
Due to merge of subsidiary (919) -
Due to sale of subsidiary - (9,068)
Foreign currency translation difference (1,824) 700
Closing balance (3,673) (2,652)
A breakdown of the deferred tax assets are as follows:
2020 2019
Provision for off-balance sheet commitments and
contingent liabilities, derivative financial instruments 4,650 3,948
Premium and discount amortization on bonds 4,198 4,975
Loss allowance on granted loans 4,083 12,187
Loss allowance / impairment on other
financial, non-financial assets 3,440 3,238
Unused tax allowance 1,552 398
Fair value adjustment of derivative financial instruments 1,351 553
Difference in depreciation and amortization 1,061 1,074
Difference due to IFRS 9 356 483
Difference in accounting for leases 298 156
Amounts unenforceable by tax law 247 210
Tax accrual caused by negative taxable income 238 902
Adjustment from effective interest rate method 127 254
Temporary differences arising on consolidation 120 827
Fair value adjustment of securities at fair value through
profit or loss and through other comprehensive income 93 2,766
Other 2,895 6,825
Deferred tax asset 24,709 38,796
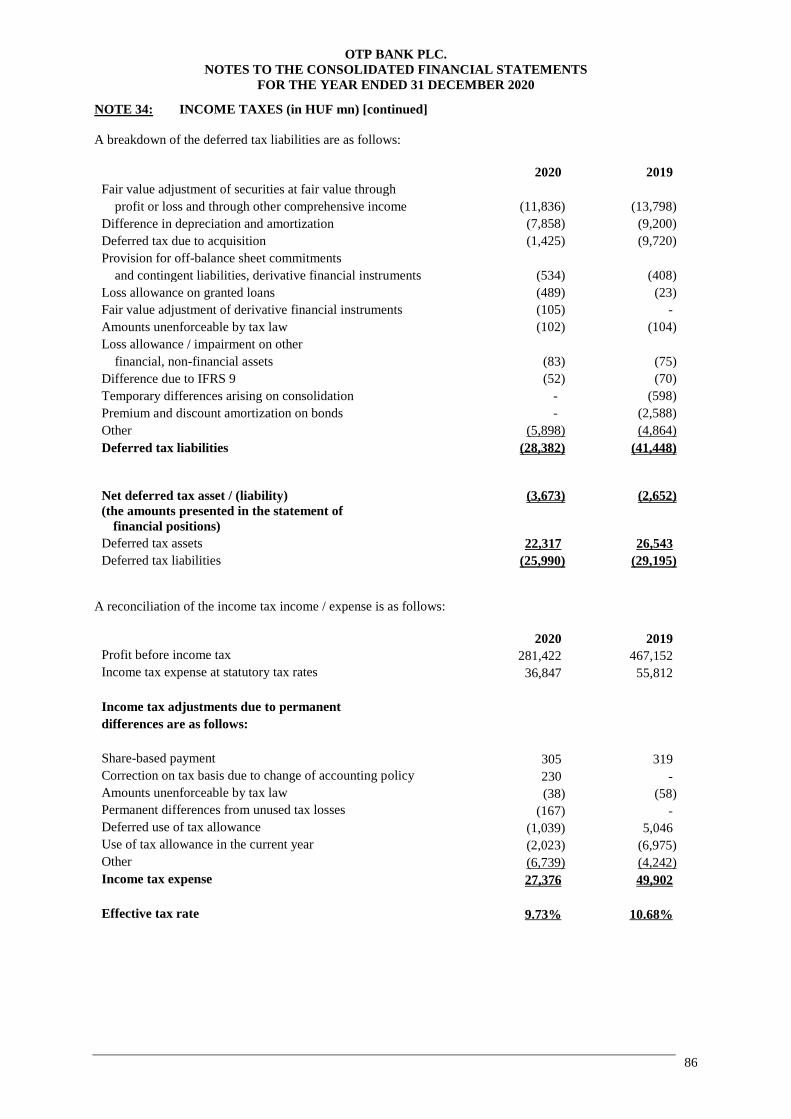
OTP BANK PLC.
NOTES TO THE CONSOLIDATED FINANCIAL STATEMENTS
FOR THE YEAR ENDED 31 DECEMBER 2020
86
NOTE 34: INCOME TAXES (in HUF mn) [continued]
A breakdown of the deferred tax liabilities are as follows:
2020 2019
Fair value adjustment of securities at fair value through
profit or loss and through other comprehensive income (11,836) (13,798)
Difference in depreciation and amortization (7,858) (9,200)
Deferred tax due to acquisition (1,425) (9,720)
Provision for off-balance sheet commitments
and contingent liabilities, derivative financial instruments (534) (408)
Loss allowance on granted loans (489) (23)
Fair value adjustment of derivative financial instruments (105) -
Amounts unenforceable by tax law (102) (104)
Loss allowance / impairment on other
financial, non-financial assets (83) (75)
Difference due to IFRS 9 (52) (70)
Temporary differences arising on consolidation - (598)
Premium and discount amortization on bonds - (2,588)
Other (5,898) (4,864)
Deferred tax liabilities (28,382) (41,448)
Net deferred tax asset / (liability) (3,673) (2,652)
(the amounts presented in the statement of
financial positions)
Deferred tax assets 22,317 26,543
Deferred tax liabilities (25,990) (29,195)
A reconciliation of the income tax income / expense is as follows:
2020 2019
Profit before income tax 281,422 467,152
Income tax expense at statutory tax rates 36,847 55,812
Income tax adjustments due to permanent
differences are as follows:
Share-based payment 305 319
Correction on tax basis due to change of accounting policy 230 -
Amounts unenforceable by tax law (38) (58)
Permanent differences from unused tax losses (167) -
Deferred use of tax allowance (1,039) 5,046
Use of tax allowance in the current year (2,023) (6,975)
Other (6,739) (4,242)
Income tax expense 27,376 49,902
Effective tax rate 9.73% 10.68%
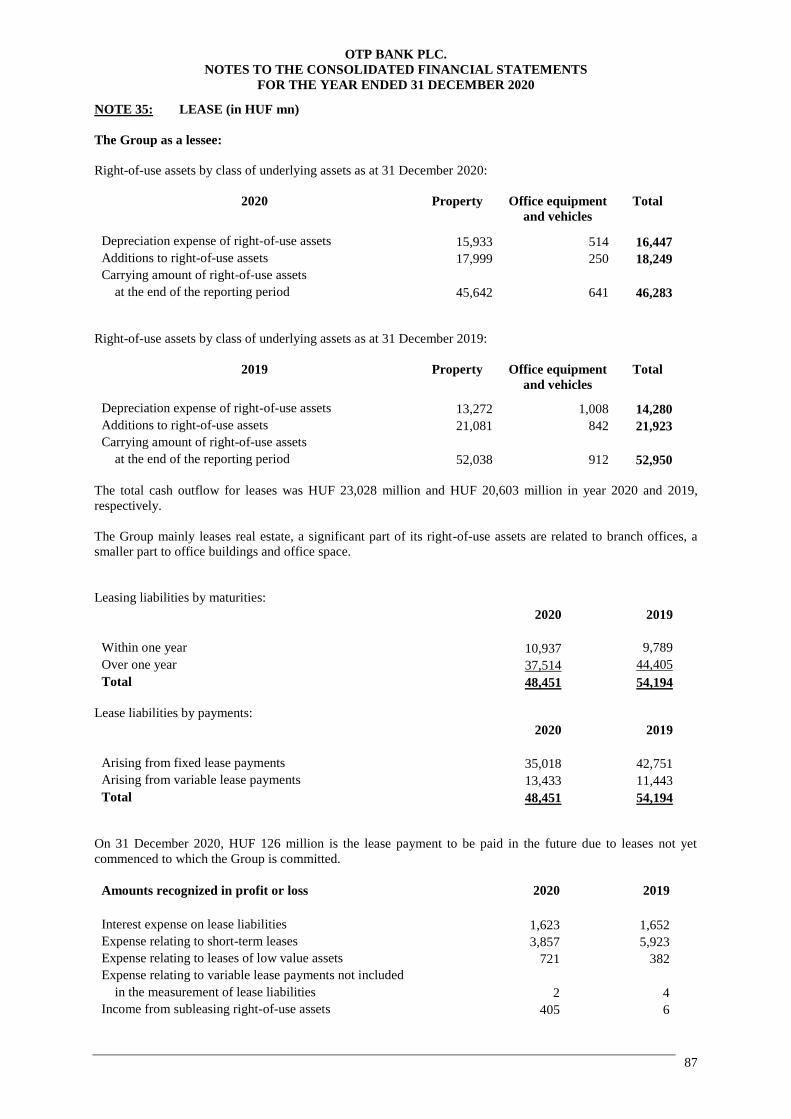
OTP BANK PLC.
NOTES TO THE CONSOLIDATED FINANCIAL STATEMENTS
FOR THE YEAR ENDED 31 DECEMBER 2020
87
NOTE 35: LEASE (in HUF mn)
The Group as a lessee:
Right-of-use assets by class of underlying assets as at 31 December 2020:
2020 Property Office equipment
and vehicles
Total
Depreciation expense of right-of-use assets 15,933 514 16,447
Additions to right-of-use assets 17,999 250 18,249
Carrying amount of right-of-use assets
at the end of the reporting period 45,642 641 46,283
Right-of-use assets by class of underlying assets as at 31 December 2019:
2019 Property Office equipment
and vehicles
Total
Depreciation expense of right-of-use assets 13,272 1,008 14,280
Additions to right-of-use assets 21,081 842 21,923
Carrying amount of right-of-use assets
at the end of the reporting period 52,038 912 52,950
The total cash outflow for leases was HUF 23,028 million and HUF 20,603 million in year 2020 and 2019,
respectively.
The Group mainly leases real estate, a significant part of its right-of-use assets are related to branch offices, a
smaller part to office buildings and office space.
Leasing liabilities by maturities:
2020 2019
Within one year 10,937 9,789
Over one year 37,514 44,405
Total 48,451 54,194
Lease liabilities by payments:
2020 2019
Arising from fixed lease payments 35,018 42,751
Arising from variable lease payments 13,433 11,443
Total 48,451 54,194
On 31 December 2020, HUF 126 million is the lease payment to be paid in the future due to leases not yet
commenced to which the Group is committed.
Amounts recognized in profit or loss 2020 2019
Interest expense on lease liabilities 1,623 1,652
Expense relating to short-term leases 3,857 5,923
Expense relating to leases of low value assets 721 382
Expense relating to variable lease payments not included
in the measurement of lease liabilities 2 4
Income from subleasing right-of-use assets 405 6
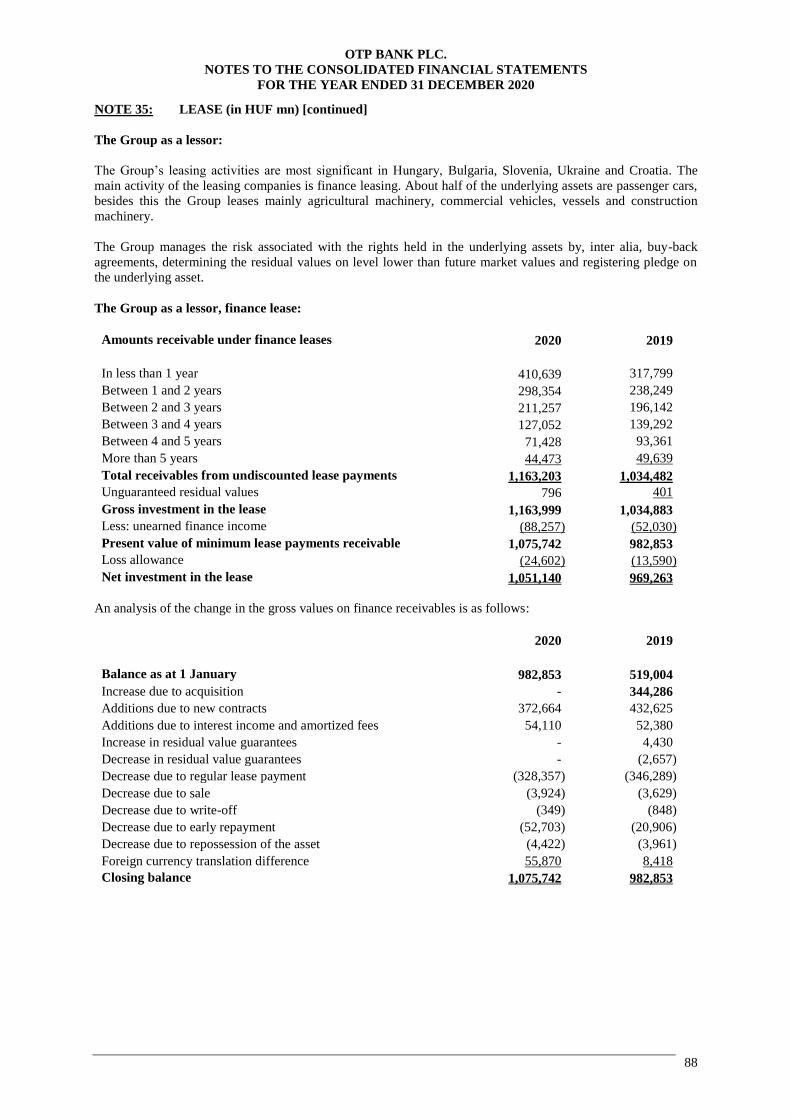
OTP BANK PLC.
NOTES TO THE CONSOLIDATED FINANCIAL STATEMENTS
FOR THE YEAR ENDED 31 DECEMBER 2020
88
NOTE 35: LEASE (in HUF mn) [continued]
The Group as a lessor:
The Group’s leasing activities are most significant in Hungary, Bulgaria, Slovenia, Ukraine and Croatia. The
main activity of the leasing companies is finance leasing. About half of the underlying assets are passenger cars,
besides this the Group leases mainly agricultural machinery, commercial vehicles, vessels and construction
machinery.
The Group manages the risk associated with the rights held in the underlying assets by, inter alia, buy-back
agreements, determining the residual values on level lower than future market values and registering pledge on
the underlying asset.
The Group as a lessor, finance lease:
Amounts receivable under finance leases 2020 2019
In less than 1 year 410,639 317,799
Between 1 and 2 years 298,354 238,249
Between 2 and 3 years 211,257 196,142
Between 3 and 4 years 127,052 139,292
Between 4 and 5 years 71,428 93,361
More than 5 years 44,473 49,639
Total receivables from undiscounted lease payments 1,163,203 1,034,482
Unguaranteed residual values 796 401
Gross investment in the lease 1,163,999 1,034,883
Less: unearned finance income (88,257) (52,030)
Present value of minimum lease payments receivable 1,075,742 982,853
Loss allowance (24,602) (13,590)
Net investment in the lease 1,051,140 969,263
An analysis of the change in the gross values on finance receivables is as follows:
2020 2019
Balance as at 1 January 982,853 519,004
Increase due to acquisition - 344,286
Additions due to new contracts 372,664 432,625
Additions due to interest income and amortized fees 54,110 52,380
Increase in residual value guarantees - 4,430
Decrease in residual value guarantees - (2,657)
Decrease due to regular lease payment (328,357) (346,289)
Decrease due to sale (3,924) (3,629)
Decrease due to write-off (349) (848)
Decrease due to early repayment (52,703) (20,906)
Decrease due to repossession of the asset (4,422) (3,961)
Foreign currency translation difference 55,870 8,418
Closing balance 1,075,742 982,853
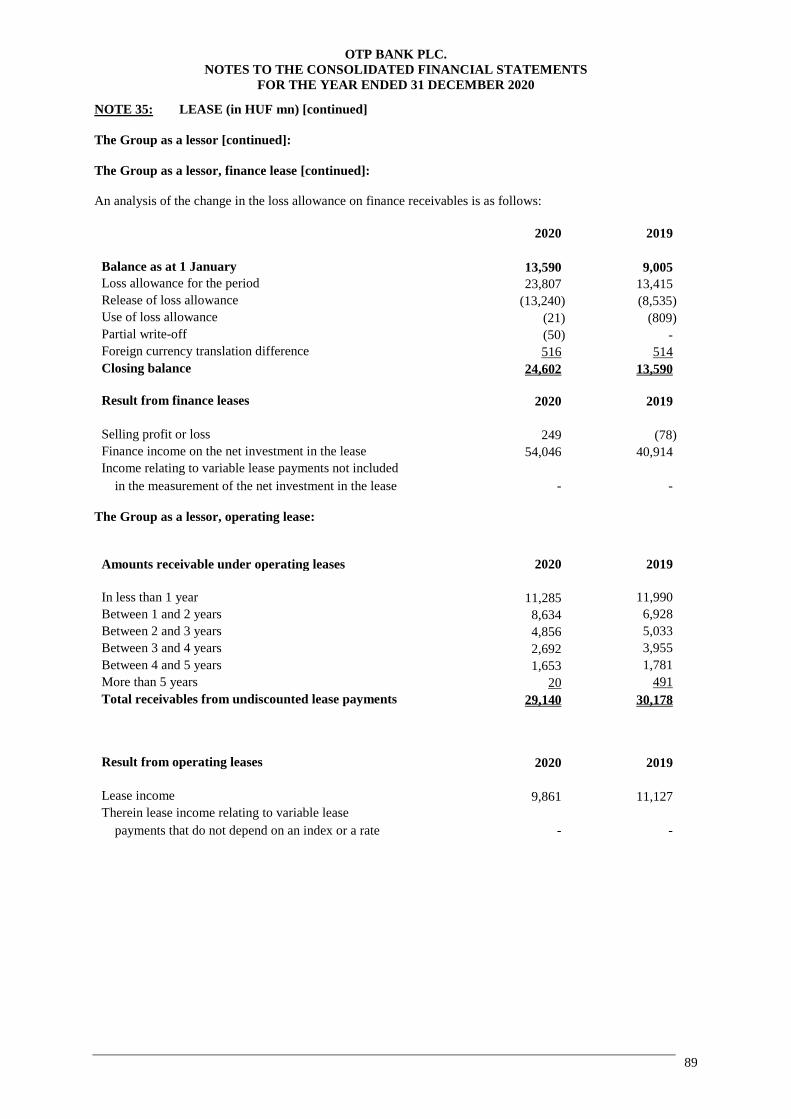
OTP BANK PLC.
NOTES TO THE CONSOLIDATED FINANCIAL STATEMENTS
FOR THE YEAR ENDED 31 DECEMBER 2020
89
NOTE 35: LEASE (in HUF mn) [continued]
The Group as a lessor [continued]:
The Group as a lessor, finance lease [continued]:
An analysis of the change in the loss allowance on finance receivables is as follows:
2020 2019
Balance as at 1 January 13,590 9,005
Loss allowance for the period 23,807 13,415
Release of loss allowance (13,240) (8,535)
Use of loss allowance (21) (809)
Partial write-off (50) -
Foreign currency translation difference 516 514
Closing balance 24,602 13,590
Result from finance leases 2020 2019
Selling profit or loss 249 (78)
Finance income on the net investment in the lease 54,046 40,914
Income relating to variable lease payments not included
in the measurement of the net investment in the lease - -
The Group as a lessor, operating lease:
Amounts receivable under operating leases 2020 2019
In less than 1 year 11,285 11,990
Between 1 and 2 years 8,634 6,928
Between 2 and 3 years 4,856 5,033
Between 3 and 4 years 2,692 3,955
Between 4 and 5 years 1,653 1,781
More than 5 years 20 491
Total receivables from undiscounted lease payments 29,140 30,178
Result from operating leases 2020 2019
Lease income 9,861 11,127
Therein lease income relating to variable lease
payments that do not depend on an index or a rate - -
OTP BANK PLC.
NOTES TO THE CONSOLIDATED FINANCIAL STATEMENTS
FOR THE YEAR ENDED 31 DECEMBER 2020
90
NOTE 36: FINANCIAL RISK MANAGEMENT (in HUF mn)
A financial instrument is any contract that gives rise to a financial asset of one entity and a financial liability or
equity instrument of another entity.
Financial instruments may result in certain risks to the Group. The most significant risks the Group faces
include:
36.1. Credit risk
The Group takes on exposure to credit risk which is the risk that a counter-party will be unable to pay amounts in
full when due. The Group structures the levels of credit risk it undertakes by placing limits on the amount of risk
accepted in relation to one borrower, or banks of borrowers, and to geographical areas and loan types. Such risks
are monitored on a periodical basis and subject to an annual or more frequent review. The exposure to any
borrower including banks and brokers is further restricted by sub-limits covering on and off-balance sheet
exposures and daily delivery risk limits in relation to trading items such as forward foreign exchange contracts.
Actual exposures against limits are monitored daily.
Exposure to credit risk is managed through regular analysis of the ability of borrowers and potential borrowers to
meet interest and principal repayment obligations and by changing these lending limits when appropriate.
Exposure to credit risk is managed by obtaining collateral, corporate and personal guarantees.
Defining the expected credit loss on individual and collective basis
On individual basis:
Individually assessed are the non-retail or non- micro- and small enterprise exposure of significant amount on a
stand-alone basis:
exposure in stage 3,
exposure in workout management
purchased or originated credit-impaired instruments which are in accordance with the conditions
mentioned above
The calculation of impairment must be prepared and approved by the risk management functional areas. The
calculation, all relevant factors (amortized cost, original and current EIR, contracted and expected cash flows
(from business and/or collateral) for the individual periods of the entire lifecycle, other essential information
enforced during the valuation) and the criteria thereof (including the factors underlying the classification as stage
3) must be documented individually.
The expected credit loss of the exposure equals the difference of the items’ AC (gross book value) on the
valuation date and the present value of the receivable's expected cash flows discounted to the valuation date by
the exposure's original effective interest rate (EIR) (calculated at the initial recognition, or in the case of variable
rate, recalculated due to the last interest rate change). The estimation of the expected future cash flows should be
forward looking, it must also contain the effects of the possible change of macroeconomic outlook.
At least two scenarios must be used for the estimation of the expected cash flow. It should be at least one
scenario in which the entity anticipates that realized cash flows will be significantly different from the
contractual cash flows. Probability weights must be allocated to the individual scenarios. The estimation must
reflect the probability of the occurrence and non-occurrence of the credit loss, even if the most probable result is
the non-occurrence of the loss.
OTP BANK PLC.
NOTES TO THE CONSOLIDATED FINANCIAL STATEMENTS
FOR THE YEAR ENDED 31 DECEMBER 2020
91
NOTE 36: FINANCIAL RISK MANAGEMENT (in HUF mn) [continued]
36.1. Credit risk [continued]
Defining the expected credit loss on individual and collective basis [continued]
On collective basis:
The following exposures are subject to collective assessment:
retail exposure irrespective of the amount,
micro and small enterprise exposures irrespective of the amount,
all other exposure which are insignificant on a stand-alone basis and not part of the workout
management,
exposure which are not in stage 3, significant on a stand-alone basis,
purchased or originated credit-impaired instruments which are in accordance with the conditions
mentioned above.
In the collective impairment methodology credit risk and the change of credit risk can be correctly captured by
understanding the risk characteristics of the portfolio. In order to achieve this the main risk drivers shall be
identified and used to form homogeneous segments having similar risk characteristics. The segmentation is
expected to stay stable from month to month however a regular (at least yearly) revision of the segmentation
process should be set up to capture the change of risk characteristics. The segmentation must be performed
separately for each parameter, since in each case different factors may have relevance.
The Bank's Headquarter Group Reserve Committee stipulates the guidelines related to the collective impairment
methodology at group level. In addition, it has right of agreement in respect of the risk parameters (PD -
probability of default, LGD - loss given default, EAD – exposure at default) and segmentation criteria proposed
by the group members.
The review of the parameters must be performed at least annually and the results should be approved by the
Group Reserve Committee. Local Risk Managements are responsible for parameter estimations / updates,
macroeconomic scenarios are calculated by OTP Bank Headquarter for each subsidiary and each parameter.
Based on the consensus proposal of Local Risk Management and OTP Bank Headquarter, the Group Reserve
Committee decides on the modification of parameters (all parameters for impairment calculation).
At least on a yearly basis the impairment parameters should be backtested as well.
The expected loss calculation should be forward looking, including forecasts of future economic conditions. This
may be achieved by applying 3-5 different macroeconomic scenarios, which may be integrated in the PD, LGD
and EAD parameters.
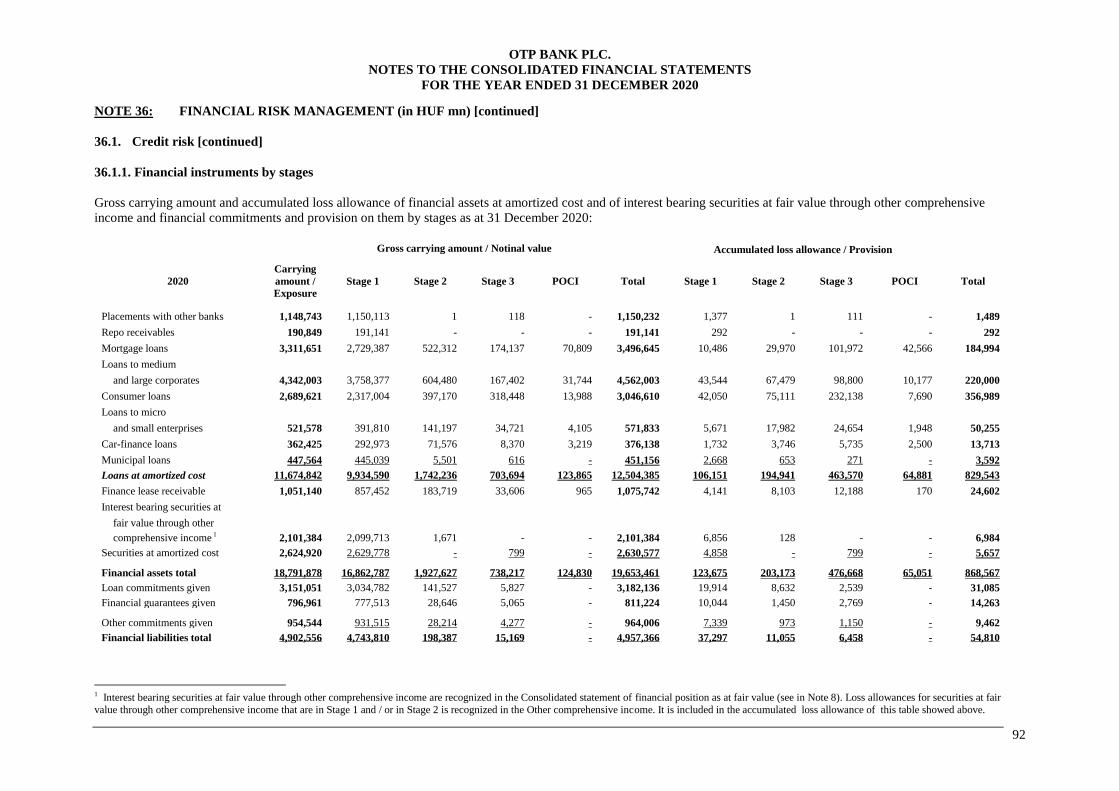
OTP BANK PLC.
NOTES TO THE CONSOLIDATED FINANCIAL STATEMENTS
FOR THE YEAR ENDED 31 DECEMBER 2020
92
NOTE 36: FINANCIAL RISK MANAGEMENT (in HUF mn) [continued]
36.1. Credit risk [continued]
36.1.1. Financial instruments by stages
Gross carrying amount and accumulated loss allowance of financial assets at amortized cost and of interest bearing securities at fair value through other comprehensive
income and financial commitments and provision on them by stages as at 31 December 2020:
Gross carrying amount / Notinal value
Accumulated loss allowance / Provision
2020
Carrying
amount /
Exposure
Stage 1 Stage 2 Stage 3 POCI Total Stage 1 Stage 2 Stage 3 POCI Total
Placements with other banks 1,148,743 1,150,113 1 118 - 1,150,232 1,377 1 111 - 1,489
Repo receivables 190,849 191,141 - - - 191,141 292 - - - 292
Mortgage loans 3,311,651 2,729,387 522,312 174,137 70,809 3,496,645 10,486 29,970 101,972 42,566 184,994
Loans to medium
and large corporates 4,342,003 3,758,377 604,480 167,402 31,744 4,562,003 43,544 67,479 98,800 10,177 220,000
Consumer loans 2,689,621 2,317,004 397,170 318,448 13,988 3,046,610 42,050 75,111 232,138 7,690 356,989
Loans to micro
and small enterprises 521,578 391,810 141,197 34,721 4,105 571,833 5,671 17,982 24,654 1,948 50,255
Car-finance loans 362,425 292,973 71,576 8,370 3,219 376,138 1,732 3,746 5,735 2,500 13,713
Municipal loans 447,564 445,039 5,501 616 - 451,156 2,668 653 271 - 3,592
Loans at amortized cost 11,674,842 9,934,590 1,742,236 703,694 123,865 12,504,385 106,151 194,941 463,570 64,881 829,543
Finance lease receivable 1,051,140 857,452 183,719 33,606 965 1,075,742 4,141 8,103 12,188 170 24,602
Interest bearing securities at
fair value through other
comprehensive income 1 2,101,384 2,099,713 1,671 - - 2,101,384 6,856 128 - - 6,984
Securities at amortized cost 2,624,920 2,629,778 - 799 - 2,630,577 4,858 - 799 - 5,657
Financial assets total 18,791,878 16,862,787 1,927,627 738,217 124,830 19,653,461 123,675 203,173 476,668 65,051 868,567
Loan commitments given 3,151,051 3,034,782 141,527 5,827 - 3,182,136 19,914 8,632 2,539 - 31,085
Financial guarantees given 796,961 777,513 28,646 5,065 - 811,224 10,044 1,450 2,769 - 14,263
Other commitments given 954,544 931,515 28,214 4,277 - 964,006 7,339 973 1,150 - 9,462
Financial liabilities total 4,902,556 4,743,810 198,387 15,169 - 4,957,366 37,297 11,055 6,458 - 54,810
1 Interest bearing securities at fair value through other comprehensive income are recognized in the Consolidated statement of financial position as at fair value (see in Note 8). Loss allowances for securities at fair
value through other comprehensive income that are in Stage 1 and / or in Stage 2 is recognized in the Other comprehensive income. It is included in the accumulated loss allowance of this table showed above.

OTP BANK PLC.
NOTES TO THE CONSOLIDATED FINANCIAL STATEMENTS
FOR THE YEAR ENDED 31 DECEMBER 2020
93
NOTE 36: FINANCIAL RISK MANAGEMENT (in HUF mn) [continued]
36.1. Credit risk [continued]
36.1.1. Financial instruments by stages [continued]
Gross carrying amount and accumulated loss allowance of financial assets at amortized cost and of interest bearing securities at fair value through other comprehensive
income and financial commitments and provision on them by stages as at 31 December 2019:
Gross carrying amount / Notinal value Accumulated loss allowance / Provision
2019
Carrying
amount /
Exposure
Stage 1 Stage 2 Stage 3 POCI Total Stage 1 Stage 2 Stage 3 POCI Total
Placements with other banks 342,922 343,224 147 29 - 343,400 451 5 22 - 478
Repo receivables 67,157 67,219 - - - 67,219 62 - - - 62
Mortgage loans 2,882,136 2,675,104 134,459 203,089 19,760 3,032,412 6,877 4,926 99,533 38,940 150,276
Loans to medium
and large corporates 3,842,864 3,672,225 136,145 168,671 25,399 4,002,440 39,412 15,169 100,178 4,817 159,576
Consumer loans 2,629,730 2,458,980 209,035 274,696 7,109 2,949,820 53,266 39,808 222,937 4,079 320,090
Loans to micro
and small enterprises 408,813 371,093 35,128 38,668 4,116 449,005 5,656 4,934 28,469 1,133 40,192
Car-finance loans 306,228 272,230 34,352 6,189 4,362 317,133 1,922 1,286 4,904 2,793 10,905
Municipal loans 343,750 343,370 3,257 403 - 347,030 2,788 267 225 - 3,280
Loans at amortized cost 10,413,521 9,793,002 552,376 691,716 60,746 11,097,840 109,921 66,390 456,246 51,762 684,319
Finance lease receivable 969,263 867,905 86,222 26,967 1,759 982,853 3,805 2,383 7,320 82 13,590
Interest bearing securities at
fair value through other
comprehensive income 1 2,386,632 2,386,632 - - - 2,386,632 2,927 - - - 2,927
Securities at amortized cost 1,968,072 1,970,083 - 728 - 1,970,811 2,014 - 725 - 2,739
Financial assets total 16,147,567 15,428,065 638,745 719,440 62,505 16,848,755 119,180 68,778 464,313 51,844 704,115
Loan commitments given 2,955,152 2,937,741 37,380 4,447 - 2,979,568 21,254 1,497 1,665 - 24,416
Financial guarantees given 641,925 635,410 11,864 5,740 - 653,014 6,927 974 3,188 - 11,089
Other commitments given 601,412 600,052 4,478 8,110 - 612,640 8,316 257 2,655 - 11,228
Financial liabilities total 4,198,489 4,173,203 53,722 18,297 - 4,245,222 36,497 2,728 7,508 - 46,733
1 Interest bearing securities at fair value through other comprehensive income are recognized in the Consolidated statement of financial position as at fair value (see in Note 8). Loss allowances for securities at fair value
through other comprehensive income that are in Stage 1 and / or in Stage 2 is recognized in the Other comprehensive income. It is included in the accumulated loss allowance of this table showed above.
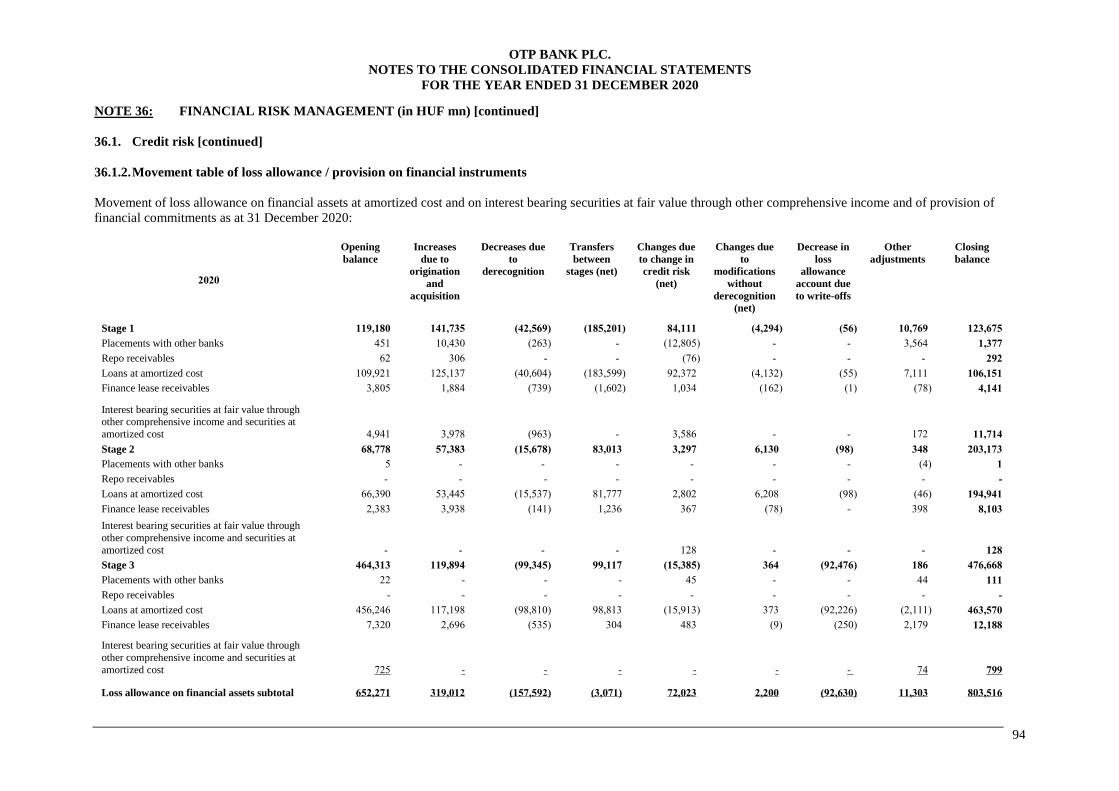
OTP BANK PLC.
NOTES TO THE CONSOLIDATED FINANCIAL STATEMENTS
FOR THE YEAR ENDED 31 DECEMBER 2020
94
NOTE 36: FINANCIAL RISK MANAGEMENT (in HUF mn) [continued]
36.1. Credit risk [continued]
36.1.2. Movement table of loss allowance / provision on financial instruments
Movement of loss allowance on financial assets at amortized cost and on interest bearing securities at fair value through other comprehensive income and of provision of
financial commitments as at 31 December 2020:
2020
Opening
balance
Increases
due to
origination
and
acquisition
Decreases due
to
derecognition
Transfers
between
stages (net)
Changes due
to change in
credit risk
(net)
Changes due
to
modifications
without
derecognition
(net)
Decrease in
loss
allowance
account due
to write-offs
Other
adjustments
Closing
balance
Stage 1 119,180 141,735 (42,569) (185,201) 84,111 (4,294) (56) 10,769 123,675
Placements with other banks 451 10,430 (263) - (12,805) - - 3,564 1,377
Repo receivables 62 306 - - (76) - - - 292
Loans at amortized cost 109,921 125,137 (40,604) (183,599) 92,372 (4,132) (55) 7,111 106,151
Finance lease receivables 3,805 1,884 (739) (1,602) 1,034 (162) (1) (78) 4,141
Interest bearing securities at fair value through other comprehensive income and securities at
amortized cost 4,941 3,978 (963) - 3,586 - - 172 11,714
Stage 2 68,778 57,383 (15,678) 83,013 3,297 6,130 (98) 348 203,173
Placements with other banks 5 - - - - - - (4) 1
Repo receivables - - - - - - - - -
Loans at amortized cost 66,390 53,445 (15,537) 81,777 2,802 6,208 (98) (46) 194,941
Finance lease receivables 2,383 3,938 (141) 1,236 367 (78) - 398 8,103
Interest bearing securities at fair value through
other comprehensive income and securities at
amortized cost - - - - 128 - - - 128
Stage 3 464,313 119,894 (99,345) 99,117 (15,385) 364 (92,476) 186 476,668
Placements with other banks 22 - - - 45 - - 44 111
Repo receivables - - - - - - - - -
Loans at amortized cost 456,246 117,198 (98,810) 98,813 (15,913) 373 (92,226) (2,111) 463,570
Finance lease receivables 7,320 2,696 (535) 304 483 (9) (250) 2,179 12,188
Interest bearing securities at fair value through
other comprehensive income and securities at
amortized cost 725 - - - - - - 74 799
Loss allowance on financial assets subtotal 652,271 319,012 (157,592) (3,071) 72,023 2,200 (92,630) 11,303 803,516
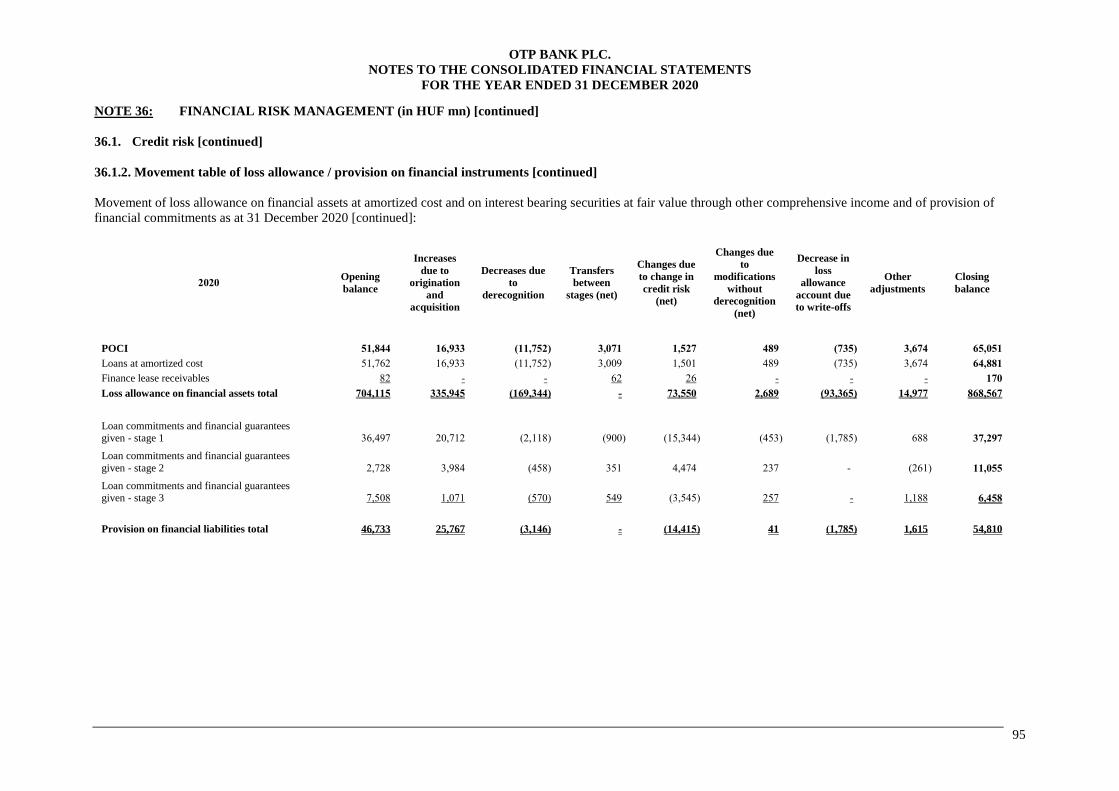
OTP BANK PLC.
NOTES TO THE CONSOLIDATED FINANCIAL STATEMENTS
FOR THE YEAR ENDED 31 DECEMBER 2020
95
NOTE 36: FINANCIAL RISK MANAGEMENT (in HUF mn) [continued]
36.1. Credit risk [continued]
36.1.2. Movement table of loss allowance / provision on financial instruments [continued]
Movement of loss allowance on financial assets at amortized cost and on interest bearing securities at fair value through other comprehensive income and of provision of
financial commitments as at 31 December 2020 [continued]:
2020 Opening
balance
Increases
due to
origination
and
acquisition
Decreases due
to
derecognition
Transfers
between
stages (net)
Changes due
to change in
credit risk
(net)
Changes due
to
modifications
without
derecognition
(net)
Decrease in
loss
allowance
account due
to write-offs
Other
adjustments
Closing
balance
POCI 51,844 16,933 (11,752) 3,071 1,527 489 (735) 3,674 65,051
Loans at amortized cost 51,762 16,933 (11,752) 3,009 1,501 489 (735) 3,674 64,881
Finance lease receivables 82 - - 62 26 - - - 170
Loss allowance on financial assets total 704,115 335,945 (169,344) - 73,550 2,689 (93,365) 14,977 868,567
Loan commitments and financial guarantees given - stage 1 36,497 20,712 (2,118) (900) (15,344) (453) (1,785) 688 37,297
Loan commitments and financial guarantees
given - stage 2 2,728 3,984 (458) 351 4,474 237 - (261) 11,055
Loan commitments and financial guarantees given - stage 3 7,508 1,071 (570) 549 (3,545) 257 - 1,188 6,458
Provision on financial liabilities total 46,733 25,767 (3,146) - (14,415) 41 (1,785) 1,615 54,810
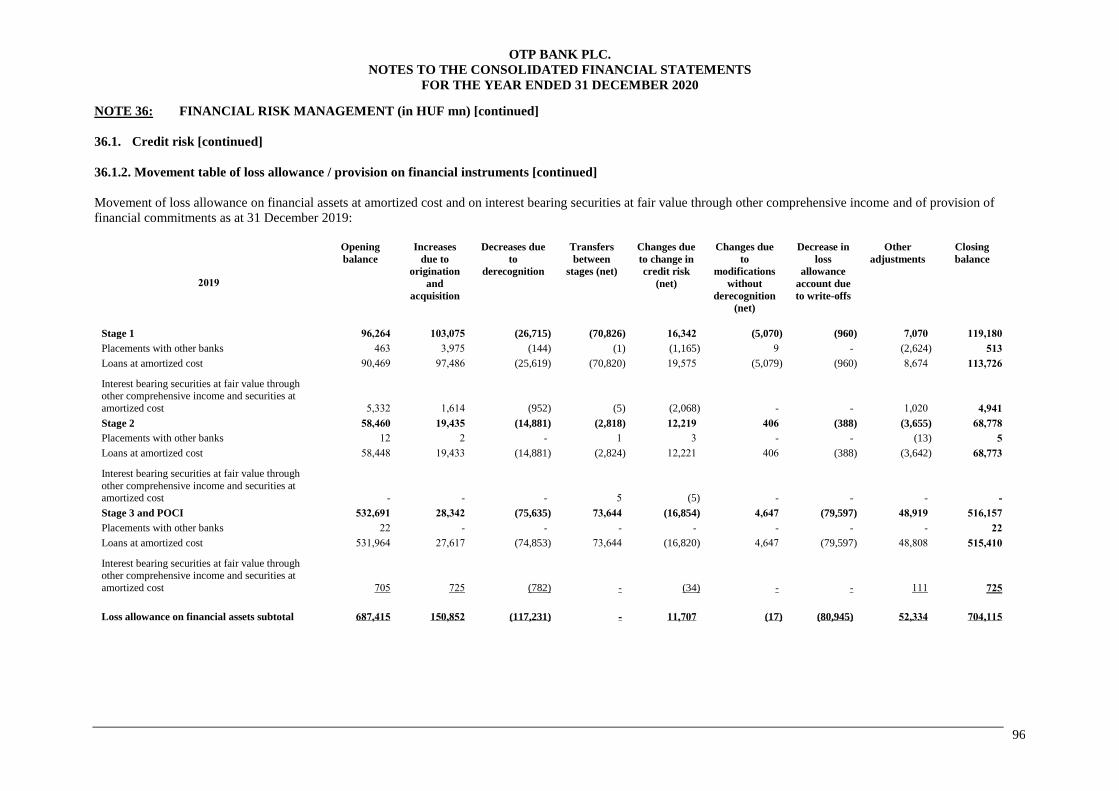
OTP BANK PLC.
NOTES TO THE CONSOLIDATED FINANCIAL STATEMENTS
FOR THE YEAR ENDED 31 DECEMBER 2020
96
NOTE 36: FINANCIAL RISK MANAGEMENT (in HUF mn) [continued]
36.1. Credit risk [continued]
36.1.2. Movement table of loss allowance / provision on financial instruments [continued]
Movement of loss allowance on financial assets at amortized cost and on interest bearing securities at fair value through other comprehensive income and of provision of
financial commitments as at 31 December 2019:
2019
Opening
balance
Increases
due to
origination
and
acquisition
Decreases due
to
derecognition
Transfers
between
stages (net)
Changes due
to change in
credit risk
(net)
Changes due
to
modifications
without
derecognition
(net)
Decrease in
loss
allowance
account due
to write-offs
Other
adjustments
Closing
balance
Stage 1 96,264 103,075 (26,715) (70,826) 16,342 (5,070) (960) 7,070 119,180
Placements with other banks 463 3,975 (144) (1) (1,165) 9 - (2,624) 513
Loans at amortized cost 90,469 97,486 (25,619) (70,820) 19,575 (5,079) (960) 8,674 113,726
Interest bearing securities at fair value through other comprehensive income and securities at
amortized cost 5,332 1,614 (952) (5) (2,068) - - 1,020 4,941
Stage 2 58,460 19,435 (14,881) (2,818) 12,219 406 (388) (3,655) 68,778
Placements with other banks 12 2 - 1 3 - - (13) 5
Loans at amortized cost 58,448 19,433 (14,881) (2,824) 12,221 406 (388) (3,642) 68,773
Interest bearing securities at fair value through
other comprehensive income and securities at amortized cost - - - 5 (5) - - - -
Stage 3 and POCI 532,691 28,342 (75,635) 73,644 (16,854) 4,647 (79,597) 48,919 516,157
Placements with other banks 22 - - - - - - - 22
Loans at amortized cost 531,964 27,617 (74,853) 73,644 (16,820) 4,647 (79,597) 48,808 515,410
Interest bearing securities at fair value through other comprehensive income and securities at
amortized cost 705 725 (782) - (34) - - 111 725
Loss allowance on financial assets subtotal 687,415 150,852 (117,231) - 11,707 (17) (80,945) 52,334 704,115
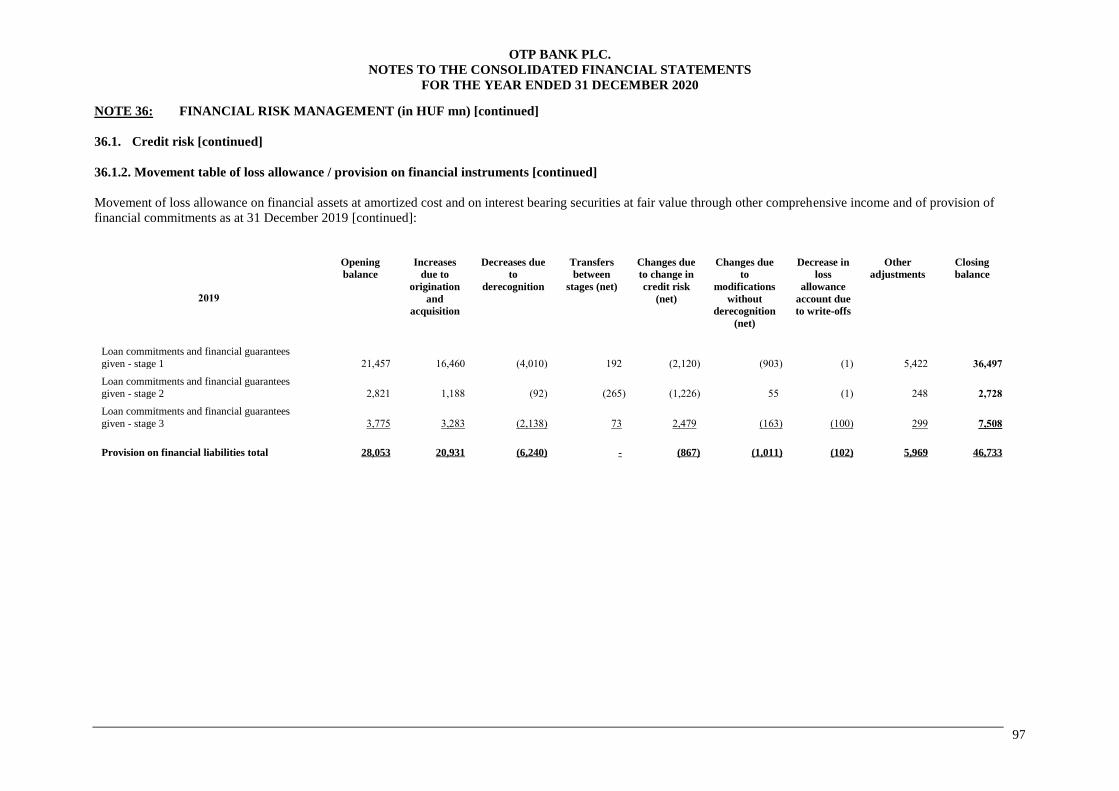
OTP BANK PLC.
NOTES TO THE CONSOLIDATED FINANCIAL STATEMENTS
FOR THE YEAR ENDED 31 DECEMBER 2020
97
NOTE 36: FINANCIAL RISK MANAGEMENT (in HUF mn) [continued]
36.1. Credit risk [continued]
36.1.2. Movement table of loss allowance / provision on financial instruments [continued]
Movement of loss allowance on financial assets at amortized cost and on interest bearing securities at fair value through other comprehensive income and of provision of
financial commitments as at 31 December 2019 [continued]:
2019
Opening
balance
Increases
due to
origination
and
acquisition
Decreases due
to
derecognition
Transfers
between
stages (net)
Changes due
to change in
credit risk
(net)
Changes due
to
modifications
without
derecognition
(net)
Decrease in
loss
allowance
account due
to write-offs
Other
adjustments
Closing
balance
Loan commitments and financial guarantees
given - stage 1 21,457 16,460 (4,010) 192 (2,120) (903) (1) 5,422 36,497
Loan commitments and financial guarantees given - stage 2 2,821 1,188 (92) (265) (1,226) 55 (1) 248 2,728
Loan commitments and financial guarantees
given - stage 3 3,775 3,283 (2,138) 73 2,479 (163) (100) 299 7,508
Provision on financial liabilities total 28,053 20,931 (6,240) - (867) (1,011) (102) 5,969 46,733
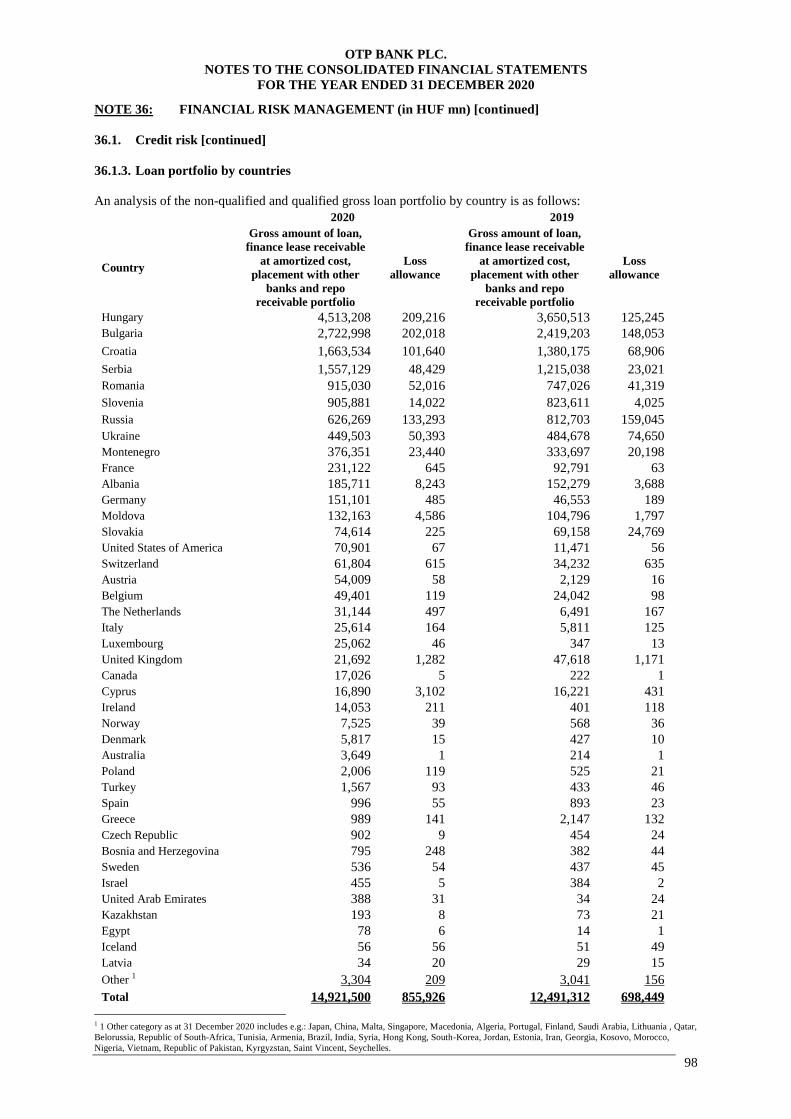
OTP BANK PLC.
NOTES TO THE CONSOLIDATED FINANCIAL STATEMENTS
FOR THE YEAR ENDED 31 DECEMBER 2020
98
NOTE 36: FINANCIAL RISK MANAGEMENT (in HUF mn) [continued]
36.1. Credit risk [continued]
36.1.3. Loan portfolio by countries
An analysis of the non-qualified and qualified gross loan portfolio by country is as follows:
2020 2019
Country
Gross amount of loan,
finance lease receivable
at amortized cost,
placement with other
banks and repo
receivable portfolio
Loss
allowance
Gross amount of loan,
finance lease receivable
at amortized cost,
placement with other
banks and repo
receivable portfolio
Loss
allowance
Hungary 4,513,208 209,216 3,650,513 125,245
Bulgaria 2,722,998 202,018 2,419,203 148,053
Croatia 1,663,534 101,640 1,380,175 68,906
Serbia 1,557,129 48,429 1,215,038 23,021
Romania 915,030 52,016 747,026 41,319
Slovenia 905,881 14,022 823,611 4,025
Russia 626,269 133,293 812,703 159,045
Ukraine 449,503 50,393 484,678 74,650
Montenegro 376,351 23,440 333,697 20,198
France 231,122 645 92,791 63
Albania 185,711 8,243 152,279 3,688
Germany 151,101 485 46,553 189
Moldova 132,163 4,586 104,796 1,797
Slovakia 74,614 225 69,158 24,769
United States of America 70,901 67 11,471 56
Switzerland 61,804 615 34,232 635
Austria 54,009 58 2,129 16
Belgium 49,401 119 24,042 98
The Netherlands 31,144 497 6,491 167
Italy 25,614 164 5,811 125
Luxembourg 25,062 46 347 13
United Kingdom 21,692 1,282 47,618 1,171
Canada 17,026 5 222 1
Cyprus 16,890 3,102 16,221 431
Ireland 14,053 211 401 118
Norway 7,525 39 568 36
Denmark 5,817 15 427 10
Australia 3,649 1 214 1
Poland 2,006 119 525 21
Turkey 1,567 93 433 46
Spain 996 55 893 23
Greece 989 141 2,147 132
Czech Republic 902 9 454 24
Bosnia and Herzegovina 795 248 382 44
Sweden 536 54 437 45
Israel 455 5 384 2
United Arab Emirates 388 31 34 24
Kazakhstan 193 8 73 21
Egypt 78 6 14 1
Iceland 56 56 51 49
Latvia 34 20 29 15
Other 1 3,304 209 3,041 156
Total 14,921,500 855,926 12,491,312 698,449
1 1 Other category as at 31 December 2020 includes e.g.: Japan, China, Malta, Singapore, Macedonia, Algeria, Portugal, Finland, Saudi Arabia, Lithuania , Qatar,
Belorussia, Republic of South-Africa, Tunisia, Armenia, Brazil, India, Syria, Hong Kong, South-Korea, Jordan, Estonia, Iran, Georgia, Kosovo, Morocco,
Nigeria, Vietnam, Republic of Pakistan, Kyrgyzstan, Saint Vincent, Seychelles.
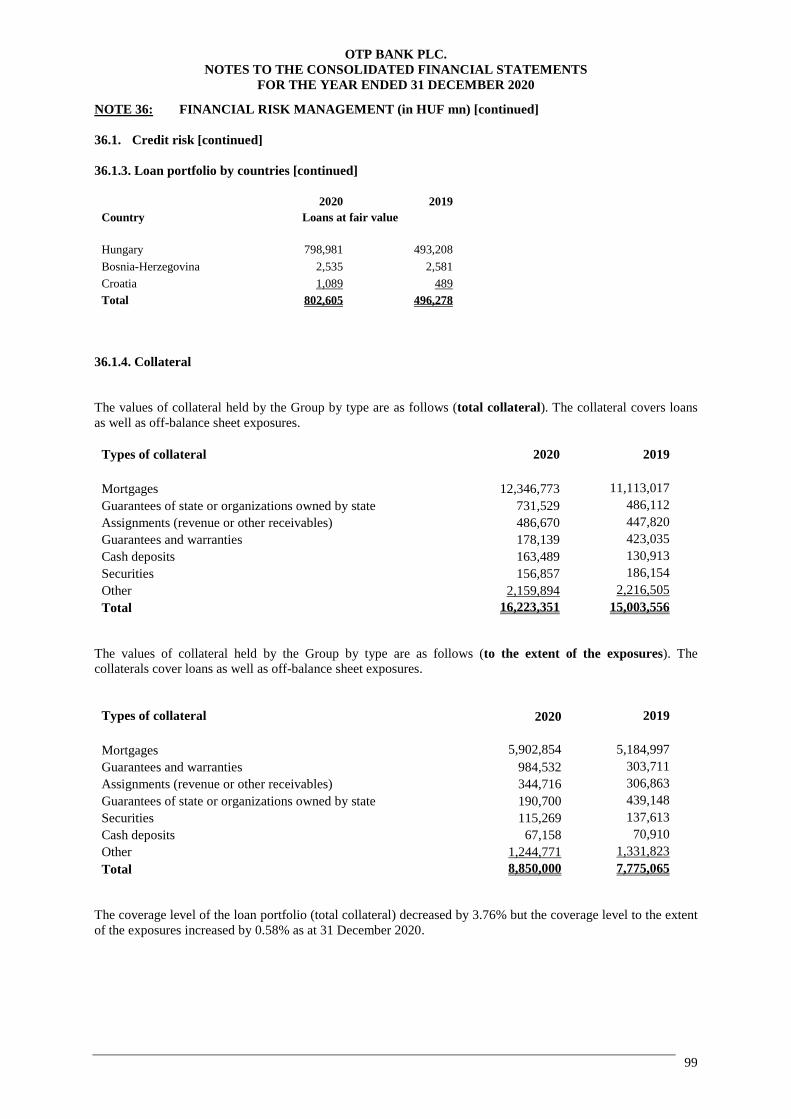
OTP BANK PLC.
NOTES TO THE CONSOLIDATED FINANCIAL STATEMENTS
FOR THE YEAR ENDED 31 DECEMBER 2020
99
NOTE 36: FINANCIAL RISK MANAGEMENT (in HUF mn) [continued]
36.1. Credit risk [continued]
36.1.3. Loan portfolio by countries [continued]
2020 2019
Country Loans at fair value
Hungary 798,981 493,208
Bosnia-Herzegovina 2,535 2,581
Croatia 1,089 489
Total 802,605 496,278
36.1.4. Collateral
The values of collateral held by the Group by type are as follows (total collateral). The collateral covers loans
as well as off-balance sheet exposures.
Types of collateral 2020 2019
Mortgages 12,346,773 11,113,017
Guarantees of state or organizations owned by state 731,529 486,112
Assignments (revenue or other receivables) 486,670 447,820
Guarantees and warranties 178,139 423,035
Cash deposits 163,489 130,913
Securities 156,857 186,154
Other 2,159,894 2,216,505
Total 16,223,351 15,003,556
The values of collateral held by the Group by type are as follows (to the extent of the exposures). The
collaterals cover loans as well as off-balance sheet exposures.
Types of collateral 2020 2019
Mortgages 5,902,854 5,184,997
Guarantees and warranties 984,532 303,711
Assignments (revenue or other receivables) 344,716 306,863
Guarantees of state or organizations owned by state 190,700 439,148
Securities 115,269 137,613
Cash deposits 67,158 70,910
Other 1,244,771 1,331,823
Total 8,850,000 7,775,065
The coverage level of the loan portfolio (total collateral) decreased by 3.76% but the coverage level to the extent
of the exposures increased by 0.58% as at 31 December 2020.

OTP BANK PLC.
NOTES TO THE CONSOLIDATED FINANCIAL STATEMENTS
FOR THE YEAR ENDED 31 DECEMBER 2020
100
NOTE 36: FINANCIAL RISK MANAGEMENT (in HUF mn) [continued]
36.1. Credit risk [continued]
36.1.5. Restructured loans
2020 2019
Gross
portfolio
Loss
allowance
Gross
portfolio
Loss
allowance
Loans to medium
and large corporations 58,271 (12,260) 22,418 3,948
Retail consumer loans 31,108 (14,714) 16,344 3,748
Retail mortgage loans 15,159 (2,754) 16,564 1,218
Loans to micro and small enterprises 11,782 (1,237) 9,344 1,728
Municipal 41 (16) 9 3
Other loans 4,412 (791) 305 32
Total 120,773 (31,772) 64,984 10,677
The forborne definition used by the Group is based on EBA (EU) 2015/227 regulation.

OTP BANK PLC.
NOTES TO THE CONSOLIDATED FINANCIAL STATEMENTS
FOR THE YEAR ENDED 31 DECEMBER 2020
101
NOTE 36: FINANCIAL RISK MANAGEMENT (in HUF mn) [continued]
36.1. Credit risk [continued]
36.1.6. Financial instruments by rating categories1
Securities held for trading as at fair value through profit or loss as at 31 December 2020
Aaa A2 A3 Baa1 Baa2 Baa3 Ba1 Ba2 Ba3 B1 Not
rated
Total
Government bonds - - - 9,138 2,155 5,734 7,247 - 13,762 - - 38,036
Discounted Treasury bills - - - - - 1,233 - - 11,428 - 60 12,721
Equity instruments
and fund units 535 36 33 45 7 36 - 7 - 5 3,036 3,740
Other interest bearing securities - - 495 - - 998 - - - 582 2,075
Total 535 36 528 9,183 2,162 8,001 7,247 7 25,190 5 3,678 56,572
Non-trading securities mandatorily at fair value through profit or loss as at 31 December 2020
Aa3 A1 Baa3 Not rated Total
Non-trading debt instruments mandatorily at fair value through profit or loss 2,794 - 1,457 7,263 11,514
Non-trading equity instruments mandatorily at fair value through profit or loss - - - 46,063 46,063
Debt securities designated at fair value through profit or loss - 2,235 - - 2,235
Total 2,794 2,235 1,457 53,326 59,812
1 Moody’s ratings

OTP BANK PLC.
NOTES TO THE CONSOLIDATED FINANCIAL STATEMENTS
FOR THE YEAR ENDED 31 DECEMBER 2020
102
NOTE 36: FINANCIAL RISK MANAGEMENT (in HUF mn) [continued]
36.1. Credit risk [continued]
36.1.6. Financial instruments by rating categories1 [continued]
Securities at fair value through other comprehensive income as at 31 December 2020
Aaa Aa2 Aa3 A2 A3 Baa1 Baa2 Baa3 Ba1 Ba2 Ba3 B1 B3 Caa1 Not
rated
Total
Government bonds 20,639 8,215 - 37,195 120,112 192,994 - 959,133 182,685 - 200,478 18,166 69,248 46,269 - 1,855,134
Mortgage bonds - - - 63,577 - - - - - - - - - - 24,695 88,272
Corporate bonds - - - - 4,815 - 2,336 39,179 4,997 979 12,532 - - - 16,782 81,620
Discounted
Treasury bills - - - - - - - 9,957 66,401 - - - - - - 76,358
Non-trading
equity instruments - - 3,875 - - 47 - 898 - - - - - - 30,505 35,325
Total 20,639 8,215 3,875 100,772 124,927 193,041 2,336 1,009,167 254,083 979 213,010 18,166 69,248 46,269 71,982 2,136,709
Securities at amortized cost as at 31 December 2020
Aa2 A1 A3 Baa1 Baa3 Ba1 Ba3 B1 B3 Not
rated
Total
Government bonds 45,975 10,953 38,987 38,627 2,310,965 10,874 4,147 10,174 74,774 - 2,545,476
Corporate bonds - - - - 14,619 10,527 - - - 49,486 74,632
Discounted Treasury bills - - - - - - - - 10,469 - 10,469
Total 45,975 10,953 38,987 38,627 2,325,584 21,401 4,147 10,174 85,243 49,486 2,630,577
1 Moody’s ratings
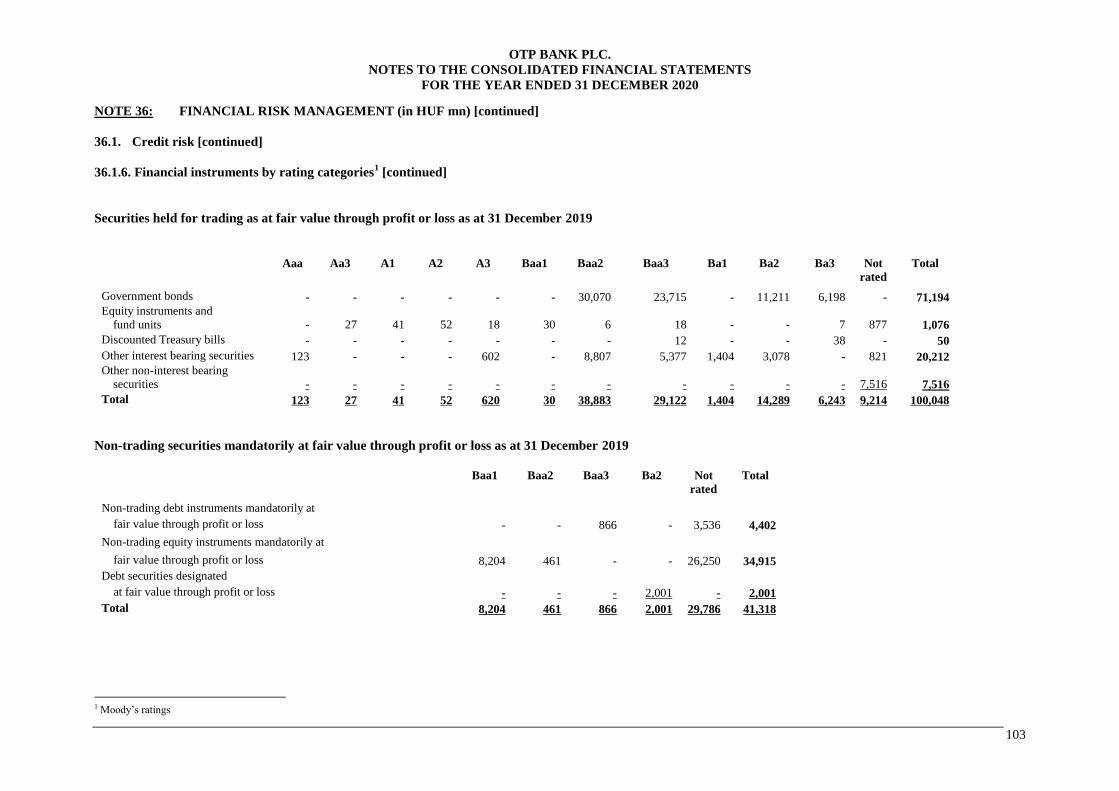
OTP BANK PLC.
NOTES TO THE CONSOLIDATED FINANCIAL STATEMENTS
FOR THE YEAR ENDED 31 DECEMBER 2020
103
NOTE 36: FINANCIAL RISK MANAGEMENT (in HUF mn) [continued]
36.1. Credit risk [continued]
36.1.6. Financial instruments by rating categories1 [continued]
Securities held for trading as at fair value through profit or loss as at 31 December 2019
Aaa Aa3 A1 A2 A3 Baa1 Baa2 Baa3 Ba1 Ba2 Ba3 Not
rated
Total
Government bonds - - - - - - 30,070 23,715 - 11,211 6,198 - 71,194
Equity instruments and
fund units - 27 41 52 18 30 6 18 - - 7 877 1,076
Discounted Treasury bills - - - - - - - 12 - - 38 - 50
Other interest bearing securities 123 - - - 602 - 8,807 5,377 1,404 3,078 - 821 20,212
Other non-interest bearing
securities - - - - - - - - - - - 7,516 7,516
Total 123 27 41 52 620 30 38,883 29,122 1,404 14,289 6,243 9,214 100,048
Non-trading securities mandatorily at fair value through profit or loss as at 31 December 2019
Baa1 Baa2 Baa3 Ba2 Not
rated
Total
Non-trading debt instruments mandatorily at
fair value through profit or loss - - 866 - 3,536 4,402
Non-trading equity instruments mandatorily at
fair value through profit or loss 8,204 461 - - 26,250 34,915
Debt securities designated
at fair value through profit or loss - - - 2,001 - 2,001
Total 8,204 461 866 2,001 29,786 41,318
1 Moody’s ratings

OTP BANK PLC.
NOTES TO THE CONSOLIDATED FINANCIAL STATEMENTS
FOR THE YEAR ENDED 31 DECEMBER 2020
104
NOTE 36: FINANCIAL RISK MANAGEMENT (in HUF mn) [continued]
36.1. Credit risk [continued]
36.1.6. Financial instruments by rating categories1 [continued]
Securities at fair value through other comprehensive income as at 31 December 2019
Aaa Aa2 Aa3 A2 A3 Baa1 Baa2 Baa3 Ba1 Ba2 Ba3 B1 Caa1 Not
rated
Total
Government bonds 12,213 7,103 - 38,730 6,536 114,296 180,974 1,013,472 - 137,353 156,000 60,930 45,005 - 1,772,612
Discounted Treasury bills - - - - - - - 339,398 - 104,292 - - - - 443,690
Mortgage bonds - - - - - 65,086 - 7,841 - - - - - 24,341 97,268
Corporate bonds - - - - 4,700 - 3,529 34,900 4,950 892 - - - 24,091 73,062
Non-trading equity instruments - - 6,370 - - - - 1,139 - - - - - 32,638 40,147
Total 12,213 7,103 6,370 38,730 11,236 179,382 184,503 1,396,750 4,950 242,537 156,000 60,930 45,005 81,070 2,426,779
Securities at amortized cost as at 31 December 2019
Aa2 Baa1 Baa3 Ba2 Ba3 B1 B3 Caa1 Not
rated
Total
Government bonds 41,010 42,454 1,722,028 1,444 5,520 26,442 5,218 89,721 - 1,933,837
Corporate bonds - - - 9,975 - - - - 12,744 22,719
Mortgage bonds - - 7,739 - - - - - - 7,739
Discounted Treasury bills - - - - - - 6,516 - - 6,516
Total 41,010 42,454 1,729,767 11,419 5,520 26,442 11,734 89,721 12,744 1,970,811
1 Moody’s ratings

OTP BANK PLC.
NOTES TO THE CONSOLIDATED FINANCIAL STATEMENTS
FOR THE YEAR ENDED 31 DECEMBER 2020
105
NOTE 36: FINANCIAL RISK MANAGEMENT (in HUF mn) [continued]
36.2. Maturity analysis of assets, liabilities and liquidity risk
Liquidity risk is a measure of the extent to which the Group may be required to raise funds to meet its
commitments associated with financial instruments. The Group maintains its liquidity profiles in accordance
with regulations prescribed by the NBH.
The essential aspect of the liquidity risk management strategy is to identify all relevant systemic and
idiosyncratic sources of liquidity risk and to measure the probability and severity of such events. During liquidity
risk management the Group considers the effect of liquidity risk events caused by reasons arising in the bank
business line (deposit withdrawal), the national economy (exchange rate shock yield curve shock) and the global
financial system (capital market shock).
In line with the Group’s risk management policy liquidity risks are measured and managed on multiply hierarchy
levels and applying integrated unified VaR based methodology. The basic requirement is that the Group must
keep high quality liquidity reserves which means it can fulfill all liabilities when they fall due without material
additional costs.
The liquidity reserves can be divided in two parts. There are separate decentralized liquid asset portfolios at
subsidiary level and a centralized flexible liquidity pool at a Group level. The reserves at subsidiary levels are
held to cover the relevant shocks of the subsidiaries which may arise in local currencies (deposit withdrawal,
local capital market shock, unexpected business expansion), while the centralized liquidity pool is held to cover
the Bank’s separate shocks (deposit-, yield curve- and exchange rate shocks) and all group member’s potential
shocks that may arise in foreign currencies (deposit withdrawal, capital market shock).
The recalculation of shocks is made at least quarterly while the recalibration of shock measurement models and
review of the risk management methodology is an annual process. The monitoring of liquidity reserves for both
centralized and decentralized liquid asset portfolio has been built into the daily reporting process.
Due to the balance sheet adjustment process (deleveraging) experienced in the last few years, the liquidity
reserves of the Group increased significantly while the liquidity risk exposure has decreased considerably.
Currently the (over)coverage of potential liquidity risk exposure by high quality liquid assets is high. There were
no material changes in the liquidity risk management process for the year ended 31 December 2020.
The contractual amounts disclosed in the maturity analyses are the contractual undiscounted cash-flows like
gross finance lease obligations (before deducting finance charges); prices specified in forward agreements to
purchase financial assets for cash; net amounts for pay-floating/receive-fixed interest rate swaps for which net
cash-flows are exchanged; contractual amounts to be exchanged in a derivative financial instrument for which
gross cash-flows are exchanged; gross loan commitments.
Such undiscounted cash-flows differ from the amount included in the statement of financial position because the
amount in that statement is based on discounted cash-flows. When the amount payable is not fixed, the amount
disclosed is determined by reference to the conditions existing at the end of the reporting period. For example,
when the amount payable varies with changes in an index, the amount disclosed may be based on the level of the
index at the end of the period.
The following tables provide an analysis of assets and liabilities about the non-discounted cash-flow into
relevant maturity groupings based on the remaining period from the balance sheet date to the contractual
maturity date. It is presented under the most prudent consideration of maturity dates where options or repayment
schedules allow for early repayment possibilities.
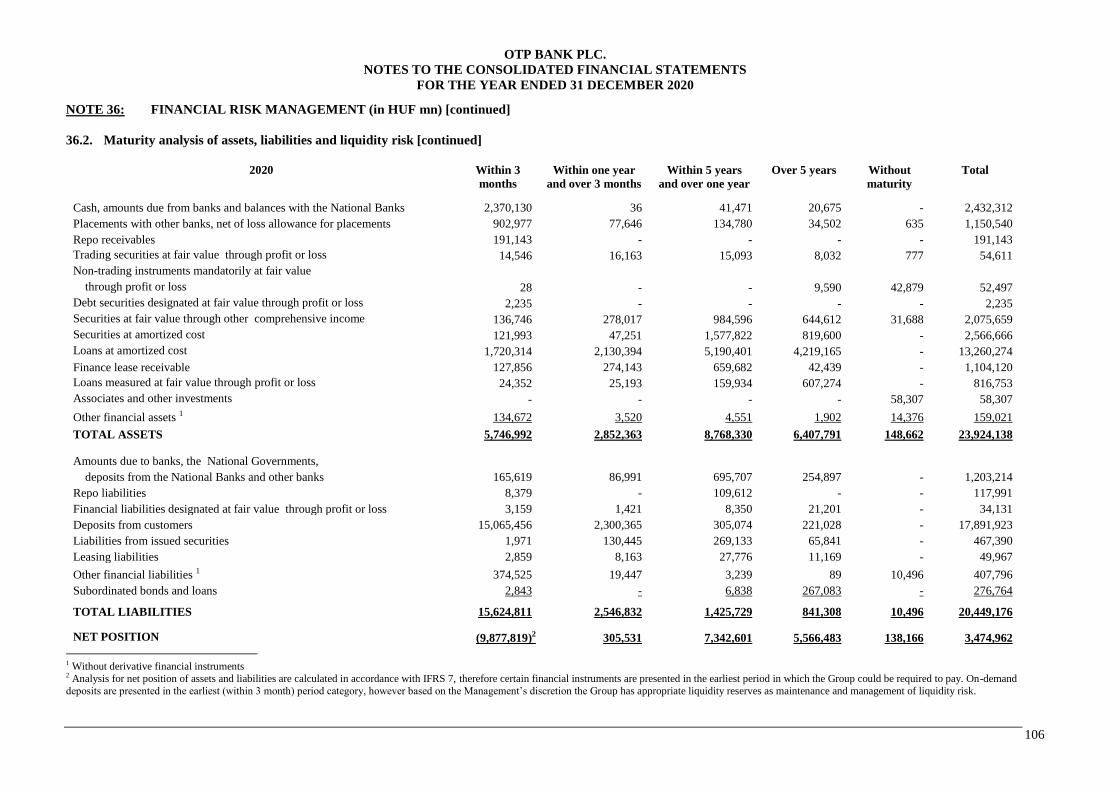
OTP BANK PLC.
NOTES TO THE CONSOLIDATED FINANCIAL STATEMENTS
FOR THE YEAR ENDED 31 DECEMBER 2020
106
NOTE 36: FINANCIAL RISK MANAGEMENT (in HUF mn) [continued]
36.2. Maturity analysis of assets, liabilities and liquidity risk [continued]
2020 Within 3
months
Within one year
and over 3 months
Within 5 years
and over one year
Over 5 years Without
maturity
Total
Cash, amounts due from banks and balances with the National Banks 2,370,130 36 41,471 20,675 - 2,432,312
Placements with other banks, net of loss allowance for placements 902,977 77,646 134,780 34,502 635 1,150,540
Repo receivables 191,143 - - - - 191,143
Trading securities at fair value through profit or loss 14,546 16,163 15,093 8,032 777 54,611
Non-trading instruments mandatorily at fair value
through profit or loss 28 - - 9,590 42,879 52,497
Debt securities designated at fair value through profit or loss 2,235 - - - - 2,235
Securities at fair value through other comprehensive income 136,746 278,017 984,596 644,612 31,688 2,075,659
Securities at amortized cost 121,993 47,251 1,577,822 819,600 - 2,566,666
Loans at amortized cost 1,720,314 2,130,394 5,190,401 4,219,165 - 13,260,274
Finance lease receivable 127,856 274,143 659,682 42,439 - 1,104,120
Loans measured at fair value through profit or loss 24,352 25,193 159,934 607,274 - 816,753
Associates and other investments - - - - 58,307 58,307
Other financial assets 1 134,672 3,520 4,551 1,902 14,376 159,021
TOTAL ASSETS 5,746,992 2,852,363 8,768,330 6,407,791 148,662 23,924,138
Amounts due to banks, the National Governments,
deposits from the National Banks and other banks 165,619 86,991 695,707 254,897 - 1,203,214
Repo liabilities 8,379 - 109,612 - - 117,991
Financial liabilities designated at fair value through profit or loss 3,159 1,421 8,350 21,201 - 34,131
Deposits from customers 15,065,456 2,300,365 305,074 221,028 - 17,891,923
Liabilities from issued securities 1,971 130,445 269,133 65,841 - 467,390
Leasing liabilities 2,859 8,163 27,776 11,169 - 49,967
Other financial liabilities 1 374,525 19,447 3,239 89 10,496 407,796
Subordinated bonds and loans 2,843 - 6,838 267,083 - 276,764
TOTAL LIABILITIES 15,624,811 2,546,832 1,425,729 841,308 10,496 20,449,176
NET POSITION (9,877,819)2 305,531 7,342,601 5,566,483 138,166 3,474,962
1 Without derivative financial instruments 2 Analysis for net position of assets and liabilities are calculated in accordance with IFRS 7, therefore certain financial instruments are presented in the earliest period in which the Group could be required to pay. On-demand
deposits are presented in the earliest (within 3 month) period category, however based on the Management’s discretion the Group has appropriate liquidity reserves as maintenance and management of liquidity risk.
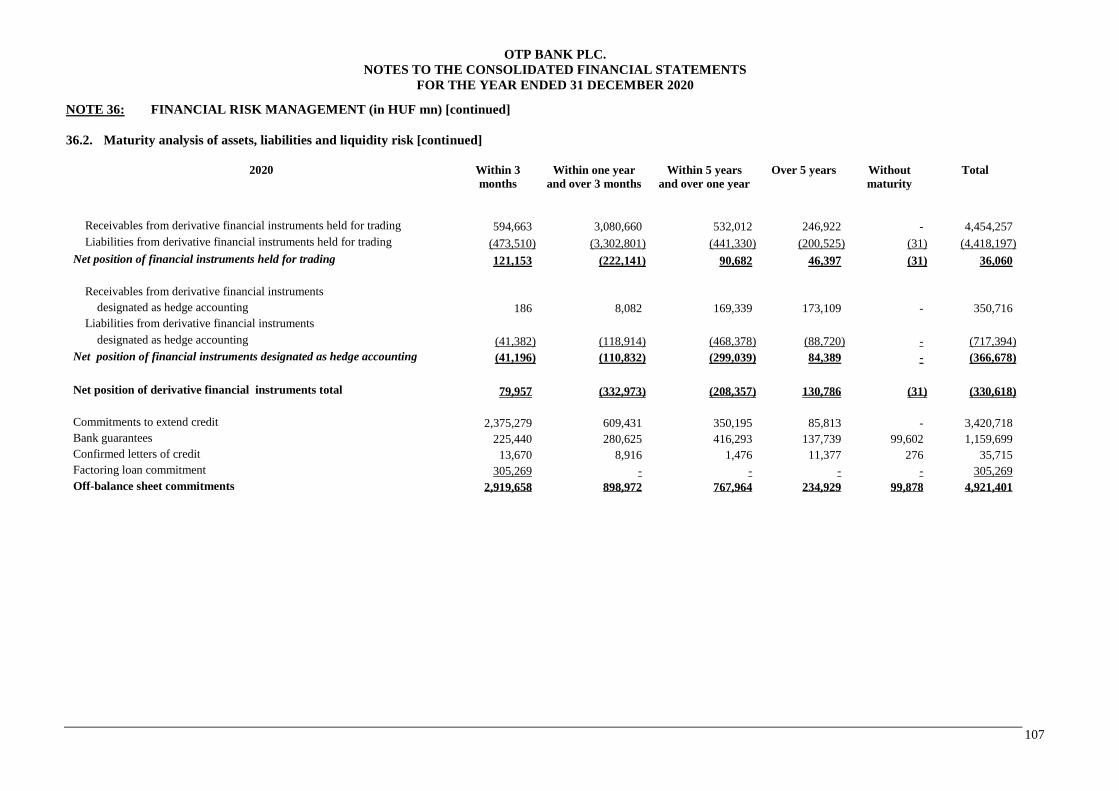
OTP BANK PLC.
NOTES TO THE CONSOLIDATED FINANCIAL STATEMENTS
FOR THE YEAR ENDED 31 DECEMBER 2020
107
NOTE 36: FINANCIAL RISK MANAGEMENT (in HUF mn) [continued]
36.2. Maturity analysis of assets, liabilities and liquidity risk [continued]
2020 Within 3
months
Within one year
and over 3 months
Within 5 years
and over one year
Over 5 years Without
maturity
Total
Receivables from derivative financial instruments held for trading 594,663 3,080,660 532,012 246,922 - 4,454,257
Liabilities from derivative financial instruments held for trading (473,510) (3,302,801) (441,330) (200,525) (31) (4,418,197)
Net position of financial instruments held for trading 121,153 (222,141) 90,682 46,397 (31) 36,060
Receivables from derivative financial instruments
designated as hedge accounting 186 8,082 169,339 173,109 - 350,716
Liabilities from derivative financial instruments
designated as hedge accounting (41,382) (118,914) (468,378) (88,720) - (717,394)
Net position of financial instruments designated as hedge accounting (41,196) (110,832) (299,039) 84,389 - (366,678)
Net position of derivative financial instruments total 79,957 (332,973) (208,357) 130,786 (31) (330,618)
Commitments to extend credit 2,375,279 609,431 350,195 85,813 - 3,420,718
Bank guarantees 225,440 280,625 416,293 137,739 99,602 1,159,699
Confirmed letters of credit 13,670 8,916 1,476 11,377 276 35,715
Factoring loan commitment 305,269 - - - - 305,269
Off-balance sheet commitments 2,919,658 898,972 767,964 234,929 99,878 4,921,401

OTP BANK PLC.
NOTES TO THE CONSOLIDATED FINANCIAL STATEMENTS
FOR THE YEAR ENDED 31 DECEMBER 2020
108
NOTE 36: FINANCIAL RISK MANAGEMENT (in HUF mn) [continued]
36.2. Maturity analysis of assets, liabilities and liquidity risk [continued]
2019 Within 3
months
Within one year
and over 3 months
Within 5 years
and over one year
Over 5 years Without
maturity
Total
Cash, amounts due from banks and balances with the National Banks 1,671,732 19,884 92,762 - - 1,784,378
Placements with other banks, net of loss allowance for placements 151,893 65,792 110,150 16,206 1,257 345,298
Repo receivables 63,728 3,491 - - - 67,219
Trading securities at fair value through profit or loss 10,398 13,875 53,442 13,277 3,203 94,195
Non-trading instruments mandatorily at fair value
through profit or loss 227 - 3,309 10,935 19,920 34,391
Debt securities designated at fair value through profit or loss - - 2,001 - - 2,001
Securities at fair value through other comprehensive income 327,488 572,117 952,654 486,814 40,186 2,379,259
Securities at amortized cost 143,579 124,320 1,097,138 530,139 - 1,895,176
Loans at amortized cost 1,707,326 2,297,158 4,176,950 3,583,573 29,721 11,794,728
Finance lease receivable 99,876 246,072 624,206 37,250 - 1,007,404
Loans measured at fair value through profit or loss 6,602 20,160 113,724 358,665 - 499,151
Associates and other investments - - - - 29,638 29,638
Other financial assets 1 109,999 3,826 3,233 405 18,748 136,211
TOTAL ASSETS 4,292,848 3,366,695 7,229,569 5,037,264 142,673 20,069,049
Amounts due to banks, the National Governments,
deposits from the National Banks and other banks 285,246 61,745 334,553 143,979 - 825,523
Repo liabilities 488 - - - - 488
Financial liabilities designated at fair value through profit or loss 677 1,928 11,606 16,651 - 30,862
Deposits from customers 12,372,360 1,301,904 1,150,368 356,471 - 15,181,103
Liabilities from issued securities 1,850 24,902 368,266 104 - 395,122
Leasing liabilities 2,210 7,647 30,540 14,087 5 54,489
Other financial liabilities 1 310,060 13,998 4,246 23 9,693 338,020
Subordinated bonds and loans 2,695 - - 249,532 - 252,227
TOTAL LIABILITIES 12,975,586 1,412,124 1,899,579 780,847 9,698 17,077,834
NET POSITION (8,682,738)2 1,954,571 5,329,990 4,256,417 132,975 2,991,215
1 Without derivative financial instruments 2 Analysis for net position of assets and liabilities are calculated in accordance with IFRS 7, therefore certain financial instruments are presented in the earliest period in which the Group could be required to pay. On-demand
deposits are presented in the earliest (within 3 month) period category, however based on the Management’s discretion the Group has appropriate liquidity reserves as maintenance and management of liquidity risk.

OTP BANK PLC.
NOTES TO THE CONSOLIDATED FINANCIAL STATEMENTS
FOR THE YEAR ENDED 31 DECEMBER 2020
109
NOTE 36: FINANCIAL RISK MANAGEMENT (in HUF mn) [continued]
36.2. Maturity analysis of assets, liabilities and liquidity risk [continued]
2019 Within 3
months
Within one year
and over 3 months
Within 5 years
and over one year
Over 5 years Without
maturity
Total
Receivables from derivative financial instruments held for trading 2,010,040 1,583,020 698,897 441,348 - 4,733,305
Liabilities from derivative financial instruments held for trading (2,177,179) (1,255,660) (776,359) (352,566) (234) (4,561,998)
Net position of financial instruments (167,139) 327,360 (77,462) 88,782 (234) 171,307
held for trading
Receivables from derivative financial instruments
designated as hedge accounting 2,253 94,227 151,825 156,010 - 404,315
Liabilities from derivative financial instruments
designated as hedge accounting (8,737) (250,345) (231,794) (76,210) - (567,086)
Net position of financial instruments designated
as hedge accounting (6,484) (156,118) (79,969) 79,800 - (162,771)
Net position of derivative financial instruments total (173,623) 171,242 (157,431) 168,582 (234) 8,536
Commitments to extend credit 2,240,364 337,644 351,136 92,511 5,457 3,027,112
Bank guarantees 164,575 281,387 259,246 145,286 116,155 966,649
Confirmed letters of credit 12,587 5,887 2,147 7,433 5,242 33,296
Factoring loan commitment 228,145 - - - - 228,145
Off-balance sheet commitments 2,645,671 624,918 612,529 245,230 126,854 4,255,202
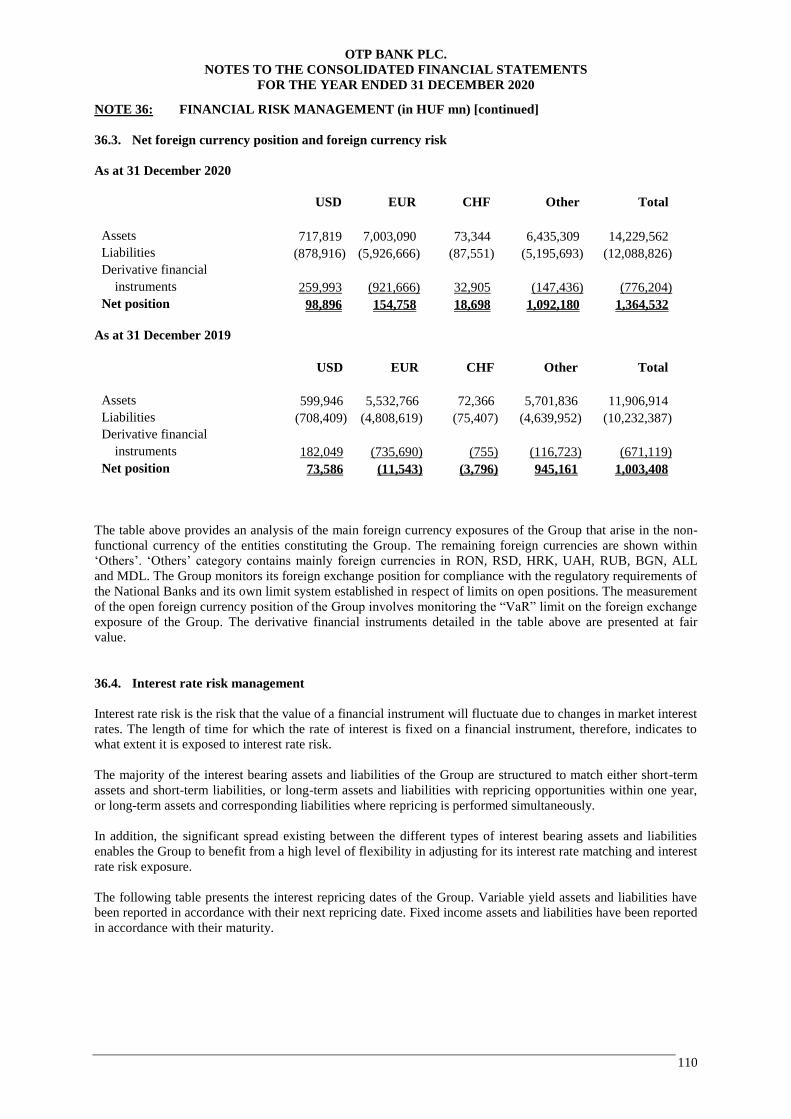
OTP BANK PLC.
NOTES TO THE CONSOLIDATED FINANCIAL STATEMENTS
FOR THE YEAR ENDED 31 DECEMBER 2020
110
NOTE 36: FINANCIAL RISK MANAGEMENT (in HUF mn) [continued]
36.3. Net foreign currency position and foreign currency risk
As at 31 December 2020
USD EUR CHF Other Total
Assets 717,819 7,003,090 73,344 6,435,309 14,229,562
Liabilities (878,916) (5,926,666) (87,551) (5,195,693) (12,088,826)
Derivative financial
instruments 259,993 (921,666) 32,905 (147,436) (776,204)
Net position 98,896 154,758 18,698 1,092,180 1,364,532
As at 31 December 2019
USD EUR CHF Other Total
Assets 599,946 5,532,766 72,366 5,701,836 11,906,914
Liabilities (708,409) (4,808,619) (75,407) (4,639,952) (10,232,387)
Derivative financial
instruments 182,049 (735,690) (755) (116,723) (671,119)
Net position 73,586 (11,543) (3,796) 945,161 1,003,408
The table above provides an analysis of the main foreign currency exposures of the Group that arise in the non-
functional currency of the entities constituting the Group. The remaining foreign currencies are shown within
‘Others’. ‘Others’ category contains mainly foreign currencies in RON, RSD, HRK, UAH, RUB, BGN, ALL
and MDL. The Group monitors its foreign exchange position for compliance with the regulatory requirements of
the National Banks and its own limit system established in respect of limits on open positions. The measurement
of the open foreign currency position of the Group involves monitoring the “VaR” limit on the foreign exchange
exposure of the Group. The derivative financial instruments detailed in the table above are presented at fair
value.
36.4. Interest rate risk management
Interest rate risk is the risk that the value of a financial instrument will fluctuate due to changes in market interest
rates. The length of time for which the rate of interest is fixed on a financial instrument, therefore, indicates to
what extent it is exposed to interest rate risk.
The majority of the interest bearing assets and liabilities of the Group are structured to match either short-term
assets and short-term liabilities, or long-term assets and liabilities with repricing opportunities within one year,
or long-term assets and corresponding liabilities where repricing is performed simultaneously.
In addition, the significant spread existing between the different types of interest bearing assets and liabilities
enables the Group to benefit from a high level of flexibility in adjusting for its interest rate matching and interest
rate risk exposure.
The following table presents the interest repricing dates of the Group. Variable yield assets and liabilities have
been reported in accordance with their next repricing date. Fixed income assets and liabilities have been reported
in accordance with their maturity.
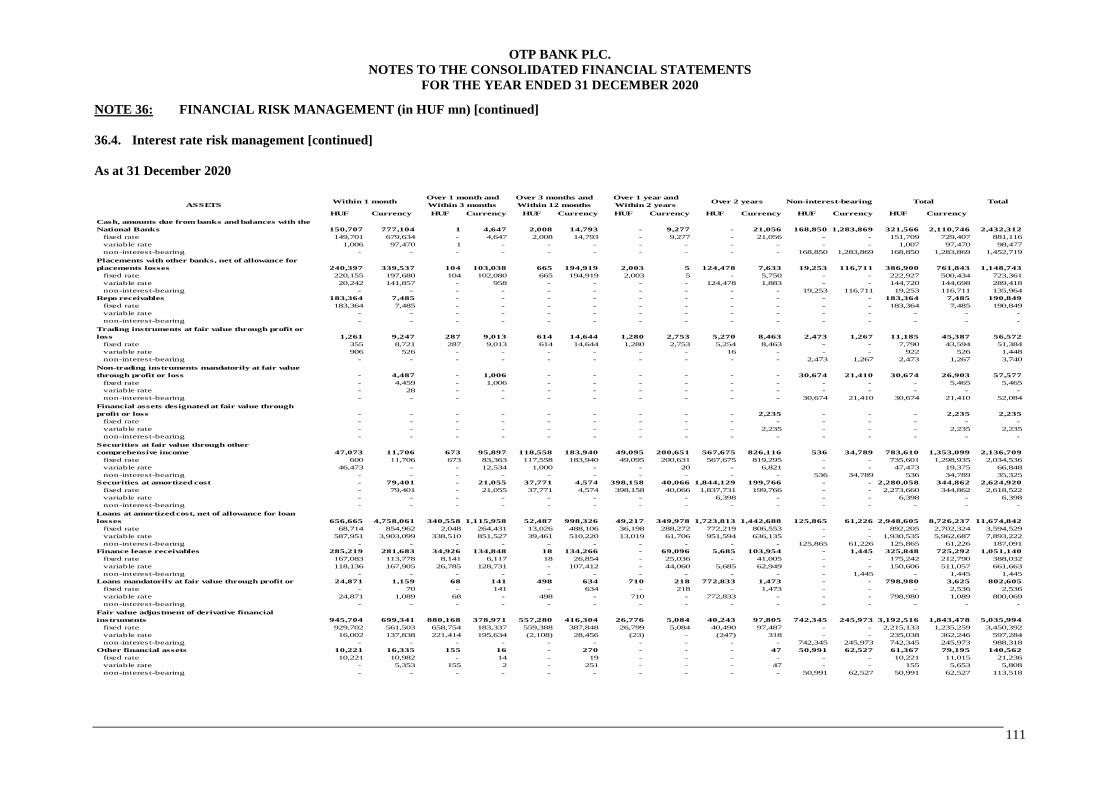
OTP BANK PLC.
NOTES TO THE CONSOLIDATED FINANCIAL STATEMENTS
FOR THE YEAR ENDED 31 DECEMBER 2020
111
NOTE 36: FINANCIAL RISK MANAGEMENT (in HUF mn) [continued]
36.4. Interest rate risk management [continued]
As at 31 December 2020
Total
HUF Currency HUF Currency HUF Currency HUF Currency HUF Currency HUF Currency HUF Currency
150,707 777,104 1 4,647 2,008 14,793 - 9,277 - 21,056 168,850 1,283,869 321,566 2,110,746 2,432,312
fixed rate 149,701 679,634 - 4,647 2,008 14,793 - 9,277 - 21,056 - - 151,709 729,407 881,116
variable rate 1,006 97,470 1 - - - - - - - - - 1,007 97,470 98,477
non-interest-bearing - - - - - - - - - - 168,850 1,283,869 168,850 1,283,869 1,452,719
240,397 339,537 104 103,038 665 194,919 2,003 5 124,478 7,633 19,253 116,711 386,900 761,843 1,148,743
fixed rate 220,155 197,680 104 102,080 665 194,919 2,003 5 - 5,750 - - 222,927 500,434 723,361
variable rate 20,242 141,857 - 958 - - - - 124,478 1,883 - - 144,720 144,698 289,418
non-interest-bearing - - - - - - - - - - 19,253 116,711 19,253 116,711 135,964
Repo receivables 183,364 7,485 - - - - - - - - - - 183,364 7,485 190,849
fixed rate 183,364 7,485 - - - - - - - - - - 183,364 7,485 190,849
variable rate - - - - - - - - - - - - - - -
non-interest-bearing - - - - - - - - - - - - - - -
1,261 9,247 287 9,013 614 14,644 1,280 2,753 5,270 8,463 2,473 1,267 11,185 45,387 56,572
fixed rate 355 8,721 287 9,013 614 14,644 1,280 2,753 5,254 8,463 - - 7,790 43,594 51,384
variable rate 906 526 - - - - - - 16 - - - 922 526 1,448
non-interest-bearing - - - - - - - - - - 2,473 1,267 2,473 1,267 3,740
- 4,487 - 1,006 - - - - - - 30,674 21,410 30,674 26,903 57,577
fixed rate - 4,459 - 1,006 - - - - - - - - - 5,465 5,465
variable rate - 28 - - - - - - - - - - - - -
non-interest-bearing - - - - - - - - - - 30,674 21,410 30,674 21,410 52,084
- - - - - - - - - 2,235 - - - 2,235 2,235
fixed rate - - - - - - - - - - - - - - -
variable rate - - - - - - - - - 2,235 - - - 2,235 2,235
non-interest-bearing - - - - - - - - - - - - - - -
47,073 11,706 673 95,897 118,558 183,940 49,095 200,651 567,675 826,116 536 34,789 783,610 1,353,099 2,136,709
fixed rate 600 11,706 673 83,363 117,558 183,940 49,095 200,631 567,675 819,295 - - 735,601 1,298,935 2,034,536
variable rate 46,473 - - 12,534 1,000 - - 20 - 6,821 - - 47,473 19,375 66,848
non-interest-bearing - - - - - - - - - - 536 34,789 536 34,789 35,325
- 79,401 - 21,055 37,771 4,574 398,158 40,066 1,844,129 199,766 - - 2,280,058 344,862 2,624,920
fixed rate - 79,401 - 21,055 37,771 4,574 398,158 40,066 1,837,731 199,766 - - 2,273,660 344,862 2,618,522
variable rate - - - - - - - - 6,398 - - - 6,398 - 6,398
non-interest-bearing - - - - - - - - - - - - - - -
656,665 4,758,061 340,558 1,115,958 52,487 998,326 49,217 349,978 1,723,813 1,442,688 125,865 61,226 2,948,605 8,726,237 11,674,842
fixed rate 68,714 854,962 2,048 264,431 13,026 488,106 36,198 288,272 772,219 806,553 - - 892,205 2,702,324 3,594,529
variable rate 587,951 3,903,099 338,510 851,527 39,461 510,220 13,019 61,706 951,594 636,135 - - 1,930,535 5,962,687 7,893,222
non-interest-bearing - - - - - - - - - - 125,865 61,226 125,865 61,226 187,091
Finance lease receivables 285,219 281,683 34,926 134,848 18 134,266 - 69,096 5,685 103,954 - 1,445 325,848 725,292 1,051,140
fixed rate 167,083 113,778 8,141 6,117 18 26,854 - 25,036 - 41,005 - - 175,242 212,790 388,032
variable rate 118,136 167,905 26,785 128,731 - 107,412 - 44,060 5,685 62,949 - - 150,606 511,057 661,663
non-interest-bearing - - - - - - - - - - - 1,445 - 1,445 1,445
24,871 1,159 68 141 498 634 710 218 772,833 1,473 - - 798,980 3,625 802,605
fixed rate - 70 - 141 - 634 - 218 - 1,473 - - - 2,536 2,536
variable rate 24,871 1,089 68 - 498 - 710 - 772,833 - - - 798,980 1,089 800,069
non-interest-bearing - - - - - - - - - - - - - - -
945,704 699,341 880,168 378,971 557,280 416,304 26,776 5,084 40,243 97,805 742,345 245,973 3,192,516 1,843,478 5,035,994
fixed rate 929,702 561,503 658,754 183,337 559,388 387,848 26,799 5,084 40,490 97,487 - - 2,215,133 1,235,259 3,450,392
variable rate 16,002 137,838 221,414 195,634 (2,108) 28,456 (23) - (247) 318 - - 235,038 362,246 597,284
non-interest-bearing - - - - - - - - - - 742,345 245,973 742,345 245,973 988,318
10,221 16,335 155 16 - 270 - - - 47 50,991 62,527 61,367 79,195 140,562
fixed rate 10,221 10,982 - 14 - 19 - - - - - - 10,221 11,015 21,236
variable rate - 5,353 155 2 - 251 - - - 47 - - 155 5,653 5,808
non-interest-bearing - - - - - - - - - - 50,991 62,527 50,991 62,527 113,518
TotalWithin 1 monthOver 1 month and
Within 3 months
Over 3 months and
Within 12 months
Over 1 year and
Within 2 yearsOver 2 years Non-interest-bearing
Financial assets designated at fair value through
profit or loss
Securities at fair value through other
comprehensive income
Loans at amortized cost, net of allowance for loan
losses
Loans mandatorily at fair value through profit or
Securities at amortized cost
Fair value adjustment of derivative financial
instruments
ASSETS
Cash, amounts due from banks and balances with the
National Banks
Placements with other banks, net of allowance for
placements losses
Trading instruments at fair value through profit or
loss
Non-trading instruments mandatorily at fair value
through profit or loss
Other financial assets
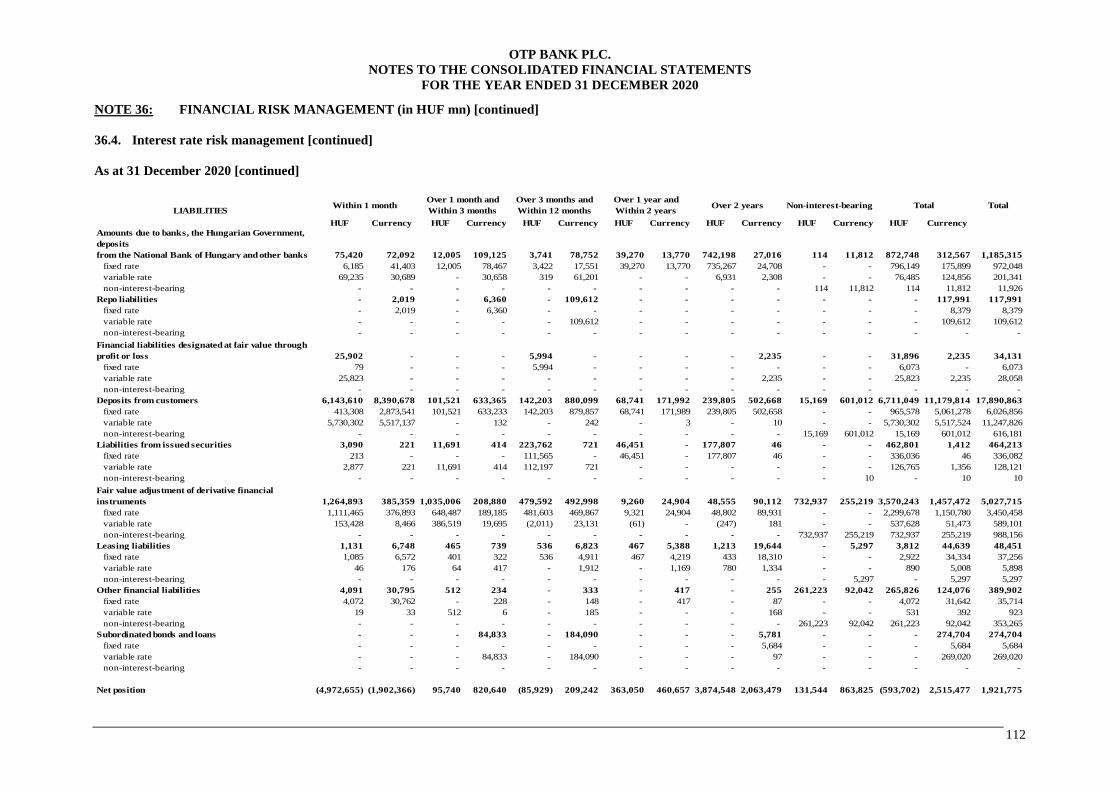
OTP BANK PLC.
NOTES TO THE CONSOLIDATED FINANCIAL STATEMENTS
FOR THE YEAR ENDED 31 DECEMBER 2020
112
NOTE 36: FINANCIAL RISK MANAGEMENT (in HUF mn) [continued]
36.4. Interest rate risk management [continued]
As at 31 December 2020 [continued]
Total
HUF Currency HUF Currency HUF Currency HUF Currency HUF Currency HUF Currency HUF Currency
75,420 72,092 12,005 109,125 3,741 78,752 39,270 13,770 742,198 27,016 114 11,812 872,748 312,567 1,185,315
fixed rate 6,185 41,403 12,005 78,467 3,422 17,551 39,270 13,770 735,267 24,708 - - 796,149 175,899 972,048
variable rate 69,235 30,689 - 30,658 319 61,201 - - 6,931 2,308 - - 76,485 124,856 201,341
non-interest-bearing - - - - - - - - - - 114 11,812 114 11,812 11,926
Repo liabilities - 2,019 - 6,360 - 109,612 - - - - - - - 117,991 117,991
fixed rate - 2,019 - 6,360 - - - - - - - - - 8,379 8,379
variable rate - - - - - 109,612 - - - - - - - 109,612 109,612
non-interest-bearing - - - - - - - - - - - - - - -
25,902 - - - 5,994 - - - - 2,235 - - 31,896 2,235 34,131
fixed rate 79 - - - 5,994 - - - - - - - 6,073 - 6,073
variable rate 25,823 - - - - - - - - 2,235 - - 25,823 2,235 28,058
non-interest-bearing - - - - - - - - - - - - - - -
6,143,610 8,390,678 101,521 633,365 142,203 880,099 68,741 171,992 239,805 502,668 15,169 601,012 6,711,049 11,179,814 17,890,863
fixed rate 413,308 2,873,541 101,521 633,233 142,203 879,857 68,741 171,989 239,805 502,658 - - 965,578 5,061,278 6,026,856
variable rate 5,730,302 5,517,137 - 132 - 242 - 3 - 10 - - 5,730,302 5,517,524 11,247,826
non-interest-bearing - - - - - - - - - - 15,169 601,012 15,169 601,012 616,181
3,090 221 11,691 414 223,762 721 46,451 - 177,807 46 - - 462,801 1,412 464,213
fixed rate 213 - - - 111,565 - 46,451 - 177,807 46 - - 336,036 46 336,082
variable rate 2,877 221 11,691 414 112,197 721 - - - - - - 126,765 1,356 128,121
non-interest-bearing - - - - - - - - - - - 10 - 10 10
1,264,893 385,359 1,035,006 208,880 479,592 492,998 9,260 24,904 48,555 90,112 732,937 255,219 3,570,243 1,457,472 5,027,715
fixed rate 1,111,465 376,893 648,487 189,185 481,603 469,867 9,321 24,904 48,802 89,931 - - 2,299,678 1,150,780 3,450,458
variable rate 153,428 8,466 386,519 19,695 (2,011) 23,131 (61) - (247) 181 - - 537,628 51,473 589,101
non-interest-bearing - - - - - - - - - - 732,937 255,219 732,937 255,219 988,156
1,131 6,748 465 739 536 6,823 467 5,388 1,213 19,644 - 5,297 3,812 44,639 48,451
fixed rate 1,085 6,572 401 322 536 4,911 467 4,219 433 18,310 - - 2,922 34,334 37,256
variable rate 46 176 64 417 - 1,912 - 1,169 780 1,334 - - 890 5,008 5,898
non-interest-bearing - - - - - - - - - - - 5,297 - 5,297 5,297
4,091 30,795 512 234 - 333 - 417 - 255 261,223 92,042 265,826 124,076 389,902
fixed rate 4,072 30,762 - 228 - 148 - 417 - 87 - - 4,072 31,642 35,714
variable rate 19 33 512 6 - 185 - - - 168 - - 531 392 923
non-interest-bearing - - - - - - - - - - 261,223 92,042 261,223 92,042 353,265
- - - 84,833 - 184,090 - - - 5,781 - - - 274,704 274,704
fixed rate - - - - - - - - - 5,684 - - - 5,684 5,684
variable rate - - - 84,833 - 184,090 - - - 97 - - - 269,020 269,020
non-interest-bearing - - - - - - - - - - - - - - -
Net position (4,972,655) (1,902,366) 95,740 820,640 (85,929) 209,242 363,050 460,657 3,874,548 2,063,479 131,544 863,825 (593,702) 2,515,477 1,921,775
Amounts due to banks, the Hungarian Government,
deposits
from the National Bank of Hungary and other banks
Financial liabilities designated at fair value through
profit or loss
Deposits from customers
Liabilities from issued securities
Over 1 year and
Within 2 yearsOver 2 years Non-interest-bearing
LIABILITIES
Leasing liabilities
Other financial liabilities
Subordinated bonds and loans
Within 1 monthOver 1 month and
Within 3 months
Over 3 months and
Within 12 months
Fair value adjustment of derivative financial
instruments
Total
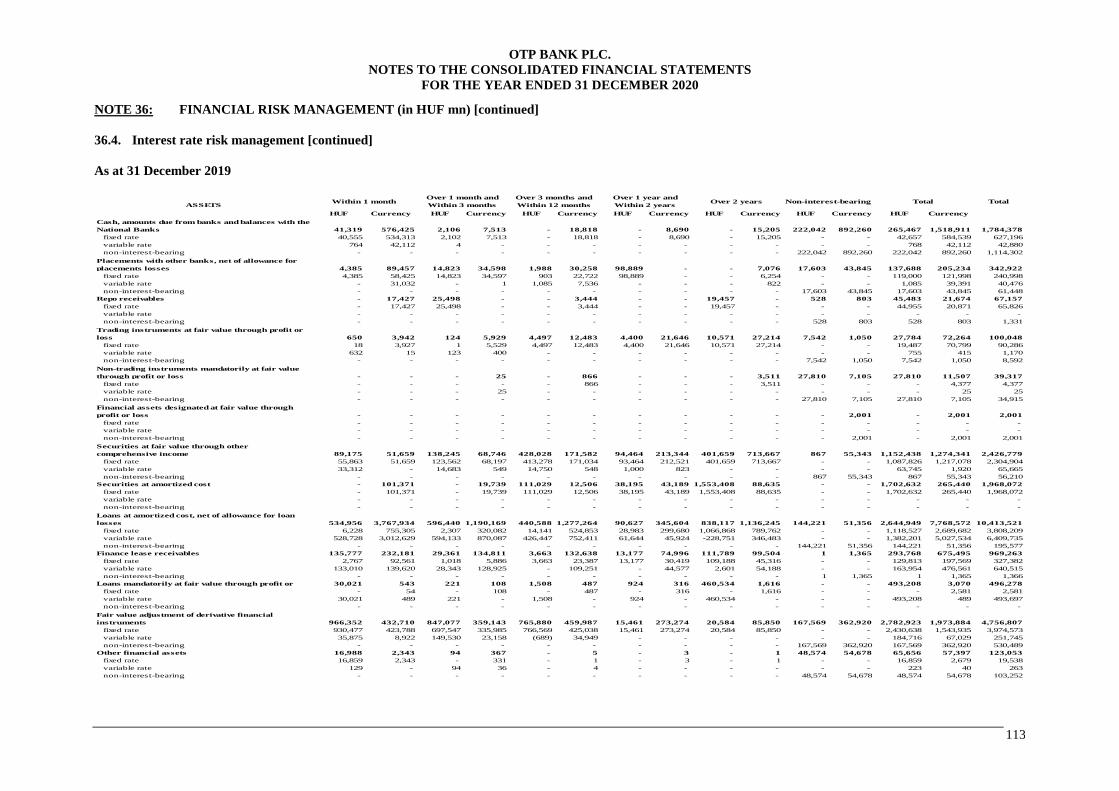
OTP BANK PLC.
NOTES TO THE CONSOLIDATED FINANCIAL STATEMENTS
FOR THE YEAR ENDED 31 DECEMBER 2020
113
NOTE 36: FINANCIAL RISK MANAGEMENT (in HUF mn) [continued]
36.4. Interest rate risk management [continued]
As at 31 December 2019
Total
HUF Currency HUF Currency HUF Currency HUF Currency HUF Currency HUF Currency HUF Currency
41,319 576,425 2,106 7,513 - 18,818 - 8,690 - 15,205 222,042 892,260 265,467 1,518,911 1,784,378
fixed rate 40,555 534,313 2,102 7,513 - 18,818 - 8,690 - 15,205 - - 42,657 584,539 627,196
variable rate 764 42,112 4 - - - - - - - - - 768 42,112 42,880
non-interest-bearing - - - - - - - - - - 222,042 892,260 222,042 892,260 1,114,302
4,385 89,457 14,823 34,598 1,988 30,258 98,889 - - 7,076 17,603 43,845 137,688 205,234 342,922
fixed rate 4,385 58,425 14,823 34,597 903 22,722 98,889 - - 6,254 - - 119,000 121,998 240,998
variable rate - 31,032 - 1 1,085 7,536 - - - 822 - - 1,085 39,391 40,476
non-interest-bearing - - - - - - - - - - 17,603 43,845 17,603 43,845 61,448
Repo receivables - 17,427 25,498 - - 3,444 - - 19,457 - 528 803 45,483 21,674 67,157
fixed rate - 17,427 25,498 - - 3,444 - - 19,457 - - - 44,955 20,871 65,826
variable rate - - - - - - - - - - - - - - -
non-interest-bearing - - - - - - - - - - 528 803 528 803 1,331
650 3,942 124 5,929 4,497 12,483 4,400 21,646 10,571 27,214 7,542 1,050 27,784 72,264 100,048
fixed rate 18 3,927 1 5,529 4,497 12,483 4,400 21,646 10,571 27,214 - - 19,487 70,799 90,286
variable rate 632 15 123 400 - - - - - - - - 755 415 1,170
non-interest-bearing - - - - - - - - - - 7,542 1,050 7,542 1,050 8,592
- - - 25 - 866 - - - 3,511 27,810 7,105 27,810 11,507 39,317
fixed rate - - - - - 866 - - - 3,511 - - - 4,377 4,377
variable rate - - - 25 - - - - - - - - - 25 25
non-interest-bearing - - - - - - - - - - 27,810 7,105 27,810 7,105 34,915
- - - - - - - - - - - 2,001 - 2,001 2,001
fixed rate - - - - - - - - - - - - - - -
variable rate - - - - - - - - - - - - - - -
non-interest-bearing - - - - - - - - - - - 2,001 - 2,001 2,001
89,175 51,659 138,245 68,746 428,028 171,582 94,464 213,344 401,659 713,667 867 55,343 1,152,438 1,274,341 2,426,779
fixed rate 55,863 51,659 123,562 68,197 413,278 171,034 93,464 212,521 401,659 713,667 - - 1,087,826 1,217,078 2,304,904
variable rate 33,312 - 14,683 549 14,750 548 1,000 823 - - - - 63,745 1,920 65,665
non-interest-bearing - - - - - - - - - - 867 55,343 867 55,343 56,210
- 101,371 - 19,739 111,029 12,506 38,195 43,189 1,553,408 88,635 - - 1,702,632 265,440 1,968,072
fixed rate - 101,371 - 19,739 111,029 12,506 38,195 43,189 1,553,408 88,635 - - 1,702,632 265,440 1,968,072
variable rate - - - - - - - - - - - - - - -
non-interest-bearing - - - - - - - - - - - - - - -
534,956 3,767,934 596,440 1,190,169 440,588 1,277,264 90,627 345,604 838,117 1,136,245 144,221 51,356 2,644,949 7,768,572 10,413,521
fixed rate 6,228 755,305 2,307 320,082 14,141 524,853 28,983 299,680 1,066,868 789,762 - - 1,118,527 2,689,682 3,808,209
variable rate 528,728 3,012,629 594,133 870,087 426,447 752,411 61,644 45,924 -228,751 346,483 - - 1,382,201 5,027,534 6,409,735
non-interest-bearing - - - - - - - - - - 144,221 51,356 144,221 51,356 195,577
Finance lease receivables 135,777 232,181 29,361 134,811 3,663 132,638 13,177 74,996 111,789 99,504 1 1,365 293,768 675,495 969,263
fixed rate 2,767 92,561 1,018 5,886 3,663 23,387 13,177 30,419 109,188 45,316 - - 129,813 197,569 327,382
variable rate 133,010 139,620 28,343 128,925 - 109,251 - 44,577 2,601 54,188 - - 163,954 476,561 640,515
non-interest-bearing - - - - - - - - - - 1 1,365 1 1,365 1,366
30,021 543 221 108 1,508 487 924 316 460,534 1,616 - - 493,208 3,070 496,278
fixed rate - 54 - 108 - 487 - 316 - 1,616 - - - 2,581 2,581
variable rate 30,021 489 221 - 1,508 - 924 - 460,534 - - - 493,208 489 493,697
non-interest-bearing - - - - - - - - - - - - - - -
966,352 432,710 847,077 359,143 765,880 459,987 15,461 273,274 20,584 85,850 167,569 362,920 2,782,923 1,973,884 4,756,807
fixed rate 930,477 423,788 697,547 335,985 766,569 425,038 15,461 273,274 20,584 85,850 - - 2,430,638 1,543,935 3,974,573
variable rate 35,875 8,922 149,530 23,158 (689) 34,949 - - - - - - 184,716 67,029 251,745
non-interest-bearing - - - - - - - - - - 167,569 362,920 167,569 362,920 530,489
16,988 2,343 94 367 - 5 - 3 - 1 48,574 54,678 65,656 57,397 123,053
fixed rate 16,859 2,343 - 331 - 1 - 3 - 1 - - 16,859 2,679 19,538
variable rate 129 - 94 36 - 4 - - - - - - 223 40 263
non-interest-bearing - - - - - - - - - - 48,574 54,678 48,574 54,678 103,252
Securities at amortized cost
Loans at amortized cost, net of allowance for loan
losses
Loans mandatorily at fair value through profit or
Fair value adjustment of derivative financial
instruments
Over 1 month and
Within 3 months
Over 3 months and
Within 12 months
Over 1 year and
Within 2 yearsOver 2 years Non-interest-bearing Total
ASSETSWithin 1 month
Cash, amounts due from banks and balances with the
National Banks
Placements with other banks, net of allowance for
placements losses
Trading instruments at fair value through profit or
loss
Non-trading instruments mandatorily at fair value
through profit or loss
Other financial assets
Financial assets designated at fair value through
profit or loss
Securities at fair value through other
comprehensive income
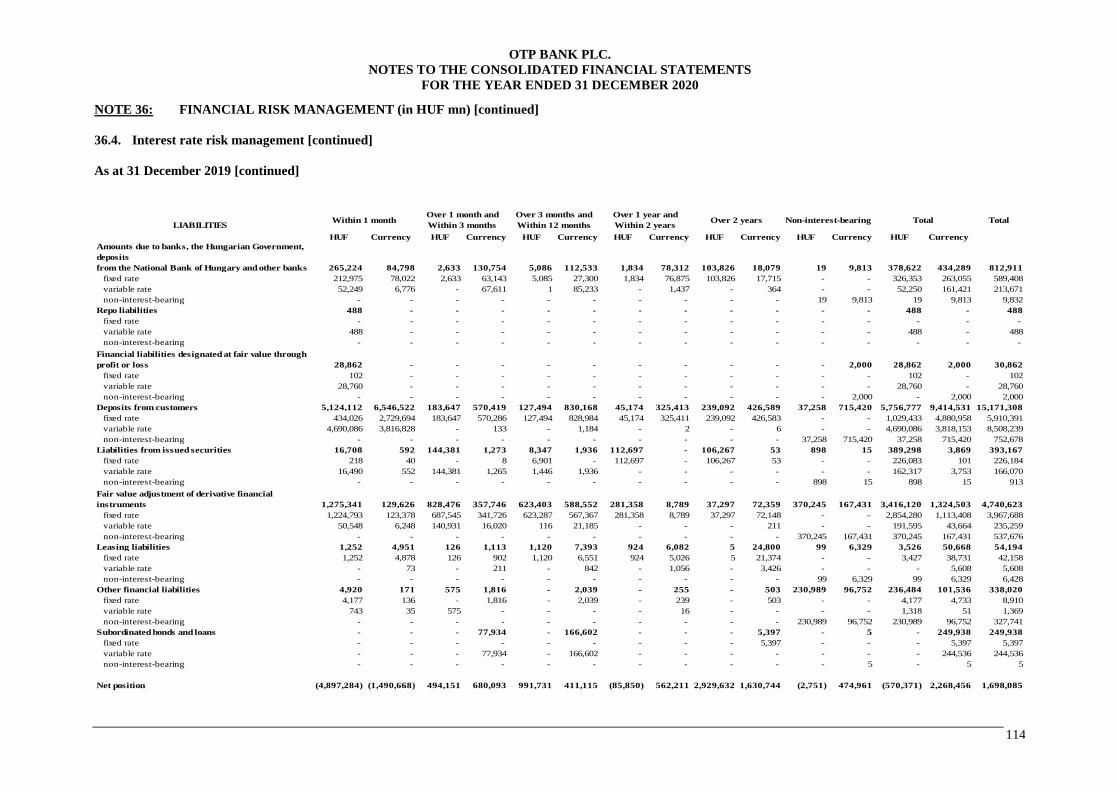
OTP BANK PLC.
NOTES TO THE CONSOLIDATED FINANCIAL STATEMENTS
FOR THE YEAR ENDED 31 DECEMBER 2020
114
NOTE 36: FINANCIAL RISK MANAGEMENT (in HUF mn) [continued]
36.4. Interest rate risk management [continued]
As at 31 December 2019 [continued]
Total
HUF Currency HUF Currency HUF Currency HUF Currency HUF Currency HUF Currency HUF Currency
265,224 84,798 2,633 130,754 5,086 112,533 1,834 78,312 103,826 18,079 19 9,813 378,622 434,289 812,911
fixed rate 212,975 78,022 2,633 63,143 5,085 27,300 1,834 76,875 103,826 17,715 - - 326,353 263,055 589,408
variable rate 52,249 6,776 - 67,611 1 85,233 - 1,437 - 364 - - 52,250 161,421 213,671
non-interest-bearing - - - - - - - - - - 19 9,813 19 9,813 9,832
Repo liabilities 488 - - - - - - - - - - - 488 - 488
fixed rate - - - - - - - - - - - - - - -
variable rate 488 - - - - - - - - - - - 488 - 488
non-interest-bearing - - - - - - - - - - - - - - -
28,862 - - - - - - - - - - 2,000 28,862 2,000 30,862
fixed rate 102 - - - - - - - - - - - 102 - 102
variable rate 28,760 - - - - - - - - - - - 28,760 - 28,760
non-interest-bearing - - - - - - - - - - - 2,000 - 2,000 2,000
5,124,112 6,546,522 183,647 570,419 127,494 830,168 45,174 325,413 239,092 426,589 37,258 715,420 5,756,777 9,414,531 15,171,308
fixed rate 434,026 2,729,694 183,647 570,286 127,494 828,984 45,174 325,411 239,092 426,583 - - 1,029,433 4,880,958 5,910,391
variable rate 4,690,086 3,816,828 - 133 - 1,184 - 2 - 6 - - 4,690,086 3,818,153 8,508,239
non-interest-bearing - - - - - - - - - - 37,258 715,420 37,258 715,420 752,678
16,708 592 144,381 1,273 8,347 1,936 112,697 - 106,267 53 898 15 389,298 3,869 393,167
fixed rate 218 40 - 8 6,901 - 112,697 - 106,267 53 - - 226,083 101 226,184
variable rate 16,490 552 144,381 1,265 1,446 1,936 - - - - - - 162,317 3,753 166,070
non-interest-bearing - - - - - - - - - - 898 15 898 15 913
1,275,341 129,626 828,476 357,746 623,403 588,552 281,358 8,789 37,297 72,359 370,245 167,431 3,416,120 1,324,503 4,740,623
fixed rate 1,224,793 123,378 687,545 341,726 623,287 567,367 281,358 8,789 37,297 72,148 - - 2,854,280 1,113,408 3,967,688
variable rate 50,548 6,248 140,931 16,020 116 21,185 - - - 211 - - 191,595 43,664 235,259
non-interest-bearing - - - - - - - - - - 370,245 167,431 370,245 167,431 537,676
1,252 4,951 126 1,113 1,120 7,393 924 6,082 5 24,800 99 6,329 3,526 50,668 54,194
fixed rate 1,252 4,878 126 902 1,120 6,551 924 5,026 5 21,374 - - 3,427 38,731 42,158
variable rate - 73 - 211 - 842 - 1,056 - 3,426 - - - 5,608 5,608
non-interest-bearing - - - - - - - - - - 99 6,329 99 6,329 6,428
4,920 171 575 1,816 - 2,039 - 255 - 503 230,989 96,752 236,484 101,536 338,020
fixed rate 4,177 136 - 1,816 - 2,039 - 239 - 503 - - 4,177 4,733 8,910
variable rate 743 35 575 - - - - 16 - - - - 1,318 51 1,369
non-interest-bearing - - - - - - - - - - 230,989 96,752 230,989 96,752 327,741
- - - 77,934 - 166,602 - - - 5,397 - 5 - 249,938 249,938
fixed rate - - - - - - - - - 5,397 - - - 5,397 5,397
variable rate - - - 77,934 - 166,602 - - - - - - - 244,536 244,536
non-interest-bearing - - - - - - - - - - - 5 - 5 5
Net position (4,897,284) (1,490,668) 494,151 680,093 991,731 411,115 (85,850) 562,211 2,929,632 1,630,744 (2,751) 474,961 (570,371) 2,268,456 1,698,085
Over 2 years Non-interest-bearing Total
Amounts due to banks, the Hungarian Government,
deposits
from the National Bank of Hungary and other banks
Financial liabilities designated at fair value through
profit or loss
Deposits from customers
Liabilities from issued securities
Fair value adjustment of derivative financial
instruments
Leasing liabilities
Other financial liabilities
Subordinated bonds and loans
LIABILITIES Within 1 month
Over 1 month and
Within 3 months
Over 3 months and
Within 12 months
Over 1 year and
Within 2 years

OTP BANK PLC.
NOTES TO THE CONSOLIDATED FINANCIAL STATEMENTS
FOR THE YEAR ENDED 31 DECEMBER 2020
115
NOTE 36: FINANCIAL RISK MANAGEMENT (in HUF mn) [continued]
36.5. Market risk
The Group takes on exposure to market risks. Market risks arise from open positions in interest rate, currency
and equity products, all of which are exposed to general and specific market movements. The Group applies a
‘Value-at-Risk’ (VaR) methodology to estimate the market risk of positions held and the maximum losses
expected, based upon a number of assumptions for various changes in market conditions. The Management
Board sets limits on the value of risk that may be accepted, which is monitored on a daily basis. (Analysis of
liquidity risk, foreign currency risk and interest rate risk is detailed in Notes 36.2., 36.3. and 36.4., respectively.)
36.5.1. Market Risk sensitivity analysis
The VaR risk measure estimates the potential loss in pre-tax profit over a given holding period for a specified
confidence level.
The VaR methodology is a statistically defined, probability-based approach that takes into account market
volatilities as well as risk diversification by recognizing offsetting positions and correlations between products
and markets. Risks can be measured consistently across all markets and products, and risk measures can be
aggregated to arrive at a single risk number. The one-day 99% VaR number used by the Group reflects the 99%
probability that the daily loss will not exceed the reported VaR.
VaR methodologies are employed to calculate daily risk numbers include the historical and variance-covariance
approach. The diversification effect has not been validated among the various market risk types when capital
calculation happens.
In addition to these two methodologies, Monte Carlo simulations are applied to the various portfolios on a
monthly basis to determine potential future exposure.
The VaR of the trading portfolio can be summarized as follows (in HUF mn):
Historical VaR (99%, one-day) by risk type Average
2020 2019
Foreign exchange 1,530 479
Interest rate 146 172
Equity instruments 141 21
Diversification - -
Total VaR exposure 1,817 672
The table above shows the VaR figures by asset classes. Since processes driving the value of the major asset
classes are not independent (for example the depreciation of HUF against the EUR mostly coincide with the
increase of the yields of Hungarian Government Bonds), a diversification impact emerges, so the overall VaR is
less than the sum of the VaR of each individual asset class.
While VaR captures the Group’s daily exposure to currency and interest rate risk, sensitivity analysis evaluates
the impact of a reasonably possible change in interest or foreign currency rates over a year. The longer time
frame of sensitivity analysis complements VaR and helps the Group to assess its market risk exposures. Details
of sensitivity analysis for foreign currency risk are set out in Note 36.5.2., for interest rate risk in Note 36.5.3.,
and for equity price sensitivity analysis in Note 36.5.4.
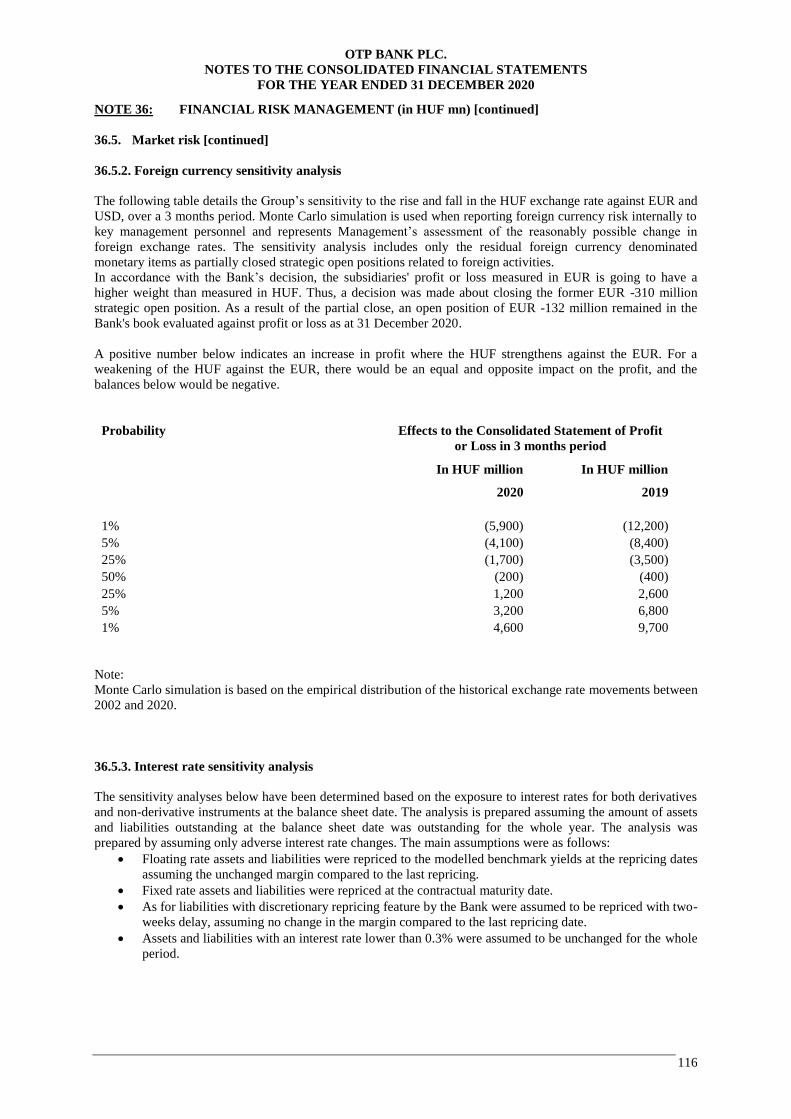
OTP BANK PLC.
NOTES TO THE CONSOLIDATED FINANCIAL STATEMENTS
FOR THE YEAR ENDED 31 DECEMBER 2020
116
NOTE 36: FINANCIAL RISK MANAGEMENT (in HUF mn) [continued]
36.5. Market risk [continued]
36.5.2. Foreign currency sensitivity analysis
The following table details the Group’s sensitivity to the rise and fall in the HUF exchange rate against EUR and
USD, over a 3 months period. Monte Carlo simulation is used when reporting foreign currency risk internally to
key management personnel and represents Management’s assessment of the reasonably possible change in
foreign exchange rates. The sensitivity analysis includes only the residual foreign currency denominated
monetary items as partially closed strategic open positions related to foreign activities.
In accordance with the Bank’s decision, the subsidiaries' profit or loss measured in EUR is going to have a
higher weight than measured in HUF. Thus, a decision was made about closing the former EUR -310 million
strategic open position. As a result of the partial close, an open position of EUR -132 million remained in the
Bank's book evaluated against profit or loss as at 31 December 2020.
A positive number below indicates an increase in profit where the HUF strengthens against the EUR. For a
weakening of the HUF against the EUR, there would be an equal and opposite impact on the profit, and the
balances below would be negative.
Probability Effects to the Consolidated Statement of Profit
or Loss in 3 months period
In HUF million In HUF million
2020 2019
1% (5,900) (12,200)
5% (4,100) (8,400)
25% (1,700) (3,500)
50% (200) (400)
25% 1,200 2,600
5% 3,200 6,800
1% 4,600 9,700
Note:
Monte Carlo simulation is based on the empirical distribution of the historical exchange rate movements between
2002 and 2020.
36.5.3. Interest rate sensitivity analysis
The sensitivity analyses below have been determined based on the exposure to interest rates for both derivatives
and non-derivative instruments at the balance sheet date. The analysis is prepared assuming the amount of assets
and liabilities outstanding at the balance sheet date was outstanding for the whole year. The analysis was
prepared by assuming only adverse interest rate changes. The main assumptions were as follows:
Floating rate assets and liabilities were repriced to the modelled benchmark yields at the repricing dates
assuming the unchanged margin compared to the last repricing.
Fixed rate assets and liabilities were repriced at the contractual maturity date.
As for liabilities with discretionary repricing feature by the Bank were assumed to be repriced with two-
weeks delay, assuming no change in the margin compared to the last repricing date.
Assets and liabilities with an interest rate lower than 0.3% were assumed to be unchanged for the whole
period.
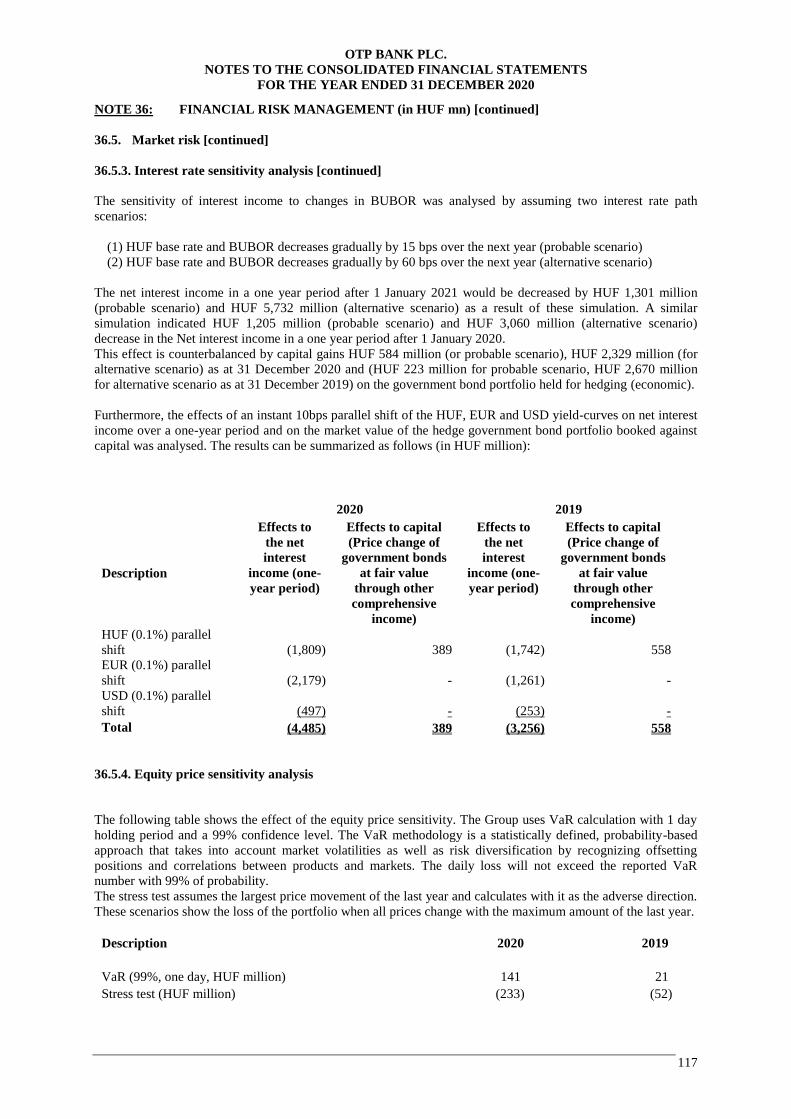
OTP BANK PLC.
NOTES TO THE CONSOLIDATED FINANCIAL STATEMENTS
FOR THE YEAR ENDED 31 DECEMBER 2020
117
NOTE 36: FINANCIAL RISK MANAGEMENT (in HUF mn) [continued]
36.5. Market risk [continued]
36.5.3. Interest rate sensitivity analysis [continued]
The sensitivity of interest income to changes in BUBOR was analysed by assuming two interest rate path
scenarios:
(1) HUF base rate and BUBOR decreases gradually by 15 bps over the next year (probable scenario)
(2) HUF base rate and BUBOR decreases gradually by 60 bps over the next year (alternative scenario)
The net interest income in a one year period after 1 January 2021 would be decreased by HUF 1,301 million
(probable scenario) and HUF 5,732 million (alternative scenario) as a result of these simulation. A similar
simulation indicated HUF 1,205 million (probable scenario) and HUF 3,060 million (alternative scenario)
decrease in the Net interest income in a one year period after 1 January 2020.
This effect is counterbalanced by capital gains HUF 584 million (or probable scenario), HUF 2,329 million (for
alternative scenario) as at 31 December 2020 and (HUF 223 million for probable scenario, HUF 2,670 million
for alternative scenario as at 31 December 2019) on the government bond portfolio held for hedging (economic).
Furthermore, the effects of an instant 10bps parallel shift of the HUF, EUR and USD yield-curves on net interest
income over a one-year period and on the market value of the hedge government bond portfolio booked against
capital was analysed. The results can be summarized as follows (in HUF million):
2020 2019
Description
Effects to
the net
interest
income (one-
year period)
Effects to capital
(Price change of
government bonds
at fair value
through other
comprehensive
income)
Effects to
the net
interest
income (one-
year period)
Effects to capital
(Price change of
government bonds
at fair value
through other
comprehensive
income)
HUF (0.1%) parallel
shift (1,809) 389 (1,742) 558
EUR (0.1%) parallel
shift (2,179) - (1,261) -
USD (0.1%) parallel
shift (497) - (253) -
Total (4,485) 389 (3,256) 558
36.5.4. Equity price sensitivity analysis
The following table shows the effect of the equity price sensitivity. The Group uses VaR calculation with 1 day
holding period and a 99% confidence level. The VaR methodology is a statistically defined, probability-based
approach that takes into account market volatilities as well as risk diversification by recognizing offsetting
positions and correlations between products and markets. The daily loss will not exceed the reported VaR
number with 99% of probability.
The stress test assumes the largest price movement of the last year and calculates with it as the adverse direction.
These scenarios show the loss of the portfolio when all prices change with the maximum amount of the last year.
Description 2020 2019
VaR (99%, one day, HUF million) 141 21
Stress test (HUF million) (233) (52)
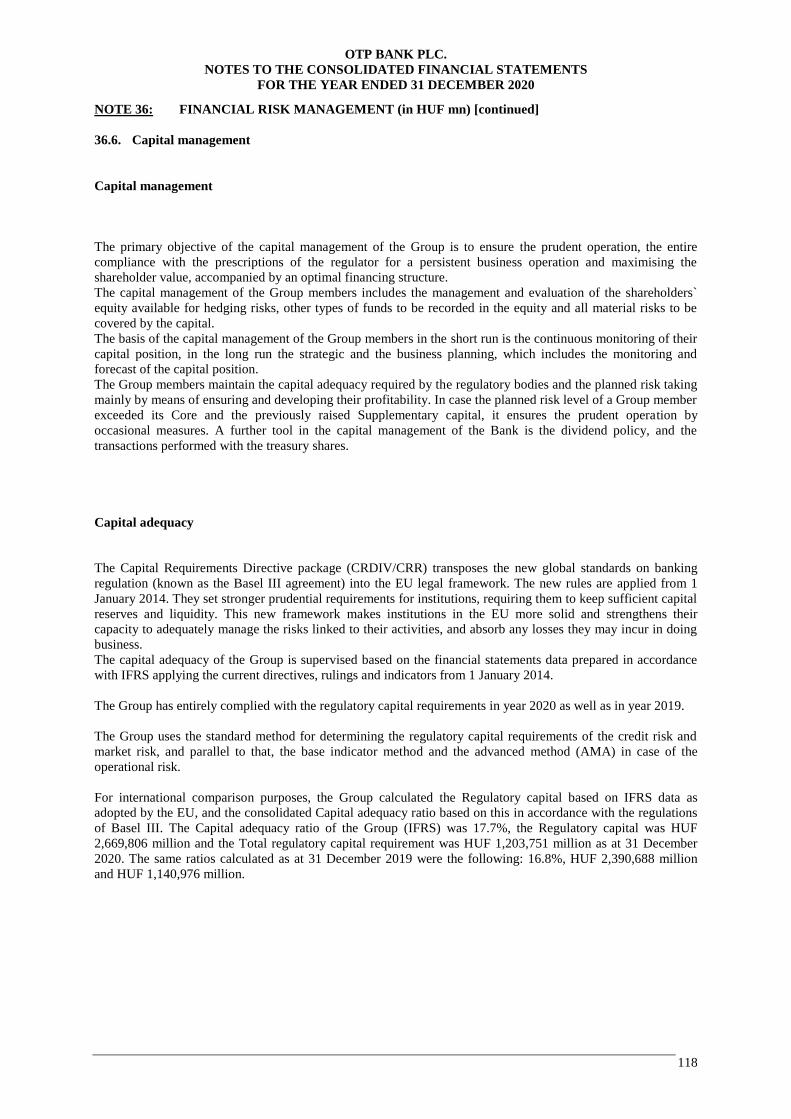
OTP BANK PLC.
NOTES TO THE CONSOLIDATED FINANCIAL STATEMENTS
FOR THE YEAR ENDED 31 DECEMBER 2020
118
NOTE 36: FINANCIAL RISK MANAGEMENT (in HUF mn) [continued]
36.6. Capital management
Capital management
The primary objective of the capital management of the Group is to ensure the prudent operation, the entire
compliance with the prescriptions of the regulator for a persistent business operation and maximising the
shareholder value, accompanied by an optimal financing structure.
The capital management of the Group members includes the management and evaluation of the shareholders`
equity available for hedging risks, other types of funds to be recorded in the equity and all material risks to be
covered by the capital.
The basis of the capital management of the Group members in the short run is the continuous monitoring of their
capital position, in the long run the strategic and the business planning, which includes the monitoring and
forecast of the capital position.
The Group members maintain the capital adequacy required by the regulatory bodies and the planned risk taking
mainly by means of ensuring and developing their profitability. In case the planned risk level of a Group member
exceeded its Core and the previously raised Supplementary capital, it ensures the prudent operation by
occasional measures. A further tool in the capital management of the Bank is the dividend policy, and the
transactions performed with the treasury shares.
Capital adequacy
The Capital Requirements Directive package (CRDIV/CRR) transposes the new global standards on banking
regulation (known as the Basel III agreement) into the EU legal framework. The new rules are applied from 1
January 2014. They set stronger prudential requirements for institutions, requiring them to keep sufficient capital
reserves and liquidity. This new framework makes institutions in the EU more solid and strengthens their
capacity to adequately manage the risks linked to their activities, and absorb any losses they may incur in doing
business.
The capital adequacy of the Group is supervised based on the financial statements data prepared in accordance
with IFRS applying the current directives, rulings and indicators from 1 January 2014.
The Group has entirely complied with the regulatory capital requirements in year 2020 as well as in year 2019.
The Group uses the standard method for determining the regulatory capital requirements of the credit risk and
market risk, and parallel to that, the base indicator method and the advanced method (AMA) in case of the
operational risk.
For international comparison purposes, the Group calculated the Regulatory capital based on IFRS data as
adopted by the EU, and the consolidated Capital adequacy ratio based on this in accordance with the regulations
of Basel III. The Capital adequacy ratio of the Group (IFRS) was 17.7%, the Regulatory capital was HUF
2,669,806 million and the Total regulatory capital requirement was HUF 1,203,751 million as at 31 December
2020. The same ratios calculated as at 31 December 2019 were the following: 16.8%, HUF 2,390,688 million
and HUF 1,140,976 million.
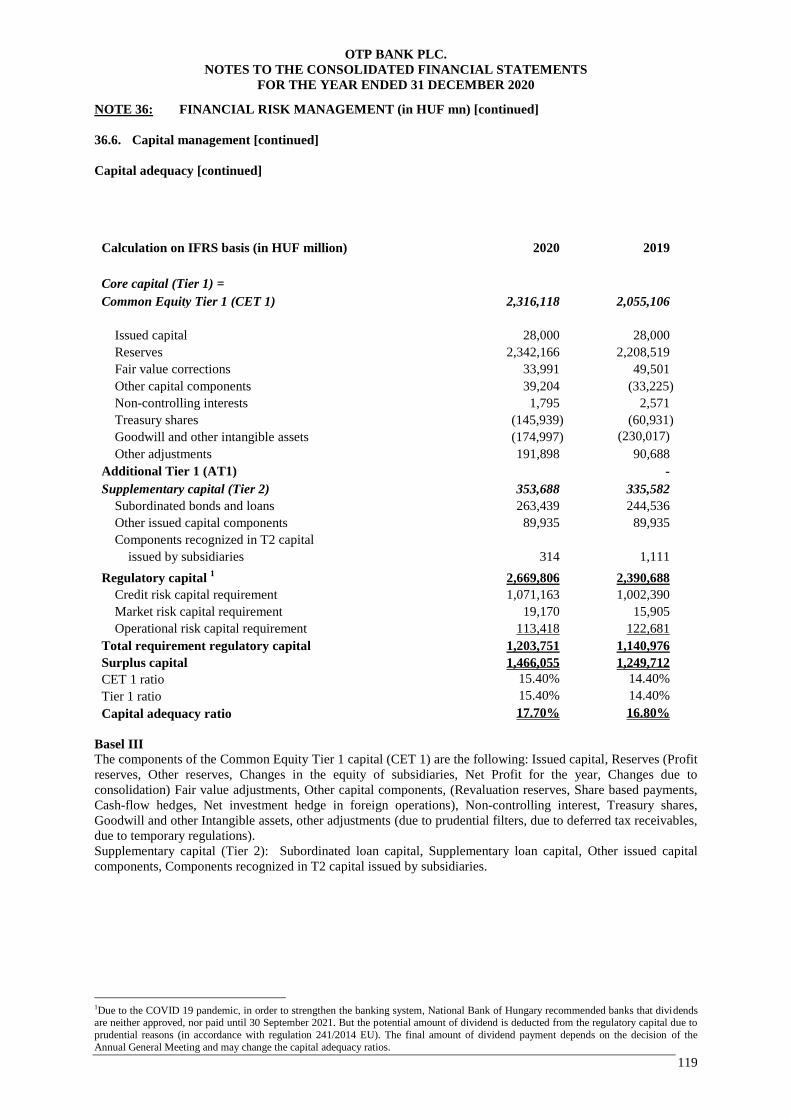
OTP BANK PLC.
NOTES TO THE CONSOLIDATED FINANCIAL STATEMENTS
FOR THE YEAR ENDED 31 DECEMBER 2020
119
NOTE 36: FINANCIAL RISK MANAGEMENT (in HUF mn) [continued]
36.6. Capital management [continued]
Capital adequacy [continued]
Calculation on IFRS basis (in HUF million) 2020 2019
Core capital (Tier 1) =
2,316,118 2,055,106 Common Equity Tier 1 (CET 1)
Issued capital 28,000 28,000
Reserves 2,342,166 2,208,519
Fair value corrections 33,991 49,501
Other capital components 39,204 (33,225)
Non-controlling interests 1,795 2,571
Treasury shares (145,939) (60,931)
Goodwill and other intangible assets (174,997) (230,017)
Other adjustments 191,898 90,688
Additional Tier 1 (AT1)
-
Supplementary capital (Tier 2) 353,688 335,582
Subordinated bonds and loans 263,439 244,536
Other issued capital components 89,935 89,935
Components recognized in T2 capital
issued by subsidiaries 314 1,111
Regulatory capital 1 2,669,806 2,390,688
Credit risk capital requirement 1,071,163 1,002,390
Market risk capital requirement 19,170 15,905
Operational risk capital requirement 113,418 122,681
Total requirement regulatory capital 1,203,751 1,140,976
Surplus capital 1,466,055 1,249,712
CET 1 ratio 15.40% 14.40%
Tier 1 ratio 15.40% 14.40%
Capital adequacy ratio 17.70% 16.80%
Basel III
The components of the Common Equity Tier 1 capital (CET 1) are the following: Issued capital, Reserves (Profit
reserves, Other reserves, Changes in the equity of subsidiaries, Net Profit for the year, Changes due to
consolidation) Fair value adjustments, Other capital components, (Revaluation reserves, Share based payments,
Cash-flow hedges, Net investment hedge in foreign operations), Non-controlling interest, Treasury shares,
Goodwill and other Intangible assets, other adjustments (due to prudential filters, due to deferred tax receivables,
due to temporary regulations).
Supplementary capital (Tier 2): Subordinated loan capital, Supplementary loan capital, Other issued capital
components, Components recognized in T2 capital issued by subsidiaries.
1Due to the COVID 19 pandemic, in order to strengthen the banking system, National Bank of Hungary recommended banks that dividends are neither approved, nor paid until 30 September 2021. But the potential amount of dividend is deducted from the regulatory capital due to
prudential reasons (in accordance with regulation 241/2014 EU). The final amount of dividend payment depends on the decision of the
Annual General Meeting and may change the capital adequacy ratios.
OTP BANK PLC.
NOTES TO THE CONSOLIDATED FINANCIAL STATEMENTS
FOR THE YEAR ENDED 31 DECEMBER 2020
120
NOTE 37: RECLASSIFICATION AND TRANSFER OF FINANCIAL INSTRUMENTS
(in HUF mn)
Reclassification from securities held for trading to securities at fair value through other comprehensive income:
As at 31 December 2020
Date of
reclassification
Reason for
reclassification
Type of
securities
Nominal
value at
reclassification
Fair value
at the date of
reclassification
EIR at the
date of
reclassification
Interest
income
1 September
2018
Change in
business model
Retail
Hungarian
government
bonds 1,069 1,087 2%-3% 28
During the year 2018, securities issued by the Hungarian Government with the nominal value of HUF 66,506
million were transferred from the trading portfolio to the securities at fair value through other comprehensive
income of which HUF 1,087 million remaining amount was presented as at 31 December 2020. The Bank has
previously held retail government bonds in the portfolio at fair value through other comprehensive income.
During 2018 the Bank changed the business model of the retail government bonds to manage all on the basis of a
single business model aimed at collecting the future contractual cash flows and/or selling them.
In 2018, the terms and conditions of sale of retail government bonds and the pricing environment have changed
significantly, as a result of which the Bank is no longer able to maintain its sole trading intent with these
securities that the Bank applied earlier. Furthermore there is an option-agreement between the Bank and the
Government Debt Management Agency (“GDMA”) that GDMA will buy back this portfolio therefore it has
been reclassified.
Financial assets transferred but not derecognized
Transferred
assets
Associated
liabilities
Transferred
assets
Associated
liabilities
Carrying amount Carrying amount
2020 2019
Financial assets at fair value
through other comprehensive income
Debt securities 48,176 44,287 40,912 40,253
Total 48,176 44,287 40,912 40,253
Financial assets at amortized cost
Debt securities 136,316 119,789 - -
Loans and advances 1,171 - 5,263 2,555
Total 137,487 119,789 5,263 2,555
Total 185,663 164,076 46,175 42,808
As at 31 December 2020 and 2019, the Group had obligation from repurchase agreements (repo liability) of
HUF 109,612 million and HUF 111 million respectively. Securities sold temporarily under repurchase
agreements will continue to be recognized in the Consolidated Statement of Financial Position of the Group in
the appropriate securities category. The related liability is measured at amortized cost in the Consolidated
Statement of Financial Position as “Amounts due to the National Governments, to the National Banks and other
banks and repo liabilities”.
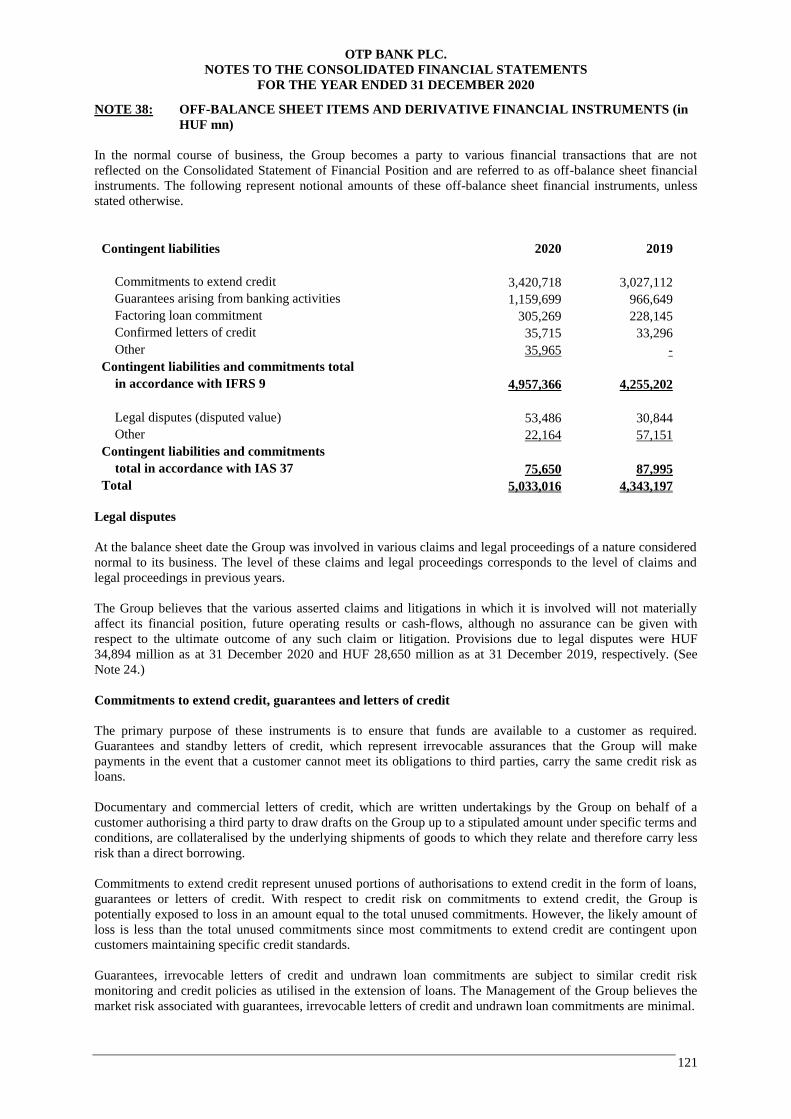
OTP BANK PLC.
NOTES TO THE CONSOLIDATED FINANCIAL STATEMENTS
FOR THE YEAR ENDED 31 DECEMBER 2020
121
NOTE 38: OFF-BALANCE SHEET ITEMS AND DERIVATIVE FINANCIAL INSTRUMENTS (in
HUF mn)
In the normal course of business, the Group becomes a party to various financial transactions that are not
reflected on the Consolidated Statement of Financial Position and are referred to as off-balance sheet financial
instruments. The following represent notional amounts of these off-balance sheet financial instruments, unless
stated otherwise.
Contingent liabilities 2020 2019
Commitments to extend credit 3,420,718 3,027,112
Guarantees arising from banking activities 1,159,699 966,649
Factoring loan commitment 305,269 228,145
Confirmed letters of credit 35,715 33,296
Other 35,965 -
Contingent liabilities and commitments total
in accordance with IFRS 9 4,957,366 4,255,202
Legal disputes (disputed value) 53,486 30,844
Other 22,164 57,151
Contingent liabilities and commitments
total in accordance with IAS 37 75,650 87,995
Total 5,033,016 4,343,197
Legal disputes
At the balance sheet date the Group was involved in various claims and legal proceedings of a nature considered
normal to its business. The level of these claims and legal proceedings corresponds to the level of claims and
legal proceedings in previous years.
The Group believes that the various asserted claims and litigations in which it is involved will not materially
affect its financial position, future operating results or cash-flows, although no assurance can be given with
respect to the ultimate outcome of any such claim or litigation. Provisions due to legal disputes were HUF
34,894 million as at 31 December 2020 and HUF 28,650 million as at 31 December 2019, respectively. (See
Note 24.)
Commitments to extend credit, guarantees and letters of credit
The primary purpose of these instruments is to ensure that funds are available to a customer as required.
Guarantees and standby letters of credit, which represent irrevocable assurances that the Group will make
payments in the event that a customer cannot meet its obligations to third parties, carry the same credit risk as
loans.
Documentary and commercial letters of credit, which are written undertakings by the Group on behalf of a
customer authorising a third party to draw drafts on the Group up to a stipulated amount under specific terms and
conditions, are collateralised by the underlying shipments of goods to which they relate and therefore carry less
risk than a direct borrowing.
Commitments to extend credit represent unused portions of authorisations to extend credit in the form of loans,
guarantees or letters of credit. With respect to credit risk on commitments to extend credit, the Group is
potentially exposed to loss in an amount equal to the total unused commitments. However, the likely amount of
loss is less than the total unused commitments since most commitments to extend credit are contingent upon
customers maintaining specific credit standards.
Guarantees, irrevocable letters of credit and undrawn loan commitments are subject to similar credit risk
monitoring and credit policies as utilised in the extension of loans. The Management of the Group believes the
market risk associated with guarantees, irrevocable letters of credit and undrawn loan commitments are minimal.
OTP BANK PLC.
NOTES TO THE CONSOLIDATED FINANCIAL STATEMENTS
FOR THE YEAR ENDED 31 DECEMBER 2020
122
NOTE 38: OFF-BALANCE SHEET ITEMS AND DERIVATIVE FINANCIAL INSTRUMENTS (in
HUF mn) [continued]
Guarantees, payment undertakings arising from banking activities
Payment undertaking is a promise by the Group to assume responsibility for the debt obligation of a borrower if
that borrower defaults until a determined amount, until a determined date, in case of fulfilling conditions,
without checking the underlying transactions. The guarantee’s liability is joint and primary with the principal, in
case of payment undertaking, while the Group assumes the obligation derived from guarantee independently by
the conditions established by the Group. A guarantee is most typically required when the ability of the primary
obligor or principal to perform its obligations under a contract is in question, or when there is some public or
private interest which requires protection from the consequences of the principal's default or delinquency.
A contract of guarantee is subject to the statute of frauds (or its equivalent local laws) and is only enforceable if
recorded in writing and signed by the surety and the principal.
If the surety is required to pay or perform due to the principal's failure to do so, the law will usually give the
surety a right of subrogation, allowing the surety to use the surety's contractual rights to recover the cost of
making payment or performing on the principal's behalf, even in the absence of an express agreement to that
effect between the surety and the principal.
Derivatives
The Group maintains strict control limits on net open derivative positions, i.e. the difference between purchase
and sale contracts, by both amount and term. At any time the amount subject to credit risk is limited to the
current fair value of instruments that are favourable to the Group (i.e. assets), which in relation to derivatives is
only a small fraction of the contract or notional values used to express the volume of instruments outstanding.
This credit risk exposure is managed as part of the overall lending limits with customers, together with potential
exposures from market movements. Collateral or other security is not usually obtained for credit risk exposures
on these instruments, except for trading with clients, where the Group in most of the cases requires margin
deposits.

OTP BANK PLC.
NOTES TO THE CONSOLIDATED FINANCIAL STATEMENTS
FOR THE YEAR ENDED 31 DECEMBER 2020
123
NOTE 39: SHARE-BASED PAYMENTS AND EMPLOYEE BENEFITS (in HUF mn)
Previously approved option program required a modification thanks to the introduction of the Bank Group Policy
on Payments accepted in resolution of Annual General Meeting regarding to the amendment of CRD III.
Directives and Act on Credit Institutions and Financial Enterprises.
Key management personnel affected by the Bank Group Policy receive compensation based on performance
assessment generally in the form of cash bonus and equity shares in a ratio of 50-50%. Assignment is based on
OTP shares, furthermore performance based payments are deferred in accordance with the rules of Credit
Institutions Act.
The Bank ensures the share-based payment part for the management personnel of the Group members.
During implementation of the Remuneration Policy of the Group appeared that in case of certain foreign
subsidiaries it is not possible to ensure the originally determined share-based payment because of legal reasons –
incompatible with relevant EU-directives –, therefore a decision was made to cancel the share-based payment in
affected countries, and virtual share based payment – cash payment fixed to share price - was made from 2017.
The quantity of usable shares for individuals calculated for settlement of share-based payment shall be
determined as the ratio of the amount of share-based payment and share price determined by Supervisory Board1
The value of the share-based payment at the performance assessment is determined within 10 days by
Supervisory Board based on the average of the three previous trade day’s middle rate of OTP Bank’s equity
shares fixed on the Budapest Stock Exchange.
At the same time the conditions of discounted share-based payment are determined, and share-based payment
shall contain maximum HUF 2,000 discount at the assessment date, and earnings for the shares at the payment
date is maximum HUF 4,000. Employee benefits are all forms of consideration given by an entity in exchange
for service rendered by employees or for the termination of employment. IAS 19 Employee Benefits shall be
applied in accounting for all employee benefits, except those to which IFRS 2 Share-based Payment applies.
Short-term employee benefits are employee benefits (other than termination benefits) that are expected to be
settled wholly before twelve months after the end of the annual reporting period in which the employees render
the related service. Post-employment benefits are employee benefits (other than termination and short-term
employee benefits) that are payable after the completion of employment. Post-employment benefit plans are
formal or informal arrangements under which an entity provides post-employment benefits for one or more
employees. Post-employment benefit plans are classified as either defined contribution plans or defined benefit
plans, depending on the economic substance of the plan as derived from its principal terms and conditions.
Termination benefits are employee benefits provided in exchange for the termination of an employee’s
employment as a result of either: an entity’s decision to terminate an employee’s employment before the normal
retirement date or an employee’s decision to accept an offer of benefits in exchange for the termination of
employment. Other long-term employee benefits are all employee benefits other than short-term employee
benefits, postemployment benefits and termination benefits.
1 Until the end of 2014 Board of Directors

OTP BANK PLC.
NOTES TO THE CONSOLIDATED FINANCIAL STATEMENTS
FOR THE YEAR ENDED 31 DECEMBER 2020
124
NOTE 39: SHARE-BASED PAYMENTS AND EMPLOYEE BENEFITS (in HUF mn) [continued]
The parameters for the share-based payment relating to years from 2015 by the Supervisory Board for periods of each year as follows:
Year
Share purchasing at a
discounted price
Price of remuneration
exchanged to share
Share purchasing at a
discounted price
Price of remuneration
exchanged to share
Share purchasing at a
discounted price
Price of remuneration
exchanged to share Exercise price
Maximum earnings
Exercise price
Maximum earnings
Exercise price
Maximum earnings
HUF per share
for the year 2015 for the year 2016 for the year 2017
2016 4,892 2,500 6,892 - - - - - -
2017 4,892 3,000 6,892 7,200 2,500 9,200 - - -
2018 4,892 3,000 6,892 7,200 3,000 9,200 8,064 3,000 10,064 2019 4,892 3,000 6,892 7,200 3,500 9,200 8,064 3,500 10,064
2020 - - - 7,200 4,000 9,200 8,064 4,000 10,064
2021 - - - - - - 8,064 4,000 10,064 2022 - - - - - - 8,064 4,000 10,064
Year Share purchasing at a discounted price Price of remuneration
exchanged to share
Share purchasing at a discounted price Price of remuneration
exchanged to share
Exercise price
Maximum earnings Exercise price
Maximum earnings
HUF per share
for the year 2018 for the year 2019
2019 10,413 4,000 12,413 - - -
2020 10,413 4,000 12,413 9,553 4,000 11,553 2021 10,413 4,000 12,413 9,553 4,000 11,553
2022 10,913 4,000 12,413 9,553 4,000 11,553
2023 10,913 4,000 12,413 9,553 4,000 11,553 2024 10,913 4,000 12,413 9,553 4,000 11,553
2025 10,913 4,000 12,413 9,553 4,000 11,553
2026 - - - 9,553 4,000 11,553
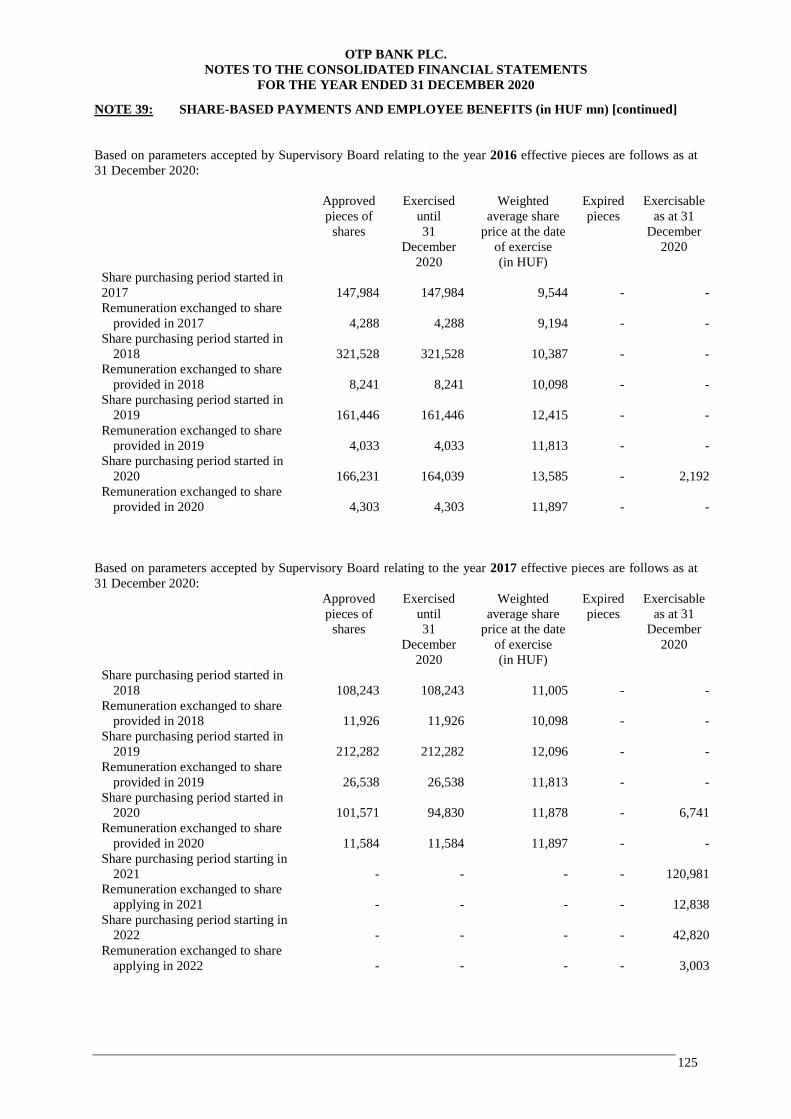
OTP BANK PLC.
NOTES TO THE CONSOLIDATED FINANCIAL STATEMENTS
FOR THE YEAR ENDED 31 DECEMBER 2020
125
NOTE 39: SHARE-BASED PAYMENTS AND EMPLOYEE BENEFITS (in HUF mn) [continued]
Based on parameters accepted by Supervisory Board relating to the year 2016 effective pieces are follows as at
31 December 2020:
Approved
pieces of
shares
Exercised
until
31
December
2020
Weighted
average share
price at the date
of exercise
(in HUF)
Expired
pieces
Exercisable
as at 31
December
2020
Share purchasing period started in
2017 147,984 147,984 9,544 - -
Remuneration exchanged to share
provided in 2017 4,288 4,288 9,194 - -
Share purchasing period started in
2018 321,528 321,528 10,387 - -
Remuneration exchanged to share
provided in 2018 8,241 8,241 10,098 - -
Share purchasing period started in
2019 161,446 161,446 12,415 - -
Remuneration exchanged to share
provided in 2019 4,033 4,033 11,813 - -
Share purchasing period started in
2020 166,231 164,039 13,585 - 2,192
Remuneration exchanged to share
provided in 2020 4,303 4,303 11,897 - -
Based on parameters accepted by Supervisory Board relating to the year 2017 effective pieces are follows as at
31 December 2020:
Approved
pieces of
shares
Exercised
until
31
December
2020
Weighted
average share
price at the date
of exercise
(in HUF)
Expired
pieces
Exercisable
as at 31
December
2020
Share purchasing period started in
2018 108,243 108,243 11,005 - -
Remuneration exchanged to share
provided in 2018 11,926 11,926 10,098 - -
Share purchasing period started in
2019 212,282 212,282 12,096 - -
Remuneration exchanged to share
provided in 2019 26,538 26,538 11,813 - -
Share purchasing period started in
2020 101,571 94,830 11,878 - 6,741
Remuneration exchanged to share
provided in 2020 11,584 11,584 11,897 - -
Share purchasing period starting in
2021 - - - - 120,981
Remuneration exchanged to share
applying in 2021 - - - - 12,838
Share purchasing period starting in
2022 - - - - 42,820
Remuneration exchanged to share
applying in 2022 - - - - 3,003
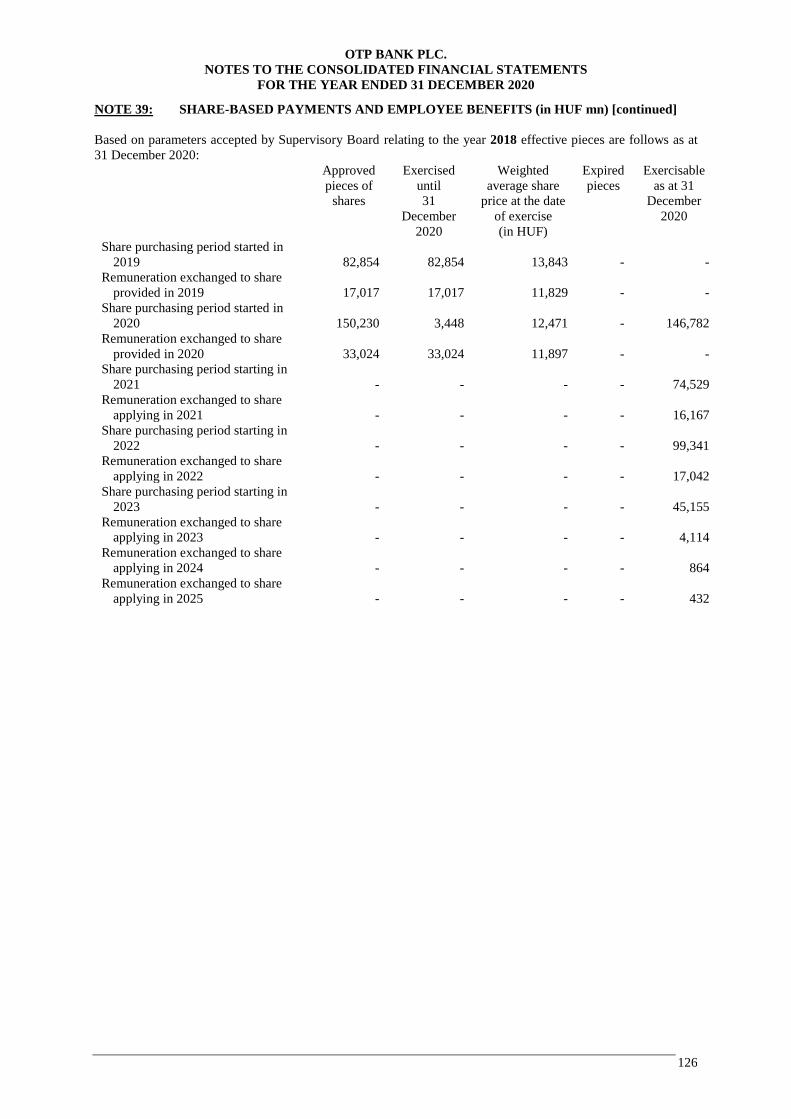
OTP BANK PLC.
NOTES TO THE CONSOLIDATED FINANCIAL STATEMENTS
FOR THE YEAR ENDED 31 DECEMBER 2020
126
NOTE 39: SHARE-BASED PAYMENTS AND EMPLOYEE BENEFITS (in HUF mn) [continued]
Based on parameters accepted by Supervisory Board relating to the year 2018 effective pieces are follows as at
31 December 2020:
Approved
pieces of
shares
Exercised
until
31
December
2020
Weighted
average share
price at the date
of exercise
(in HUF)
Expired
pieces
Exercisable
as at 31
December
2020
Share purchasing period started in
2019 82,854 82,854 13,843 - -
Remuneration exchanged to share
provided in 2019 17,017 17,017 11,829 - -
Share purchasing period started in
2020 150,230 3,448 12,471 - 146,782
Remuneration exchanged to share
provided in 2020 33,024 33,024 11,897 - -
Share purchasing period starting in
2021 - - - - 74,529
Remuneration exchanged to share
applying in 2021 - - - - 16,167
Share purchasing period starting in
2022 - - - - 99,341
Remuneration exchanged to share
applying in 2022 - - - - 17,042
Share purchasing period starting in
2023 - - - - 45,155
Remuneration exchanged to share
applying in 2023 - - - - 4,114
Remuneration exchanged to share
applying in 2024 - - - - 864
Remuneration exchanged to share
applying in 2025 - - - - 432
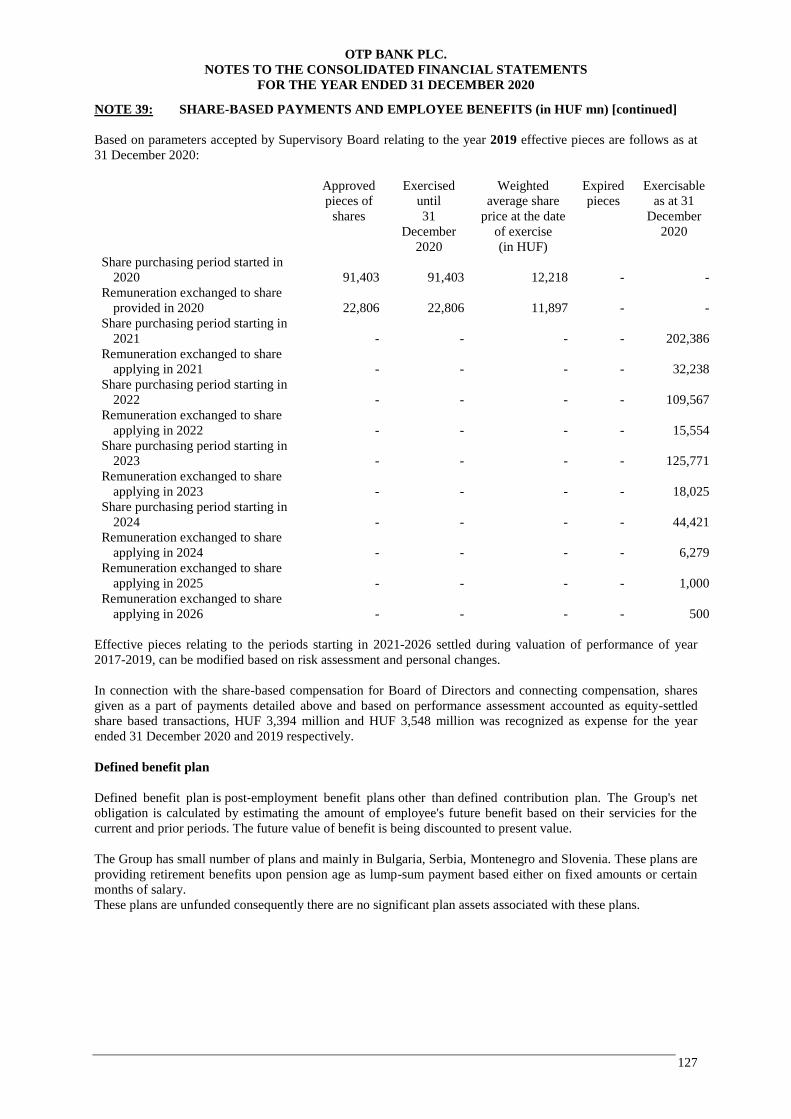
OTP BANK PLC.
NOTES TO THE CONSOLIDATED FINANCIAL STATEMENTS
FOR THE YEAR ENDED 31 DECEMBER 2020
127
NOTE 39: SHARE-BASED PAYMENTS AND EMPLOYEE BENEFITS (in HUF mn) [continued]
Based on parameters accepted by Supervisory Board relating to the year 2019 effective pieces are follows as at
31 December 2020:
Approved
pieces of
shares
Exercised
until
31
December
2020
Weighted
average share
price at the date
of exercise
(in HUF)
Expired
pieces
Exercisable
as at 31
December
2020
Share purchasing period started in
2020 91,403 91,403 12,218 - -
Remuneration exchanged to share
provided in 2020 22,806 22,806 11,897 - -
Share purchasing period starting in
2021 - - - - 202,386
Remuneration exchanged to share
applying in 2021 - - - - 32,238
Share purchasing period starting in
2022 - - - - 109,567
Remuneration exchanged to share
applying in 2022 - - - - 15,554
Share purchasing period starting in
2023 - - - - 125,771
Remuneration exchanged to share
applying in 2023 - - - - 18,025
Share purchasing period starting in
2024 - - - - 44,421
Remuneration exchanged to share
applying in 2024 - - - - 6,279
Remuneration exchanged to share
applying in 2025 - - - - 1,000
Remuneration exchanged to share
applying in 2026 - - - - 500
Effective pieces relating to the periods starting in 2021-2026 settled during valuation of performance of year
2017-2019, can be modified based on risk assessment and personal changes.
In connection with the share-based compensation for Board of Directors and connecting compensation, shares
given as a part of payments detailed above and based on performance assessment accounted as equity-settled
share based transactions, HUF 3,394 million and HUF 3,548 million was recognized as expense for the year
ended 31 December 2020 and 2019 respectively.
Defined benefit plan
Defined benefit plan is post‑employment benefit plans other than defined contribution plan. The Group's net
obligation is calculated by estimating the amount of employee's future benefit based on their servicies for the
current and prior periods. The future value of benefit is being discounted to present value.
The Group has small number of plans and mainly in Bulgaria, Serbia, Montenegro and Slovenia. These plans are
providing retirement benefits upon pension age as lump-sum payment based either on fixed amounts or certain
months of salary.
These plans are unfunded consequently there are no significant plan assets associated with these plans.
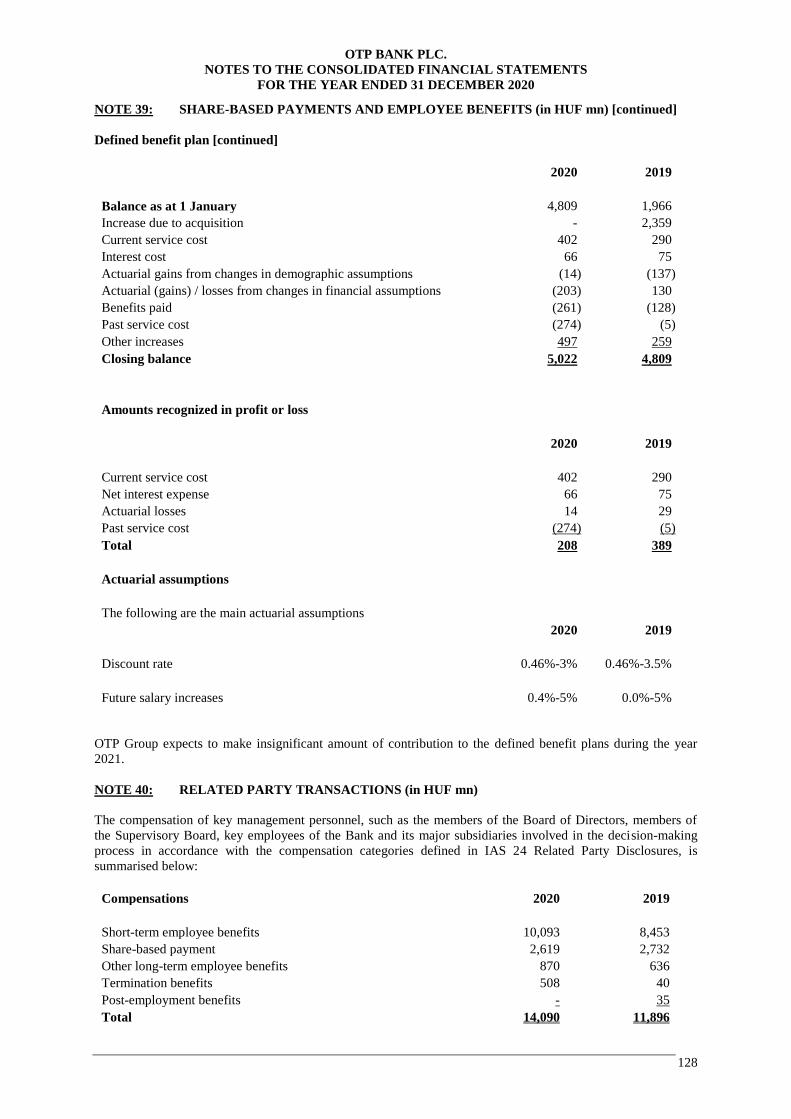
OTP BANK PLC.
NOTES TO THE CONSOLIDATED FINANCIAL STATEMENTS
FOR THE YEAR ENDED 31 DECEMBER 2020
128
NOTE 39: SHARE-BASED PAYMENTS AND EMPLOYEE BENEFITS (in HUF mn) [continued]
Defined benefit plan [continued]
2020 2019
Balance as at 1 January 4,809 1,966
Increase due to acquisition - 2,359
Current service cost 402 290
Interest cost 66 75
Actuarial gains from changes in demographic assumptions (14) (137)
Actuarial (gains) / losses from changes in financial assumptions (203) 130
Benefits paid (261) (128)
Past service cost (274) (5)
Other increases 497 259
Closing balance 5,022 4,809
Amounts recognized in profit or loss
2020 2019
Current service cost 402 290
Net interest expense 66 75
Actuarial losses 14 29
Past service cost (274) (5)
Total 208 389
Actuarial assumptions
The following are the main actuarial assumptions
2020 2019
Discount rate 0.46%-3% 0.46%-3.5%
Future salary increases 0.4%-5% 0.0%-5%
OTP Group expects to make insignificant amount of contribution to the defined benefit plans during the year
2021.
NOTE 40: RELATED PARTY TRANSACTIONS (in HUF mn)
The compensation of key management personnel, such as the members of the Board of Directors, members of
the Supervisory Board, key employees of the Bank and its major subsidiaries involved in the decision-making
process in accordance with the compensation categories defined in IAS 24 Related Party Disclosures, is
summarised below:
Compensations 2020 2019
Short-term employee benefits 10,093 8,453
Share-based payment 2,619 2,732
Other long-term employee benefits 870 636
Termination benefits 508 40
Post-employment benefits - 35
Total 14,090 11,896
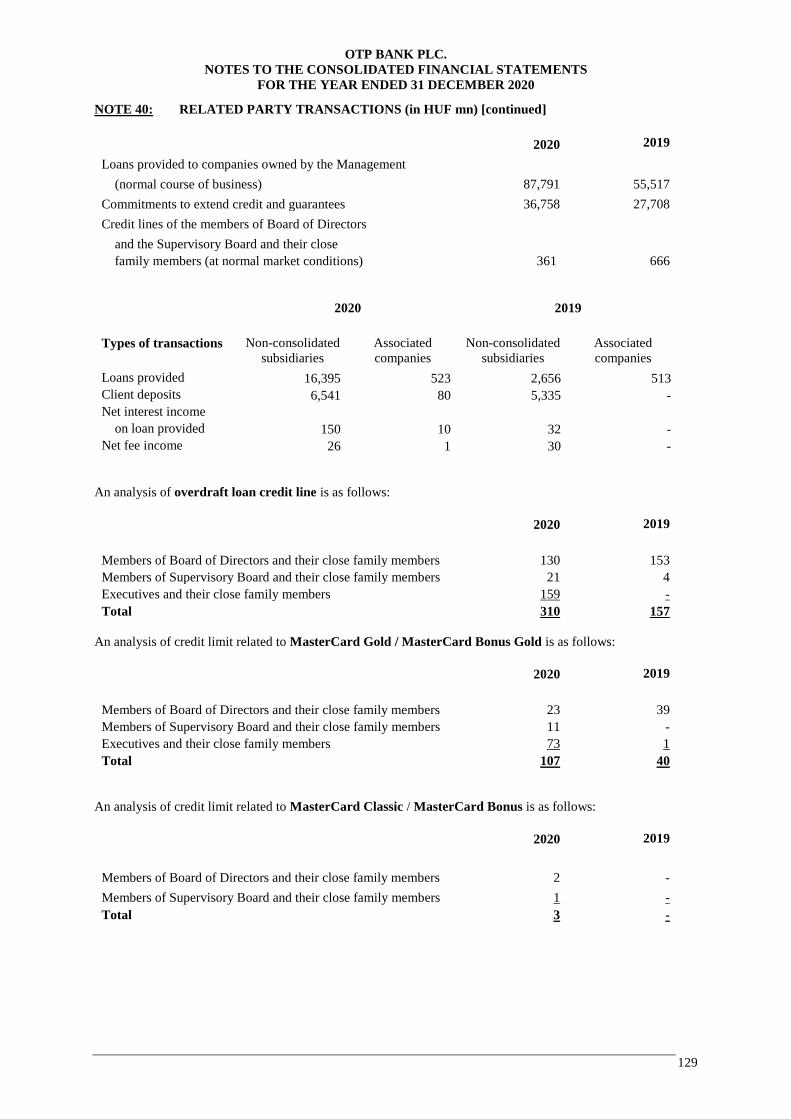
OTP BANK PLC.
NOTES TO THE CONSOLIDATED FINANCIAL STATEMENTS
FOR THE YEAR ENDED 31 DECEMBER 2020
129
NOTE 40: RELATED PARTY TRANSACTIONS (in HUF mn) [continued]
2020 2019
Loans provided to companies owned by the Management
(normal course of business) 87,791 55,517
Commitments to extend credit and guarantees 36,758 27,708
Credit lines of the members of Board of Directors
and the Supervisory Board and their close
family members (at normal market conditions) 361 666
2020 2019
Types of transactions Non-consolidated
subsidiaries
Associated
companies
Non-consolidated
subsidiaries
Associated
companies
Loans provided 16,395 523 2,656 513
Client deposits 6,541 80 5,335 -
Net interest income
on loan provided 150 10 32 -
Net fee income 26 1 30 -
An analysis of overdraft loan credit line is as follows:
2020 2019
Members of Board of Directors and their close family members 130 153
Members of Supervisory Board and their close family members 21 4
Executives and their close family members 159 -
Total 310 157
An analysis of credit limit related to MasterCard Gold / MasterCard Bonus Gold is as follows:
2020 2019
Members of Board of Directors and their close family members 23 39
Members of Supervisory Board and their close family members 11 -
Executives and their close family members 73 1
Total 107 40
An analysis of credit limit related to MasterCard Classic / MasterCard Bonus is as follows:
2020 2019
Members of Board of Directors and their close family members 2 -
Members of Supervisory Board and their close family members 1 -
Total 3 -
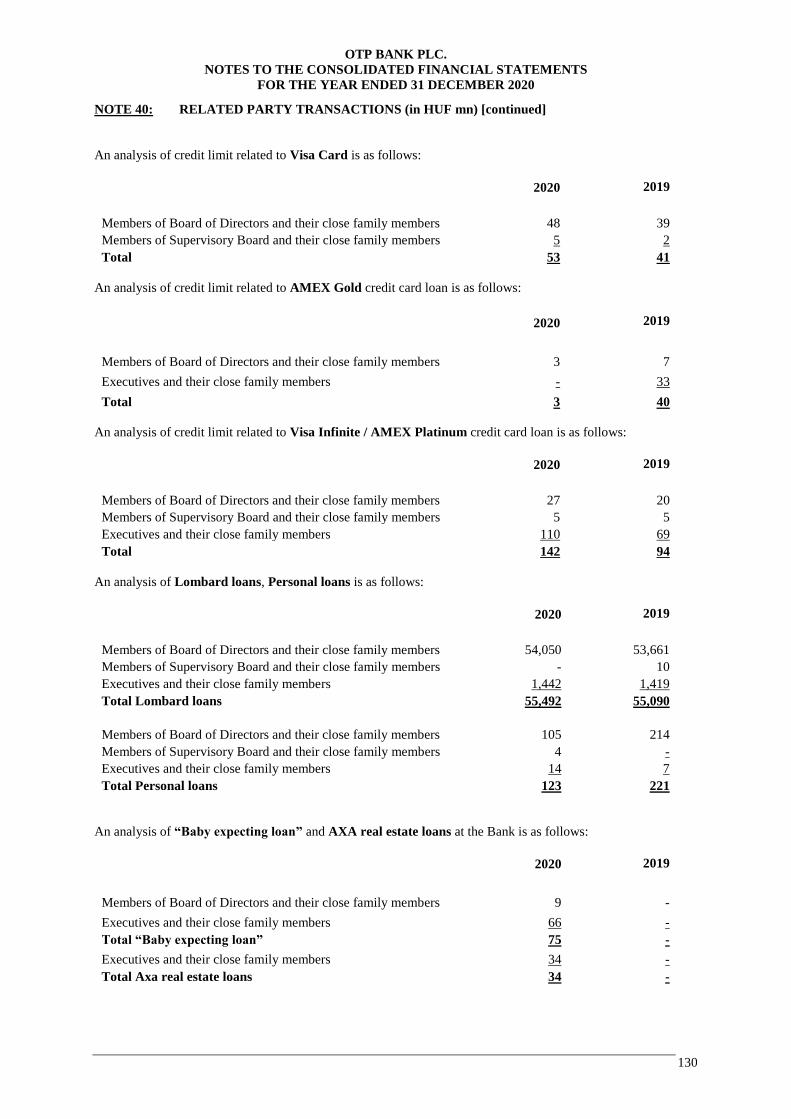
OTP BANK PLC.
NOTES TO THE CONSOLIDATED FINANCIAL STATEMENTS
FOR THE YEAR ENDED 31 DECEMBER 2020
130
NOTE 40: RELATED PARTY TRANSACTIONS (in HUF mn) [continued]
An analysis of credit limit related to Visa Card is as follows:
2020 2019
Members of Board of Directors and their close family members 48 39
Members of Supervisory Board and their close family members 5 2
Total 53 41
An analysis of credit limit related to AMEX Gold credit card loan is as follows:
2020 2019
Members of Board of Directors and their close family members 3 7
Executives and their close family members - 33
Total 3 40
An analysis of credit limit related to Visa Infinite / AMEX Platinum credit card loan is as follows:
2020 2019
Members of Board of Directors and their close family members 27 20
Members of Supervisory Board and their close family members 5 5
Executives and their close family members 110 69
Total 142 94
An analysis of Lombard loans, Personal loans is as follows:
2020 2019
Members of Board of Directors and their close family members 54,050 53,661
Members of Supervisory Board and their close family members - 10
Executives and their close family members 1,442 1,419
Total Lombard loans 55,492 55,090
Members of Board of Directors and their close family members 105 214
Members of Supervisory Board and their close family members 4 -
Executives and their close family members 14 7
Total Personal loans 123 221
An analysis of “Baby expecting loan” and AXA real estate loans at the Bank is as follows:
2020 2019
Members of Board of Directors and their close family members 9 -
Executives and their close family members 66 -
Total “Baby expecting loan” 75 -
Executives and their close family members 34 -
Total Axa real estate loans 34 -

OTP BANK PLC.
NOTES TO THE CONSOLIDATED FINANCIAL STATEMENTS
FOR THE YEAR ENDED 31 DECEMBER 2020
131
NOTE 40: RELATED PARTY TRANSACTIONS (in HUF mn) [continued]
An analysis of payment to executives of the Group related to their activity in Board of Directors and Supervisory
Board is as follows:
2020 2019
Members of Board of Directors 2,502 3,060
Members of Supervisory Board 204 227
Total 2,706 3,287
In the normal course of business, the Bank enters into other transactions with its unconsolidated subsidiaries of
the Group, the amounts and volumes of which are not significant to these consolidated financial statements taken
as a whole. Related party transactions were made on terms equivalent to those that prevail in arm’s length
transactions and such terms can be substantiated.
NOTE 41: ACQUISITION (in HUF mn)
Purchase and consolidation of subsidiaries
The Société Générale Group made a strategic decision about the disposal of its bank subsidiaries in the Central
and Eastern European countries and the Balkan Region, in order to be able to strengthen its position in other
regions. The strategic goal of OTP Group is to strengthen its presence in the Central and Eastern European
region and to enter other markets of strategic importance. By completing these transactions the parties achieved
part of their strategic goals. Based on market standards, OTP Group made the due diligence of the subsidiaries
using data provided by the Vendor, then in line with the process defined by the Vendor, after several biddings,
the decision was made about the selected subsidiaries. Following the agreement in principles the parties finalized
the details of the purchase agreements which were fixed in contracts.
A comprehensive due diligence was performed before every acquisition decision, where in accordance with the
main statements of the due diligence, the market environment, the historical performance of the target and the
expected profit-making capacity of the target for the period after the closing according to the business plan, the
realistic range of the purchase price was defined. Having taken into consideration some other aspects,
management laid down the proposed purchase price. Purchasing an entity with positive or negative goodwill is
reasoned by altogether the expected cost synergies arising from the market situation and the survey of joint
profit-making capacity, the size of the marge typical for the markets, and other strategic considerations (gain of
new market shares or increasing them).
Individually the purchase prices were not made public – as it was agreed with the Vendor – however, the
aggregated purchase price was HUF 460,077 million.
On 13 December 2019 the financial closure of the Slovenian transaction has been completed (after the
acquisition agreement was signed on 2 May 2019). As a result, OTP Bank has become 99.73% owner of SKB
Banka, the Slovenian subsidiary of Societe Generale Group and other local subsidiaries held by SKB Banka, so
it was consolidated from December 2019.
On 25 July 2019 the financial closure of the Moldovan transaction has been completed (after the acquisition
agreement was signed on 5 February, 2019). As a result, OTP Bank has become 96.69% owner of Mobiasbanca
– Groupe Societe Generale S.A. („MBSG”), the Moldovan subsidiary of Societe Generale Group, so it was
consolidated from July 2019.
The financial closure of the transaction, based on the acquisition agreement on purchasing 90.56% shareholding
of Societe Generale banka Montenegro a.d. („SGM”), the Montenegrin subsidiary of Societe Generale Group
between Crnogorska komercijalna banka a.d., the Montenegrin subsidiary of OTP Bank and Societe Generale
Group, has been completed on 16 July 2019. The acquisition agreement between SG and CKB was signed on 27
February 2019 and the Montenegrin subsidiary was consolidated from July 2019.
OTP BANK PLC.
NOTES TO THE CONSOLIDATED FINANCIAL STATEMENTS
FOR THE YEAR ENDED 31 DECEMBER 2020
132
NOTE 41: ACQUISITIONS (in HUF mn) [continued]
Purchase and consolidation of subsidiaries [continued]
On 24 September 2019 the financial closure of the Serbian transaction has been completed (after the acquisition
agreement was signed on 19 December 2018). As a result, OTP Bank has become 100% owner of Societe
Generale banka Srbija a.d. Beograd („SGS”), the Serbian subsidiary of Societe Generale Group and other
local subsidiaries held by SGS, so it was consolidated from September 2019.
In line with the purchase agreement signed on 1 August 2018 by OTP Bank and the Societe Generale Group, on
29 March 2019 the financial closure of the Albanian transaction has been completed and it was consolidated. As
a result, OTP Bank has become the 100% owner of Banka Societe Generale Albania SH.A. („SGAL”), the
Albanian subsidiary of Societe Generale Group, so it was consolidated from March 2019.
The financial closure of the transaction, based on the acquisition agreement on purchasing 99.74% shareholding
of Societe Generale Expressbank („SGEB”), the Bulgarian subsidiary of Societe Generale Group (“SG”), and
other local subsidiaries held by SGEB, between Societe Generale Group and DSK Bank EAD (“DSK Bank”),
the Bulgarian subsidiary of OTP Bank, has been completed on 15 January 2019, so it was consolidated from
January 2019. The acquisition agreement between SG and DSK Bank was signed on 1 August 2018.
The Bulgarian Expressbank AD merged with its parent DSK Bank AD, which was entered in the company
register on the 30th of April 2020. The integration of whole bank systems and information was completed on the
4th of May 2020. Podgorička Banka AD Podgorica in Montenegro merged with its parent bank on the 11th of
December 2020, named Crnogorska Komercijalna Banka AD Podgorica after the merger.
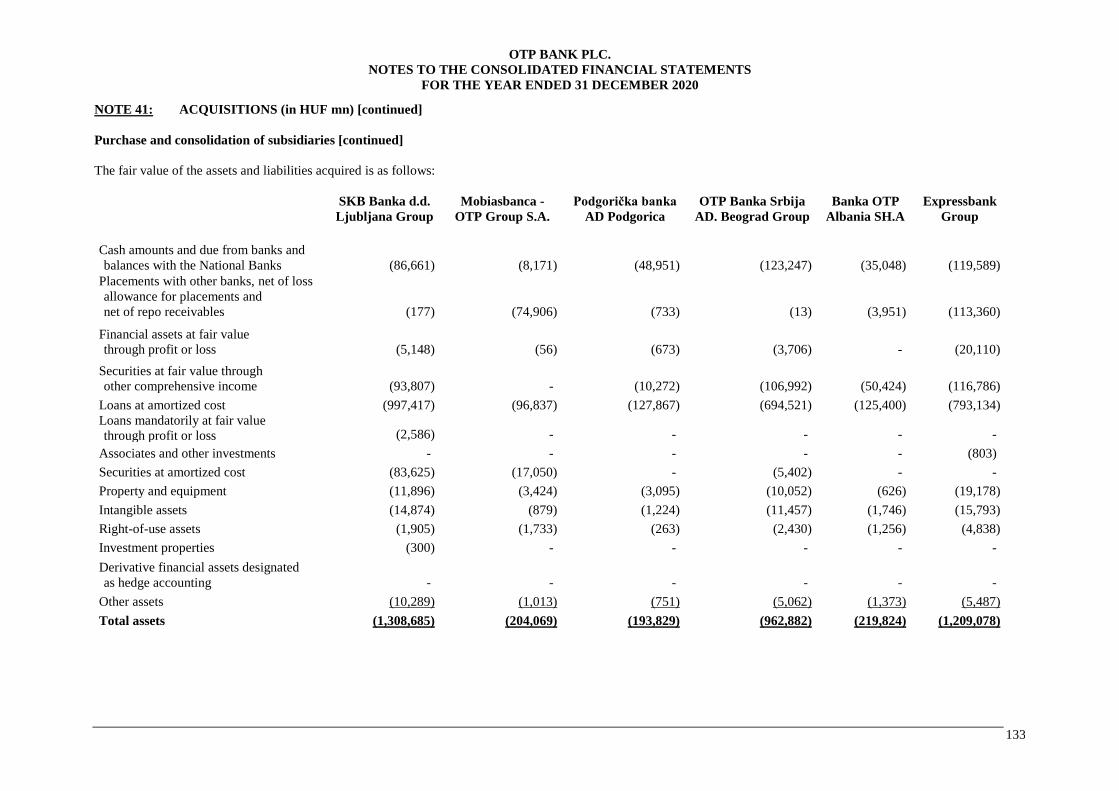
OTP BANK PLC.
NOTES TO THE CONSOLIDATED FINANCIAL STATEMENTS
FOR THE YEAR ENDED 31 DECEMBER 2020
133
NOTE 41: ACQUISITIONS (in HUF mn) [continued]
Purchase and consolidation of subsidiaries [continued]
The fair value of the assets and liabilities acquired is as follows:
SKB Banka d.d.
Ljubljana Group
Mobiasbanca -
OTP Group S.A.
Podgorička banka
AD Podgorica
OTP Banka Srbija
AD. Beograd Group
Banka OTP
Albania SH.A
Expressbank
Group
Cash amounts and due from banks and
balances with the National Banks (86,661) (8,171) (48,951) (123,247) (35,048) (119,589)
Placements with other banks, net of loss
allowance for placements and
net of repo receivables (177) (74,906) (733) (13) (3,951) (113,360)
Financial assets at fair value
through profit or loss (5,148) (56) (673) (3,706) - (20,110)
Securities at fair value through
other comprehensive income (93,807) - (10,272) (106,992) (50,424) (116,786)
Loans at amortized cost (997,417) (96,837) (127,867) (694,521) (125,400) (793,134)
Loans mandatorily at fair value
through profit or loss (2,586) - - - - -
Associates and other investments - - - - - (803)
Securities at amortized cost (83,625) (17,050) - (5,402) - -
Property and equipment (11,896) (3,424) (3,095) (10,052) (626) (19,178)
Intangible assets (14,874) (879) (1,224) (11,457) (1,746) (15,793)
Right-of-use assets (1,905) (1,733) (263) (2,430) (1,256) (4,838)
Investment properties (300) - - - - -
Derivative financial assets designated
as hedge accounting - - - - - -
Other assets (10,289) (1,013) (751) (5,062) (1,373) (5,487)
Total assets (1,308,685) (204,069) (193,829) (962,882) (219,824) (1,209,078)
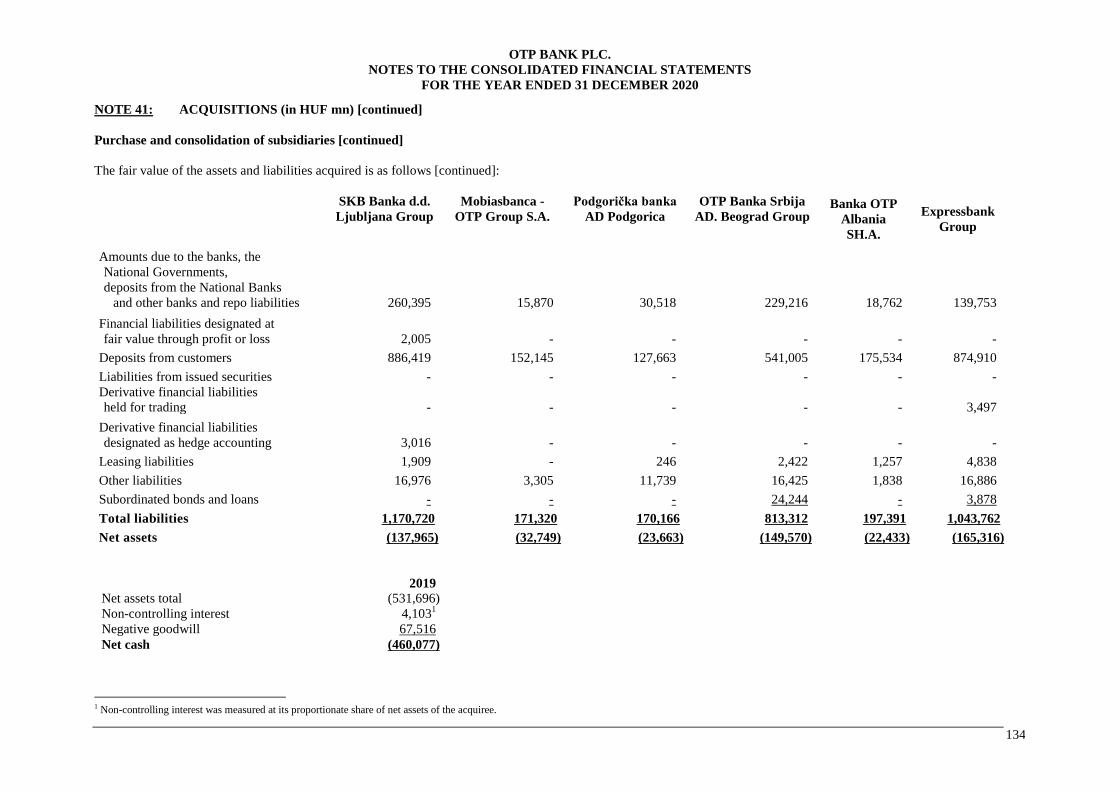
OTP BANK PLC.
NOTES TO THE CONSOLIDATED FINANCIAL STATEMENTS
FOR THE YEAR ENDED 31 DECEMBER 2020
134
NOTE 41: ACQUISITIONS (in HUF mn) [continued]
Purchase and consolidation of subsidiaries [continued]
The fair value of the assets and liabilities acquired is as follows [continued]:
SKB Banka d.d.
Ljubljana Group
Mobiasbanca -
OTP Group S.A.
Podgorička banka
AD Podgorica
OTP Banka Srbija
AD. Beograd Group Banka OTP
Albania
SH.A.
Expressbank
Group
Amounts due to the banks, the
National Governments,
deposits from the National Banks
and other banks and repo liabilities 260,395 15,870 30,518 229,216 18,762 139,753
Financial liabilities designated at
fair value through profit or loss 2,005 - - - - -
Deposits from customers 886,419 152,145 127,663 541,005 175,534 874,910
Liabilities from issued securities - - - - - -
Derivative financial liabilities
held for trading - - - - - 3,497
Derivative financial liabilities
designated as hedge accounting 3,016 - - - - -
Leasing liabilities 1,909 - 246 2,422 1,257 4,838
Other liabilities 16,976 3,305 11,739 16,425 1,838 16,886
Subordinated bonds and loans - - - 24,244 - 3,878
Total liabilities 1,170,720 171,320 170,166 813,312 197,391 1,043,762
Net assets (137,965) (32,749) (23,663) (149,570) (22,433) (165,316)
2019
Net assets total (531,696)
Non-controlling interest 4,1031
Negative goodwill 67,516
Net cash (460,077)
1 Non-controlling interest was measured at its proportionate share of net assets of the acquiree.

OTP BANK PLC.
NOTES TO THE CONSOLIDATED FINANCIAL STATEMENTS
FOR THE YEAR ENDED 31 DECEMBER 2020
135
NOTE 41: ACQUISITIONS (in HUF mn) [continued]
Purchase and consolidation of subsidiaries [continued]
Breakdown of the acquired entity’s income, profit / loss from the date of the acquisition:
Interest income Net result One-off expense1
SKB Banka d.d. Ljubljana Group - - 4,972
Mobiasbanca - OTP Group S.A. 5,309 1,508 778
Podgorička banka AD Podgorica 3,991 691 978
OTP Banka Srbija AD. Beograd Group 9,820 2,720 2,610
Banka OTP Albania SH.A. 7,418 1,173 1,606
Expressbank Group 34,204 16,682 5,752
Total 60,742 22,774 16,696
Breakdown of the acquired entity’s income, profit / loss if the Group would have acquired from the
beginning of year 2019:
Interest income Net result One-off expense1
SKB Banka d.d. Ljubljana Group 30,254 21,350 4,972
Mobiasbanca - OTP Group S.A. 11,553 4,255 778
Podgorička banka AD Podgorica 8,574 2,755 978
OTP Banka Srbija AD. Beograd Group 39,195 18,519 2,610
Banka OTP Albania SH.A. 9,944 2,075 1,606
Expressbank Group 34,204 16,682 5,752
Total 133,724 65,636 16,696
With the acquisitions the following shares were purchased:
Number of shares Type Voting rights
SKB Bank d.d. Ljubljana 12,614,965 ordinary share 99.72%
SKB Leasing d.o.o. - - 100.00%
SKB Leasing Select d.o.o. - - 100.00%
Mobiasbanca-OTP Group SA 9,669,155 ordinary share 96.69%
Podgorička banka AD Podgorica 87,602 ordinary share 90.56%
OTP Banka Srbija AD. Beograd 5,331,016 ordinary share 100.00%
OTP Leasing Srbija d.o.o. Beograd - - 100.00%
OTP Osiguranje ADO Beograd 305,408 ordinary share 100.00%
Banka OTP Albania 67,409 ordinary share 100.00%
Expressbank AD. 33,584,555 ordinary share 100.00%
OTP Leasing EOOD - - 100.00%
Express Factoring EOOD - - 100.00%
Express Life insurance Joint-Stock
Company 29,918 ordinary share 100.00%
1 The net result was decreased by the loss allowance on loans in accordance with IFRS 9 after the first day of the acquisition (Day 1).
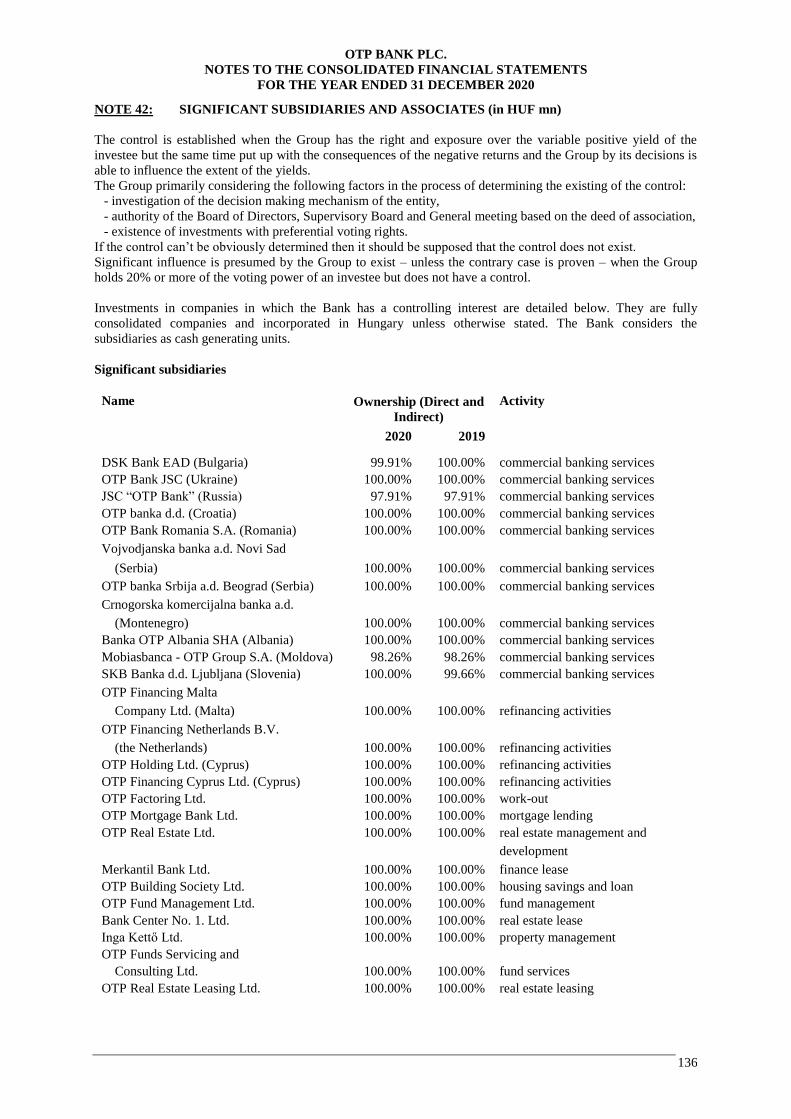
OTP BANK PLC.
NOTES TO THE CONSOLIDATED FINANCIAL STATEMENTS
FOR THE YEAR ENDED 31 DECEMBER 2020
136
NOTE 42: SIGNIFICANT SUBSIDIARIES AND ASSOCIATES (in HUF mn)
The control is established when the Group has the right and exposure over the variable positive yield of the
investee but the same time put up with the consequences of the negative returns and the Group by its decisions is
able to influence the extent of the yields.
The Group primarily considering the following factors in the process of determining the existing of the control:
- investigation of the decision making mechanism of the entity,
- authority of the Board of Directors, Supervisory Board and General meeting based on the deed of association,
- existence of investments with preferential voting rights.
If the control can’t be obviously determined then it should be supposed that the control does not exist.
Significant influence is presumed by the Group to exist – unless the contrary case is proven – when the Group
holds 20% or more of the voting power of an investee but does not have a control.
Investments in companies in which the Bank has a controlling interest are detailed below. They are fully
consolidated companies and incorporated in Hungary unless otherwise stated. The Bank considers the
subsidiaries as cash generating units.
Significant subsidiaries
Name Ownership (Direct and
Indirect)
Activity
2020 2019
DSK Bank EAD (Bulgaria) 99.91% 100.00% commercial banking services
OTP Bank JSC (Ukraine) 100.00% 100.00% commercial banking services
JSC “OTP Bank” (Russia) 97.91% 97.91% commercial banking services
OTP banka d.d. (Croatia) 100.00% 100.00% commercial banking services
OTP Bank Romania S.A. (Romania) 100.00% 100.00% commercial banking services
Vojvodjanska banka a.d. Novi Sad
(Serbia) 100.00% 100.00% commercial banking services
OTP banka Srbija a.d. Beograd (Serbia) 100.00% 100.00% commercial banking services
Crnogorska komercijalna banka a.d.
(Montenegro) 100.00% 100.00% commercial banking services
Banka OTP Albania SHA (Albania) 100.00% 100.00% commercial banking services
Mobiasbanca - OTP Group S.A. (Moldova) 98.26% 98.26% commercial banking services
SKB Banka d.d. Ljubljana (Slovenia) 100.00% 99.66% commercial banking services
OTP Financing Malta
Company Ltd. (Malta) 100.00% 100.00% refinancing activities
OTP Financing Netherlands B.V.
(the Netherlands) 100.00% 100.00% refinancing activities
OTP Holding Ltd. (Cyprus) 100.00% 100.00% refinancing activities
OTP Financing Cyprus Ltd. (Cyprus) 100.00% 100.00% refinancing activities
OTP Factoring Ltd. 100.00% 100.00% work-out
OTP Mortgage Bank Ltd. 100.00% 100.00% mortgage lending
OTP Real Estate Ltd. 100.00% 100.00% real estate management and
development
Merkantil Bank Ltd. 100.00% 100.00% finance lease
OTP Building Society Ltd. 100.00% 100.00% housing savings and loan
OTP Fund Management Ltd. 100.00% 100.00% fund management
Bank Center No. 1. Ltd. 100.00% 100.00% real estate lease
Inga Kettő Ltd. 100.00% 100.00% property management
OTP Funds Servicing and
Consulting Ltd. 100.00% 100.00% fund services
OTP Real Estate Leasing Ltd. 100.00% 100.00% real estate leasing
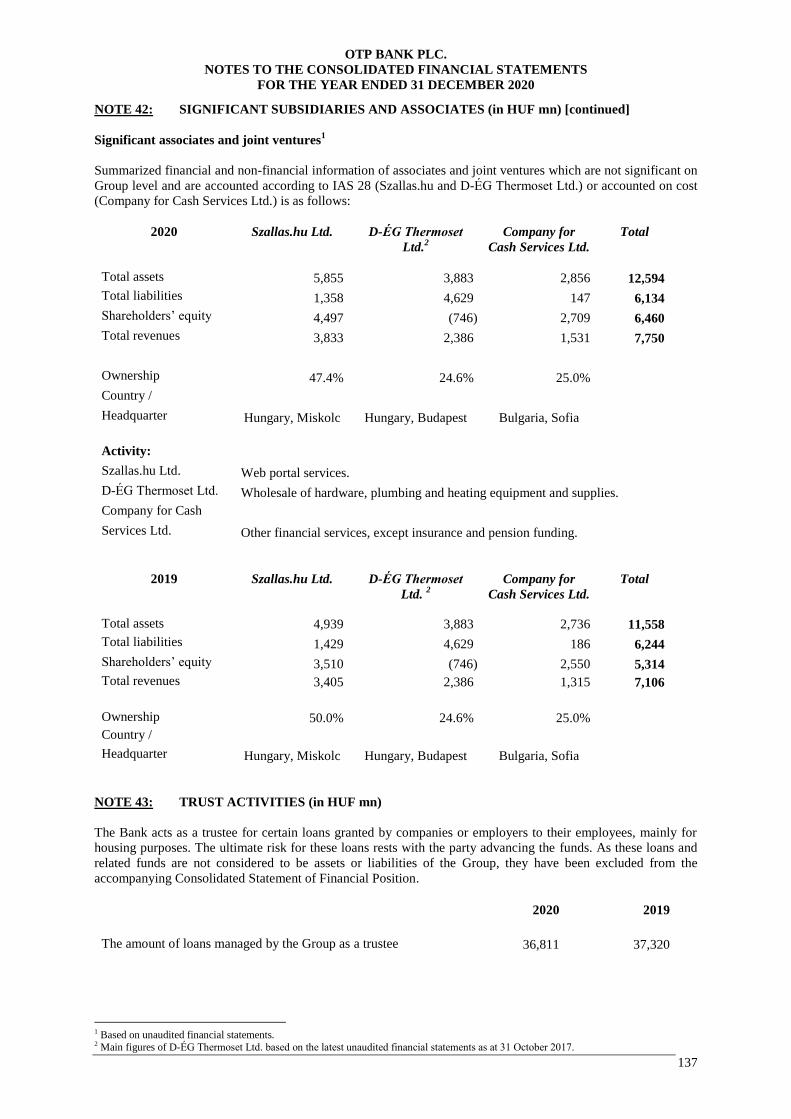
OTP BANK PLC.
NOTES TO THE CONSOLIDATED FINANCIAL STATEMENTS
FOR THE YEAR ENDED 31 DECEMBER 2020
137
NOTE 42: SIGNIFICANT SUBSIDIARIES AND ASSOCIATES (in HUF mn) [continued]
Significant associates and joint ventures1
Summarized financial and non-financial information of associates and joint ventures which are not significant on
Group level and are accounted according to IAS 28 (Szallas.hu and D-ÉG Thermoset Ltd.) or accounted on cost
(Company for Cash Services Ltd.) is as follows:
2020 Szallas.hu Ltd. D-ÉG Thermoset
Ltd.2
Company for
Cash Services Ltd.
Total
Total assets 5,855 3,883 2,856 12,594
Total liabilities 1,358 4,629 147 6,134
Shareholders’ equity 4,497 (746) 2,709 6,460
Total revenues 3,833 2,386 1,531 7,750
Ownership 47.4% 24.6% 25.0%
Country /
Headquarter Hungary, Miskolc Hungary, Budapest Bulgaria, Sofia
Activity:
Szallas.hu Ltd. Web portal services.
D-ÉG Thermoset Ltd. Wholesale of hardware, plumbing and heating equipment and supplies.
Company for Cash
Services Ltd. Other financial services, except insurance and pension funding.
2019 Szallas.hu Ltd. D-ÉG Thermoset
Ltd. 2
Company for
Cash Services Ltd.
Total
Total assets 4,939 3,883 2,736 11,558
Total liabilities 1,429 4,629 186 6,244
Shareholders’ equity 3,510 (746) 2,550 5,314
Total revenues 3,405 2,386 1,315 7,106
Ownership 50.0% 24.6% 25.0%
Country /
Headquarter Hungary, Miskolc Hungary, Budapest Bulgaria, Sofia
NOTE 43: TRUST ACTIVITIES (in HUF mn)
The Bank acts as a trustee for certain loans granted by companies or employers to their employees, mainly for
housing purposes. The ultimate risk for these loans rests with the party advancing the funds. As these loans and
related funds are not considered to be assets or liabilities of the Group, they have been excluded from the
accompanying Consolidated Statement of Financial Position.
2020 2019
The amount of loans managed by the Group as a trustee 36,811 37,320
1 Based on unaudited financial statements. 2 Main figures of D-ÉG Thermoset Ltd. based on the latest unaudited financial statements as at 31 October 2017.
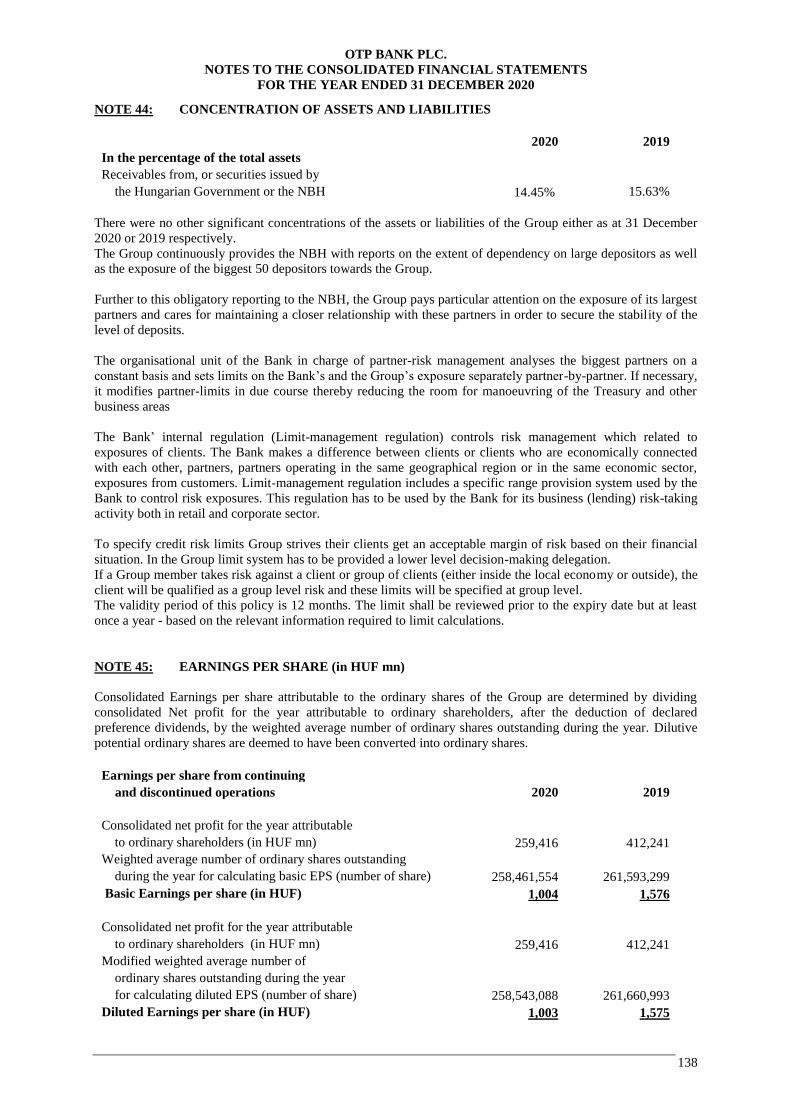
OTP BANK PLC.
NOTES TO THE CONSOLIDATED FINANCIAL STATEMENTS
FOR THE YEAR ENDED 31 DECEMBER 2020
138
NOTE 44: CONCENTRATION OF ASSETS AND LIABILITIES
2020 2019
In the percentage of the total assets
Receivables from, or securities issued by
the Hungarian Government or the NBH 14.45% 15.63%
There were no other significant concentrations of the assets or liabilities of the Group either as at 31 December
2020 or 2019 respectively.
The Group continuously provides the NBH with reports on the extent of dependency on large depositors as well
as the exposure of the biggest 50 depositors towards the Group.
Further to this obligatory reporting to the NBH, the Group pays particular attention on the exposure of its largest
partners and cares for maintaining a closer relationship with these partners in order to secure the stability of the
level of deposits.
The organisational unit of the Bank in charge of partner-risk management analyses the biggest partners on a
constant basis and sets limits on the Bank’s and the Group’s exposure separately partner-by-partner. If necessary,
it modifies partner-limits in due course thereby reducing the room for manoeuvring of the Treasury and other
business areas
The Bank’ internal regulation (Limit-management regulation) controls risk management which related to
exposures of clients. The Bank makes a difference between clients or clients who are economically connected
with each other, partners, partners operating in the same geographical region or in the same economic sector,
exposures from customers. Limit-management regulation includes a specific range provision system used by the
Bank to control risk exposures. This regulation has to be used by the Bank for its business (lending) risk-taking
activity both in retail and corporate sector.
To specify credit risk limits Group strives their clients get an acceptable margin of risk based on their financial
situation. In the Group limit system has to be provided a lower level decision-making delegation.
If a Group member takes risk against a client or group of clients (either inside the local economy or outside), the
client will be qualified as a group level risk and these limits will be specified at group level.
The validity period of this policy is 12 months. The limit shall be reviewed prior to the expiry date but at least
once a year - based on the relevant information required to limit calculations.
NOTE 45: EARNINGS PER SHARE (in HUF mn)
Consolidated Earnings per share attributable to the ordinary shares of the Group are determined by dividing
consolidated Net profit for the year attributable to ordinary shareholders, after the deduction of declared
preference dividends, by the weighted average number of ordinary shares outstanding during the year. Dilutive
potential ordinary shares are deemed to have been converted into ordinary shares.
Earnings per share from continuing
and discontinued operations 2020 2019
Consolidated net profit for the year attributable
to ordinary shareholders (in HUF mn) 259,416 412,241
Weighted average number of ordinary shares outstanding
during the year for calculating basic EPS (number of share) 258,461,554 261,593,299
Basic Earnings per share (in HUF) 1,004 1,576
Consolidated net profit for the year attributable
to ordinary shareholders (in HUF mn) 259,416 412,241
Modified weighted average number of
ordinary shares outstanding during the year
for calculating diluted EPS (number of share) 258,543,088 261,660,993
Diluted Earnings per share (in HUF) 1,003 1,575
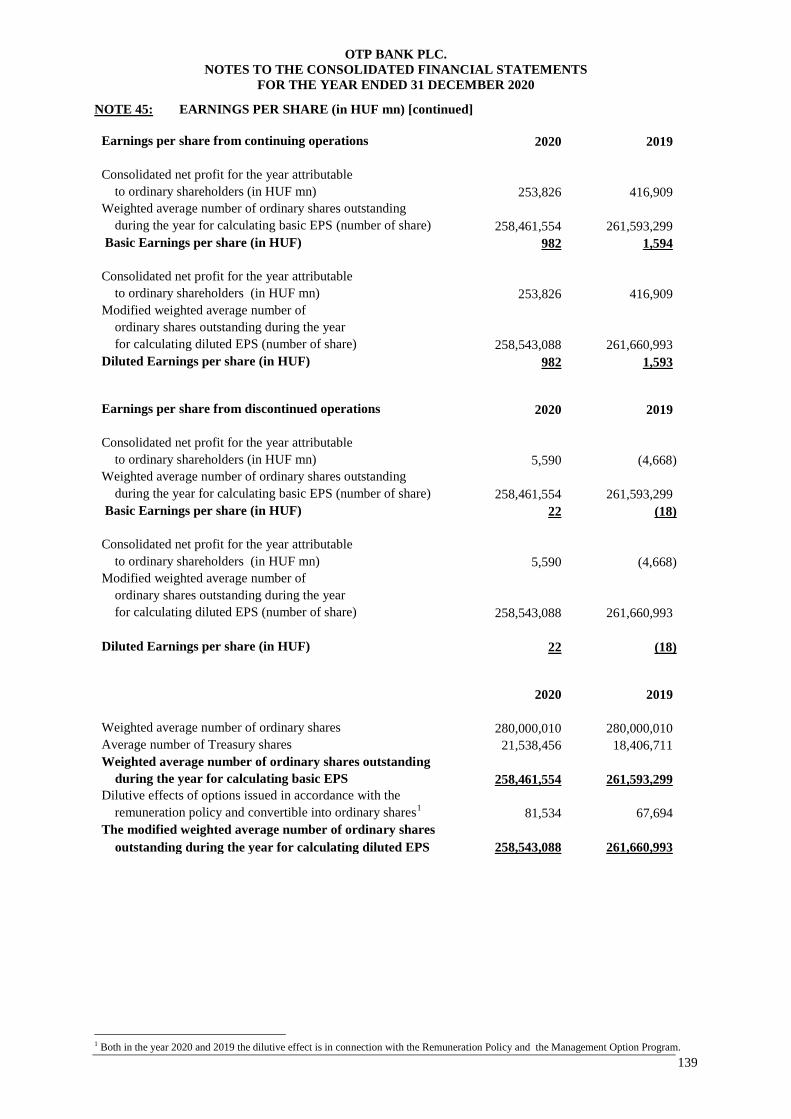
OTP BANK PLC.
NOTES TO THE CONSOLIDATED FINANCIAL STATEMENTS
FOR THE YEAR ENDED 31 DECEMBER 2020
139
NOTE 45: EARNINGS PER SHARE (in HUF mn) [continued]
Earnings per share from continuing operations 2020 2019
Consolidated net profit for the year attributable
to ordinary shareholders (in HUF mn) 253,826 416,909
Weighted average number of ordinary shares outstanding
during the year for calculating basic EPS (number of share) 258,461,554 261,593,299
Basic Earnings per share (in HUF) 982 1,594
Consolidated net profit for the year attributable
to ordinary shareholders (in HUF mn) 253,826 416,909
Modified weighted average number of
ordinary shares outstanding during the year
for calculating diluted EPS (number of share) 258,543,088 261,660,993
Diluted Earnings per share (in HUF) 982 1,593
Earnings per share from discontinued operations 2020 2019
Consolidated net profit for the year attributable
to ordinary shareholders (in HUF mn) 5,590 (4,668)
Weighted average number of ordinary shares outstanding
during the year for calculating basic EPS (number of share) 258,461,554 261,593,299
Basic Earnings per share (in HUF) 22 (18)
Consolidated net profit for the year attributable
to ordinary shareholders (in HUF mn) 5,590 (4,668)
Modified weighted average number of
ordinary shares outstanding during the year
for calculating diluted EPS (number of share) 258,543,088 261,660,993
Diluted Earnings per share (in HUF) 22 (18)
2020 2019
Weighted average number of ordinary shares 280,000,010 280,000,010
Average number of Treasury shares 21,538,456 18,406,711
Weighted average number of ordinary shares outstanding
during the year for calculating basic EPS 258,461,554 261,593,299
Dilutive effects of options issued in accordance with the
remuneration policy and convertible into ordinary shares1 81,534 67,694
The modified weighted average number of ordinary shares
outstanding during the year for calculating diluted EPS 258,543,088 261,660,993
1 Both in the year 2020 and 2019 the dilutive effect is in connection with the Remuneration Policy and the Management Option Program.
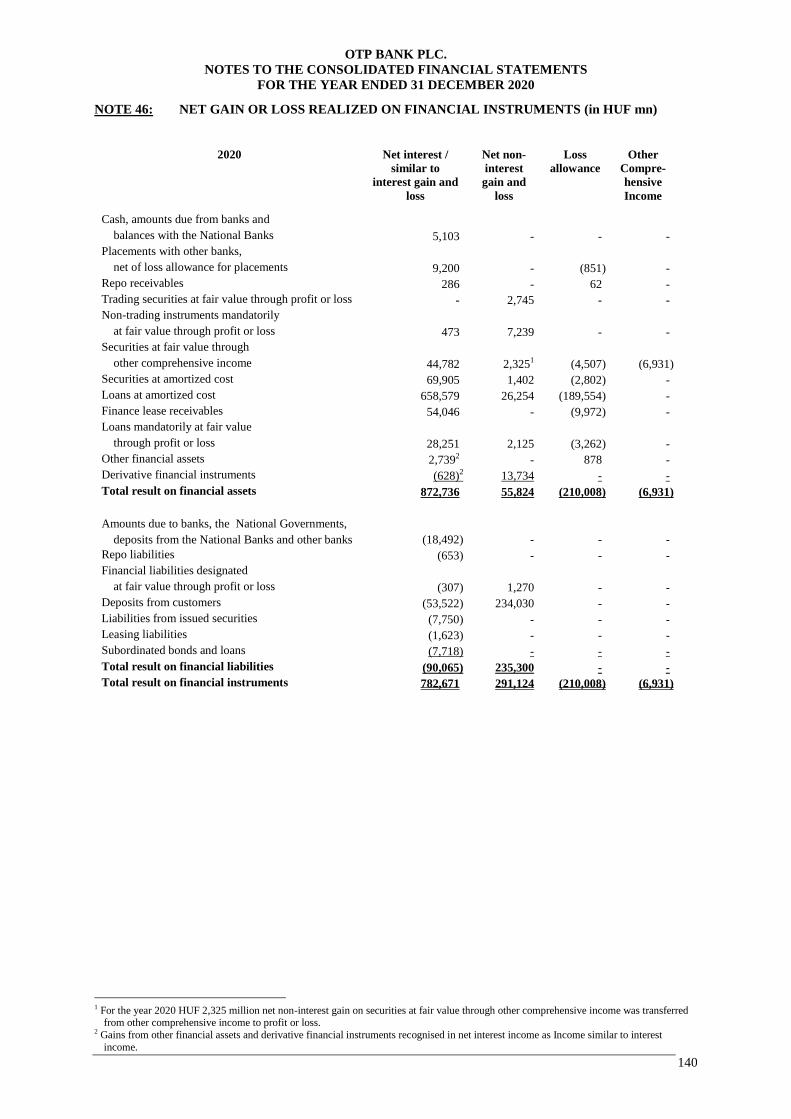
OTP BANK PLC.
NOTES TO THE CONSOLIDATED FINANCIAL STATEMENTS
FOR THE YEAR ENDED 31 DECEMBER 2020
140
NOTE 46: NET GAIN OR LOSS REALIZED ON FINANCIAL INSTRUMENTS (in HUF mn)
2020 Net interest /
similar to
interest gain and
loss
Net non-
interest
gain and
loss
Loss
allowance
Other
Compre-
hensive
Income
Cash, amounts due from banks and
balances with the National Banks 5,103 - - -
Placements with other banks,
net of loss allowance for placements 9,200 - (851) -
Repo receivables 286 - 62 -
Trading securities at fair value through profit or loss - 2,745 - -
Non-trading instruments mandatorily
at fair value through profit or loss 473 7,239 - -
Securities at fair value through
other comprehensive income 44,782 2,3251 (4,507) (6,931)
Securities at amortized cost 69,905 1,402 (2,802) -
Loans at amortized cost 658,579 26,254 (189,554) -
Finance lease receivables 54,046 - (9,972) -
Loans mandatorily at fair value
through profit or loss 28,251 2,125 (3,262) -
Other financial assets 2,7392 - 878 -
Derivative financial instruments (628)2 13,734 - -
Total result on financial assets 872,736 55,824 (210,008) (6,931)
Amounts due to banks, the National Governments,
deposits from the National Banks and other banks (18,492) - - -
Repo liabilities (653) - - -
Financial liabilities designated
at fair value through profit or loss (307) 1,270 - -
Deposits from customers (53,522) 234,030 - -
Liabilities from issued securities (7,750) - - -
Leasing liabilities (1,623) - - -
Subordinated bonds and loans (7,718) - - -
Total result on financial liabilities (90,065) 235,300 - -
Total result on financial instruments 782,671 291,124 (210,008) (6,931)
1 For the year 2020 HUF 2,325 million net non-interest gain on securities at fair value through other comprehensive income was transferred
from other comprehensive income to profit or loss. 2 Gains from other financial assets and derivative financial instruments recognised in net interest income as Income similar to interest
income.
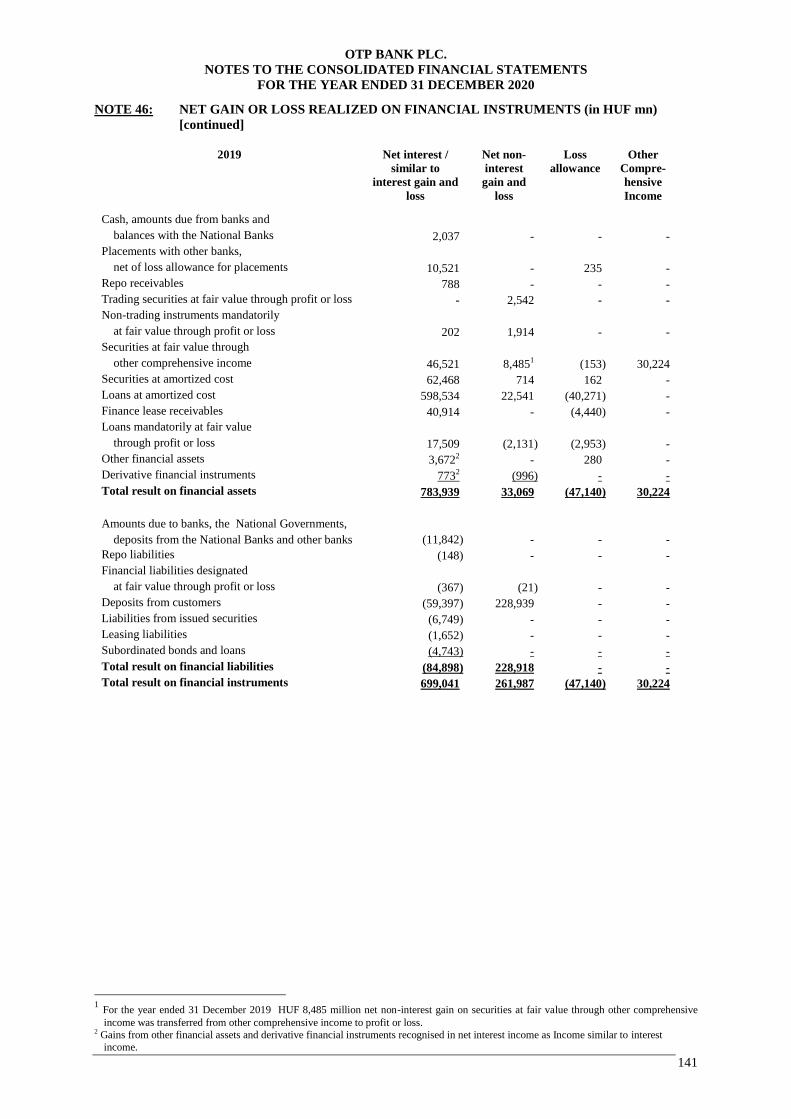
OTP BANK PLC.
NOTES TO THE CONSOLIDATED FINANCIAL STATEMENTS
FOR THE YEAR ENDED 31 DECEMBER 2020
141
NOTE 46: NET GAIN OR LOSS REALIZED ON FINANCIAL INSTRUMENTS (in HUF mn)
[continued]
2019 Net interest /
similar to
interest gain and
loss
Net non-
interest
gain and
loss
Loss
allowance
Other
Compre-
hensive
Income
Cash, amounts due from banks and
balances with the National Banks 2,037 - - -
Placements with other banks,
net of loss allowance for placements 10,521 - 235 -
Repo receivables 788 - - -
Trading securities at fair value through profit or loss - 2,542 - -
Non-trading instruments mandatorily
at fair value through profit or loss 202 1,914 - -
Securities at fair value through
other comprehensive income 46,521 8,4851 (153) 30,224
Securities at amortized cost 62,468 714 162 -
Loans at amortized cost 598,534 22,541 (40,271) -
Finance lease receivables 40,914 - (4,440) -
Loans mandatorily at fair value
through profit or loss 17,509 (2,131) (2,953) -
Other financial assets 3,6722 - 280 -
Derivative financial instruments 7732 (996) - -
Total result on financial assets 783,939 33,069 (47,140) 30,224
Amounts due to banks, the National Governments,
deposits from the National Banks and other banks (11,842) - - -
Repo liabilities (148) - - -
Financial liabilities designated
at fair value through profit or loss (367) (21) - -
Deposits from customers (59,397) 228,939 - -
Liabilities from issued securities (6,749) - - -
Leasing liabilities (1,652) - - -
Subordinated bonds and loans (4,743) - - -
Total result on financial liabilities (84,898) 228,918 - -
Total result on financial instruments 699,041 261,987 (47,140) 30,224
1 For the year ended 31 December 2019 HUF 8,485 million net non-interest gain on securities at fair value through other comprehensive
income was transferred from other comprehensive income to profit or loss. 2 Gains from other financial assets and derivative financial instruments recognised in net interest income as Income similar to interest
income.
OTP BANK PLC.
NOTES TO THE CONSOLIDATED FINANCIAL STATEMENTS
FOR THE YEAR ENDED 31 DECEMBER 2020
142
NOTE 47: FAIR VALUE OF FINANCIAL INSTRUMENTS (in HUF mn)
In determining the fair value of a financial asset or liability the Group in the case of instruments that are quoted
on an active market uses the market price. In most cases market price is not publicly available so the Group has
to make assumptions or use valuation techniques to determine the fair value of a financial instrument. See Note
47. d) for more information about fair value classes applied for financial assets and liabilities measured at fair
value in these financial statements.
To provide a reliable estimate of the fair value of those financial instrument that are originally measured at
amortized cost, the Group used the discounted cash-flow analyses (loans, placements with other banks, repo
receivables, amounts due to banks, repo liabilities, deposits from customers). The fair value of issued securities
and subordinated bonds is based on quoted prices (e.g. Reuters). Cash and amounts due from banks and balances
with the National Banks represent amounts available immediately thus the fair value equals to the cost.
The assumptions used when calculating the fair value of financial assets and liabilities when using valuation
technique are the following:
the discount rates are the risk free rates related to the denomination currency adjusted by the appropriate
risk premium as of the end of the reporting period,
the contractual cash-flows are considered for the performing loans and for the non-performing loans,
the amortized cost less impairment is considered as fair value,
the future cash-flows for floating interest rate instruments are estimated from the yield curves as of the
end of the reporting period,
the fair value of the deposit which can be due in demand cannot be lower than the amount payable on
demand.
Classes of assets and liabilities not measured at fair value in the statement of financial position, the income
approach was used to convert future cash-flows to a single current amount. Fair value of current assets is equal
to carrying amount, fair value of liabilities from issued securities and other bond-type classes of assets and
liabilities not measured at fair value measured based on Reuters market rates, and fair value of other classes not
measured at fair value of the statement of financial position is measured at discounted cash-flow method. Fair
value of loans, net of loss allowance for loans measured at discount rate adjustment technique, the discount rate
is derived from observed rates of return for comparable assets or liabilities that are traded in the market.
Fair value measurements – in relation to instruments measured not at fair value – are mainly categorized in level
2 of the fair value hierarchy.
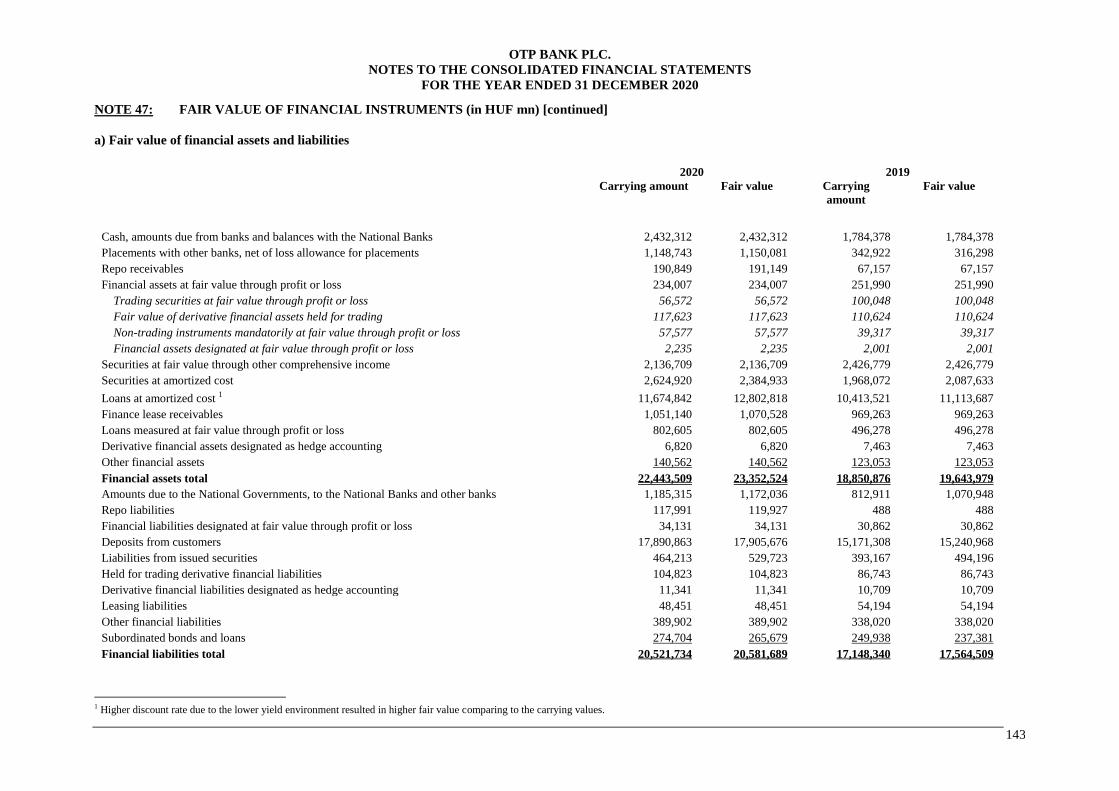
OTP BANK PLC.
NOTES TO THE CONSOLIDATED FINANCIAL STATEMENTS
FOR THE YEAR ENDED 31 DECEMBER 2020
143
NOTE 47: FAIR VALUE OF FINANCIAL INSTRUMENTS (in HUF mn) [continued]
a) Fair value of financial assets and liabilities
2020 2019
Carrying amount Fair value Carrying
amount
Fair value
Cash, amounts due from banks and balances with the National Banks 2,432,312 2,432,312 1,784,378 1,784,378
Placements with other banks, net of loss allowance for placements 1,148,743 1,150,081 342,922 316,298
Repo receivables 190,849 191,149 67,157 67,157
Financial assets at fair value through profit or loss 234,007 234,007 251,990 251,990
Trading securities at fair value through profit or loss 56,572 56,572 100,048 100,048
Fair value of derivative financial assets held for trading 117,623 117,623 110,624 110,624
Non-trading instruments mandatorily at fair value through profit or loss 57,577 57,577 39,317 39,317
Financial assets designated at fair value through profit or loss 2,235 2,235 2,001 2,001
Securities at fair value through other comprehensive income 2,136,709 2,136,709 2,426,779 2,426,779
Securities at amortized cost 2,624,920 2,384,933 1,968,072 2,087,633
Loans at amortized cost 1 11,674,842 12,802,818 10,413,521 11,113,687
Finance lease receivables 1,051,140 1,070,528 969,263 969,263
Loans measured at fair value through profit or loss 802,605 802,605 496,278 496,278
Derivative financial assets designated as hedge accounting 6,820 6,820 7,463 7,463
Other financial assets 140,562 140,562 123,053 123,053
Financial assets total 22,443,509 23,352,524 18,850,876 19,643,979
Amounts due to the National Governments, to the National Banks and other banks 1,185,315 1,172,036 812,911 1,070,948
Repo liabilities 117,991 119,927 488 488
Financial liabilities designated at fair value through profit or loss 34,131 34,131 30,862 30,862
Deposits from customers 17,890,863 17,905,676 15,171,308 15,240,968
Liabilities from issued securities 464,213 529,723 393,167 494,196
Held for trading derivative financial liabilities 104,823 104,823 86,743 86,743
Derivative financial liabilities designated as hedge accounting 11,341 11,341 10,709 10,709
Leasing liabilities 48,451 48,451 54,194 54,194
Other financial liabilities 389,902 389,902 338,020 338,020
Subordinated bonds and loans 274,704 265,679 249,938 237,381
Financial liabilities total 20,521,734 20,581,689 17,148,340 17,564,509
1 Higher discount rate due to the lower yield environment resulted in higher fair value comparing to the carrying values.
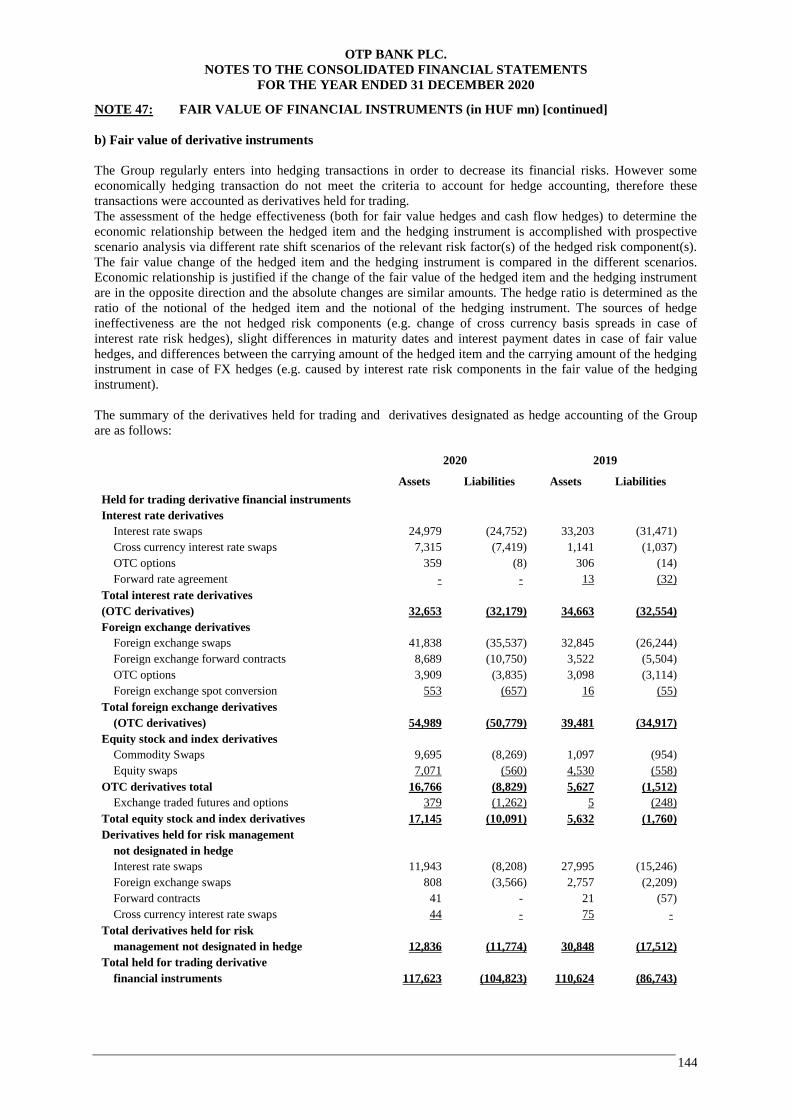
OTP BANK PLC.
NOTES TO THE CONSOLIDATED FINANCIAL STATEMENTS
FOR THE YEAR ENDED 31 DECEMBER 2020
144
NOTE 47: FAIR VALUE OF FINANCIAL INSTRUMENTS (in HUF mn) [continued]
b) Fair value of derivative instruments
The Group regularly enters into hedging transactions in order to decrease its financial risks. However some
economically hedging transaction do not meet the criteria to account for hedge accounting, therefore these
transactions were accounted as derivatives held for trading.
The assessment of the hedge effectiveness (both for fair value hedges and cash flow hedges) to determine the
economic relationship between the hedged item and the hedging instrument is accomplished with prospective
scenario analysis via different rate shift scenarios of the relevant risk factor(s) of the hedged risk component(s).
The fair value change of the hedged item and the hedging instrument is compared in the different scenarios.
Economic relationship is justified if the change of the fair value of the hedged item and the hedging instrument
are in the opposite direction and the absolute changes are similar amounts. The hedge ratio is determined as the
ratio of the notional of the hedged item and the notional of the hedging instrument. The sources of hedge
ineffectiveness are the not hedged risk components (e.g. change of cross currency basis spreads in case of
interest rate risk hedges), slight differences in maturity dates and interest payment dates in case of fair value
hedges, and differences between the carrying amount of the hedged item and the carrying amount of the hedging
instrument in case of FX hedges (e.g. caused by interest rate risk components in the fair value of the hedging
instrument).
The summary of the derivatives held for trading and derivatives designated as hedge accounting of the Group
are as follows:
2020 2019
Assets Liabilities Assets Liabilities
Held for trading derivative financial instruments
Interest rate derivatives
Interest rate swaps 24,979 (24,752) 33,203 (31,471)
Cross currency interest rate swaps 7,315 (7,419) 1,141 (1,037)
OTC options 359 (8) 306 (14)
Forward rate agreement - - 13 (32)
Total interest rate derivatives
(OTC derivatives) 32,653 (32,179) 34,663 (32,554)
Foreign exchange derivatives
Foreign exchange swaps 41,838 (35,537) 32,845 (26,244)
Foreign exchange forward contracts 8,689 (10,750) 3,522 (5,504)
OTC options 3,909 (3,835) 3,098 (3,114)
Foreign exchange spot conversion 553 (657) 16 (55)
Total foreign exchange derivatives
(OTC derivatives) 54,989 (50,779) 39,481 (34,917)
Equity stock and index derivatives
Commodity Swaps 9,695 (8,269) 1,097 (954)
Equity swaps 7,071 (560) 4,530 (558)
OTC derivatives total 16,766 (8,829) 5,627 (1,512)
Exchange traded futures and options 379 (1,262) 5 (248)
Total equity stock and index derivatives 17,145 (10,091) 5,632 (1,760)
Derivatives held for risk management
not designated in hedge
Interest rate swaps 11,943 (8,208) 27,995 (15,246)
Foreign exchange swaps 808 (3,566) 2,757 (2,209)
Forward contracts 41 - 21 (57)
Cross currency interest rate swaps 44 - 75 -
Total derivatives held for risk
management not designated in hedge 12,836 (11,774) 30,848 (17,512)
Total held for trading derivative
financial instruments 117,623 (104,823) 110,624 (86,743)

OTP BANK PLC.
NOTES TO THE CONSOLIDATED FINANCIAL STATEMENTS
FOR THE YEAR ENDED 31 DECEMBER 2020
145
NOTE 47: FAIR VALUE OF FINANCIAL INSTRUMENTS (in HUF mn) [continued]
b) Fair value of derivative instruments [continued]
2020 2019
Assets Liabilities Assets Liabilities
Derivative financial instruments designated
as hedge accounting
Derivatives designated in fair value hedges
Interest rate swaps 641 (5,334) 3,758 (8,839)
Cross currency interest rate swaps 6,179 (6,007) 3,705 (1,870)
Total derivatives designated in fair value hedges 6,820 (11,341) 7,463 (10,709)
Total derivatives held for risk management
(OTC derivatives) 6,820 (11,341) 7,463 (10,709)
c) Types of hedge accounting
Interest rate risk management is centralized at the Group. Interest rate risk exposures in major currencies are
managed at OTP Headquarter on consolidated level. Although risk exposures in local currencies are managed at
subsidiary level, the respective decisions are subject to Headquarter ALCO approval. Interest rate risk is
measured by simulating NII and EVE under different stress and plan scenarios, the established risk limits are
described in „OTP Bank’s Group-Level Regulations on the Management of Liquidity Risk and Interest Rate
Risk of Banking Book”. The interest rate risk management activity aims to stabilize NII within the approved risk
limits
The risk management objective of these hedge relationships is to mitigate the risk of clean fair value (i.e.
excluding accrued interest) change of MIRS loans due to the change of interest rate reference indexes (BUBOR,
EURIBOR, LIBOR, etc.) of the respective currency.
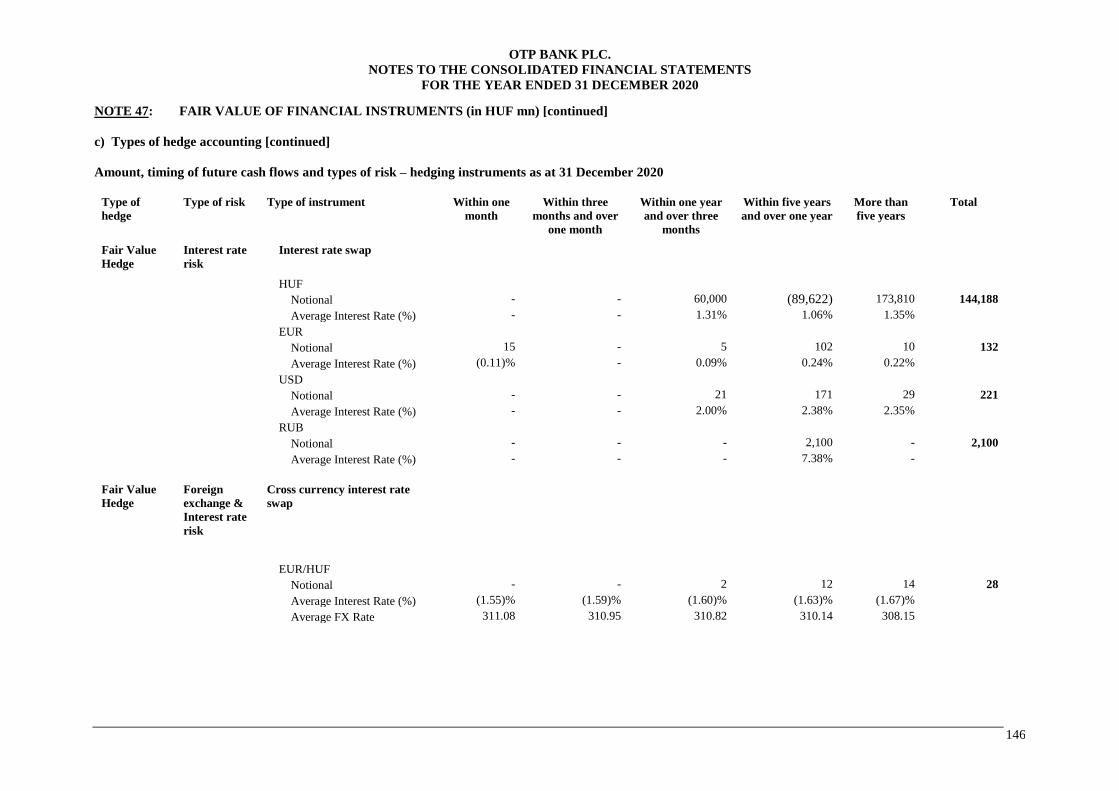
OTP BANK PLC.
NOTES TO THE CONSOLIDATED FINANCIAL STATEMENTS
FOR THE YEAR ENDED 31 DECEMBER 2020
146
NOTE 47: FAIR VALUE OF FINANCIAL INSTRUMENTS (in HUF mn) [continued]
c) Types of hedge accounting [continued]
Amount, timing of future cash flows and types of risk – hedging instruments as at 31 December 2020
Type of
hedge
Type of risk Type of instrument Within one
month
Within three
months and over
one month
Within one year
and over three
months
Within five years
and over one year
More than
five years
Total
Fair Value
Hedge
Interest rate
risk
Interest rate swap
HUF
Notional - - 60,000 (89,622) 173,810 144,188
Average Interest Rate (%) - - 1.31% 1.06% 1.35%
EUR
Notional 15 - 5 102 10 132
Average Interest Rate (%) (0.11)% - 0.09% 0.24% 0.22%
USD
Notional - - 21 171 29 221
Average Interest Rate (%) - - 2.00% 2.38% 2.35%
RUB
Notional - - - 2,100 - 2,100
Average Interest Rate (%) - - - 7.38% -
Fair Value
Hedge
Foreign
exchange &
Interest rate
risk
Cross currency interest rate
swap
EUR/HUF
Notional - - 2 12 14 28
Average Interest Rate (%) (1.55)% (1.59)% (1.60)% (1.63)% (1.67)%
Average FX Rate 311.08 310.95 310.82 310.14 308.15
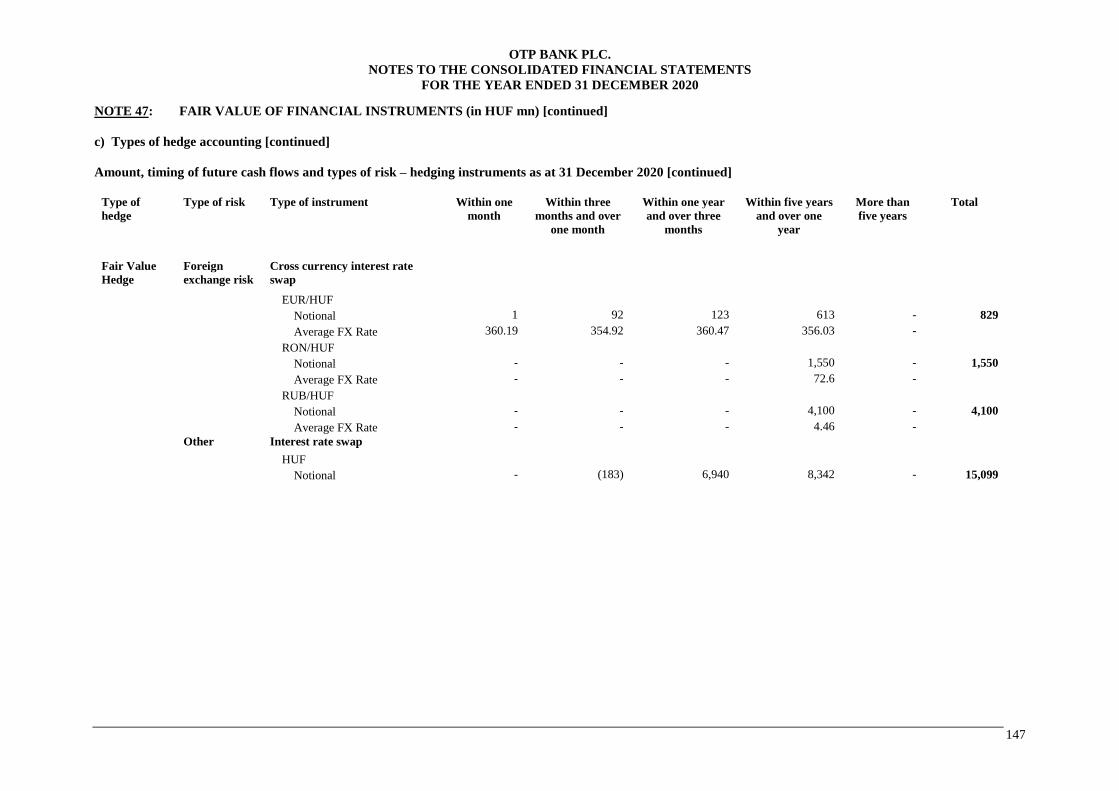
OTP BANK PLC.
NOTES TO THE CONSOLIDATED FINANCIAL STATEMENTS
FOR THE YEAR ENDED 31 DECEMBER 2020
147
NOTE 47: FAIR VALUE OF FINANCIAL INSTRUMENTS (in HUF mn) [continued]
c) Types of hedge accounting [continued]
Amount, timing of future cash flows and types of risk – hedging instruments as at 31 December 2020 [continued]
Type of
hedge
Type of risk Type of instrument Within one
month
Within three
months and over
one month
Within one year
and over three
months
Within five years
and over one
year
More than
five years
Total
Fair Value
Hedge
Foreign
exchange risk
Cross currency interest rate
swap
EUR/HUF
Notional 1 92 123 613 - 829
Average FX Rate 360.19 354.92 360.47 356.03 -
RON/HUF
Notional - - - 1,550 - 1,550
Average FX Rate - - - 72.6 -
RUB/HUF
Notional - - - 4,100 - 4,100
Average FX Rate - - - 4.46 -
Other Interest rate swap
HUF
Notional - (183) 6,940 8,342 - 15,099
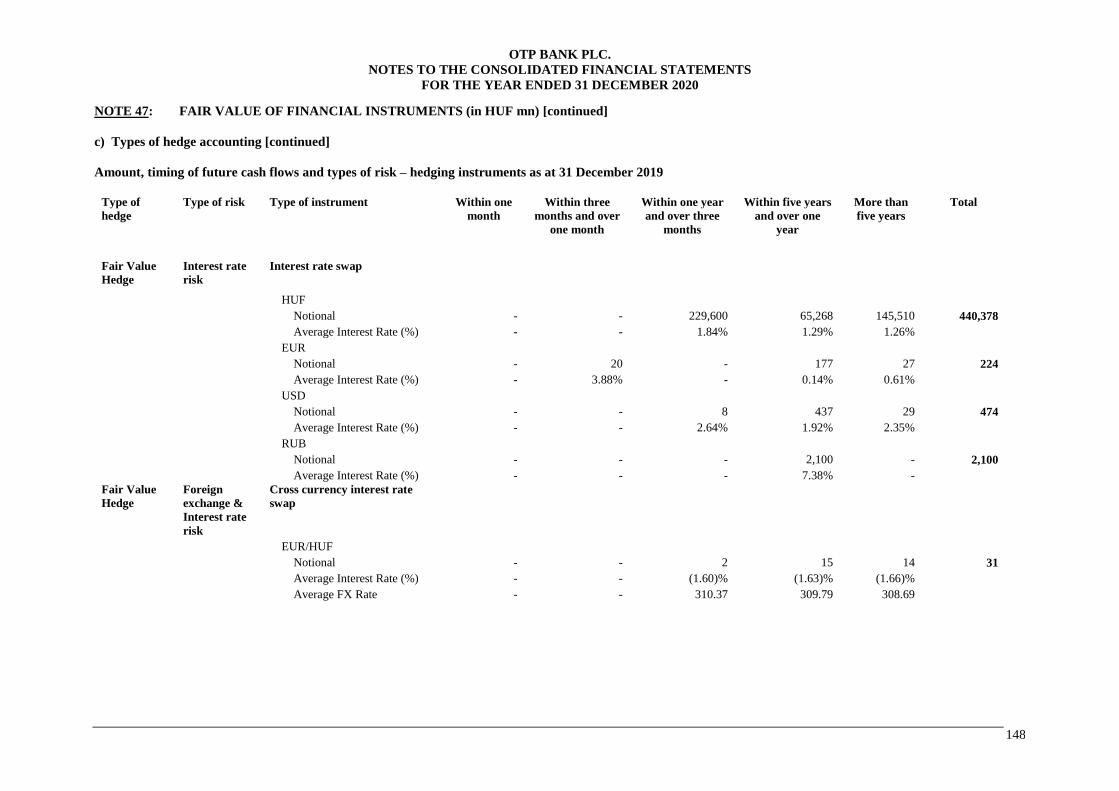
OTP BANK PLC.
NOTES TO THE CONSOLIDATED FINANCIAL STATEMENTS
FOR THE YEAR ENDED 31 DECEMBER 2020
148
NOTE 47: FAIR VALUE OF FINANCIAL INSTRUMENTS (in HUF mn) [continued]
c) Types of hedge accounting [continued]
Amount, timing of future cash flows and types of risk – hedging instruments as at 31 December 2019
Type of
hedge
Type of risk Type of instrument Within one
month
Within three
months and over
one month
Within one year
and over three
months
Within five years
and over one
year
More than
five years
Total
Fair Value
Hedge
Interest rate
risk
Interest rate swap
HUF
Notional - - 229,600 65,268 145,510 440,378
Average Interest Rate (%) - - 1.84% 1.29% 1.26%
EUR
Notional - 20 - 177 27 224
Average Interest Rate (%) - 3.88% - 0.14% 0.61%
USD
Notional - - 8 437 29 474
Average Interest Rate (%) - - 2.64% 1.92% 2.35%
RUB
Notional - - - 2,100 - 2,100
Average Interest Rate (%) - - - 7.38% -
Fair Value
Hedge
Foreign
exchange &
Interest rate
risk
Cross currency interest rate
swap
EUR/HUF
Notional - - 2 15 14 31
Average Interest Rate (%) - - (1.60)% (1.63)% (1.66)%
Average FX Rate - - 310.37 309.79 308.69
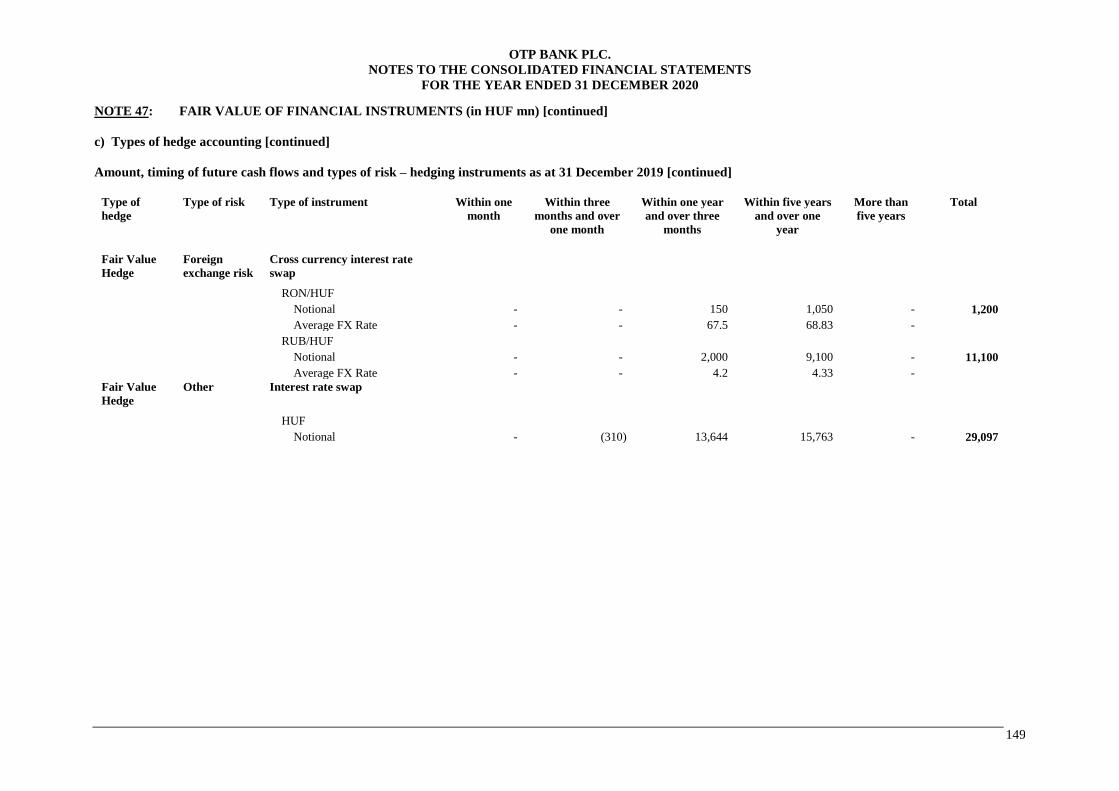
OTP BANK PLC.
NOTES TO THE CONSOLIDATED FINANCIAL STATEMENTS
FOR THE YEAR ENDED 31 DECEMBER 2020
149
NOTE 47: FAIR VALUE OF FINANCIAL INSTRUMENTS (in HUF mn) [continued]
c) Types of hedge accounting [continued]
Amount, timing of future cash flows and types of risk – hedging instruments as at 31 December 2019 [continued]
Type of
hedge
Type of risk Type of instrument Within one
month
Within three
months and over
one month
Within one year
and over three
months
Within five years
and over one
year
More than
five years
Total
Fair Value
Hedge
Foreign
exchange risk
Cross currency interest rate
swap
RON/HUF
Notional - - 150 1,050 - 1,200
Average FX Rate - - 67.5 68.83 -
RUB/HUF
Notional - - 2,000 9,100 - 11,100
Average FX Rate - - 4.2 4.33 -
Fair Value
Hedge
Other Interest rate swap
HUF
Notional - (310) 13,644 15,763 - 29,097

OTP BANK PLC.
NOTES TO THE CONSOLIDATED FINANCIAL STATEMENTS
FOR THE YEAR ENDED 31 DECEMBER 2020
150
NOTE 47: FAIR VALUE OF FINANCIAL INSTRUMENTS (in HUF mn) [continued]
c) Types of hedge accounting [continued]
As at 31 December 2020 is as follows:
Type of
hedge
Type of instrument Type of risk Nominal
amount of the
hedging
instrument
Carrying amount of the
hedging instrument as at 31
December 2020
Line item in the statement of
financial position where the
hedging instrument is located
Changes in fair value used for
calculating hedge
ineffectiveness for the year
ended as at 31 December 2020
Assets Liabilities
Fair value
hedge Interest rate swap Interest rate risk 468,574 111 (5,267) Derivative financial instruments (370)
designated as hedge accounting
Cross-currency swap FX & IR risk 8,874 - (1,618) Derivative financial instruments (36)
designated as hedge accounting
Cross-currency swap FX risk 438,401 6,179 (4,456) Derivative financial instruments (809)
designated as hedge accounting
Interest rate swap Other 16,224 530 - Derivative financial instruments 2
designated as hedge accounting
Fair value hedges total 932,073 6,820 (11,341) (1,213)
As at 31 December 2019 is as follows:
Type of
hedge
Type of instrument Type of risk Nominal
amount of the
hedging
instrument
Carrying amount of the
hedging instrument as at 31
December 2019
Line item in the statement of
financial position where the
hedging instrument is located
Changes in fair value used for
calculating hedge
ineffectiveness for the year
ended as at 31 December 2019
Assets Liabilities
Fair value
hedge Interest rate swap Interest rate risk 687,820 2,251 (8,839) Derivative financial instruments 341
designated as hedge accounting
Cross-currency swap FX & IR risk 11,681 - (488) Derivative financial instruments (103)
designated as hedge accounting
Cross-currency swap FX risk 137,390 3,705 (1,382) Derivative financial instruments (271)
designated as hedge accounting
Interest rate swap Other 30,983 1,507 - Derivative financial instruments 7
designated as hedge accounting
Fair value hedges total 867,874 7,463 (10,709)
(26)
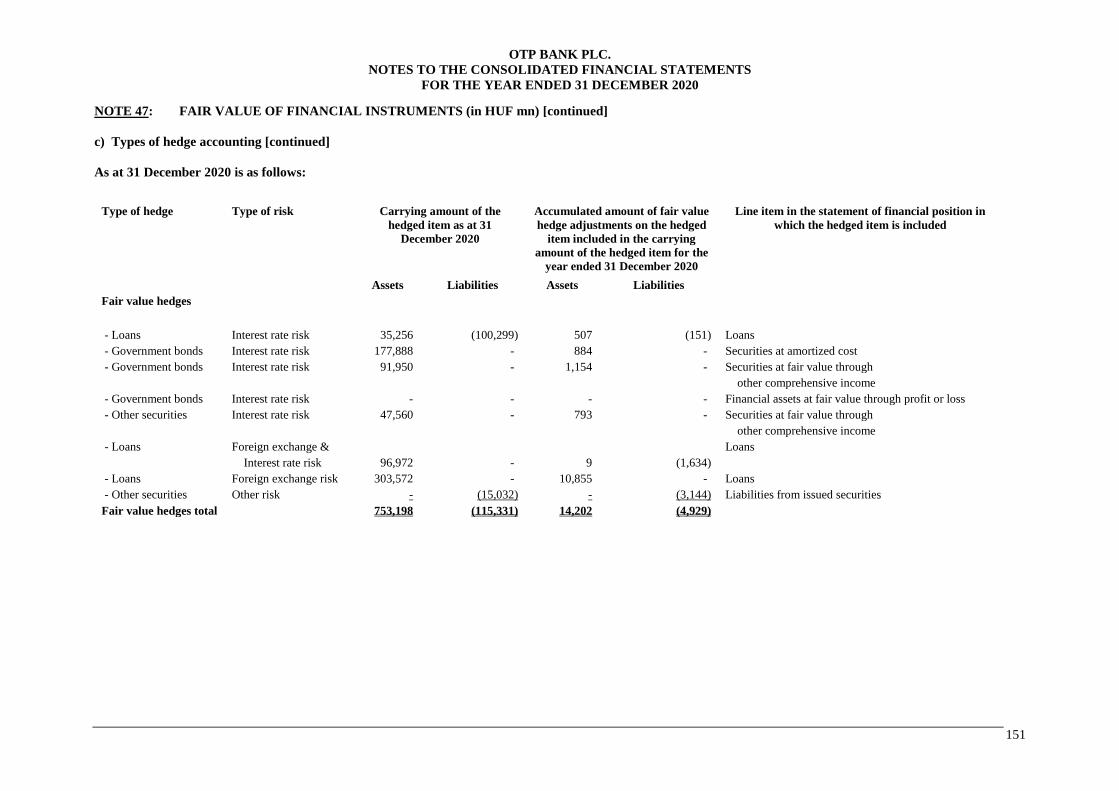
OTP BANK PLC.
NOTES TO THE CONSOLIDATED FINANCIAL STATEMENTS
FOR THE YEAR ENDED 31 DECEMBER 2020
151
NOTE 47: FAIR VALUE OF FINANCIAL INSTRUMENTS (in HUF mn) [continued]
c) Types of hedge accounting [continued]
As at 31 December 2020 is as follows:
Type of hedge Type of risk Carrying amount of the
hedged item as at 31
December 2020
Accumulated amount of fair value
hedge adjustments on the hedged
item included in the carrying
amount of the hedged item for the
year ended 31 December 2020
Line item in the statement of financial position in
which the hedged item is included
Assets Liabilities Assets Liabilities
Fair value hedges
- Loans Interest rate risk 35,256 (100,299) 507 (151) Loans
- Government bonds Interest rate risk 177,888 - 884 - Securities at amortized cost
- Government bonds Interest rate risk 91,950 - 1,154 - Securities at fair value through
other comprehensive income
- Government bonds Interest rate risk - - - - Financial assets at fair value through profit or loss
- Other securities Interest rate risk 47,560 - 793 - Securities at fair value through
other comprehensive income
- Loans Foreign exchange & Loans
Interest rate risk 96,972 - 9 (1,634)
- Loans Foreign exchange risk 303,572 - 10,855 - Loans
- Other securities Other risk - (15,032) - (3,144) Liabilities from issued securities
Fair value hedges total 753,198 (115,331) 14,202 (4,929)
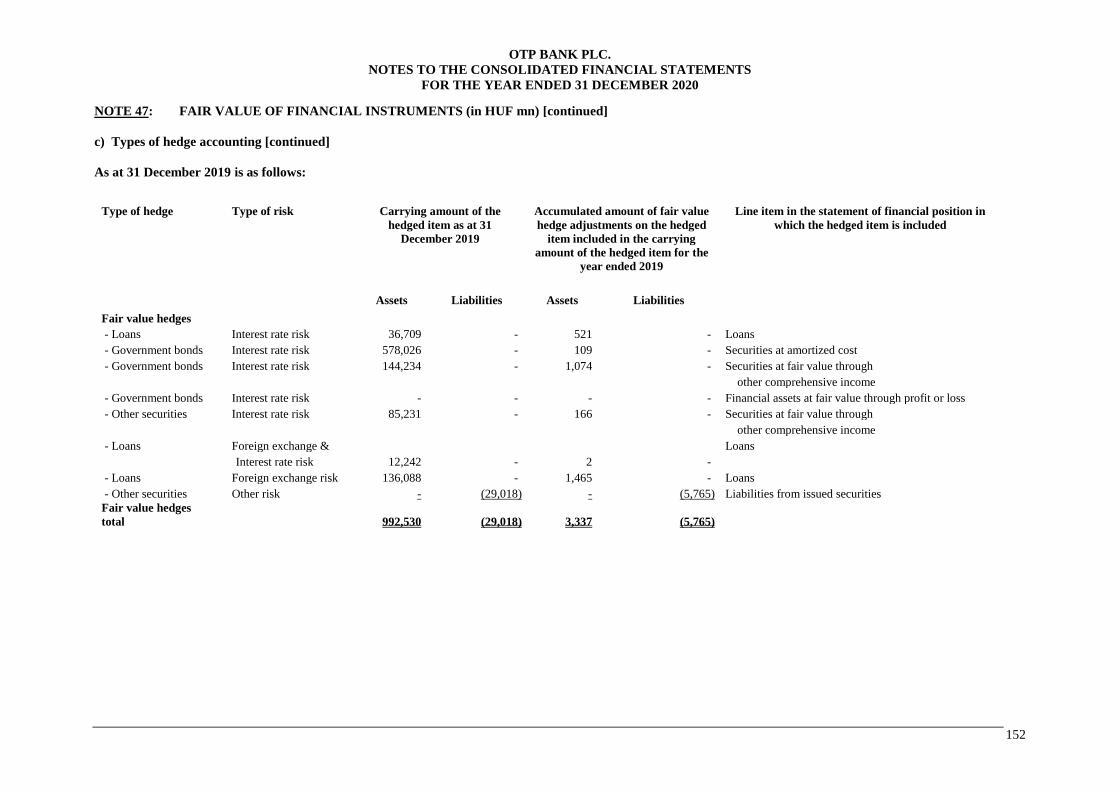
OTP BANK PLC.
NOTES TO THE CONSOLIDATED FINANCIAL STATEMENTS
FOR THE YEAR ENDED 31 DECEMBER 2020
152
NOTE 47: FAIR VALUE OF FINANCIAL INSTRUMENTS (in HUF mn) [continued]
c) Types of hedge accounting [continued]
As at 31 December 2019 is as follows:
Type of hedge Type of risk Carrying amount of the
hedged item as at 31
December 2019
Accumulated amount of fair value
hedge adjustments on the hedged
item included in the carrying
amount of the hedged item for the
year ended 2019
Line item in the statement of financial position in
which the hedged item is included
Assets Liabilities Assets Liabilities
Fair value hedges
- Loans Interest rate risk 36,709 - 521 - Loans
- Government bonds Interest rate risk 578,026 - 109 - Securities at amortized cost
- Government bonds Interest rate risk 144,234 - 1,074 - Securities at fair value through
other comprehensive income
- Government bonds Interest rate risk - - - - Financial assets at fair value through profit or loss
- Other securities Interest rate risk 85,231 - 166 - Securities at fair value through
other comprehensive income
- Loans Foreign exchange & Loans
Interest rate risk 12,242 - 2 -
- Loans Foreign exchange risk 136,088 - 1,465 - Loans
- Other securities Other risk - (29,018) - (5,765) Liabilities from issued securities
Fair value hedges
total
992,530 (29,018) 3,337 (5,765)
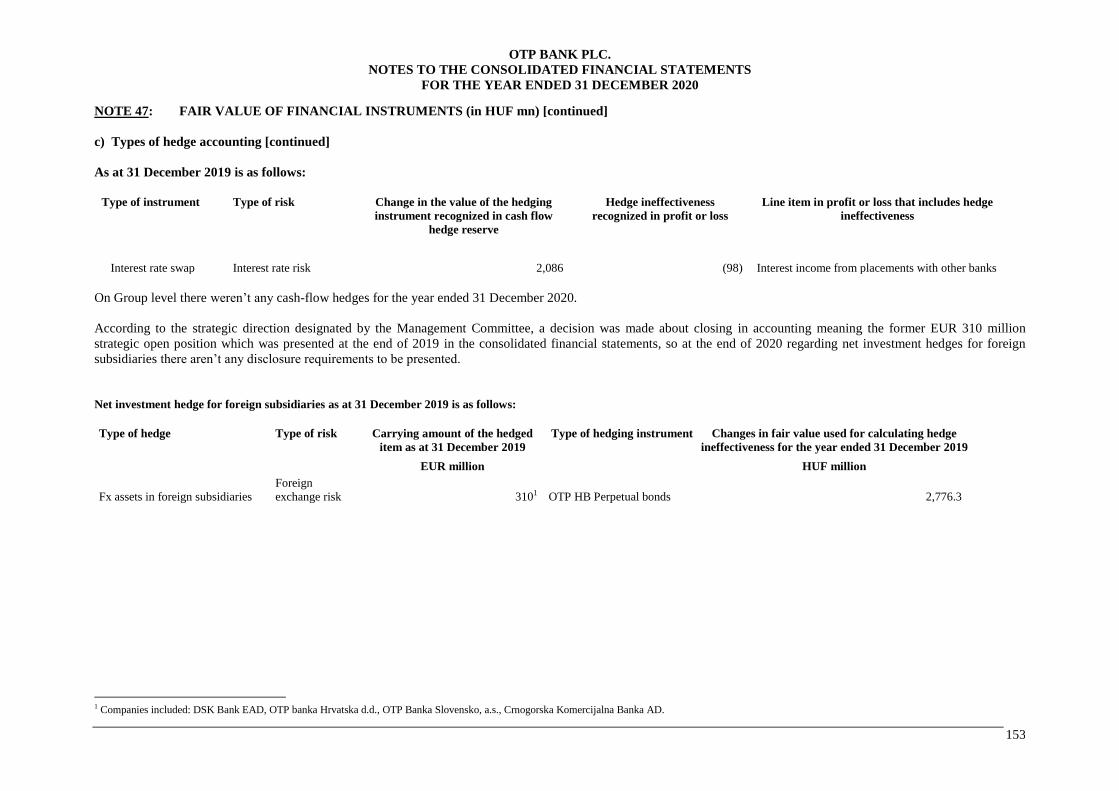
OTP BANK PLC.
NOTES TO THE CONSOLIDATED FINANCIAL STATEMENTS
FOR THE YEAR ENDED 31 DECEMBER 2020
153
NOTE 47: FAIR VALUE OF FINANCIAL INSTRUMENTS (in HUF mn) [continued]
c) Types of hedge accounting [continued]
As at 31 December 2019 is as follows:
Type of instrument Type of risk Change in the value of the hedging
instrument recognized in cash flow
hedge reserve
Hedge ineffectiveness
recognized in profit or loss
Line item in profit or loss that includes hedge
ineffectiveness
Interest rate swap Interest rate risk 2,086 (98) Interest income from placements with other banks
On Group level there weren’t any cash-flow hedges for the year ended 31 December 2020.
According to the strategic direction designated by the Management Committee, a decision was made about closing in accounting meaning the former EUR 310 million
strategic open position which was presented at the end of 2019 in the consolidated financial statements, so at the end of 2020 regarding net investment hedges for foreign
subsidiaries there aren’t any disclosure requirements to be presented.
Net investment hedge for foreign subsidiaries as at 31 December 2019 is as follows: Type of hedge Type of risk Carrying amount of the hedged
item as at 31 December 2019
Type of hedging instrument Changes in fair value used for calculating hedge
ineffectiveness for the year ended 31 December 2019
EUR million HUF million
Fx assets in foreign subsidiaries
Foreign
exchange risk 3101 OTP HB Perpetual bonds 2,776.3
1 Companies included: DSK Bank EAD, OTP banka Hrvatska d.d., OTP Banka Slovensko, a.s., Crnogorska Komercijalna Banka AD.
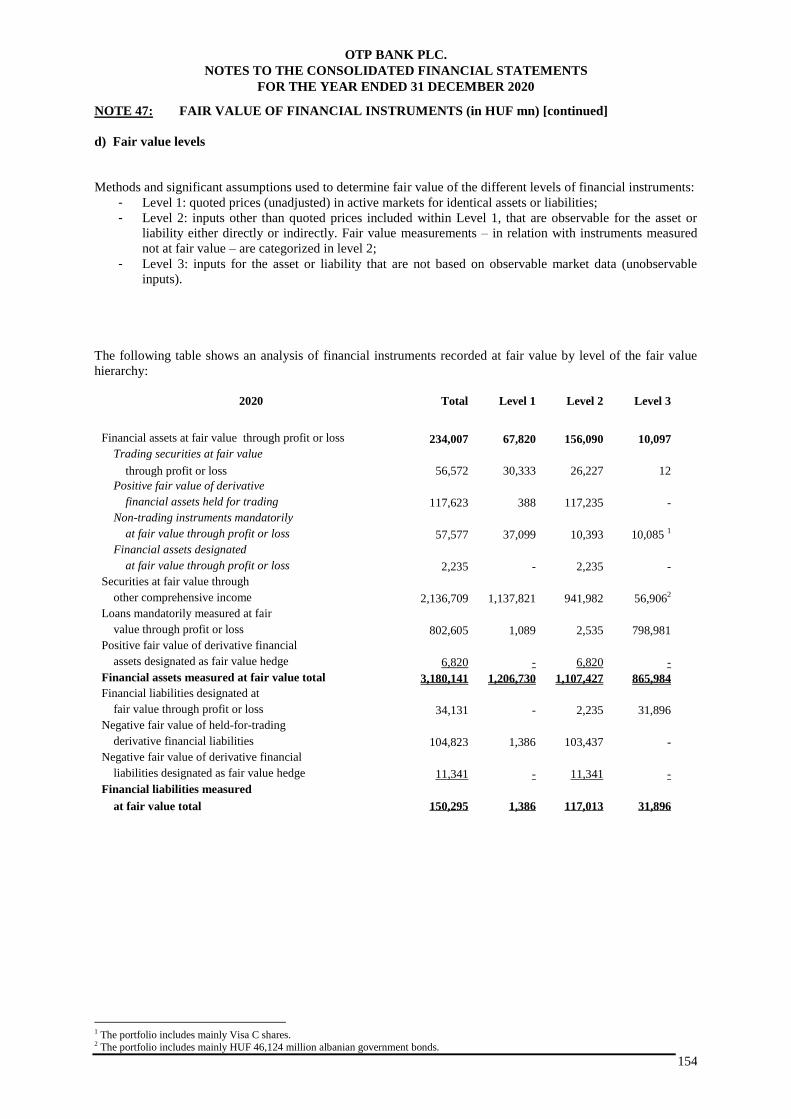
OTP BANK PLC.
NOTES TO THE CONSOLIDATED FINANCIAL STATEMENTS
FOR THE YEAR ENDED 31 DECEMBER 2020
154
NOTE 47: FAIR VALUE OF FINANCIAL INSTRUMENTS (in HUF mn) [continued]
d) Fair value levels
Methods and significant assumptions used to determine fair value of the different levels of financial instruments:
- Level 1: quoted prices (unadjusted) in active markets for identical assets or liabilities;
- Level 2: inputs other than quoted prices included within Level 1, that are observable for the asset or
liability either directly or indirectly. Fair value measurements – in relation with instruments measured
not at fair value – are categorized in level 2;
- Level 3: inputs for the asset or liability that are not based on observable market data (unobservable
inputs).
The following table shows an analysis of financial instruments recorded at fair value by level of the fair value
hierarchy:
2020 Total Level 1 Level 2 Level 3
Financial assets at fair value through profit or loss 234,007 67,820 156,090 10,097
Trading securities at fair value
through profit or loss 56,572 30,333 26,227 12
Positive fair value of derivative
financial assets held for trading 117,623 388 117,235 -
Non-trading instruments mandatorily
at fair value through profit or loss 57,577 37,099 10,393 10,085 1
Financial assets designated
at fair value through profit or loss 2,235 - 2,235 -
Securities at fair value through
other comprehensive income 2,136,709 1,137,821 941,982 56,9062
Loans mandatorily measured at fair
value through profit or loss 802,605 1,089 2,535 798,981
Positive fair value of derivative financial
assets designated as fair value hedge 6,820 - 6,820 -
Financial assets measured at fair value total 3,180,141 1,206,730 1,107,427 865,984
Financial liabilities designated at
fair value through profit or loss 34,131 - 2,235 31,896
Negative fair value of held-for-trading
derivative financial liabilities 104,823 1,386 103,437 -
Negative fair value of derivative financial
liabilities designated as fair value hedge 11,341 - 11,341 -
Financial liabilities measured
at fair value total 150,295 1,386 117,013 31,896
1 The portfolio includes mainly Visa C shares. 2 The portfolio includes mainly HUF 46,124 million albanian government bonds.
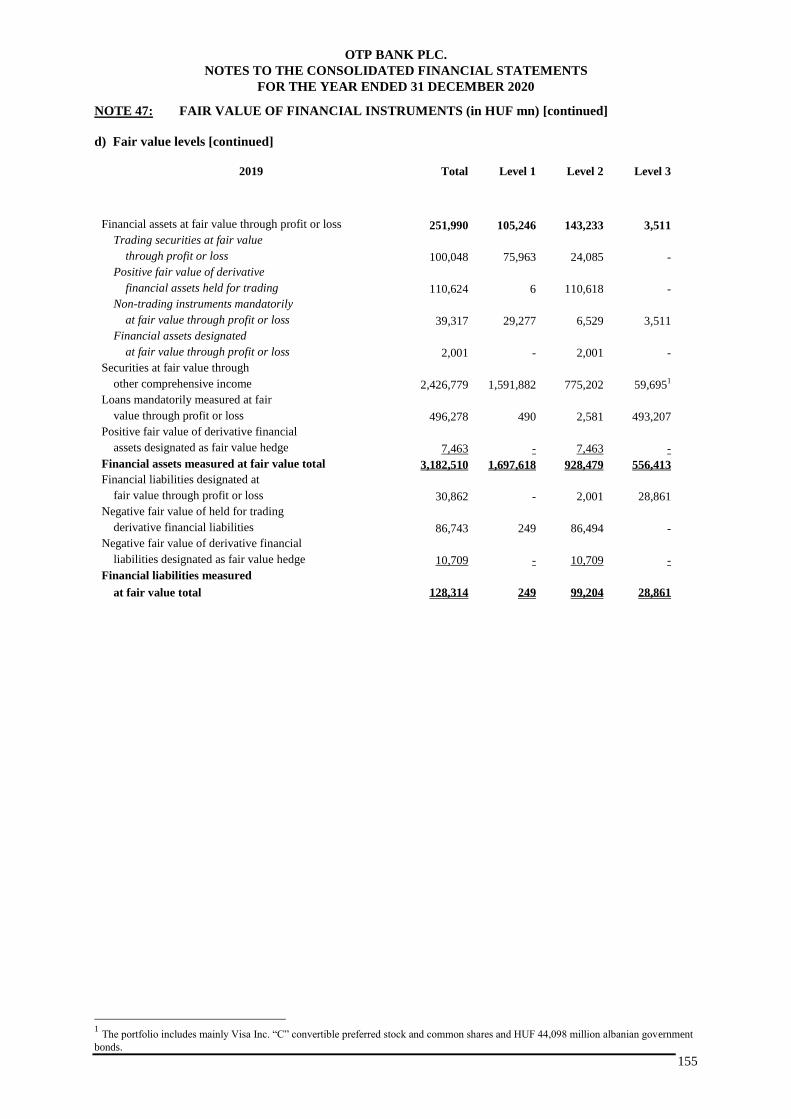
OTP BANK PLC.
NOTES TO THE CONSOLIDATED FINANCIAL STATEMENTS
FOR THE YEAR ENDED 31 DECEMBER 2020
155
NOTE 47: FAIR VALUE OF FINANCIAL INSTRUMENTS (in HUF mn) [continued]
d) Fair value levels [continued]
2019 Total Level 1 Level 2 Level 3
Financial assets at fair value through profit or loss 251,990 105,246 143,233 3,511
Trading securities at fair value
through profit or loss 100,048 75,963 24,085 -
Positive fair value of derivative
financial assets held for trading 110,624 6 110,618 -
Non-trading instruments mandatorily
at fair value through profit or loss 39,317 29,277 6,529 3,511
Financial assets designated
at fair value through profit or loss 2,001 - 2,001 -
Securities at fair value through
other comprehensive income 2,426,779 1,591,882 775,202 59,6951
Loans mandatorily measured at fair
value through profit or loss 496,278 490 2,581 493,207
Positive fair value of derivative financial
assets designated as fair value hedge 7,463 - 7,463 -
Financial assets measured at fair value total 3,182,510 1,697,618 928,479 556,413
Financial liabilities designated at
fair value through profit or loss 30,862 - 2,001 28,861
Negative fair value of held for trading
derivative financial liabilities 86,743 249 86,494 -
Negative fair value of derivative financial
liabilities designated as fair value hedge 10,709 - 10,709 -
Financial liabilities measured
at fair value total 128,314 249 99,204 28,861
1 The portfolio includes mainly Visa Inc. “C” convertible preferred stock and common shares and HUF 44,098 million albanian government
bonds.
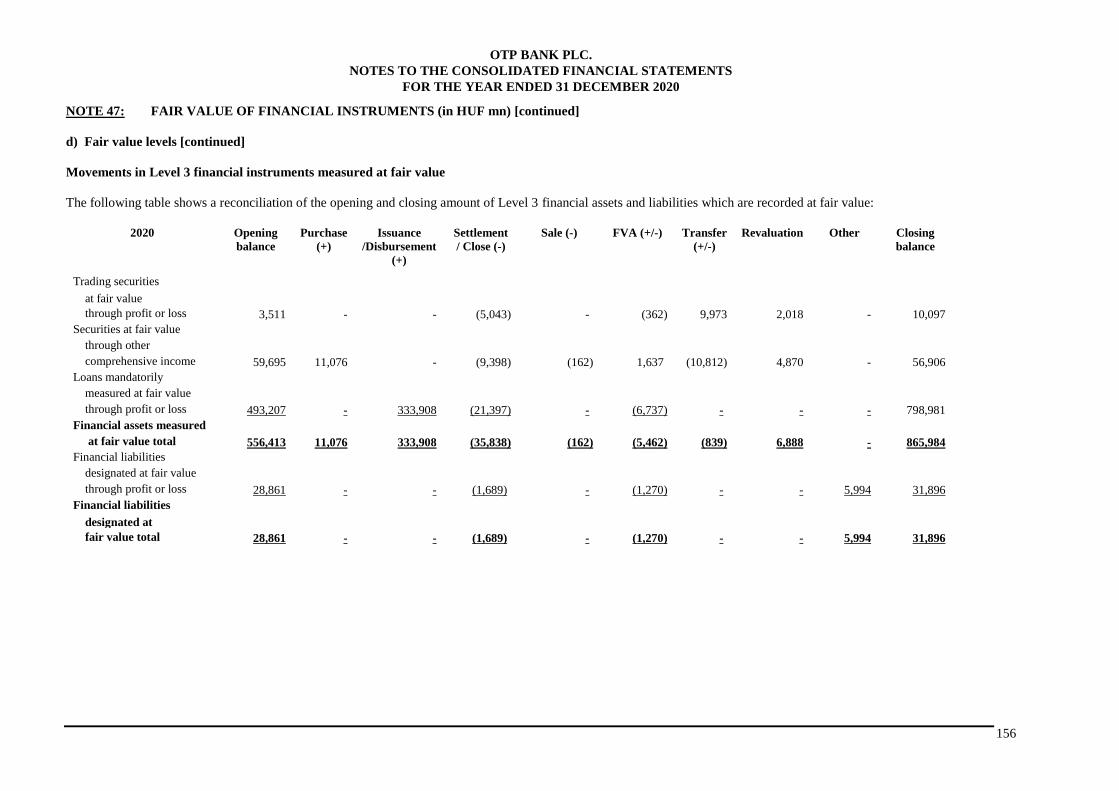
OTP BANK PLC.
NOTES TO THE CONSOLIDATED FINANCIAL STATEMENTS
FOR THE YEAR ENDED 31 DECEMBER 2020
156
NOTE 47: FAIR VALUE OF FINANCIAL INSTRUMENTS (in HUF mn) [continued]
d) Fair value levels [continued]
Movements in Level 3 financial instruments measured at fair value
The following table shows a reconciliation of the opening and closing amount of Level 3 financial assets and liabilities which are recorded at fair value:
2020 Opening
balance
Purchase
(+)
Issuance
/Disbursement
(+)
Settlement
/ Close (-)
Sale (-) FVA (+/-) Transfer
(+/-)
Revaluation Other Closing
balance
Trading securities
at fair value
through profit or loss 3,511 - - (5,043) - (362) 9,973 2,018 - 10,097
Securities at fair value
through other
comprehensive income 59,695 11,076 - (9,398) (162) 1,637 (10,812) 4,870 - 56,906
Loans mandatorily
measured at fair value
through profit or loss 493,207 - 333,908 (21,397) - (6,737) - - - 798,981
Financial assets measured
at fair value total 556,413 11,076 333,908 (35,838) (162) (5,462) (839) 6,888 - 865,984
Financial liabilities
designated at fair value
through profit or loss 28,861 - - (1,689) - (1,270) - - 5,994 31,896
Financial liabilities
designated at
fair value total 28,861 - - (1,689) - (1,270) - - 5,994 31,896
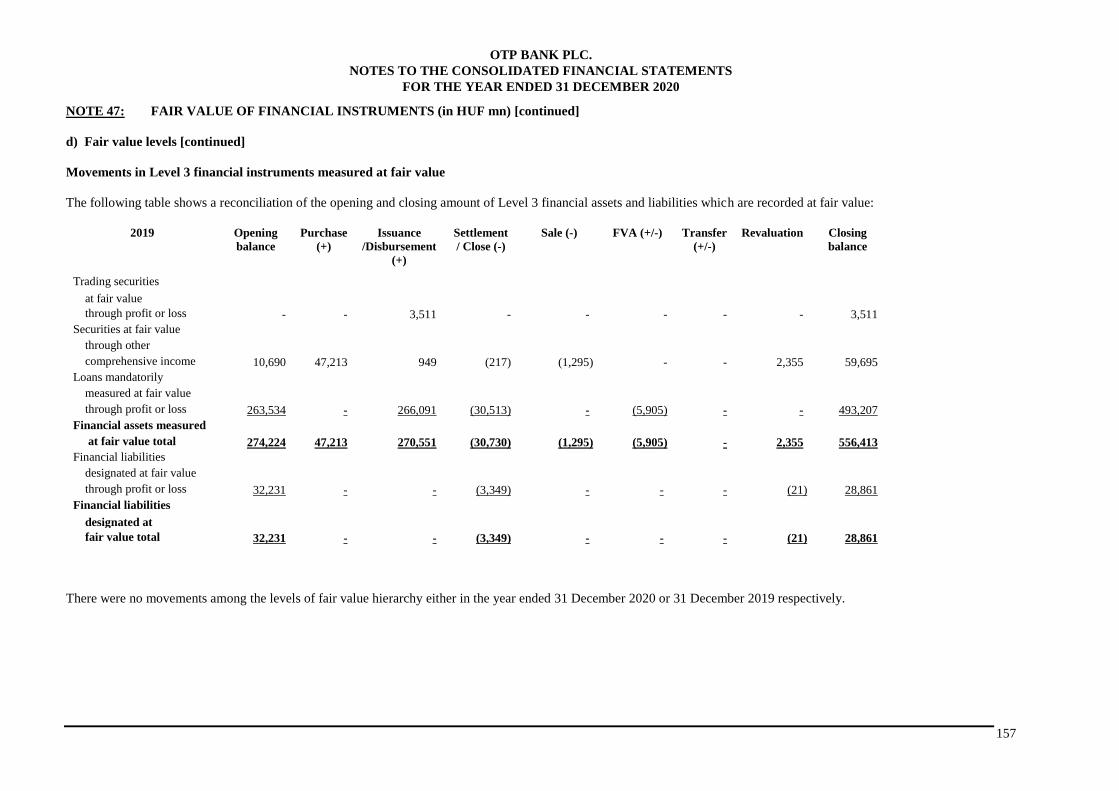
OTP BANK PLC.
NOTES TO THE CONSOLIDATED FINANCIAL STATEMENTS
FOR THE YEAR ENDED 31 DECEMBER 2020
157
NOTE 47: FAIR VALUE OF FINANCIAL INSTRUMENTS (in HUF mn) [continued]
d) Fair value levels [continued]
Movements in Level 3 financial instruments measured at fair value
The following table shows a reconciliation of the opening and closing amount of Level 3 financial assets and liabilities which are recorded at fair value:
2019 Opening
balance
Purchase
(+)
Issuance
/Disbursement
(+)
Settlement
/ Close (-)
Sale (-) FVA (+/-) Transfer
(+/-)
Revaluation Closing
balance
Trading securities
at fair value
through profit or loss - - 3,511 - - - - - 3,511
Securities at fair value
through other
comprehensive income 10,690 47,213 949 (217) (1,295) - - 2,355 59,695
Loans mandatorily
measured at fair value
through profit or loss 263,534 - 266,091 (30,513) - (5,905) - - 493,207
Financial assets measured
at fair value total 274,224 47,213 270,551 (30,730) (1,295) (5,905) - 2,355 556,413
Financial liabilities
designated at fair value
through profit or loss 32,231 - - (3,349) - - - (21) 28,861
Financial liabilities
designated at
fair value total 32,231 - - (3,349) - - - (21) 28,861
There were no movements among the levels of fair value hierarchy either in the year ended 31 December 2020 or 31 December 2019 respectively.
OTP BANK PLC.
NOTES TO THE CONSOLIDATED FINANCIAL STATEMENTS
FOR THE YEAR ENDED 31 DECEMBER 2020
158
NOTE 48: SEGMENT REPORTING BY BUSINESS AND GEOGRAPHICAL SEGMENTS
(in HUF mn)
The Group distinguishes business and geographical segments. The report on the base of the business and
geographical segments is reported below.
The operations in the Slovakian segment were discontinued. The segment information reported on the next pages
does not include any amounts for these discontinued operations neither in the current year nor in the previous
one, which are described in more details in Note 49.
The reportable segments of the Group on the base of IFRS 8 are the following:
OTP Core Hungary, Russia, Ukraine, Bulgaria, Romania, Serbia, Croatia, Montenegro, Albania, Moldova,
Slovenia, Merkantil Group, Asset Management subsidiaries, Other subsidiaries and Corporate Center.
OTP Core is an economic unit for measuring the result of core business activity of the Group in Hungary.
Financials for OTP Core are calculated from the partially consolidated financial statements of the companies
engaged in the Group’s underlying banking operation in Hungary. These companies include OTP Bank Hungary
Plc., OTP Mortgage Bank Ltd., OTP Building Society Ltd., OTP Factoring Ltd., OTP Financial Point Ltd., and
companies providing intragroup financing. The Bank Employee Stock Ownership Plan Organization was
included from the fourth quarter of 2016; OTP Card Factory Ltd., OTP Facility Management Llc., Monicomp
Ltd. and OTP Real Estate Lease Ltd. were included from the first quarter of 2017 (from the first quarter of 2019
OTP Real Estate Lease Ltd. was eliminated from OTP Core); OTP Mobile Service Llc., OTP Ingatlanpont Llc.
were included from the first quarter of 2019 and OTP eBIZ Ltd was included from the first quarter of 2020. The
consolidated accounting results of these companies are segmented into OTP Core and Corporate Centre. Latter is
a virtual entity.
Within the Group, the Corporate Centre acts as a virtual entity established by the equity investment of OTP Core
for managing the wholesale financing activity for all the subsidiaries within the Group but outside OTP Core.
Therefore the balance sheet of the Corporate Centre is funded by the equity and intragroup lending received from
OTP Core, the intragroup lending received from other subsidiaries, and the subordinated debt and senior notes
arranged by OTP under its running EMTN program.
From this funding pool, the Corporate Centre is to provide intragroup lending to, and hold equity stakes in OTP
subsidiaries outside OTP Core. Main subsidiaries financed by Corporate Centre are as follows: Hungarians:
Merkantil Bank Ltd, Merkantil Leasing Ltd, OTP Fund Management Ltd, OTP Real Estate Fund Management
Ltd, OTP Life Annuity Ltd; foreigners: banks, leasing companies, factoring companies.
The results of OTP Factoring Ukraine LLC, OTP Factoring SRL, OTP Factoring Bulgaria LLC, OTP Factoring
Serbia d.o.o., and OTP Factoring Montenegro d.o.o. are included into the foreign banks segment.
From the first quarter of 2019 Expressbank AD and its subsidiaries, OTP Leasing EOOD and Express Factoring
EOOD (altogether: Express Group) were included into the Bulgarian operation, so from the first quarter of 2019
the statement of recognized income and balance sheet of DSK Leasing AD was included into this segment too.
The Bulgarian Expressbank AD merged with its parent DSK Bank AD in April 2020.
The Serbian segment, OTP banka Srbija AD Beograd and Vojvodjanska Banka a.d. Novi Sad includes from the
first quarter of 2019 the statements of profit or loss and financial positions of OTP Lizing d.o.o, OTP Services
d.o.o. and from the third quarter of 2019 the financial position of the newly acquired OTP banka Srbija AD
Beograd and from the fourth quarter of 2019 its statement of profit or loss too.
The Montenegrin segment, Crnogorska Komercijalna Banka a.d. and Podgoricka banka a.d. includes from the
third quarter of 2019 the statement of profit or loss and financial position of the newly acquired Podgoricka
banka a.d. In December 2020 Podgoricka banka a.d. merged into Crnogorska Komercijalna Banka a.d.
In the first quarter of 2019 the Albanian, and from the second half of year 2019 the Moldovan and Slovenian
segments were included as new segments in the consolidated segment report.
The activities of the other subsidiaries are out of the leasing and fund management and factoring activity, such
as: OTP Real Estate Ltd., OTP Life Annuity Ltd, OTP Funds Servicing and Consulting Ltd., OTP Building
s.r.o., OTP Real Slovensko s.r.o.
OTP BANK PLC.
NOTES TO THE CONSOLIDATED FINANCIAL STATEMENTS
FOR THE YEAR ENDED 31 DECEMBER 2020
159
NOTE 48: SEGMENT REPORTING BY BUSINESS AND GEOGRAPHICAL SEGMENTS (in
HUF mn) [continued]
The reportable business and geographical segments of the Group are those components where:
- separated income and ex penses, assets and liabilities can be identified and assignable to the segments,
- transactions between the different segments were eliminated,
- the main decisive board of the Group regularly controls the operating results,
- separated financial information is available.
Adjustments
Goodwill / investment impairment and their tax saving effect:
As at 31 December 2020 HUF 9,841 million impairment was booked on the investment in OTP Bank Romania
S.A. on which HUF 886 million positive tax effect was recognized. As at 31 December 2019 HUF 8,427 million
was recognized on goodwill / investment impairment from which HUF 4,887 million was recognized on OTP
Bank Romania S.A as goodwill impairment and HUF 3,540 million negative tax effect was recognized due to the
impairment and release of impairment on investments, which is mainly related to the release of the previously
recognized impairment on OTP Bank JSC (Ukraine).
Special tax on financial institutions (after income tax):
Special tax on financial institutions includes the special tax paid by the Hungarian financial institutions, the net
present value effect of the once-off additional banking tax payable into the pandemic fund in 2020 (the payments
are deductible from future banking taxes), the Slovakian banking levy and as well as in the fourth quarter of
2019 the banking tax paid by the Romanian bank, subsidiary of OTP Group. Besides, it also contains the
Slovakian Deposit Protection Fund contributions being introduced again in 2014, and the contribution into the
Resolution Fund in Slovakia, too.
Effect of acquisitions (after income tax):
The following main items appear on this line: the negative goodwill related to acquisitions which improves the
accounting result, integration costs of the newly acquired banks and other direct effects due to the acquisitions
(such as customer base value amortisation) and effects related to the sale of the Slovakian bank.
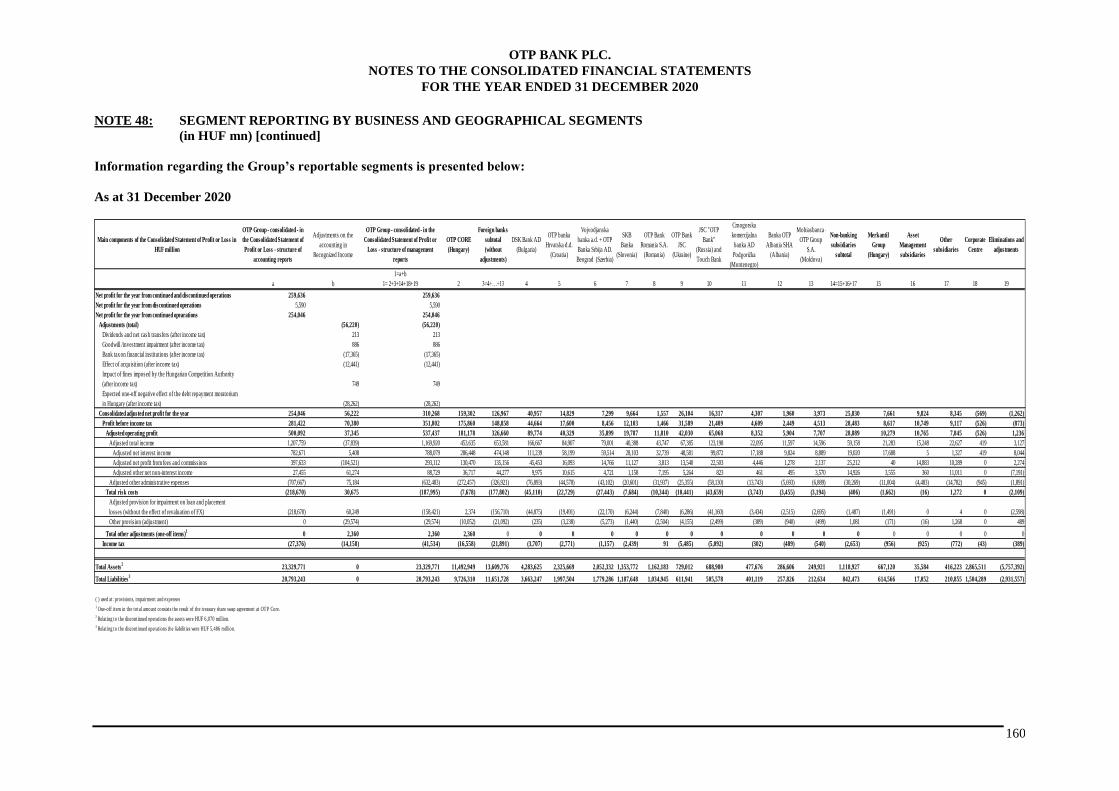
OTP BANK PLC.
NOTES TO THE CONSOLIDATED FINANCIAL STATEMENTS
FOR THE YEAR ENDED 31 DECEMBER 2020
160
NOTE 48: SEGMENT REPORTING BY BUSINESS AND GEOGRAPHICAL SEGMENTS
(in HUF mn) [continued]
Information regarding the Group’s reportable segments is presented below:
As at 31 December 2020
Main components of the Consolidated Statement of Profit or Loss in
HUF million
OTP Group - consolidated - in
the Consolidated Statement of
Profit or Loss - structure of
accounting reports
Adjustments on the
accounting in
Recognized Income
OTP Group - consolidated - in the
Consolidated Statement of Profit or
Loss - structure of management
reports
OTP CORE
(Hungary)
Foreign banks
subtotal
(without
adjustments)
DSK Bank AD
(Bulgaria)
OTP banka
Hrvatska d.d.
(Croatia)
Vojvodjanska
banka a.d. + OTP
Banka Srbija AD.
Beograd (Szerbia)
SKB
Banka
(Slovenia)
OTP Bank
Romania S.A.
(Romania)
OTP Bank
JSC
(Ukraine)
JSC "OTP
Bank"
(Russia) and
Touch Bank
Crnogorska
komercijalna
banka AD
Podgorička
(Montenegro)
Banka OTP
Albania SHA
(Albania)
Mobiasbanca -
OTP Group
S.A.
(Moldova)
Non-banking
subsidiaries
subtotal
Merkantil
Group
(Hungary)
Asset
Management
subsidiaries
Other
subsidiaries
Corporate
Centre
Eliminations and
adjustments
a b
1=a+b
1= 2+3+14+18+19 2 3=4+…+13 4 5 6 7 8 9 10 11 12 13 14=15+16+17 15 16 17 18 19
Net profit for the year from continued and discontinued operations 259,636 259,636
Net profit for the year from discontinued operations 5,590 5,590
Net profit for the year from continued opearations 254,046 254,046
Adjustments (total) (56,220) (56,220)
Dividends and net cash transfers (after income tax) 213 213
Goodwill /investment impairment (after income tax) 886 886
Bank tax on financial institutions (after income tax) (17,365) (17,365)
Effect of acquisition (after income tax) (12,441) (12,441)
Impact of fines imposed by the Hungarian Competition Authority
(after income tax) 749 749
Expected one-off negative effect of the debt repayment moratorium
in Hungary (after income tax) (28,262) (28,262)
Consolidated adjusted net profit for the year 254,046 56,222 310,268 159,302 126,967 40,957 14,829 7,299 9,664 1,557 26,104 16,317 4,307 1,960 3,973 25,830 7,661 9,824 8,345 (569) (1,262)
Profit before income tax 281,422 70,380 351,802 175,860 148,858 44,664 17,600 8,456 12,103 1,466 31,589 21,409 4,609 2,449 4,513 28,483 8,617 10,749 9,117 (526) (873)
Adjusted operating profit 500,092 37,345 537,437 181,178 326,660 89,774 40,329 35,899 19,787 11,810 42,030 65,068 8,352 5,904 7,707 28,889 10,279 10,765 7,845 (526) 1,236
Adjusted total income 1,207,759 (37,839) 1,169,920 453,635 653,581 166,667 84,907 79,001 40,388 43,747 67,385 123,198 22,095 11,597 14,596 59,158 21,283 15,248 22,627 419 3,127
Adjusted net interest income 782,671 5,408 788,079 286,448 474,148 111,239 58,199 59,514 28,103 32,739 48,581 99,872 17,188 9,824 8,889 19,020 17,688 5 1,327 419 8,044
Adjusted net profit from fees and commissions 397,633 (104,521) 293,112 130,470 135,156 45,453 16,093 14,766 11,127 3,813 13,540 22,503 4,446 1,278 2,137 25,212 40 14,883 10,289 0 2,274
Adjusted other net non-interest income 27,455 61,274 88,729 36,717 44,277 9,975 10,615 4,721 1,158 7,195 5,264 823 461 495 3,570 14,926 3,555 360 11,011 0 (7,191)
Adjusted other administrative expenses (707,667) 75,184 (632,483) (272,457) (326,921) (76,893) (44,578) (43,102) (20,601) (31,937) (25,355) (58,130) (13,743) (5,693) (6,889) (30,269) (11,004) (4,483) (14,782) (945) (1,891)
Total risk costs (218,670) 30,675 (187,995) (7,678) (177,802) (45,110) (22,729) (27,443) (7,684) (10,344) (10,441) (43,659) (3,743) (3,455) (3,194) (406) (1,662) (16) 1,272 0 (2,109)
Adjusted provision for impairment on loan and placement
losses (without the effect of revaluation of FX) (218,670) 60,249 (158,421) 2,374 (156,710) (44,875) (19,491) (22,170) (6,244) (7,840) (6,286) (41,160) (3,434) (2,515) (2,695) (1,487) (1,491) 0 4 0 (2,598)
Other provision (adjustment) 0 (29,574) (29,574) (10,052) (21,092) (235) (3,238) (5,273) (1,440) (2,504) (4,155) (2,499) (309) (940) (499) 1,081 (171) (16) 1,268 0 489
Total other adjustments (one-off items)1
0 2,360 2,360 2,360 0 0 0 0 0 0 0 0 0 0 0 0 0 0 0 0 0
Income tax (27,376) (14,158) (41,534) (16,558) (21,891) (3,707) (2,771) (1,157) (2,439) 91 (5,485) (5,092) (302) (489) (540) (2,653) (956) (925) (772) (43) (389)
Total Assets2
23,329,771 0 23,329,771 11,492,949 13,609,776 4,283,625 2,325,669 2,052,332 1,353,772 1,162,183 729,012 688,980 477,676 286,606 249,921 1,118,927 667,120 35,584 416,223 2,865,511 (5,757,392)
Total Liabilities3
20,793,243 0 20,793,243 9,726,310 11,651,728 3,663,247 1,997,504 1,779,286 1,187,648 1,034,945 611,941 505,578 401,119 257,826 212,634 842,473 614,566 17,052 210,855 1,504,289 (2,931,557)
( ) used at: provisions, impairment and expenses1
One-off item in the total amount consists the result of the treasury share swap agreement at OTP Core.2
Relating to the discontinued operations the assets were HUF 6,070 million. 3
Relating to the discontinued operations the liabilit ies were HUF 5,486 million.
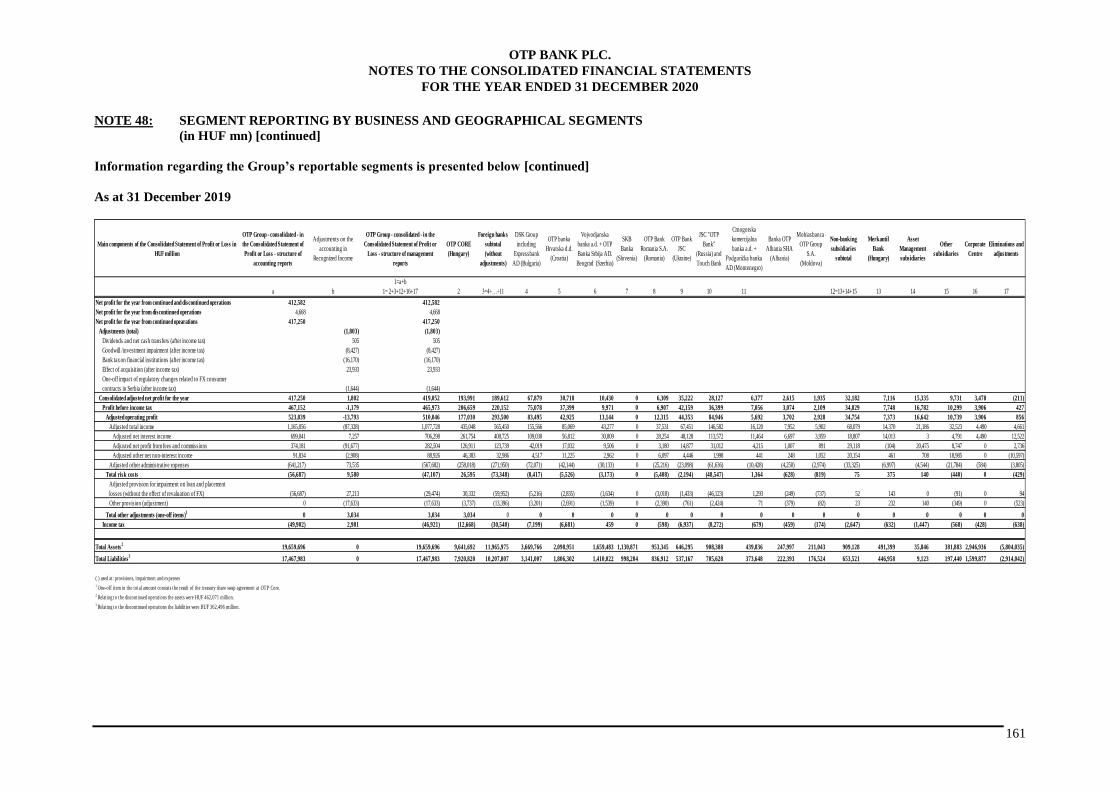
OTP BANK PLC.
NOTES TO THE CONSOLIDATED FINANCIAL STATEMENTS
FOR THE YEAR ENDED 31 DECEMBER 2020
161
NOTE 48: SEGMENT REPORTING BY BUSINESS AND GEOGRAPHICAL SEGMENTS
(in HUF mn) [continued]
Information regarding the Group’s reportable segments is presented below [continued]
As at 31 December 2019
Main components of the Consolidated Statement of Profit or Loss in
HUF million
OTP Group - consolidated - in
the Consolidated Statement of
Profit or Loss - structure of
accounting reports
Adjustments on the
accounting in
Recognized Income
OTP Group - consolidated - in the
Consolidated Statement of Profit or
Loss - structure of management
reports
OTP CORE
(Hungary)
Foreign banks
subtotal
(without
adjustments)
DSK Group
including
Expressbank
AD (Bulgaria)
OTP banka
Hrvatska d.d.
(Croatia)
Vojvodjanska
banka a.d. + OTP
Banka Srbija AD.
Beograd (Szerbia)
SKB
Banka
(Slovenia)
OTP Bank
Romania S.A.
(Romania)
OTP Bank
JSC
(Ukraine)
JSC "OTP
Bank"
(Russia) and
Touch Bank
Crnogorska
komercijalna
banka a.d. +
Podgorička banka
AD (Montenegro)
Banka OTP
Albania SHA
(Albania)
Mobiasbanca -
OTP Group
S.A.
(Moldova)
Non-banking
subsidiaries
subtotal
Merkantil
Bank
(Hungary)
Asset
Management
subsidiaries
Other
subsidiaries
Corporate
Centre
Eliminations and
adjustments
a b
1=a+b
1= 2+3+12+16+17 2 3=4+…+11 4 5 6 7 8 9 10 11 12=13+14+15 13 14 15 16 17
Net profit for the year from continued and discontinued operations 412,582 412,582
Net profit for the year from discontinued operations 4,668 4,668
Net profit for the year from continued opearations 417,250 417,250
Adjustments (total) (1,803) (1,803)
Dividends and net cash transfers (after income tax) 505 505
Goodwill /investment impairment (after income tax) (8,427) (8,427)
Bank tax on financial institutions (after income tax) (16,170) (16,170)
Effect of acquisition (after income tax) 23,933 23,933
One-off impact of regulatory changes related to FX consumer
contracts in Serbia (after income tax) (1,644) (1,644)
Consolidated adjusted net profit for the year 417,250 1,802 419,052 193,991 189,612 67,879 30,718 10,430 0 6,309 35,222 28,127 6,377 2,615 1,935 32,182 7,116 15,335 9,731 3,478 (211)
Profit before income tax 467,152 -1,179 465,973 206,659 220,152 75,078 37,399 9,971 0 6,907 42,159 36,399 7,056 3,074 2,109 34,829 7,748 16,782 10,299 3,906 427
Adjusted operating profit 523,839 -13,793 510,046 177,030 293,500 83,495 42,925 13,144 0 12,315 44,353 84,946 5,692 3,702 2,928 34,754 7,373 16,642 10,739 3,906 856
Adjusted total income 1,165,056 (87,328) 1,077,728 435,048 565,450 155,566 85,069 43,277 0 37,531 67,451 146,582 16,120 7,952 5,902 68,079 14,370 21,186 32,523 4,490 4,661
Adjusted net interest income 699,041 7,257 706,298 261,754 408,725 109,030 56,812 30,809 0 28,254 48,128 113,572 11,464 6,697 3,959 18,807 14,013 3 4,791 4,490 12,522
Adjusted net profit from fees and commissions 374,181 (91,677) 282,504 126,911 123,739 42,019 17,032 9,506 0 3,180 14,877 31,012 4,215 1,007 891 29,118 (104) 20,475 8,747 0 2,736
Adjusted other net non-interest income 91,834 (2,908) 88,926 46,383 32,986 4,517 11,225 2,962 0 6,097 4,446 1,998 441 248 1,052 20,154 461 708 18,985 0 (10,597)
Adjusted other administrative expenses (641,217) 73,535 (567,682) (258,018) (271,950) (72,071) (42,144) (30,133) 0 (25,216) (23,098) (61,636) (10,428) (4,250) (2,974) (33,325) (6,997) (4,544) (21,784) (584) (3,805)
Total risk costs (56,687) 9,580 (47,107) 26,595 (73,348) (8,417) (5,526) (3,173) 0 (5,408) (2,194) (48,547) 1,364 (628) (819) 75 375 140 (440) 0 (429)
Adjusted provision for impairment on loan and placement
losses (without the effect of revaluation of FX) (56,687) 27,213 (29,474) 30,332 (59,952) (5,216) (2,835) (1,634) 0 (3,018) (1,433) (46,123) 1,293 (249) (737) 52 143 0 (91) 0 94
Other provision (adjustment) 0 (17,633) (17,633) (3,737) (13,396) (3,201) (2,691) (1,539) 0 (2,390) (761) (2,424) 71 (379) (82) 23 232 140 (349) 0 (523)
Total other adjustments (one-off items)1
0 3,034 3,034 3,034 0 0 0 0 0 0 0 0 0 0 0 0 0 0 0 0 0
Income tax (49,902) 2,981 (46,921) (12,668) (30,540) (7,199) (6,681) 459 0 (598) (6,937) (8,272) (679) (459) (174) (2,647) (632) (1,447) (568) (428) (638)
Total Assets2
19,659,696 0 19,659,696 9,641,692 11,965,975 3,669,766 2,098,951 1,659,483 1,130,871 953,345 646,295 908,388 439,836 247,997 211,043 909,128 491,399 35,846 381,883 2,946,936 (5,804,035)
Total Liabilities3
17,467,983 0 17,467,983 7,920,820 10,207,807 3,141,007 1,806,302 1,410,022 998,204 836,912 537,167 705,628 373,648 222,393 176,524 653,521 446,958 9,123 197,440 1,599,877 (2,914,042)
( ) used at: provisions, impairment and expenses1
One-off item in the total amount consists the result of the treasury share swap agreement at OTP Core.2
Relating to the discontinued operations the assets were HUF 462,071 million. 3
Relating to the discontinued operations the liabilit ies were HUF 362,496 million.
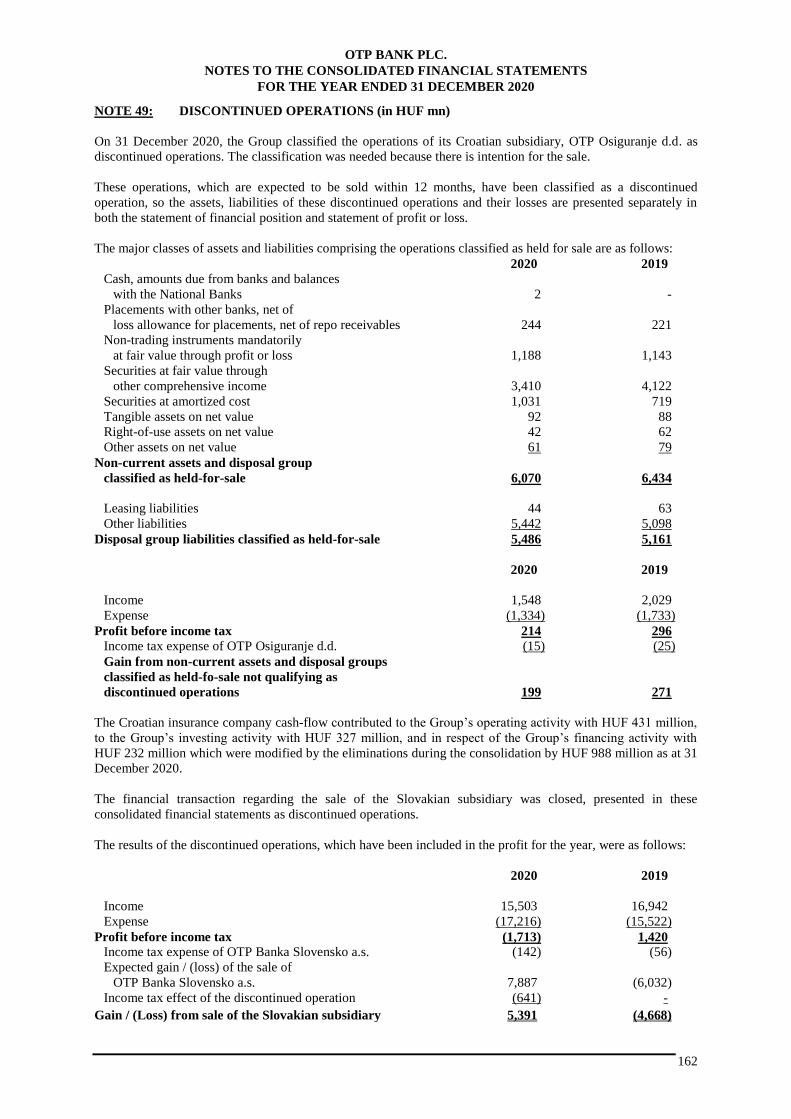
OTP BANK PLC.
NOTES TO THE CONSOLIDATED FINANCIAL STATEMENTS
FOR THE YEAR ENDED 31 DECEMBER 2020
162
NOTE 49: DISCONTINUED OPERATIONS (in HUF mn)
On 31 December 2020, the Group classified the operations of its Croatian subsidiary, OTP Osiguranje d.d. as
discontinued operations. The classification was needed because there is intention for the sale.
These operations, which are expected to be sold within 12 months, have been classified as a discontinued
operation, so the assets, liabilities of these discontinued operations and their losses are presented separately in
both the statement of financial position and statement of profit or loss.
The major classes of assets and liabilities comprising the operations classified as held for sale are as follows:
2020 2019
Cash, amounts due from banks and balances
with the National Banks 2 -
Placements with other banks, net of
loss allowance for placements, net of repo receivables 244 221
Non-trading instruments mandatorily
at fair value through profit or loss 1,188 1,143
Securities at fair value through
other comprehensive income 3,410 4,122
Securities at amortized cost 1,031 719
Tangible assets on net value 92 88
Right-of-use assets on net value 42 62
Other assets on net value 61 79
Non-current assets and disposal group
classified as held-for-sale 6,070 6,434
Leasing liabilities 44 63
Other liabilities 5,442 5,098
Disposal group liabilities classified as held-for-sale 5,486 5,161
2020 2019
Income 1,548 2,029
Expense (1,334) (1,733)
Profit before income tax 214 296
Income tax expense of OTP Osiguranje d.d. (15) (25)
Gain from non-current assets and disposal groups
classified as held-fo-sale not qualifying as
discontinued operations 199 271
The Croatian insurance company cash-flow contributed to the Group’s operating activity with HUF 431 million,
to the Group’s investing activity with HUF 327 million, and in respect of the Group’s financing activity with
HUF 232 million which were modified by the eliminations during the consolidation by HUF 988 million as at 31
December 2020.
The financial transaction regarding the sale of the Slovakian subsidiary was closed, presented in these
consolidated financial statements as discontinued operations.
The results of the discontinued operations, which have been included in the profit for the year, were as follows:
2020 2019
Income 15,503 16,942
Expense (17,216) (15,522)
Profit before income tax (1,713) 1,420
Income tax expense of OTP Banka Slovensko a.s. (142) (56)
Expected gain / (loss) of the sale of
OTP Banka Slovensko a.s. 7,887 (6,032)
Income tax effect of the discontinued operation (641) -
Gain / (Loss) from sale of the Slovakian subsidiary 5,391 (4,668)
OTP BANK PLC.
NOTES TO THE CONSOLIDATED FINANCIAL STATEMENTS
FOR THE YEAR ENDED 31 DECEMBER 2020
163
NOTE 49: DISCONTINUED OPERATIONS (in HUF mn) [continued]
The Slovakian subsidiary bank cash-flow contributed to the Group’s operating activity with HUF (8,231) and
(48,377) million, to the Group’s investing activity with HUF (9,653) and (1,197) million, and in respect of the
Group’s financing activity with HUF 86,281 and (1,086) million which were modified by the eliminations during
the consolidation by HUF (67,767) and 23,788 million as at 31 December 2020 and 2019, respectively.
NOTE 50: SIGNIFICANT EVENTS DURING THE YEAR ENDED 31 DECEMBER 2020
1) Term Note Program
See details in Note 21.
2) Sale of OTP Osiguranje d.d.
The Croatian subsidiary of the Bank, OTP banka d.d., has signed a share purchase agreement to sell its 100%
stake in the Croatian insurance company OTP Osiguranje d.d. to Groupama Biztosító Zrt.
The financial closure of the transaction is expected to take place in first half of 2021, subject to obtaining the
necessary supervisory approvals.
3) Sale of OTP Banka Slovensko a.s.
The transaction, based on the share purchase agreement signed with KBC Bank NV on 17 February 2020, has
been financially closed, as a result of which the 99.44% shareholding in its Slovakian subsidiary, OTP Banka
Slovensko was acquired by KBC Bank NV.
NOTE 51: POST BALANCE SHEET EVENTS
1) Determination of expected credit loss
Compliance with the executive circular issued in January 2021 by the National Bank of Hungary on the “use of
macroeconomic information in applying IFRS 9 and factors indicating a significant increase in credit risk” does
not significantly impact the determination of expected credit losses as at 31 December 2020.
2) Supreme Court ruling in Croatia
In September 2019, the Supreme Court of the Republic of Croatia made a ruling, which to a large extent
confirms the earlier ruling of the High Commercial Court of the Republic of Croatia dated June 2018 in the case
of protection of collective interest and rights of the consumers who had taken loans with principals indexed to
Swiss franc (Ruling No. Rev- 2221/2018- 11 of the Supreme Court of the Republic of Croatia, hereinafter
referred to as “the Ruling”). In February 2021, the Constitutional Court of the Republic of Croatia rejected and
dismissed the constitutional complaints of seven Croatian banks filed against the judgments of the Supreme
Court of the Republic of Croatia and the High Commercial Court of the Republic of Croatia in a collective
dispute initiated by the Consumer Association due to unfair contractual provisions related to the Swiss franc.
In the Group's view, in this regard, since the decisions of the Supreme Court as well as the decisions of lower
courts are final and the courts are already acting on them, there has been no increase in consumer rights (CHF
loan clients) or an increase in liabilities on the part of banks. Accordingly, the Group does not expect an increase
in the number of lawsuits that would result in additional provisions above the amounts reserved and provided for
as of 31 December 2020. Possible liabilities of the Group arising from decisions of the courts related to such
individual consumer lawsuits are considered unforeseeable liabilities. As permitted by IAS 37.92, in order not to
prejudice the outcomes of the proceedings and the interests of the Group, no further disclosures are made about
the contingent liabilities in connection with the Ruling.