African Consolidated Resources plc · Cedric Chakari Perseverance One Step Gadzema Belt Pickstone...
56
African Consolidated Resources plc 2012 Annual Report For the year ended 31 March 2012
Transcript of African Consolidated Resources plc · Cedric Chakari Perseverance One Step Gadzema Belt Pickstone...

African Consolidated Resources plc 2012 Annual Report
For the year ended 31 March 2012

Zambezi
Za
mbezi
Lake Kariba
Mbala
Kasama
Kitwe
Ndola
Mongu
Kabwe
ZAMBIA
Lusaka
Harare
ZIMBABWEMutare
Beitbridge
Bulawayo
Gweru
Nkombaw Hill
Kasempa
Snakeshead
Horseshoe
CedricChakari
Perseverance
One Step
Gadzema Belt
Pickstone
MarangeChrishanya
Lowveld
Mphoengs
Zambezi
Za
mbezi
Lake Kariba
Mbala
Kasama
Kitwe
Ndola
Mongu
Kabwe
ZAMBIA
Lusaka
Harare
ZIMBABWEMutare
Beitbridge
Bulawayo
Gweru
Nkombwa Hill
Kasempa
Snakeshead
Horseshoe
Chakari
Perseverance
One Step
Gadzema Belt
Pickstone
MarangeChrishanya
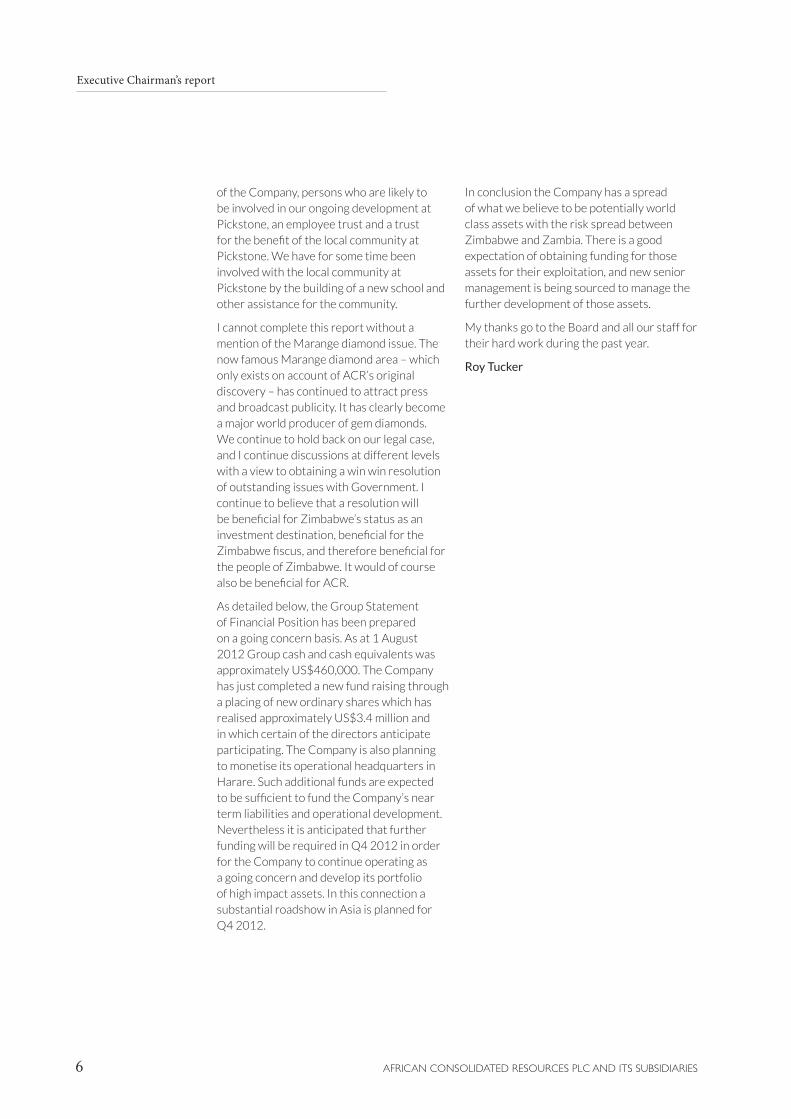
MphoengsACR Project locations
Developing a world class portfolio of assets in Zimbabwe and Zambia

2012 group annual report and its FinanCial stateMents 1
African Consolidated Resources plc – Highlights
Financial Highlights for the year• Loss of $4.6m to 31 March 2012 as exploration programmes continue (2011: $3.8m)
• $7.3m cash received through private placement of 78m shares in July 2011 (2011 – Nil)
• Cash balance of $3.03m at 31 March 2012 (2011: $4.9m).
Events after the reporting date• Cash balance of $0.46m at 1 August 2012
• Further fund raising of $3.4m achieved from issue of 108m ordinary shares in August 2012
• Anticipate monetisation of operational headquarters in Harare to provide additional working capital
• Additional fundraising required before end of 2012 – substantial roadshow in Asia planned
Exploration Highlights• ACR total gold resources now stand at 37Mt at 1.3 g/t for 1.54 Moz
• Gadzema Gold project – milestone of 1.03Moz @ 1.2 g/t Au JORC Resource reached from extension drilling of the Blue Rock discovery. Resource is open along strike and to depth with multi-million oz potential. 16,096m of drilling completed in the year to March 2012.
• At Pickstone-Peerless gold project, metallurgy and plant process design is well advanced for treatment of the Peerless high-grade sulphide dump.
• Pit modelling of the Peerless Mine oxide cap shows the project has low technical risk, simple mining and processing methods and low CAPEX to commence production (approx $4m). Anticipated returns of approximately $13m free cash flow over 2 years. Detailed feasibility study to be done in H2 2012.
• Intention to commission a full BFS to cover surface and underground mining at Pickstone-Peerless due Q1 2013.
• In NE Zambia, the Nkombwa Hill carbonatite has returned highly encouraging Rare Earth values from surface sampling of three target zones identified by mapping and heli-borne geophysics. Good grade indications in world terms. A ten-hole diamond drilling programme is planned H2 2012 to test three target zones at depth – to be financed by joint venture partner.
• In NW Zambia, work is underway on reconstructing a copper ore body model of the Kalengwa Mine from historical drilling and mining plans in the government archives. Early indications are that a substantial oxide and sulphide copper resource exists in the halo around the old pit, which was mined at a 3% cut-off. Completion of the mine study and payment of vendor considerations expected H2 2012.

AFRICAN CONSOLIDATED RESOURCES PLC AND ITS SUBSIDIARIES2
African Consolidated Resources plc – Highlights 1
Executive Chairman’s report 3 - 6
Chief Executive Officer’s report 7 - 13
Report of the directors 14 - 18
Statement of directors’ responsibilities 19
Independent Auditors report 20 - 21
Group statement of comprehensive income 22
Group statement of changes in equity 23
Company statement of changes in equity 24
Group and Company statements of financial position 25
Group and Company statements of cash flow 26
Statement of accounting policies 27 - 32
Notes to the financial statements 33 - 52
Company information inside back cover
Contents

2012 group annual report and its FinanCial stateMents 3
Executive Chairman’s report
As we all know the world economy is in the throes of some fundamental change and I should like to start my report with a review of strategy in the light of this.
ACR’s strategy at the time of listing on AIM and in the years following was to accrue value on a wide spectrum of mineral properties through successful exploration. Under that strategy and at that time, additional funds were capable of being raised for further development and value accretion without substantial dilutive effect. Eventually suitably prospective properties could be brought to the stage of a bankable feasibility study (BFS) and sold or joint ventured, but such advancement could often be deferred if, as has largely been the case up to now in Zimbabwe, major mine development finance was unavailable.
This strategy now has to change to take account of the new investment climate. On the one hand very low interest yields have turned traditional investors away from exploration companies with little prospect of near term dividends and towards companies with current dividend yield. On the other hand new-style investors have appeared – often with very substantial funds at their disposal and looking to profit from resource bargains arising from the western crisis – who although less interested in early stage exploration, are interested in large projects where economic feasibility to production, even if not already fully evaluated in detail, is recognised.
ACR’s strategy has now evolved to focus on more mature projects in order to develop them rapidly to a stage where they are ready for a substantial investment by such new-style investors. ACR’s preferred route is for such investment to be on a project basis in order to avoid undue dilution. We have already had a number of meetings with investors on this basis and intend to follow these with further meetings in Q4 2012.
ACR has achieved great success in following its original strategy of developing a broad range of projects across numerous asset
classes, which can now feed into the new strategy. There are now three potentially big and relatively mature projects – in Zimbabwe the Pickstone Peerless Gold Project (‘Pickstone Peerless’) and the Gadzema Gold Project (‘Gadzema’), and in Zambia the Kasempa/Kalengwa Copper Project. We believe that each of these projects are potentially world class assets.
Specifically, and as Andrew Cranswick explains in his report, we are expecting to achieve in the very short term at least a threefold increase in the JORC gold resource quantum on Pickstone Peerless and associated upgrade of grades involving the notable conversion of the JORC category from Inferred to Indicated/Measured greater than 50%. Additional drilling, assays, metallurgy work, plus digitisation of detailed Rio Tinto legacy data is now nearing completion and we are also in preliminary discussions to commission a full BFS on Pickstone Peerless, anticipated to be due in Q1 2013. We believe that as a result of this work we will in a relatively short period be well placed to attract a major investor for Pickstone Peerless.
Gadzema – where we have completed 16,096 metres of drilling in the year to 31 March 2012 - has we believe a world-class multi-million ounce resource potential. It is less mature than the previously producing Pickstone, but remains a significant deposit with 8km of strike and it is our intention to upgrade its current JORC Resource to greater than 2Moz in 2013. In our opinion it holds the possibility of a high tonnage operation capable of producing 200,000oz-300,000oz of gold per annum through the development of a large scale mine. Due to the Zimbabwe investment climate however we have until recently been unsure as to whether it would be possible to attract the major investment that would ultimately be needed in order to create such a large scale mine. We had therefore slowed down our drilling programme so as to prioritise expenditure on projects likely to give rise to near term cash or a near term significant transaction. With

AFRICAN CONSOLIDATED RESOURCES PLC AND ITS SUBSIDIARIES4
the advent of the new-style investor however the possibility of ultimately raising the mining finance necessary has we believe changed, and in the coming months in our meetings with potential new-style investors we will be reassessing this.
In my report presented with the Company’s interim results for the six period ended 30 September 2011, I alluded to the possible opportunity for short term cash generation from the brownfield Kalengwa Mine in Zambia, but that various licensing issues needed resolution. We have been made aware that there are many irregularities accumulated from the past in the cadastre in Zambia through the grant of licences unlawfully superimposed on other licences. In order to clear the irregularities, the new government introduced a moratorium on the issue or transfer of all licences and this lasted for several months.
The Kalengwa Copper-Silver Mine (‘the Kalengwa Mine’) and 1,085 sq km contiguous exploration ground has given an example of these issues. The acquisition has been laborious due to the continuing occupation of the mine by a company which previously held an unlawfully acquired mining licence. This mining licence was overturned by the Supreme Court in September 2011, the Supreme Court decision in our vendor’s favour being a condition precedent of the acquisition. The occupier of the mine is however continuing to process the rock dump left over from mining in the 1970s under a Mineral Processing Licence which was only obtained by the occupier on the basis of the existence of the overturned mining licence. To avoid further delay through court action we have reached near agreement with the occupier for a shared interest in the rock dump and are expecting to get physical possession on the mine shortly. There is also an action by a previous shareholder of the vendor against the vendor who has asserted that the vendor has no right to sell, but we are confident that the previous shareholder of the vendor is not legally in a position to prevent the acquisition by ACR. On transfer of the
licence to ACR there will be approximately $1 million due as a payment on account of the purchase consideration for the Kalengwa Mine and the contiguous exploration ground and for associated costs.
Meanwhile we have obtained much detailed historical information on the Kalengwa Mine and produced a block model which shows a non-JORC estimate of 170,000 tonnes of contained copper metal at an average grade of 1.5% on the pit margin. This is in addition to the resource in the dumps. More detailed aeromagnetic and radiometric surveys are expected to commence in September 2012. Mineralisation along strike is open. There is therefore potential for an upgrade of quantum and grade of the resource. Work is underway on assessing treatment options for the dumps and the oxide material on the mine. This will be followed by an investigation of the funding opportunities to progress this project into production in the near term.
Less mature but potentially important is our Nkombwa Hill Rare Earth Elements (‘REE’) project which is a highly prospective intrusive carbonatite complex in Muchinga Province, North East Zambia. This has given another example of the Zambia cadastre problem where, as already announced, another licence has been unlawfully superimposed on our own. Although the position has not yet been physically rectified on the cadastre we are confident that the correct position will be restored shortly. Our confidence in this regard is supported both by a letter from the Ministry of Mines and Natural Resources and also by a very recent published interview with the Minister of the Muchinga Province where he stated his enthusiasm for the project and confirmed that development would be undertaken by ACR.
We are very pleased that our joint venture partners at Nkombwa Hill – who are committed to spending $1.35m to achieve an Indicated JORC REE Resource in order to earn-in up to 50% of the project – are now backed by Galileo Resources plc, which has the benefit of Colin Bird’s extensive experience in resource development and
Executive Chairman’s report

2012 group annual report and its FinanCial stateMents 5
Executive Chairman’s report
REE expertise. As already reported, recent sampling has shown good prospectivity with eight samples over 10% Total Rare Earth Oxides (‘TREO’) and a highest assay of 23.6% TREO. No funding will be required from the Company until after the publication of the JORC Resource.
On other projects, we have decided that the Cedric Copper and Lowveld Gold Projects are not sufficiently prospective or large to progress further. In Note 11 of the Finance Report there is an impairment of $787,894 most of which relates to these but also includes an early stage diamond project and an early stage copper project near Pickstone Peerless not proceeded with. All other projects remain alive.
The business climate in Zimbabwe remains cautious, although as I have implied many of the new-style investors appear to be ready to accept political risk. Politically, progress is being made slowly towards a new Constitution, and according to pronouncements from both major political parties, elections are scheduled for 2013.
A recent negative has been the 5,000% increase in annual mining claim fees promulgated by the Ministry of Mines. This has been declared ultra vires by the Parliamentary Committee on Mining and so the precise legal status of the fee increase is unclear. The stated reason for the increase is to prevent hoarding of claims by speculators. We believe that there are other measures that could be used to prevent this. The fee increase, if it is maintained, will have a considerable impact on greenfield exploration as it is widely acknowledged in the mining industry that it is necessary to hold and explore a lot of ground in order to be successful in making new discoveries. The fee increase is therefore damaging for long term development in Zimbabwe as it could freeze long term greenfield exploration and we hope the fee increase will not be adopted.
If ACR were to maintain all its claims then the additional fees payable would be substantial. ACR has therefore divided its claims into
categories. For core assets such as Pickstone Peerless and Gadzema the increased fees are being paid whether the fee increase is held to be valid or not. For other assets fees will be paid when there is clarity on the legal position or when there is a notice that the claim will be lost if not paid, or alternatively will not be paid if it is decided that the claim is not worth holding at the increased price.
Laws in Zimbabwe relating to indigenisation are evolving. As previously stated the Company is not subject to the Regulation published on 25 March 2011 concerning near term 51% indigenous ownership and which gave rise to much concern at the time it was published. My personal opinion is that the indigenisation laws will eventually settle down to a system which will be acceptable to business and will take into account not only indigenous shareholding percentages, but other factors such as employment and benefits to communities in which projects are situated. Taking all factors into account we are proposing to implement a modest level of indigenisation for our Zimbabwe holding company, and a somewhat greater level of indigenisation on a project by project level and which will be implemented as each project nears maturity. In this way different local interests can be accommodated to suit the projects which are relevant to them. Such project indigenisation would thus be one of the things to be negotiated as part of any substantial transaction on Pickstone Peerless.
An example of indigenisation at the project level is given by what has been done in relation to the Pickstone Sulphide Dump. A tribute in respect of the dump has been given to an indigenous company within the meaning of the Zimbabwe Indigenisation and Economic Empowerment Act, the overall commercial effect of which is to give ACR consideration for the grant of the tribute of $4 million payable out of gold sales and where ACR retains a 75% beneficial interest in profits arising from the processing of the dump after payment of the $4 million. In this case the indigenous interests include or will include consultants and employees
AFRICAN CONSOLIDATED RESOURCES PLC AND ITS SUBSIDIARIES6
of the Company, persons who are likely to be involved in our ongoing development at Pickstone, an employee trust and a trust for the benefit of the local community at Pickstone. We have for some time been involved with the local community at Pickstone by the building of a new school and other assistance for the community.
I cannot complete this report without a mention of the Marange diamond issue. The now famous Marange diamond area – which only exists on account of ACR’s original discovery – has continued to attract press and broadcast publicity. It has clearly become a major world producer of gem diamonds. We continue to hold back on our legal case, and I continue discussions at different levels with a view to obtaining a win win resolution of outstanding issues with Government. I continue to believe that a resolution will be beneficial for Zimbabwe’s status as an investment destination, beneficial for the Zimbabwe fiscus, and therefore beneficial for the people of Zimbabwe. It would of course also be beneficial for ACR.
As detailed below, the Group Statement of Financial Position has been prepared on a going concern basis. As at 1 August 2012 Group cash and cash equivalents was approximately US$460,000. The Company has just completed a new fund raising through a placing of new ordinary shares which has realised approximately US$3.4 million and in which certain of the directors anticipate participating. The Company is also planning to monetise its operational headquarters in Harare. Such additional funds are expected to be sufficient to fund the Company’s near term liabilities and operational development. Nevertheless it is anticipated that further funding will be required in Q4 2012 in order for the Company to continue operating as a going concern and develop its portfolio of high impact assets. In this connection a substantial roadshow in Asia is planned for Q4 2012.
In conclusion the Company has a spread of what we believe to be potentially world class assets with the risk spread between Zimbabwe and Zambia. There is a good expectation of obtaining funding for those assets for their exploitation, and new senior management is being sourced to manage the further development of those assets.
My thanks go to the Board and all our staff for their hard work during the past year.
Roy Tucker
Executive Chairman’s report

2012 group annual report and its FinanCial stateMents 7
Chief Executive Officer’s report
I am pleased to present our financial statement herewith and for the opportunity to explain some of our recent developments and future plans.
In this year’s Chairman’s report and in my CEO reports of the past few years, we have referred repeatedly to the changes taking place on the world stage and what it means for our company. These changes manifest largely in line with the nervousness that has infused western markets and in particular how the markets view our resources sector. Coupled with a rising tide of resource nationalism and taxation threats in resource-rich developing nations, the shifting sands make adaptation crucial, and awareness and response thereof has indeed occupied much of our time and energy. I believe we have successfully evolved our strategy to meet these challenges and we have set some high-level milestones to achieve in the near and medium term with which we may build and create shareholder value. Whilst the current market fear in the west may subside, the tide is still going out; it is heading east and so we must follow.
The dichotomy between east and west in terms of their apparent risk appetite becomes ever more pronounced as one hemisphere grows its wealth and voracity while the latter frets and shrinks. This trend was predicted and anticipated but the pace of acceleration in that trend has taken the world by surprise. We have analysed how we might mould that reality from crisis into opportunity. We have grown in our understanding of how to meet the expectations of cash-rich, resource-hungry nations and their investment entities. These expectations vary as widely as the geography from whence they come but the most consistent element of demand is for mineral and mining assets at or very near production stage, and only for projects of some scale. Another observation of mine is the apparent lack of understanding of the mineral exploration model, historically so well proven on the ASX, TSX and LSE. With the West obsessed by risk avoidance and the East focussed solely on production, exploration
and resource development is being starved of funding worldwide - the future consequences are obvious. Two conclusions arise in respect of ACR policy:
1. In order to attract near-term production finance and to add shareholder value we have acted to advance our most mature projects to feasibility. The investment now sought must produce metal to achieve cash-flow, self-sufficiency and value extraction, and wherever possible the resulting dilution should be confined to project-level. We hope to report further progress through the rest of this year;
2. In the longer term, the inevitable ramification of under-funding exploration is the continued neglect of reserve replacement. When coinciding with ever-growing consumption (read reserve-depletion) the inescapable prediction is a state of critical resource project shortages within the next 5–10 years. A profound competitive advantage for ACR can thus be achieved through reinvestment of future cash profits into exploration.
We have been following this adapted path for some time and are now ready to act decisively on the all-important investment / finance leg. I discuss in more detail below on our execution and the specific project targets. To achieve these ambitions, and to do so on a far larger scale than our market capital valuation might suggest possible, we still require the working capital and funding for tenure-maintenance / acquisition – in essence to keep the ACR project incubator in operation. In this regard, the Company is currently in an advanced stage of raising additional equity of which the directors are confident of achieving approximately £2 million before expenses. This will come with a commitment from the Board to pare unnecessary overheads and reduce wherever possible our cash burn-rate – a rationalisation that matches our focus on fewer, more prioritised projects. In this respect, the Board will be reviewing remuneration in the near-term.

AFRICAN CONSOLIDATED RESOURCES PLC AND ITS SUBSIDIARIES8
Bearing in mind that the declared ACR value-delivery timetable was aimed to be in the 5 to 10 year post-IPO window, we remain on course, albeit with an improvised road-map. I thank our shareholders for the continued patience and faith they have displayed in our capacity to deliver.
CEO tax / bankruptcy statusAs has previously been announced, I personally have been embroiled in a lengthy, difficult and complex dispute with the Australian Tax Office who had achieved a court order to declare me bankrupt on grounds of leaving Australia to defeat my creditors. This was in turn contested by my lawyers. After lengthy action and negotiation on an out-of-court settlement, we have agreed terms of a deed of composition which will annul any bankruptcy status. This is due to be concluded in the next fortnight and thus bring the chapter to a welcome close.
ZimbabweOur view of Zimbabwe has always been that the land is one of immense opportunity beset by the dual malaise of perceived sovereign risk and political inertia, stifling much-needed investment. The hope we have for the imminent improvement of the investment climate is apparently shared by many more investors than before as the swelling numbers of business travellers arriving at Harare airport attest. At this point in time, a perfectly safe investment paradise Zimbabwe certainly is not, but small improvements in fundamental principles and practices of governance offer potential for enormous positive impacts on investment.
When we review the good progress of dollarization and gold sales / mining de-regulation there is a demonstrated desire for encouraging growth – an intent which needs to be recognised and applauded. Yet it is not quite enough to conquer the coefficient of static friction which keeps the economy in the starting-gate, champing for release. More than one of our shareholders has expressed exasperation at the ever-increasing
mining tenure fees, taxes and royalties that without warning can alter mine economics, conspiring against long-term development and investment. While Zimbabwe is by no means unique in this failing, if we, as a nation, truly desire job-growth and wealth creation, we need to listen to investors and compete favourably with our peers and neighbours. Furthermore, attraction of this investment, whether from the east or the west, requires certainty and transparency in the detail and the administration of indigenisation. There seems to be a growing appreciation of this in Harare, and I hope government policies more actively reflect these needs soon.
Indigenisation of ACR operations has been designed and re-designed and several templates have been studied, with the intention of full compliance to the law. ACR has previously stated that indigenisation does not affect an exploration company until retained production profits at a project level have accumulated sufficiently to repay the investment debt. But in view of our rapid advance to large-scale funding and production we have now to finalise a universally acceptable structure for compliance and this is a near-term goal with regards to which we hope to announce progress soon. Please see the Chairman’s report for more on this matter.
ZambiaLicence problems have affected almost all mining investors in Zambia and the 1-year old government has made concerted efforts to rectify past wrongs. While we have been frustrated by the time taken, all interactions I have participated in have shown consistent recognition of what needs to be done and some progress has been made. Technical progress has been hampered by licence–related tenure issues and I am aware that this problem is widespread and recognised by the authorities. We are working with all possible government departments to assist in improving the situation and are hopeful that specific news on progress will be announced soon. After surmounting several technical
Chief Executive Officer’s report
2012 group annual report and its FinanCial stateMents 9
Chief Executive Officer’s report
and bureaucratic obstacles, our geophysics survey has now been belatedly commissioned and approved for flying in the north-west of Zambia where we have brownfield and greenfield tenure. We expect to release the result of this survey to the market in Q4 2012 and expect to have defined a number of drill-targets from these results. More on this target below.
Less-mature ProjectsAs I have previously described, ACR’s evolved focus is on funding and creating value from our mature projects. This does not mean we have abandoned all long-term exploration projects – on the contrary we have done very specific relatively low-cost work on proving economics and metallurgy as steps to create the confidence to budget and progress expensive drilling campaigns for Resource Definition and thereafter advancing to feasibility. As described in our policy above, the intention is to fund the more expensive resourced development stages of these exploration projects from production cash flow of the mature assets. The science we apply continues to yield results on recovery rates of phosphate concentrates from our Chishanya Phosphate project in Zimbabwe. Once the final report is fully evaluated, we will be defining a budget for the full resource definition and scoping study for this high-grade carbonatite.
Meanwhile at the Snakes Head PGM project, repeated delays in a comprehensive environmental approval have now been overcome and, subject to additional finance, we expect to drill what is anticipated as the higher-grade Main Sulphide Zone (‘MSZ’) of the great Dyke which hosts all the economic PGM reserves in Zimbabwe. Subject to successful results we will be developing discussions with PGM-specialist partners.
In Zambia, our high-grade Rare-Earth prospect at Nkombwa Hills in the new province of Muchinga has progressed with high-grade showings in trenching which has assisted in the definition of comprehensive drill plans. Subject to the final regularisation
of the licences as indicated by the Ministry of Mines, Galileo Resources PLC are committed to finance exploration expenditure as part of their project earn-in. In addition and subject to budget accommodation, the intention is to commence metallurgy tests for phosphate extraction along similar lines to our successes described at Chishanya.
Near Value, Mature ProjectsAs defined in our strategy, it is towards the projects that can most soon yield financial results that we are committed for the bulk of our efforts in the coming twelve months. In order of importance and maturity, these are the Pickstone & Peerless Gold project in Zimbabwe, the Kalengwa Copper/Silver project in Zambia and the Gadzema Gold project in Zimbabwe (with Nkombwa receiving an honourable mention). We are mindful of the need for realisation of value both from production profits and from market recognition of asset value reflected in share prices. Raising capital at project level is currently the target in order to minimise dilution at the corporate level but success therein should also be rewarded in the corporate share price.
To best achieve project finance, share value recognition and management and indigenisation goals, it is very possible that we will undertake corporate restructuring in respect of these lead projects.
Pickstone and Peerless Gold ProjectA review of history is in order. This Rio Tinto mine was closed unexpectedly during an active phase of mine development, mostly for political reasons, in the early 1970s. It consists of two parallel ore bodies 300 metres apart, comprising the banded-iron hosted Pickstone trend (mined under Concession Hill) and the schist-hosted Peerless trend. While the Pickstone was partially mined down to 700 metres producing nearly 500,000 troy ounces of gold (‘troz’) at an average of around 6g/t Au, mostly in the ten years prior to closure, it still has large known ore resources within that depth and is open further at

AFRICAN CONSOLIDATED RESOURCES PLC AND ITS SUBSIDIARIES10
depth - probably much deeper with grades apparently increasing with depth. The slightly lower grade Peerless trend is essentially virgin and although developed down to No.3 level only trial-stoping was conducted in the year of closure.
When ACR acquired the Pickstone / Peerless project, the price of gold was less than $400 /troz and the conventional wisdom of the time dictated that the only likely economic mining would be at surface from tailings and open-cast mining. Accordingly ACR drilled and defined the two ore-bodies down to an average 110 metres, declaring a JORC-compliant Resource of some 500,000+ troz. More recently, when discussing joint venture and finance opportunities with third parties, a decision was made that in the context of a far more robust gold price, the underground held much potential and we began a process of quantification thereof using data from the drilling of deeper holes and most importantly the digitisation of exhaustive underground sampling and drill-core assays logged on mine plans from the close-of-mine era. The indications from this work, which is now nearing completion, is that we will be in a position to declare a well-defined, high-confidence (we expect mostly JORC Indicated category resource) gold Resource on the project in the coming weeks. Subject to these results we are reasonably confident that the data will justify the immediate commissioning of a Bankable Feasibility Study (‘BFS’) which should be concluded in Q1 2013.
In the process of our studies, the acquisition of the site, our drilling campaign and plant erection at Pickstone Peerless we have invested some $15 million to date. Without this first-class foundation, the development now planned could not have happened.
With a higher grade, larger, better defined Resource imminent plus the impending commencement of a BFS, we are promoting this world-class project to a specific class of investor. Indeed we are already in exploratory discussions with several of the same. The nature of the ore body and its varying components with varying levels of CAPEX
and associated development levels, allows us to simultaneously pitch the opportunity at a variety of appetites. Preference will be given to a large-scale investment which aims at an 80,000–100,000 troz per annum production to be achieved within two years; a target which the Company believes the ore body can sustain and which would draw from both surface and underground exploitation.
That is the target we are explaining to the prospective contributors of larger scale investment whom we are in discussions with. One of the main criteria from large-scale investors is obviously scale and investments below a certain threshold automatically exclude such players. Nevertheless, as mentioned above, there is a multi-tier facet to this versatile project allowing several levels to pitch at. We have thoroughly researched and defined the smaller, still very profitable sub-sets at Pickstone Peerless which can be tackled with far lower CAPEX levels. That implies we are not limited to large-scale investors if the terms prove unattractive, even though it is sometimes true that raising $100m is easier than raising $10m. So, as per our earlier strategy iterations, we are concurrently engaged with this second tier approach to project-level partnership catering for more modest pockets. If implemented it would facilitate an earlier but steadier, more gradual growth to larger scale production. With careful planning we believe the two approaches can coexist and both succeed. Our recent specific feasibility studies that fit this parallel model include the now well understood pittable Peerless oxide ore and the high-grade Pickstone sulphide dump (up to 4.4g/t Au). Based on current costings, the Peerless oxide ore pit – where we are currently working on a detailed internal feasibility study - would require approximately $4m (combined CAPEX and working capital) with production over two years providing approximately $13m free cash for project after royalties and CAPEX recovery. The high grade sulphide dump would need approximately $7.5m funding with production over two years providing approximately$13m free cash after royalties
Chief Executive Officer’s report
2012 group annual report and its FinanCial stateMents 11
Chief Executive Officer’s report
and CAPEX recovery. Note that these profits would be at a project level and not all would flow back to ACR as dividends considering re-investment in mining and considering our indigenous and investment partners.
Exciting times are ahead with much work to do.
Kasempa & Kalengwa Copper / SilverWe have announced a lot of detail on this project and indeed our recent work confirms that this is a project with excellent potential for ore body discovery from greenfield areas, coupled with a proven asset to generate near-term cash-flow in the brownfield Kalengwa site. While this project too has partially fallen victim to the Zambian licencing confusion, the intricacies of past ownerships and dispute on classification of dumps versus minerals versus stock-piles has occupied legal minds and delayed the clear un-contested declaration of full tenure. I am pleased to report that we have made some breakthroughs in negotiating agreements. We have markedly progressed the arbitration between historical protagonists in this regard. Verbal commitment on settlement terms has been made and I am hopeful of signing the written form thereof in the coming weeks. This will entail, inter alia, a commitment by ACR to construct a copper oxide processing plant which will treat the oxide rock dump ore, but which will be suitable too for the continued exploitation of the oxide ore in the main ore body. This oxide zone stretches from surface to a depth of between 30 and 40 metres. The ore is open along strike to the north-east and south-west of the old mine pit. Head-feed from both ore sources will be targeted at between 1.2% and 1.7% Cu. This has proven to be amenable to gravity concentration up to a contained value of 23-28% Cu. The need for further flotation concentration is still being evaluated but early test-work indicates that the ultimate metal extraction from the high-carbonate oxide appears to be most efficiently served by Ammonium leach and electro-winning. The fact that the ore may carry significant silver credits necessitates further
metallurgical work to test the economics of extraction of that credit.
Our detailed work on archived drill-core, drill logs, mine pit plans and sections has achieved reliable cross-sectional modelling of the known ore-body and we are pleased to report that, subject to confirmation drill-holes to be conducted post-occupation, we anticipate the fairly prompt declaration of a JORC-compliant copper resource exceeding 170,000 metric tonnes of contained Cu metal at an average grade of 1.5% – mostly in the sulphide zone. Considering that this mostly excludes the untested, over-lying oxide zone, is estimated within confines of a depth of some 200 metres, and that the deposit is open along strike and at depth, this declaration bodes well for further resource announcements.
In fact, while the Kalengwa brownfield site promises early success in resource declarations and also offers near-term profitable cash flow, the real upside of potential is in the surrounding ground which ACR has variously partnered, acquired or contracted to explore. Measuring approximately 1,299 sq km in extent, the area has the promise of yielding discoveries of both Kalengwa-style deposits as well as the nearby Lumwana-style (African Barrick) and/or Kalumbila-style (First Quantum) deposits. The above-mentioned geophysical survey which is expected to commence in September 2012 is expected to provide the first stepping stones in this direction.
Gadzema GoldUnlike the high-grade, largely underground resource that characterises the Pickstone Peerless Project 18 miles to the south, Gadzema offers the prospect of a bulk tonnage, low-grade, open-pit mine. With a defined resource of 1.03m troz at an average 1.2g/t Au to a depth of 110m, it is not an exaggeration to state that we have barely scratched the surface. ACR has to-date resource-drilled some 2.6km of the composite 8km strike (800m in the old Giant mine zone and 1,800m in the Blue Rock / Orchard zone), and exploratory drilled some 5km showing

AFRICAN CONSOLIDATED RESOURCES PLC AND ITS SUBSIDIARIES12
at least that extent to be mineralised. In the southern Blue-Rock zones, the width of the ore body consistently exceeds 300 metre width and indications are that this width should be consistent over several kilometres. In summary, this deposit is open along strike, open at width in many parts and open at depth. Assuming no unforeseen geological anomalies, this body has the potential for multiples of the current resource.
To the untrained eye, the low average tenor needs contextual analysis. Firstly, in ore bodies such as these which have parallel high-grade zones, we have the luxury of choosing cut-off and therefore average grade. A simple sliding scale allows us to lift grade while lowering tonnes (and ounces). However, we have chosen to set an average grade at 1.2g/t Au for very good reasons. In this regard it is useful to compare similar successful deposits worldwide. There are at least 91 gold mines currently in operation containing more than 1 million ounces of gold at less than 1.2g/t average grade (source: www.intierra.com). These are commonly intrusive-style stockwork systems hosted by felsic porphyrys or intermediate volcanics, analogous to ACR’s Blue Rock ore. They include 11 giant deposits (>15Moz), such as Grasberg, Cadia, Boddington and Sukari, which total 294 million ounces of gold at an average of 0.51 g/t. In the 2-10 million ounce range are 53 deposits containing over 240 million ounces averaging 0.7 g/t. Notable producers are Sabodala, Siguiri, Cowal, Masbate and Round Mountain. Due to excellent strip ratios and high tonnage production, these deposits generally produce 100,000 to over 500,000 oz per year at very competitive cash costs. Does Gadzema host a resource capable of sustaining a 10 year mining life at such production levels? I believe it does and using cash costs from Pickstone production we would intend to advance the resource development to prove this scale.
Can we attract finance to Zimbabwe for the associated CAPEX demanded by an operation of that size? Perhaps not yet but I hope that
soon we will flesh that out with the strategic investors we are in discussions with and so progress this project. Gadzema is proof of concept and proof of our founding statement that Zimbabwe is “Elephant Country” when it comes to prospectivity for large scale gold deposits. We asserted that all it required was modern exploration and these deposits would be discovered. We applied the science and essentially, in the first place we looked, we found what we came for. It speaks volumes for the prospectivity and reinforces my view that Zimbabwe may, someday soon, return to the top ten gold-producing nations of the world.
In the case of Gadzema’s Giant Mine zone where a brownfield mine has allowed us to define an open pit of ~374,000 troz at 2.2 g /t Au it is possible that we could use the organic-growth approach from a small operation reinvesting profits. However, our preference will be to use Pickstone cash flow to invest in closer drill-patterns at this sub-site to increase certainty followed by a proper BFS and attract larger scale investment to maximise economies of scale. Any open-pit operation at Giant Mine will likely incorporate a fully quantified tailings dump resource.
Since our last reports, additional in-fill drilling and assays have firmed up the Gadzema Resource with a good conversion rate of Inferred to Indicated ounces.
Nkombwa REEs – ZambiaAlthough I have already dealt with Nkombwa above, I include it in the more mature project section as it is now on a fast-track to development and may yield value sooner than might be expected. Within the coming year (subject to the promised resolution of the aforementioned licence issue) Galileo Resources PLC has committed to an already well-defined drilling programme commencing with a ten hole diamond drilling orientation programme in order to earn-in up to 50% of the project. The mineralogy includes REEs with a robust demand profile and thereby a resilience against the often-predicted price softness that threatens to inflict REE miners. We hope that these results will be consistent
Chief Executive Officer’s report

2012 group annual report and its FinanCial stateMents 13
Chief Executive Officer’s report
with findings to date and the project is hoped to rapidly gather pace from there. I believe that we have a strong relationship with the new provincial administration in Muchinga and are excited by the prospect of bringing them development, employment, participation and success. Particularly in this regard it is valuable to note that Nkombwa also houses a significant Phosphate resource which I believe could prove a very useful economic credit as well as providing a strategically vital uplift to Muchinga and Zambia’s agriculture. Historically believed to be of low Phosphate tenor (sub 5%), recent rock chip sampling is defining zones averaging approximately 8% P2O
5 over consistent widths and as a by-
product of REE mining. Although early stage, I consider the potential fertiliser production very promising. We are committed to a community-participation in this aspect and intend to commence metallurgical test-work in the coming months.
Within Galileo we are fortunate to have two key characters: Colin Bird (CEO) has extensive experience within Zambia having piloted the substantial Kiwarra Resources discovery at Kalumbila (now in the First Quantum fold) to Resource stage. The project leader is Dr Jock Harmer, a world-recognised REE specialist geologist, crucially with an extensive working knowledge of the marketing and metallurgy of the REE field. I expect to bring continued news-flow to the market on this project in the near term and have a possibility of value extraction through possible corporate activity centred on this site.
ConclusionWe committed a year ago to tighten our focus and this we have done. The proof and success of our work is now being realised and released to the public. And so we move on to the concerted financing effort against the backdrop of a world crisis. Yet the signs I am reading – indicative of the global shift of power – lead me to a great sense of optimism.
We at ACR have had to adapt and we understand exactly how we have to adapt further. And so we will act and so we will be judged by our results. I thank all stake-holders who have contributed in these in interesting times.
Andrew N Cranswick
This report has been reviewed by Mike Kellow BSc, a member of the Australian Institute of Geologists and Technical Director of ACR. Mr Kellow meets the definition of a “qualified person” as defined in the AIM Note for Mining, Oil and Gas Companies.

AFRICAN CONSOLIDATED RESOURCES PLC AND ITS SUBSIDIARIES14
Report of the directors
The Directors present their report together with the audited financial statements for the year ended 31 March 2012.
Results and dividendsThe Group statement of comprehensive income is set out on page 22 and shows the loss for the year.
The Directors do not recommend the payment of a dividend.
Principal activities, review of business and future developmentsThe Group is engaged in the exploration for and development of mineral projects in Sub-Saharan Africa. Since incorporation the Group has built an extensive and interesting portfolio of projects in both Zimbabwe and Zambia. Both the Chairman’s and Chief Executive Officer’s reports on pages 3 to 13 provides further information on the Group’s projects and a review of the business.
The Directors consider the Group’s key performance indicators to be the rate of utilisation of the Group’s cash resources and the on-going evaluation of its exploration assets. These are detailed below.
Cash ResourcesAs can be seen from the Statement of financial position, cash resources for the Group at 31 March 2012 were approximately $3.0 million (2011: $4.9 million). During the year the cash outflows from operations were $4.6 million (2011: $3.5 million) and cash used in investing activities was $5.1 million (2011: $7.0 million). There was expenditure of some $5.1 million on capital assets the major part of which consisted of deferred exploration costs. The net monthly cash expenditure in the year to March 2012 was approximately $0.8 million. This figure reflects some increased drilling activity on the prior year as well as on-going geochemical and geophysical work. See further disclosures in Note 1 regarding going concern.
Evaluation of Exploration AreasThe Group has licences or claims over a significant number of discrete areas of exploration. It is the Group’s policy for the Board to review progress every quarter on each area in order to approve the timing and amount of further expenditure or to decide that no further expenditure is warranted. If no further expenditure is warranted for any area then the related costs will be written off. The board measures progression in each of its claim areas based on a number of factors including specific technical results, international commodity markets, claim holding costs and economic considerations. Further details are included in Note 2 and 11 of the financial statements.
Risk ManagementThe Group is exposed to a number of risks and uncertainties which could have a material impact on its long-term development and performance and management of these risks is an integral part of the management of the Group.
The Board has identified the following as being the principal strategic and operational risks (in no order of priority).
Risk – Mining exploration
Exploration for natural resources is speculative and involves significant risk. Drilling and operating risks include geological, geotechnical, seismic factors, industrial and mechanical incidents, technical failures, labour disputes and environmental hazards.
Mitigation/Comments
Management is constantly evaluating each project site by site in order to mitigate as far as possible these risks inherent in exploration. Use of modern technology and electronic tools also assist in reducing risk in this area. The maintenance of good labour is also key in reducing the exposure to labour disputes. The Group is committed to following sound environmental guidelines and is keenly aware of the issues surrounding each individual project.
for the year ended 31 March 2012

2012 group annual report and its FinanCial stateMents 15
Risk - Retention of Key Personnel
The successful achievement of the Group’s strategies, business plans and objectives depends upon its ability to attract and retain certain key personnel.
Mitigation/Comments
The Group is committed to the fostering of a management culture where management is empowered and where innovation and creativity in the workplace is encouraged. The Group’s employment terms are designed to attract, incentivise and retain individuals of the right calibre.
Risk - Country and Political
The Group’s operations are predominantly based in Zimbabwe, with a lesser exposure in Zambia. Emerging market economies could be subject to greater risks, including legal, regulatory, economic and political risks, and are potentially subject to rapid change.
Mitigation/Comments
The Group’s management team is highly experienced at operating in Africa. The Group routinely monitors political and regulatory developments in its countries of operation. In addition the Group actively engages in dialogue with relevant Government representatives in order to keep abreast of all key legal and regulatory developments applicable to its operations. The Group has a number of internal processes and checks in place to ensure that it is wholly compliant with all relevant regulations in order to maintain its mining or exploration licences within each country of operation.
These country risks are further addressed in Notes 1 and 2 to the Financial Statements.
Risk - Social, Safety and Environmental
The Group’s success may depend upon its social, safety and environmental performance, as failures can lead to delays or suspension of its mining activities.
Mitigation/Comments
The Group takes its responsibilities in these areas seriously and monitors its performance across these areas on a regular basis.
Financial instrumentsDetails of the use of financial instruments by the Company and its subsidiary undertakings are contained in Note 20 of the financial statements.
Charitable and political contributionsDuring the year the Group made charitable contributions of $90,885 (2011 - $159,003).
The Group made no political contributions during the current year or prior year.
Policy and practice on the payment of creditorsThe Group’s policy is to settle terms of payment with suppliers when agreeing terms of business, to ensure that suppliers are aware of the terms of payment and to abide by them. It is usual for suppliers to be paid within 30 days of receipt of invoice.
The number of average days purchases of the Company represented by trade creditors at 31 March 2012 was days 27 (2011 - 39 days).
DirectorsThe Directors who served during the year and up to the date hereof were as follows:-
Date of Date of Appointment Resignation
Stuart Bottomley 27 May 2005 -
Andrew Cranswick 12 April 2005 -
Michael Kellow 22 March 2006 -
Roy Tucker 5 April 2005 -
Julian Peter Emery 1 April 2011 -
Lloyd Manokore 1 April 2011 -
Report of the directors

AFRICAN CONSOLIDATED RESOURCES PLC AND ITS SUBSIDIARIES16
Directors’ interestsThe interests in the shares of the Company of the Directors who served during the year were as follows:-
Ordinary Shares Share Options Ordinary Shares Share Options held at 31 held at 31 held at 31 held at 31 March 2012 March 2012 March 2011 March 2011
Stuart Bottomley 7,376,000 - 2,376,000 3,650,000
Andrew Cranswick 9,857,115 - 8,920,727 9,115,000
Julian Emery 166,700 - - -
Michael Kellow 3,785,696 - 200,000 5,150,000
Roy Tucker 4,354,053 - 2,485,859 1,000,000
Share options Exercise Outstanding at Movements during year Outstanding at Final price 31 March 31 March Exercise 2011 Exercised Lapsed 2012 date
Stuart Bottomley
4.5p 1,000,000 (1,000,000) - - Jun-11
12.0p 550,000 - (550,000) - Jun-11
15.0p 550,000 - (550,000) - Jun-11
18.0p 550,000 - (550,000) - Jun-11
18.0p 1,000,000 - (1,000,000) - Jun-11
3,650,000 (1,000,000) (2,650,000) -
Andrew Cranswick
4.5p 1,000,000 (1,000,000) - - Jun-11
12.0p 1,705,000 - (1,705,000) - Jun-11
15.0p 1,705,000 - (1,705,000) - Jun-11
18.0p 1,705,000 - (1,705,000) - Jun-11
18.0p 3,000,000 - (3,000,000) - Jun-11
9,115,000 (1,000,000) (8,115,000) -
Michael Kellow
4.5p 2,500,000 (2,500,000) - - Jun-11
12.0p 550,000 - (550,000) - Jun-11
15.0p 550,000 - (550,000) - Jun-11
18.0p 550,000 - (550,000) - Jun-11
18.0p 1,000,000 - (1,000,000) - Jun-11
5,150,000 (2,500,000) (2,650,000) -
Roy Tucker
4.5p 1,000,000 (1,000,000) - - Jun-11
Total 18,915,000 (5,500,000) (13,415,000) -
Report of the directors

2012 group annual report and its FinanCial stateMents 17
Report of the directors
Employee Benefit TrustThe following shares are held by the Employee Benefit Trust. The Directors beneficial interest in these shares is as follows:
Subscription Outstanding at Exercised Granted Outstanding at Exercise price 31 March during last during last 31 March date 2011 12 months 12 months 2012
Stuart Bottomley 8.75p 1,500,000 - - 1,500,000 50% Jul-10 and 50% Jul-11
9.00p 750,000 - - 750,000 50% Aug-11 and 50% Aug-12
2,250,000 - - 2,250,000
Andrew Cranswick 8.75p 3,000,000 - - 3,000,000 50% Jul-10 and 50% Jul-11
9.00p 1,500,000 - - 1,500,000 50% Aug-11 and 50% Aug-12
4,500,000 - - 4,500,000
Michael Kellow 8.75p 2,000,000 - - 2,000,000 50% Jul-10 and 50% Jul-11
9.00p 1,000,000 - - 1,000,000 50% Aug-11 and 50% Aug-12
3,000,000 - - 3,000,000
Roy Tucker 8.75p 1,500,000 - - 1,500,000 50% Jul-10 and 50% Jul-11
9.00p 750,000 - - 750,000 50% Aug-11 and 50% Aug-12
2,250,000 - - 2,250,000
Total 12,000,000 - - 12,000,000
See Note 22 for further details of the EBT

AFRICAN CONSOLIDATED RESOURCES PLC AND ITS SUBSIDIARIES18
Directors’ remuneration Basic Bonuses Pension Medical Total Total salary/fees aid 2012 2011 $ $ $ $ $ $
Stuart Bottomley 56,334 - - - 56,334 46,386
Andrew Cranswick 154,647 - - 2,738 157,385 170,678
Julian Emery 39,657 - - - 39,657 -
Michael Kellow 181,912 55,525 18,228 4,290 259,955 164,072
Lloyd Manokore 39,559 - - - 39,559 -
Roy Tucker 212,681 - - - 212,681 154,622
684,790 55,525 18,228 7,028 765,571 535,758
The Company has made qualifying third party indemnity provisions for the benefit of the Directors.
AuditorsAll of the current Directors have taken all the steps that they ought to have taken to make themselves aware of any information needed by the Company’s auditors for the purposes of their audit and to establish that the auditors are aware of that information. The Directors are not aware of any relevant audit information of which the auditors are unaware.
Events after the reporting dateThis is more fully disclosed in Note 27.
By order of the Board
Roy Tucker Secretary
4 September2012
Report of the directors

2012 group annual report and its FinanCial stateMents 19
Statement of directors’ responsibilities
The Directors are responsible for preparing the annual report and the financial statements in accordance with applicable law and regulations.
Company law requires the Directors to prepare financial statements for each financial year. Under that law the Directors have elected to prepare the Group and Company financial statements in accordance with International Financial Reporting Standards (IFRSs) as adopted by the European Union. Under company law the Directors must not approve the financial statements unless they are satisfied that they give a true and fair view of the state of affairs of the Group and Company and of the profit or loss of the Group for that year. The directors are also required to prepare financial statements in accordance with the rules of the London Stock Exchange for companies trading securities on the Alternative Investment Market.
In preparing these financial statements, the Directors are required to:
• select suitable accounting policies and then apply them consistently;
• make judgements and accounting estimates that are reasonable and prudent;
• state whether they have been prepared in accordance with IFRSs as adopted by the European Union, subject to any material departures disclosed and explained in the financial statements;
• prepare the financial statements on the going concern basis unless it is inappropriate to presume that the Company will continue in business.
The Directors are responsible for keeping adequate accounting records that are sufficient to show and explain the Company’s transactions and disclose with reasonable accuracy at any time the financial position of the Company and enable them to ensure that the financial statements comply with the requirements of the Companies Act 2006. They are also responsible for safeguarding the assets of the Company and hence for taking reasonable steps for the prevention and detection of fraud and other irregularities.
Website publicationThe Directors are responsible for ensuring the annual report and the financial statements are made available on a website. Financial statements are published on the Company’s website in accordance with legislation in the United Kingdom governing the preparation and dissemination of financial statements, which may vary from legislation in other jurisdictions. The maintenance and integrity of the Company’s website is the responsibility of the Directors. The Directors’ responsibility also extends to the ongoing integrity of the financial statements contained therein.

AFRICAN CONSOLIDATED RESOURCES PLC AND ITS SUBSIDIARIES20
Independent Auditors report
We have audited the financial statements of African Consolidated Resources Plc for the year ended 31 March 2012 which comprise the group statement of comprehensive income, the Group and Company statement of changes in equity, Group and Company statement of financial position, the Group and Company statement of cash flows and the related notes. The financial reporting framework that has been applied in their preparation is applicable law and International Financial Reporting Standards (IFRSs) as adopted by the European Union and, as regards the parent company financial statements, as applied in accordance with the provisions of the Companies Act 2006.
This report is made solely to the Company’s members, as a body, in accordance with Chapter 3 of Part 16 of the Companies Act 2006. Our audit work has been undertaken so that we might state to the Company’s members those matters we are required to state to them in an auditor’s report and for no other purpose. To the fullest extent permitted by law, we do not accept or assume responsibility to anyone other than the Company and the Company’s members as a body, for our audit work, for this report, or for the opinions we have formed.
Respective responsibilities of directors and auditorsAs explained more fully in the statement of Directors’ responsibilities, the Directors are responsible for the preparation of the financial statements and for being satisfied that they give a true and fair view. Our responsibility is to audit and express an opinion on the financial statements in accordance with applicable law and International Standards on Auditing (UK and Ireland). Those standards require us to comply with the Auditing Practices Board’s (APB’s) Ethical Standards for Auditors.
Scope of the audit of the financial statementsA description of the scope of an audit of financial statements is provided on the APB’s website at www.frc.org.uk/apb/scope/private.cfm.
Opinion on financial statementsIn our opinion:
• the financial statements give a true and fair view of the state of the Group’s and the parent company’s affairs as at 31 March 2012 and of the Group’s loss for the year then ended;
• the Group financial statements have been properly prepared in accordance with IFRSs as adopted by the European Union;
• the parent company financial statements have been properly prepared in accordance with IFRSs as adopted by the European Union and as applied in accordance with the provisions of the Companies Act 2006; and
• the financial statements have been prepared in accordance with the requirements of the Companies Act 2006.
Emphasis of Matter - political and economic instability in ZimbabweIn forming our opinion on the financial statements, which is not modified, we have considered the adequacy of the Directors’ disclosure of the political instability in Zimbabwe, particularly the Indigenisation Regulation that would require transfer of 51% of all Zimbabwean projects to designated local entities (see basis of preparation in Note 1 and Note 25). The political uncertainty and the Indigenisation Regulation gives rise to a significant uncertainty over the ability of the Group and Company to realise the value of the Group’s assets.
to the members of African Consolidated Resources plc
2012 group annual report and its FinanCial stateMents 21
The financial statements do not include the adjustments that would result if 51% of the Zimbabwean projects were required to be transferred, or the current political position in Zimbabwe changed for the worse and the Group was unable to realise the aforementioned assets. These adjustments would principally be significant impairment of the Group’s exploration assets and the Company’s investment in subsidiaries.
Emphasis of Matter - going concernIn forming our opinion on the financial statements, which is not modified, we have considered the adequacy of the disclosures made in Note 1 to the financial statements concerning the company’s ability to continue as a going concern. Further funds will be required to finance the Company’s working capital requirements and the planned work programme. Although the Directors expect to be able to successfully raise the additional funds required they have no binding agreements to date. These conditions indicate the existence of a material uncertainty which may cast significant doubt about the Company’s ability to continue as a going concern. The financial statements do not include the adjustments that would result if the Company was unable to continue as a going concern.
Opinion on other matters prescribed by the Companies Act 2006In our opinion the information given in the Directors’ report for the financial year for which the financial statements are prepared is consistent with the financial statements.
Matters on which we are required to report by exceptionWe have nothing to report in respect of the following matters where the Companies Act 2006 requires us to report to you if, in our opinion:
• adequate accounting records have not been kept by the parent company, or returns adequate for our audit have not been received from branches not visited by us; or
• the parent company financial statements are not in agreement with the accounting records and returns; or
• certain disclosures of Directors’ remuneration specified by law are not made; or
• we have not received all the information and explanations we require for our audit.
Scott McNaughton (Senior Statutory Auditor)
For and on behalf of BDO LLP, statutory auditor London United Kingdom
4 September 2012
BDO LLP is a limited liability partnership registered in England and Wales (with registered number OC305127).
Independent Auditors report

AFRICAN CONSOLIDATED RESOURCES PLC AND ITS SUBSIDIARIES22
Group statement of comprehensive income
31 March 2012 31 March 2011 Group Group Notes $ $
Revenue - -
Share options write back/(expenses) 22 409,113 (232,185)
Other administrative expenses (4,211,435) (3,559,972)
Impairment of intangible assets (787,894) (52,251)
Administrative expenses (4,590,216) (3,844,408)
Operating loss 3 (4,590,216) (3,844,408)
Finance income 5 27,616 35,328
Loss before and after taxation attributable to (4,562,600) (3,809,080)the equity holders of the parent company
Other comprehensive income
Gain on available for sale financial assets 19,044 5,903
Total comprehensive loss attributable to the equity holders of the parent company (4,543,556) (3,803,177)
Loss per share – basic and diluted 9 (1.08) cents (1.09) cents
All amounts above relate to continuing operations.
The accompanying accounting policies and Notes on pages 27 - 52 form an integral part of these financial statements.
for the year ended 31 March 2012

2012 group annual report and its FinanCial stateMents 23
Group statement of changes in equity
Share Share Share Foreign Available EBT Retained Total capital premium option currency for sale reserve earnings/ account account reserve translation reserve (losses) reserve
Group $ $ $ $ $ $ $ $
At 31 March 2010 6,279,489 40,292,591 2,266,598 (1,854,891) (18,507) (1,734,305) (10,298,770) 34,932,205
Loss for the year - - - - - - (3,809,080) (3,809,080)
Other comprehensive income - - - - 5,903 - - 5,903
Total comprehensive - - - - 5,903 - (3,809,080) (3,803,177)
loss for the year
Credit in respect of share - - 20,891 - - - - 20,891
option charges
Share options exercised - - (48,840) - - - 48,840 -
Shares issued:
- for purchase of assets 83,306 616,694 - - - - - 700,000
- to the EBT 79,363 654,752 - - - (734,115) - -
- in respect of fees 17,559 158,029 - - - - - 175,588
At 31 March 2011 6,459,717 41,722,066 2,238,649 (1,854,891) (12,604) (2,468,420) (14,059,010) 32,025,507
Loss for the year - - - - - - (4,562,600) (4,562,600)
Other comprehensive income - - - - 19,044 - - 19,044
Total comprehensive - - - - 19,044 - (4,562,600) (4,543,556)
loss for the year
Net write off in respect of - - (24,030) - - - - (24,030)
share option charges
Share options exercised - - (165,183) - - - 165,183 -
Share options lapsed - - (2,044,315) - - - 2,044,315 -
Shares issued:
- for cash consideration 1,266,721 6,333,603 - - - - - 7,600,324
- in respect of share options 125,551 439,430 - - - - - 564,981
- for purchase of assets 39,744 147,163 - - - - - 186,907
- in respect of fees 16,316 146,843 - - - - - 163,159
(including Directors)
- share issue costs - (306,644) - - - - - (306,644)
At 31 March 2012 7,908,049 48,482,461 5,121 (1,854,891) 6,440 (2,468,420) (16,412,112) 35,666,648
The accompanying accounting policies and Notes on pages 27 - 52 form an integral part of these financial statements.
for the year ended 31 March 2012

AFRICAN CONSOLIDATED RESOURCES PLC AND ITS SUBSIDIARIES24
Company statement of changes in equity
Share Share Share Foreign EBT Retained Total capital premium option currency reserve earnings/ account account reserve translation (losses) reserve
Company $ $ $ $ $ $ $
At 31 March 2010 6,279,489 40,292,591 2,266,598 (4,953,777) (1,734,305) (6,735,938) 35,414,658
Total comprehensive loss for the year - - - - - (1,565,614) (1,565,614)
Credit in respect of share option charges - - 20,891 - - - 20,891
Share options lapsed - - (48,840) - - 48,840 -
Shares issued:
- for purchase of assets 83,306 616,694 - - - - 700,000
- to the EBT 79,363 654,752 - - (734,115) - -
- in respect of fees 17,559 158,029 - - - - 175,588
At 31 March 2011 6,459,717 41,722,066 2,238,649 (4,953,777) (2,468,420) (8,252,712) 34,745,523
Total comprehensive loss for the year - - - - - (1,278,924) (1,278,924)
Net write off in respect of - - (24,030) - - - (24,030)
share option charges
Share options exercised - - (165,183) - - 165,183 -
Share options lapsed - - (2,044,315) - - 2,044,315 -
Shares issued:
- for cash consideration 1,266,721 6,333,603 - - - - 7,600,324
- in respect of share options 125,551 439,430 - - - - 564,981
- for purchase of assets 39,744 147,163 - - - - 186,907
- in respect of fees 16,316 146,843 - - - - 163,159
(including Directors)
- share issue costs - (306,644) - - - - (306,644)
At 31 March 2012 7,908,049 48,482,461 5,121 (4,953,777) (2,468,420) (7,322,138) 41,651,296
The accompanying accounting policies and Notes on pages 27 - 52 form an integral part of these financial statements.
for the year ended 31 March 2012

2012 group annual report and its FinanCial stateMents 25
Group and Company statements of financial position
31 March 31 March 31 March 31 March 2012 2011 2012 2011 Group Group Company Company
ASSETS Notes $ $ $ $
Non-current assets
Intangible assets 11 28,896,056 24,800,200 3,869,131 3,697,219
Property, plant and equipment 12 3,099,937 2,975,314 1,581,592 1,443,806
Available for sale investments 13 49,460 31,572 566 566
Investment in subsidiaries 14 - - 219,104 219,104
Loan to group companies 15 - - 33,401,577 25,898,735
32,045,453 27,807,086 39,071,970 31,259,430
Current assets
Inventory 16 9,493 60,161 - -
Receivables 17 1,023,467 403,013 216,684 145,330
Available for sale investments 18 16,373 15,217 - -
Cash and cash equivalents 3,031,019 4,928,518 2,656,777 4,102,457
Total current assets 4,080,352 5,406,909 2,873,461 4,247,787
Total Assets 36,125,805 33,213,995 41,945,431 35,507,217
EquiTy AND LiABiLiTiES
Capital and reserves attributable
to equity holders of the Company
Called-up share capital 21 7,908,049 6,459,717 7,908,049 6,459,717
Share premium account 21 48,482,461 41,722,066 48,482,461 41,722,066
Available for sale reserve 23 6,440 (12,604) - -
Share option reserve 23 5,121 2,238,649 5,121 2,238,649
Foreign currency translation reserve 23 (1,854,891) (1,854,891) (4,953,777) (4,953,777)
EBT reserve 23 (2,468,420) (2,468,420) (2,468,420) (2,468,420)
Retained earnings 23 (16,412,112) (14,059,010) (7,322,138) (8,252,712)
Total equity 35,666,648 32,025,507 41,651,296 34,745,523
Current liabilities
Trade and other payables 19 459,157 1,188,488 294,135 761,694
Total current liabilities 459,157 1,188,488 294,135 761,694
Total Equity and Liabilities 36,125,805 33,213,995 41,945,431 35,507,217
The accompanying accounting policies and Notes on pages 27 - 52 form an integral part of these financial statements. The Financial Statements on pages 19 - 52 were approved and authorised for issue by the Board of Directors on 4 September 2012 and were signed on its behalf by:
Roy C TuckerDirector Registered number 05414325
as at 31 March 2012

AFRICAN CONSOLIDATED RESOURCES PLC AND ITS SUBSIDIARIES26
Group and Company statements of cash flow
2012 2011 2012 2011 Group Group Company Company
CASH FLOW FROM OPERATING ACTIVITES $ $ $ $
Loss for the year (4,562,600) (3,809,080) (1,278,924) (1,565,614)
Adjustments for:
Depreciation 88,147 77,896 41,702 11,924
Impairment charge on intangible assets 787,894 52,251 204,139 13,940
Unrealised exchange loss/(gain) on cash and cash equivalents 53,511 (38,399) 53,509 (38,689)
Finance income (27,616) (35,328) (955,496) (819,284)
Profit on sale of property, plant and equipment (12,791) (33,084) - -
Liabilities settled in shares 366,240 175,588 366,240 175,588
Share option charges (409,113) 232,185 (409,113) 232,185
(3,716,328) (3,377,971) (1,977,943) (1,989,950)
Changes in working capital:
(Increase)/Decrease in receivables (620,454) 106,434 (71,354) 24,766
Decrease/(Increase) in inventories 50,668 (40,417) - -
Decrease in payables (344,248) (192,402) (82,476) (146,975)
(914,034) (126,385) (153,830) (122,209)
Cash used in operations (4,630,362) (3,504,356) (2,131,773) (2,112,159)
investing activities:
Payments to acquire intangible assets (4,628,930) (5,559,589) (333,522) (357,047)
Payments to acquire property, plant and equipment (477,911) (1,513,382) (222,017) (700,183)
Proceeds on disposal of property, plant and equipment 23,112 33,192 - -
Increase in loan to group companies - - (6,570,601) (7,783,419)
Interest received 27,616 35,328 23,255 33,477
(5,056,113) (7,004,451) (7,102,885) (8,807,172)
Financing Activities:
Proceeds from the issue of ordinary shares, net of issue costs 7,842,487 - 7,842,487 -
(Decrease)/increase in cash and cash equivalents (1,843,988) (10,508,807) (1,392,171) (10,919,331)
Cash and cash equivalents at beginning of year 4,928,518 15,398,926 4,102,457 14,983,099
Exchange gain on cash and cash equivalents (53,511) 38,399 (53,509) 38,689
Cash and cash equivalents at end of year 3,031,019 4,928,518 2,656,777 4,102,457
The accompanying accounting policies and Notes on pages 27 - 52 form an integral part of these financial statements.
for the year ended 31 March 2012

2012 group annual report and its FinanCial stateMents 27
Statement of accounting policies
1 Accounting PoliciesBasis of preparationThe principal accounting policies adopted in the preparation of the financial information are set out below. The policies have been consistently applied throughout the current year and prior year, unless otherwise stated. These financial statements have been prepared in accordance with International Financial Reporting Standards (IFRSs and IFRIC interpretations) issued by the International Accounting Standards Board (IASB) as adopted by the European Union and with those parts of the Companies Act 2006 applicable to companies preparing their accounts under IFRS.
The consolidated financial statements incorporate the results of African Consolidated Resources plc and its subsidiary undertakings as at 31 March 2012.
The Group currently does not have sufficient funds to finance its planned work programmes, corporate overhead and working capital needs for the next twelve months. At the date of publication of this Report the Company has successfully concluded an equity placing to meet part of this funding requirement and is also in negotiations with prospective purchasers to realize the monetization of its Harare office building. Further fundraising will be required by the end of 2012 and it is the opinion of the Directors that sufficient funds will be forthcoming.
On this basis the Directors are confident of being able to raise the required funds at a price acceptable to existing shareholders.
There can however be no certainty that these transactions will complete and there therefore exists a material uncertainty which may cast significant doubt over the Group’s ability to continue as a going concern. These financial statements do not include the adjustments that would be required if the Group could not continue as a going concern. These would principally be impairing the carrying values of the mining projects to value in a distressed sale.
In the preparation of the financial statements the Directors have considered the current political and economic uncertainty in Zimbabwe and the impact on the Group and Company.
Since the formation of a Government of National Unity in 2008 and the subsequent dollarisation of the economy, much progress has been made in stabilising the national economy. While divisions still remain in the Unity Government, it is perceived that this trend of recovery is likely to continue.
The Zimbabwean Government’s policy on indigenisation remains unclear with several conflicting statements being made by both sides within the Unity Government. The Government has issued further regulations in respect of the Mining sector, which are expanded upon further in Note 25 to these Financial Statements.
The Directors have further considered the quality of the assets held by the Company through its investment in its subsidiary undertakings in Zimbabwe. They have concluded that whilst the current political and economic uncertainty gives rise to uncertainty over the ability of the Group and Company to realise the value of the Group’s assets and the Company’s investment in Zimbabwe for the benefit of the Company’s shareholders, the directors remain confident that in the longer term, it will not materially impact the Company’s ability to realise the value of its investments for its shareholders.
Changes in Accounting PoliciesNew and amended Standards effective for 31 March 2012 year-end adopted by the Group:
The following new standards and amendments to standards are mandatory for the first time for the Group for financial year beginning 1 April 2011. Except as noted, the implementation of these standards is not expected to have a material effect on the Group.
for the year ended 31 March 2012

AFRICAN CONSOLIDATED RESOURCES PLC AND ITS SUBSIDIARIES28
Standard Effective date Impact on initial application
IFRIC 19 Extinguishing Financial 1 Jul 2010 This Interpretation addresses transactions in which an entity issues equity Liabilities with Equity Instruments instruments to a creditor in return for the extinguishment of all or part of a
financial liability.
Revised IAS 24 Related Party 1 Jan 2011 The revision to IAS 24 is in response to concerns that the previous disclosure Disclosures requirements and the definition of a related party were too complex and difficult
to apply in practice, especially in environments where government control is pervasive.
Improvements to IFRSs (2010) Generally The improvements in this Amendment clarify the requirements of IFRSs and 1 January 2011 eliminate inconsistencies within and between Standards. The improvements did
not have any impact on the current or prior years’ financial statements.
No other IFRS issued and adopted are expected to have an impact on the Group’s financial statements. All other new standards and interpretations that were effective for the year ended 31 March 2012 have been adopted, but have not had a material effect on the Group.
Standards, amendments and interpretations, which are effective for reporting periods beginning after the date of these financial statements which have not been adopted early:
Standard Description Effective date
IFRS 7 Disclosures – Transfers of Financial Assets (Amendments to IFRS 7) 1 Jul 2011
IAS 12 * Deferred Tax: Recovery of Underlying Assets 1 Jan 2012
IAS 1 * Presentation of items of other comprehensive income (amendments to IAS 1) 1 Jul 2012
IAS 27* Separate Financial Statements 1 Jan 2013
IAS 28* Investments in Associates and Joint Ventures 1 Jan 2013
IAS 19* Employee Benefits 1 Jan 2013
IFRS 7* Disclosures—Offsetting Financial Assets and Financial Liabilities 1 Jan 2013
IAS 32* Offsetting financial assets and financial liabilities 1 Jan 2014
IFRS 9* Financial Instruments 1 Jan 2015
IFRS 10* Consolidated Financial Statements 1 Jan 2013
IFRS 11* Joint Arrangements 1 Jan 2013
IFRS 12* Disclosure of Interests in Other Entities 1 Jan 2013
IFRS 13* Fair Value Measurement 1 Jan 2013
* Not yet endorsed by European Union.
The above standards, interpretations and amendments are not expected to significantly affect the Group’s results or financial position. The adoption of IFRS 9 will eventually replace IAS 39 in its entirety and consequently may have a material affect the presentation, classification, measurement and disclosures of the Group’s financial instruments.
Statement of accounting policies

2012 group annual report and its FinanCial stateMents 29
Statement of accounting policies
Areas of estimates and judgementThe preparation of the Group financial statements in conformity with generally accepted accounting principles requires the use of estimates and assumptions that affect the reported amounts of assets and liabilities and disclosure of contingent assets and liabilities at the date of the financial statements and the reported amounts of revenues and expenses during the reporting period. Although these estimates are based on management’s best knowledge of current events and actions, actual results may ultimately differ from those estimates. The estimates and assumptions that have a significant risk of causing a material adjustment to the carrying amounts of assets and liabilities in the next financial year are discussed below:
a) Useful lives of property, plant & equipment
Property, plant and equipment are depreciated over their useful economic lives. Useful economic lives are based on management’s estimates of the period that the assets will be in operational use, which are periodically reviewed for continued appropriateness. Due to the long life of certain assets, changes to estimates used can result in significant variations in the carrying value. More details, including carrying values, are included in Note 12 to the financial statements.
b) Impairment of intangibles/assets
The Group reviews, on an annual basis, whether deferred exploration costs, mining options and licence acquisition costs have suffered any impairment. The recoverable amounts are determined based on an assessment of the economically recoverable mineral reserves, the ability of the Group to obtain the necessary financing to complete the development of the reserves and future profitable production or proceeds from the disposition of recoverable reserves. Actual outcomes may vary. More details, including carrying values, are included in Note 11 to the financial statements.
c) Share based payments
The Group operates an equity settled and cash settled share based remuneration scheme for key employees. Employee services received, and the corresponding increase in equity, are measured by reference to the fair value of equity instruments at the date of grant. The fair value of the share options is estimated by using the Black Scholes model on the date of grant based on certain assumptions. Those assumptions are described in Note 22 and include, among others, the expected volatility and expected life of the options.
Basis of consolidationWhere the Company has the power, either directly or indirectly, to govern the financial and operating policies of another entity or business so as to obtain benefits from its activities, it is classified as a subsidiary. The financial information presents the results of the Company and its subsidiaries (the “Group”) as if they formed a single entity. Inter-company transactions and balances between Group companies are therefore eliminated in full.
Business combinationsThe financial information incorporate the results of business combinations using the purchase method. In the statement of changes in equity, the acquiree’s identifiable assets, liabilities and contingent liabilities are initially recognised at their fair values at the acquisition date. The results of acquired operations are included in the Group statement of comprehensive income from the date on which control is obtained. The licences acquired have been valued at their fair value using appropriate valuation techniques and posted to intangible assets.
RevenueThe Group and Company had no revenue during the year.
Foreign currencyThe functional currency of the Company and all of its subsidiaries is the United States Dollar, which is the currency of the primary economic environment in which the Company and all of its subsidiaries operate.
Transactions entered into by the Group entities in a currency other than the currency of the primary economic environment in which it operates (the “functional currency”) are recorded at the rates ruling when the transactions occur. Foreign currency monetary assets and liabilities are translated at the rates ruling at the date of the statement of financial position. Exchange differences arising on the retranslation of unsettled monetary assets and liabilities are similarly recognised immediately in profit or loss, except for foreign currency borrowings qualifying as a hedge of a net investment in a foreign operation.
In accordance with the UK Registrar of companies’ requirement the exchange rates applied at each reporting date were as follows:
• 31 March 2012 $1.5990:£1
• 31 March 2011 $1.6033:£1
• 31 March 2010 $1.5067:£1

AFRICAN CONSOLIDATED RESOURCES PLC AND ITS SUBSIDIARIES30
Provision for abandonment costsProvision for abandonment costs are recognised when an obligation for restoration arises which is usually at the commencement of mining. The amount recognised is the present value of the estimated future expenditure determined in accordance with local conditions and requirements. The present value is calculated by discounting the future cash flows at a pre tax rate that reflects current market assessments of the time value of money at that time. A corresponding property, plant and equipment asset of an amount equivalent to the provision is also created. This is subsequently depreciated as part of the capital costs of production. Any change in the present value of the estimated expenditure is reflected as an adjustment to the provision and the property, plant and equipment assets. As at the reporting date the Group had no such provision.
Share based paymentsEquity-settled share based payments
Where share options are awarded to employees, the fair value of the options at the date of grant is charged to profit or loss over the vesting period. Non-market vesting conditions are taken into account by adjusting the number of equity instruments expected to vest at each reporting date so that, ultimately, the cumulative amount recognised over the vesting period is based on the number of options that eventually vest. Market vesting conditions are factored into the fair value of the options granted. As long as all other vesting conditions are satisfied, a charge is made irrespective of whether the market vesting conditions are satisfied. The cumulative expense is not adjusted for failure to achieve a market vesting condition.
Where the terms and conditions of options are modified before they vest, the increase in the fair value of the options, measured immediately before and after the modification, is also charged to profit or loss over the remaining vesting period.
Where equity instruments are granted to persons other than employees, the fair value of goods and services received is charged to profit or loss, except where it is in respect to costs associated with the issue of shares, in which case, it is charged to the share premium account.
Cash-settled share based payments
The Company also has cash-settled share based payments arising in respect of the EBT (see below and Note 22). A liability is recognised in respect of the fair-value of the benefit received under the EBT and charged to profit or loss over the vesting period. The fair-value is re-measured at each reporting date with any changes taken to profit or loss.
Employee Benefit Trust (“EBT”)The Company has established an Employee Benefit Trust. The assets and liabilities of this trust comprise shares in the Company and loan balances due to the Company. The Company includes the EBT within its accounts and therefore recognises an EBT reserve in respect of the amounts loaned to the EBT and used to purchase shares in the Company. Any cash received by the EBT on disposal of the shares it holds will be recognised directly in equity. Any shares held by the EBT are treated as cancelled for the purposes of calculating earnings per share.
TaxThe major components of income tax on the profit or loss include current and deferred tax.
Current tax
Current tax is based on the profit or loss adjusted for items that are non-assessable or disallowed and is calculated using tax rates that have been enacted or substantively enacted by the balance sheet date.
Income tax is charged or credited to the statement of comprehensive income, except when the tax relates to items credited or charged directly to equity, in which case the tax is also dealt with in equity.
Deferred tax
Deferred tax assets and liabilities are recognised where the carrying amount of an asset or liability in the balance sheet differs to its tax base, except for differences arising on:
• The initial recognition of goodwill;
• The initial recognition of an asset or liability in a transaction which is not a business combination and at the time of the transaction affects neither accounting or taxable profit; and
• Investments in subsidiaries and jointly controlled entities where the Group is able to control the timing of the reversal of the difference and it is probable that the differences will not reverse in the foreseeable future.
Recognition of deferred tax assets is restricted to those instances where it is probable that taxable profit will be available against which the difference can be utilised.
The amount of the asset or liability is determined using tax rates that have been enacted or substantively enacted by the reporting date and are expected to apply when deferred tax liabilities/(assets) are settled/(recovered). Deferred tax balances are not discounted.
Statement of accounting policies

2012 group annual report and its FinanCial stateMents 31
Statement of accounting policies
Intangible assetsDeferred development and exploration costs
Once a licence has been obtained, all costs associated with mining property development and investment are capitalized on a project-by-project basis pending determination of the feasibility of the project. Costs incurred include appropriate technical and administrative expenses but not general overheads. If a mining property development project is successful, the related expenditures will be amortised over the estimated life of the commercial ore reserves on a unit of production basis. Where a licence is relinquished, a project is abandoned, or is considered to be of no further commercial value to the Group, the related costs will be written off.
Unevaluated mining properties are assessed at each year end and where there are indications of impairment these costs are written off to the income statement. The recoverability of deferred mining property costs and interests is dependent upon the discovery of economically recoverable reserves, the ability of the Group to obtain necessary financing to complete the development of reserves and future profitable production or proceeds from the disposition of recoverable reserves.
If commercial reserves are developed, the related deferred development and exploration costs are then reclassified as development and production assets within property, plant and equipment.
Proved mining properties
Depletion and amortisation of the full-cost pools is computed using the units-of-production method based on proved reserves as determined annually by management.
Mineral rights
Mineral rights are recorded at cost less amortisation and provision for diminution in value. Amortisation will be over the estimated life of the commercial ore reserves on a unit of production basis.
Licences for the exploration of natural resources will be amortised over the lower of the life of the licence and the estimated life of the commercial ore reserves on a unit of production basis.
Property, plant and equipmentLand is not depreciated. Items of property, plant and equipment are initially recognised at cost and are subsequently carried at depreciated cost. As well as the purchase price, cost includes directly attributable costs and the estimated present value of any future costs of dismantling and removing items. The corresponding liability is recognised within provisions.
Depreciation is provided on all other items of property and equipment is to write off the carrying value of items over their expected useful economic lives. It is applied at the following rates:
Buildings — 2.5% per annum, straight line
Plant and machinery — 25% per annum, straight line
Fixtures and fittings — 25% per annum, straight line
Aircraft — 5% per annum, reducing balance
Computer equipment — 33% per annum, straight line
Motor vehicles — 20% per annum, straight line
Financial assetsThe Group’s financial assets consist of cash and cash equivalents, other receivables and available for sale investments. The Group’s accounting policy for each category of financial asset is as follows:
Loans and receivables
These assets are non-derivative financial assets with fixed or determinable payments that are not quoted in an active market. They are initially recognised at fair value plus transaction costs that are directly attributable to their acquisition or issue, and are subsequently carried at amortised cost using the effective interest rate method, less provision for impairment.
Impairment provisions are recognised when there is objective evidence (such as significant financial difficulties on the part of the counterparty or default or significant delay in payment) that the Group will be unable to collect all of the amounts due under the terms receivable, the amount of such a provision being the difference between the net carrying amount and the present value of the future expected cash flows associated with the impaired receivable. For receivables, which are reported net, such provisions are recorded in a separate allowance account with the loss being recognised within administrative expenses in the statement of comprehensive income. On confirmation that the receivable will not be collectable, the gross carrying value of the asset is written off against the associated provision.
The Group’s loans and receivables comprise other receivables and cash and cash equivalents in the statement of financial position.
Cash and cash equivalents
Comprises cash in hand and balances with banks. Cash equivalents are short term, highly liquid accounts that are readily converted to known amounts of cash. They include short term bank deposits originally purchased with maturities of less than three months.

AFRICAN CONSOLIDATED RESOURCES PLC AND ITS SUBSIDIARIES32
Statement of accounting policies
There is no significant difference between the carrying value and fair value of receivables.
Available for sale
Non-derivative financial assets not included in the categories above are classified as available-for-sale and comprise the Group’s strategic investments in entities not qualifying as subsidiaries, associates or jointly controlled entities. They are carried at fair value with changes in fair value recognised directly in equity. Where a decline in the fair value of an available-for-sale financial asset constitutes evidence of impairment, for example if the decline is significant or prolonged, the amount of the loss is removed from equity and recognised in the profit or loss for the year.
Financial liabilitiesThe Group’s financial liabilities consist of trade and other payables, which are initially recognised at fair value and subsequently carried at amortised cost, using the effective interest method.
InventoriesInventories are initially recognised at cost, and subsequently at the lower of cost and net realisable value. Cost comprises all costs of purchase, costs of conversion and other costs incurred in bringing the inventories to their present location and condition. Weighted average cost is used to determine the cost of ordinarily inter-changeable items.
Leased assetsWhere assets are financed by leasing agreements that do not give rights approximating ownership, these are treated as operating leases. The annual rentals are charged to profit or loss on a straight line basis over the term of the lease.
Pension costsContributions to defined contribution pension schemes are charged to profit or loss in the year to which they relate.

2012 group annual report and its FinanCial stateMents 33
Notes to the financial statements
2 Segmental analysisThe Group operates in one business segment, the exploration and development for mineral assets and only has interests in one geographical segment being Southern Africa, primarily Zimbabwe. The Group has not generated any revenue to date and therefore no disclosures are provided with respect to revenues.
The Group’s operations are reviewed by the Board (which is considered to be the Chief Operating Decision Maker (‘CODM’)) on a project by project basis and split between exploration and development and administration and corporate costs.
Exploration and development is reported to the CODM only on the basis of those costs incurred directly on projects, once incurred. All costs incurred on the projects are capitalised in accordance with IFRS 6, including depreciation charges in respect of tangible assets used on the projects.
Administration and corporate costs are further reviewed on the basis of where they are incurred, being either Southern Africa or the UK.
Decisions are made about where to allocate cash resources based on the status of each project and according to the Group’s strategy to develop the projects. Each project, if taken into commercial development, has the potential to be a separate operating segment. Operating segments are disclosed below on the basis of the split between exploration and development and administration and corporate. Further information is provided on the non-current intangible assets attributable to exploration and development on a project by project basis as this is the primary basis for reviewing operating segments.
Exploration and Administration Total development and corporate 2012 $ $ $
Depreciation 254,820 88,147 342,967
Share based payments - (409,113) (409,113)
Interest revenues - 27,616 27,616
Loss for the period - 4,562,600 4,562,600
Total assets 30,684,344 5,441,461 36,125,805
Total non-current assets 30,559,874 1,485,579 32,045,453
Additions to non-current assets 4,278,614 40,333 4,318,947
Total current assets 124,470 3,955,882 4,080,352
Total liabilities 109,242 349,915 459,157
2011
Depreciation 275,009 77,896 352,905
Share based payments - 232,185 232,185
Interest revenues - 35,328 35,328
Loss for the period - 3,809,080 3,809,080
Total assets 31,354,540 1,859,455 33,213,995
Total non-current assets 26,291,085 1,516,001 27,807,086
Additions to non-current assets 6,461,762 1,428,217 7,889,979
Total current assets 5,063,455 343,454 5,406,909
Total liabilities 516,699 671,789 1,188,488
There are no non-current assets held in the Company’s country of domicile, being the UK (2011: $Nil).
for the year ended 31 March 2012

AFRICAN CONSOLIDATED RESOURCES PLC AND ITS SUBSIDIARIES34
3 Group loss from operations 2012 2011 Group Group $ $
Operating loss is stated after charging/(crediting):
Annual Return Fees 44,993 31,400
Auditors’ remuneration 84,110 82,305
Charitable contributions 90,885 159,003
Depreciation 88,147 77,896
Consulting Fees 506,864 500,524
Employee pension costs 18,228 14,850
Employee share option (write back)/expense (409,113) 232,185
Foreign exchange loss/(gains) 53,511 (38,399)
Impairment for intangibles 787,894 52,251
Legal & Secretarial Fees 290,152 557,717
Marketing 82,602 109,291
Office lease 76,100 91,565
Travel & Accommodation 393,365 273,267
Wages and salaries (Note 7) 751,375 539,297
Profit on disposal of property, plant and equipment (12,791) (33,084)
$87,350 (2011: $20,891) of the employee share option expense arises on equity-settled share based payment transactions and a write back of $(496,463) (2011: $211,294) arising on cash-settled share based payment transactions.
4 Auditors’ remunerationAudit servicesStatutory audit of the Company 55,991 55,330
Statutory audit of subsidiaries 28,119 26,975
84,110 82,305
5 Finance income Interest received on bank deposits 27,616 35,328
Notes to the financial statements
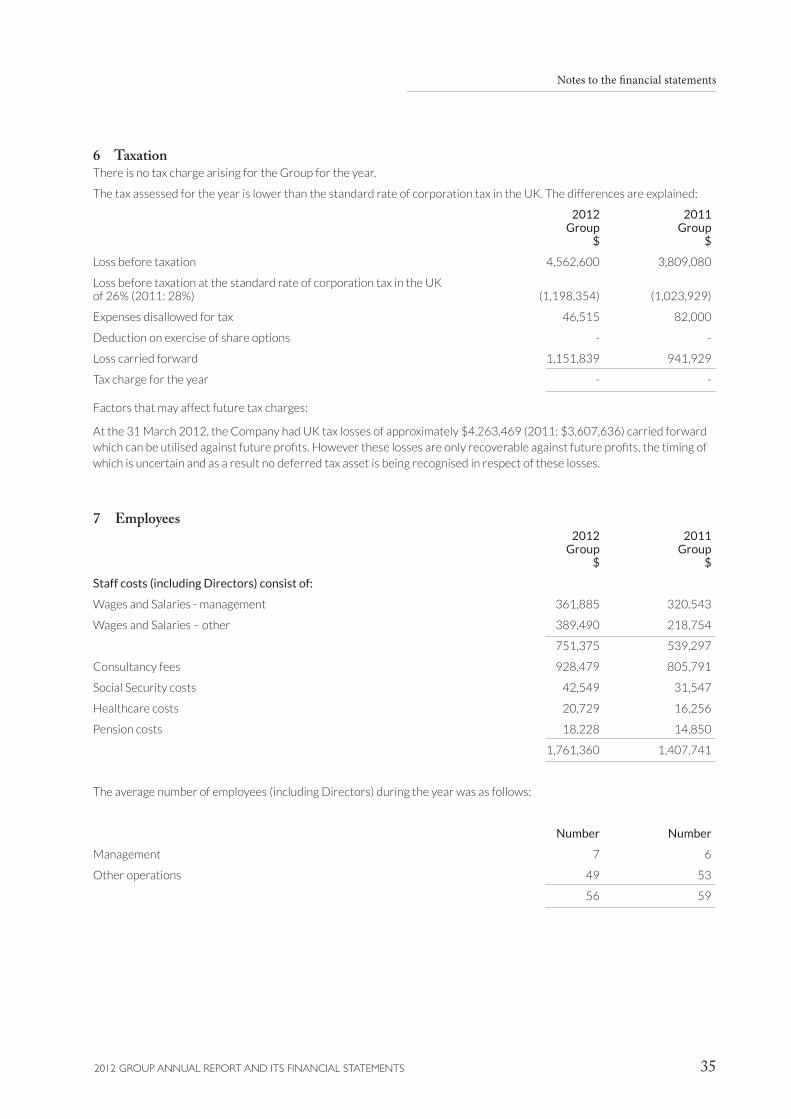
2012 group annual report and its FinanCial stateMents 35
Notes to the financial statements
6 Taxation There is no tax charge arising for the Group for the year.
The tax assessed for the year is lower than the standard rate of corporation tax in the UK. The differences are explained:
2012 2011 Group Group $ $
Loss before taxation 4,562,600 3,809,080
Loss before taxation at the standard rate of corporation tax in the UK of 26% (2011: 28%) (1,198,354) (1,023,929)
Expenses disallowed for tax 46,515 82,000
Deduction on exercise of share options - -
Loss carried forward 1,151,839 941,929
Tax charge for the year - -
Factors that may affect future tax charges:
At the 31 March 2012, the Company had UK tax losses of approximately $4,263,469 (2011: $3,607,636) carried forward which can be utilised against future profits. However these losses are only recoverable against future profits, the timing of which is uncertain and as a result no deferred tax asset is being recognised in respect of these losses.
7 Employees 2012 2011 Group Group $ $
Staff costs (including Directors) consist of:
Wages and Salaries - management 361,885 320,543
Wages and Salaries – other 389,490 218,754
751,375 539,297
Consultancy fees 928,479 805,791
Social Security costs 42,549 31,547
Healthcare costs 20,729 16,256
Pension costs 18,228 14,850
1,761,360 1,407,741
The average number of employees (including Directors) during the year was as follows:
Number Number
Management 7 6
Other operations 49 53
56 59

AFRICAN CONSOLIDATED RESOURCES PLC AND ITS SUBSIDIARIES36
8 Directors’ remuneration 2012 2011 Company Company $ $
Directors’ emoluments 259,000 277,994
Company contributions to pension schemes 18,228 14,850
Healthcare costs 7,028 5,824
Amounts paid to third parties in respect of directors’ services 319,189 237,090
Share based payment charges 162,126 -
Directors’ and key management remuneration 765,571 535,758
Gain on share options exercised by directors 133,289 - (not charged to profit or loss as explained below)
The Directors are considered to be the key management of the Group and Company.
One director (2011: one) accrued benefits under a defined contribution pension scheme during the year. The gain on exercise of the options amounted to $133,289 (2011: $Nil). This is not charged to profit or loss as the fair value of the options issued is reflected in the share based payment charges. Four directors have share options receivable under long term incentive schemes. The highest paid director was Michael Kellow with an amount of $259,995.
9 Loss per shareLoss per Ordinary Share has been calculated using the weighted average number of Ordinary Shares in issue during the relevant financial year.
2012 2011 Group Group
The weighted average number of Ordinary Shares in issue for the year is 422,027,914 349,675,876
Losses for the Group for the year are $(4,562,600) $(3,809,080)
Loss per share basic and diluted (1.081c) (1.089c)
The effect of all potentially dilutive share options is anti-dilutive. Details of the share options which may dilute the loss per share are disclosed in Note 22 in the financial statements.
10 Loss for the financial yearThe Company has taken advantage of the exemption allowed under Section 408(1b) of the Companies Act 2006 and has not presented its own income statement in these financial statements. The Group loss for the year includes a loss after taxation of $1,278,924 (2011: $1,565,614), which is dealt with in the financial statements of the parent company.
Notes to the financial statements

2012 group annual report and its FinanCial stateMents 37
Notes to the financial statements
11 Intangible assets Deferred Mining Licence Total exploration options acquisition costs costs Group $ $ $ $
Cost at 31 March 2011 19,849,204 10,000 4,940,996 24,800,200
Additions during the year 4,780,343 75,000 28,407 4,883,750
Amount provided for impairment (752,894) - (35,000) (787,894)
Cost at 31 March 2012 23,876,653 85,000 4,934,403 28,896,056
Cost at 31 March 2010 14,172,606 - 4,845,246 19,017,852
Additions during the period 5,728,849 10,000 95,750 5,834,599
Amount provided for impairment (52,251) - - (52,251)
Cost at 31 March 2011 19,849,204 10,000 4,940,996 24,800,200
Company
Cost at 31 March 2011 2,547,444 - 1,149,775 3,697,219
Additions during the year 326,051 50,000 - 376,051
Amount provided for impairment (204,139) - - (204,139)
Cost at 31 March 2012 2,669,356 50,000 1,149,775 3,869,131
Cost at 31 March 2010 2,182,612 - 1,149,775 3,332,387
Additions during the period 378,772 - - 378,772
Amount provided for impairment (13,940) - - (13,940)
Cost at 31 March 2011 2,547,444 - 1,149,775 3,697,219

AFRICAN CONSOLIDATED RESOURCES PLC AND ITS SUBSIDIARIES38
Intangible assets by project 2012 2011 Group Group $ $
Gold
Chakari Gold 289,458 222,810
Gadzema 11,636,601 8,989,572
One Step 538,379 496,972
Pickstone Peerless 7,977,313 7,320,561
Copper
Cedric - 382,233
Diamonds
Diamond Regional 3,223,409 2,794,740
Marange 1,411,300 1,411,300
Phosphates
Chishanya 417,355 345,705
Nickel
Perseverance 1,516,277 1,197,477
Platinum Group Elements
Snake’s Head 1,091,407 946,094
Various
Other 794,557 692,736
28,896,056 24,800,200
See Note 26 in respect of the Marange licence, the carrying value of which is $1,411,300 (2011: $1,411,300) in the Group and $584,320 (2011: $584,320) in respect of the Company.
The amounts provided for impairment in this note relates to:
a) certain mining claims that have been relinquished in the period following the review of the portfolio by management.
b) mining claims that the Group still holds but has decided to stop any further exploration on these claims at the present time.
Notes to the financial statements

2012 group annual report and its FinanCial stateMents 39
Notes to the financial statements
12 Property, plant and equipment Plant and Fixtures Computer Motor Buildings Total machinery fittings and assets vehicles and aircraft equipment Group $ $ $ $ $ $
Cost at 31 March 2011 1,805,837 102,088 169,111 669,114 1,487,591 4,233,741
Additions during the year 386,950 35,417 6,266 47,189 2,089 477,911
Disposals during the year - - (850) (24,621) - (25,471)
Cost at 31 March 2012 2,192,787 137,505 174,527 691,682 1,489,680 4,686,181
Depreciation at 31 March 2011 609,128 77,235 127,792 444,272 - 1,258,427
Charge for the year 167,304 17,790 25,644 96,604 35,625 342,967
Disposals during the year - - (353) (14,797) - (15,150)
Depreciation at 31 March 2012 776,432 95,025 153,083 526,079 35,625 1,586,244
Net book amount at 31 March 2012 1,416,355 42,480 21,444 165,603 1,454,055 3,099,937
Cost at 31 March 2010 1,061,351 98,544 159,983 664,220 44,536 2,028,634
Additions during the period 749,655 3,544 9,128 8,000 1,443,055 2,213,382
Disposals during the period (5,169) - - (3,106) - (8,275)
Cost at 31 March 2011 1,805,837 102,088 169,111 669,114 1,487,591 4,233,741
Depreciation at 31 March 2010 438,081 59,673 90,743 325,192 - 913,689
Charge for the period 176,108 17,562 37,049 122,186 - 352,905
Disposals during the period (5,061) - - (3,106) - (8,167)
Depreciation at 31 March 2011 609,128 77,235 127,792 444,272 - 1,258,427
Net book amount at 31 March 2011 1,196,709 24,853 41,319 224,842 1,487,591 2,975,314
Net book amount at 31 March 2010 623,270 38,871 69,240 339,028 44,536 1,114,945
The depreciation on assets utilised directly for exploration activities is capitalised as deferred exploration costs amounting to $254,820 (2011: $275,010). Depreciation in respect of all other assets is charged to administrative expenses in the statement of comprehensive income amounting to $88,147 (2011: $77,896).
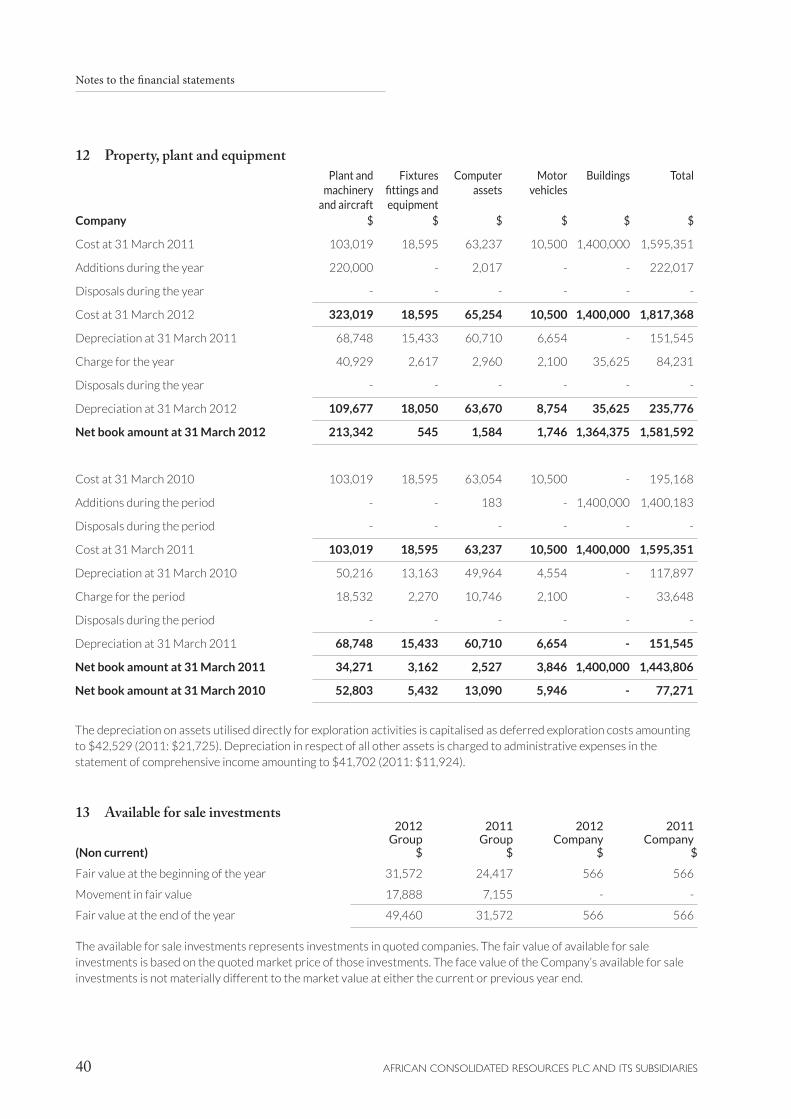
AFRICAN CONSOLIDATED RESOURCES PLC AND ITS SUBSIDIARIES40
12 Property, plant and equipment Plant and Fixtures Computer Motor Buildings Total machinery fittings and assets vehicles and aircraft equipment Company $ $ $ $ $ $
Cost at 31 March 2011 103,019 18,595 63,237 10,500 1,400,000 1,595,351
Additions during the year 220,000 - 2,017 - - 222,017
Disposals during the year - - - - - -
Cost at 31 March 2012 323,019 18,595 65,254 10,500 1,400,000 1,817,368
Depreciation at 31 March 2011 68,748 15,433 60,710 6,654 - 151,545
Charge for the year 40,929 2,617 2,960 2,100 35,625 84,231
Disposals during the year - - - - - -
Depreciation at 31 March 2012 109,677 18,050 63,670 8,754 35,625 235,776
Net book amount at 31 March 2012 213,342 545 1,584 1,746 1,364,375 1,581,592
Cost at 31 March 2010 103,019 18,595 63,054 10,500 - 195,168
Additions during the period - - 183 - 1,400,000 1,400,183
Disposals during the period - - - - - -
Cost at 31 March 2011 103,019 18,595 63,237 10,500 1,400,000 1,595,351
Depreciation at 31 March 2010 50,216 13,163 49,964 4,554 - 117,897
Charge for the period 18,532 2,270 10,746 2,100 - 33,648
Disposals during the period - - - - - -
Depreciation at 31 March 2011 68,748 15,433 60,710 6,654 - 151,545
Net book amount at 31 March 2011 34,271 3,162 2,527 3,846 1,400,000 1,443,806
Net book amount at 31 March 2010 52,803 5,432 13,090 5,946 - 77,271
The depreciation on assets utilised directly for exploration activities is capitalised as deferred exploration costs amounting to $42,529 (2011: $21,725). Depreciation in respect of all other assets is charged to administrative expenses in the statement of comprehensive income amounting to $41,702 (2011: $11,924).
13 Available for sale investments 2012 2011 2012 2011 Group Group Company Company (Non current) $ $ $ $
Fair value at the beginning of the year 31,572 24,417 566 566
Movement in fair value 17,888 7,155 - -
Fair value at the end of the year 49,460 31,572 566 566
The available for sale investments represents investments in quoted companies. The fair value of available for sale investments is based on the quoted market price of those investments. The face value of the Company’s available for sale investments is not materially different to the market value at either the current or previous year end.
Notes to the financial statements

2012 group annual report and its FinanCial stateMents 41
Notes to the financial statements
14 Investment in subsidiaries 2012 2011 Company Company $ $
Cost at the beginning of the year 219,104 1,316
Additions during the year - 217,788
Cost at the end of the year 219,104 219,104
The principal subsidiaries of African Consolidated Resources plc, all of which are included in these consolidated Annual Financial Statements are as follows:
Proportion Proportion Nature Country of held by held by of Company registration Class Group 2012 Group 2011 business
African Consolidated Resources PTC Ltd * BVI -% -% Nominee company
Millwall International Investments Limited BVI Ordinary 100% 100% Mining exploration and development
Mimic Mining UK Limited United Kingdom Ordinary 100% 100% Holding company
African Consolidated Resources (Zambia) Limited Zambia Ordinary 100% 100% Mining exploration and development
ACR Mauritius Limited Mauritius Ordinary 100% 100% Holding company
Moorestown Limited BVI Ordinary 100% 100% Mining exploration and development
Canape Investments (Private) Limited Zimbabwe Ordinary 100% 100% Mining exploration and development
* Previously ‘Touzel Holdings Limited’. The Company has effective control of this entity.
The voting rights are equal to the proportion of the shares held.
15 Loans to Group Companies 2012 2011 2012 2011 Group Group Company Company $ $ $ $
Loans to Group Companies - - 33,401,577 25,898,735
Loans to Group companies are repayable on demand, subject to relevant exchange control approvals being obtained. The treatment of this balance as non-current reflects the Company’s expectation of the timing of receipt.
16 Inventory
Material and supplies 9,493 60,161 - -
There is no material difference between the replacement cost of stocks and the amount stated above. The amount of inventory recognised as an expense during the year was $71,442 (2011 - $71,930).
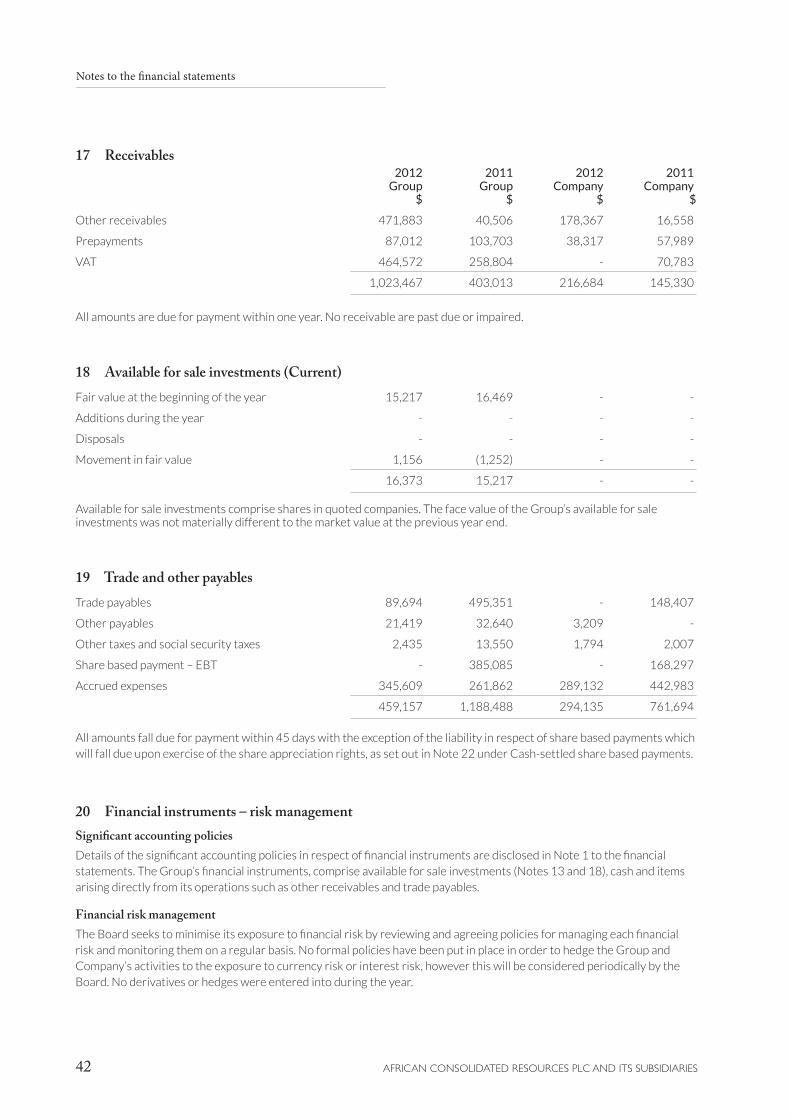
AFRICAN CONSOLIDATED RESOURCES PLC AND ITS SUBSIDIARIES42
17 Receivables 2012 2011 2012 2011 Group Group Company Company $ $ $ $
Other receivables 471,883 40,506 178,367 16,558
Prepayments 87,012 103,703 38,317 57,989
VAT 464,572 258,804 - 70,783
1,023,467 403,013 216,684 145,330
All amounts are due for payment within one year. No receivable are past due or impaired.
18 Available for sale investments (Current)Fair value at the beginning of the year 15,217 16,469 - -
Additions during the year - - - -
Disposals - - - -
Movement in fair value 1,156 (1,252) - -
16,373 15,217 - -
Available for sale investments comprise shares in quoted companies. The face value of the Group’s available for sale investments was not materially different to the market value at the previous year end.
19 Trade and other payablesTrade payables 89,694 495,351 - 148,407
Other payables 21,419 32,640 3,209 -
Other taxes and social security taxes 2,435 13,550 1,794 2,007
Share based payment – EBT - 385,085 - 168,297
Accrued expenses 345,609 261,862 289,132 442,983
459,157 1,188,488 294,135 761,694
All amounts fall due for payment within 45 days with the exception of the liability in respect of share based payments which will fall due upon exercise of the share appreciation rights, as set out in Note 22 under Cash-settled share based payments.
20 Financial instruments – risk managementSignificant accounting policiesDetails of the significant accounting policies in respect of financial instruments are disclosed in Note 1 to the financial statements. The Group’s financial instruments, comprise available for sale investments (Notes 13 and 18), cash and items arising directly from its operations such as other receivables and trade payables.
Financial risk managementThe Board seeks to minimise its exposure to financial risk by reviewing and agreeing policies for managing each financial risk and monitoring them on a regular basis. No formal policies have been put in place in order to hedge the Group and Company’s activities to the exposure to currency risk or interest risk, however this will be considered periodically by the Board. No derivatives or hedges were entered into during the year.
Notes to the financial statements
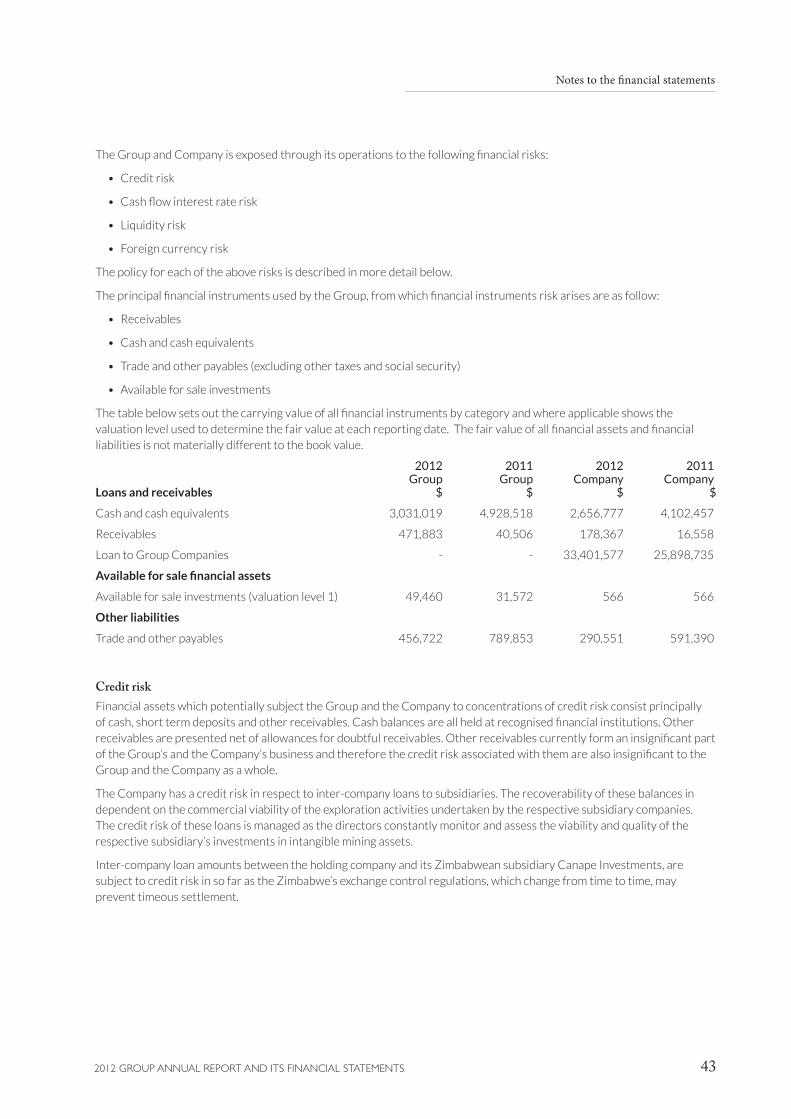
2012 group annual report and its FinanCial stateMents 43
Notes to the financial statements
The Group and Company is exposed through its operations to the following financial risks:
• Credit risk
• Cash flow interest rate risk
• Liquidity risk
• Foreign currency risk
The policy for each of the above risks is described in more detail below.
The principal financial instruments used by the Group, from which financial instruments risk arises are as follow:
• Receivables
• Cash and cash equivalents
• Trade and other payables (excluding other taxes and social security)
• Available for sale investments
The table below sets out the carrying value of all financial instruments by category and where applicable shows the valuation level used to determine the fair value at each reporting date. The fair value of all financial assets and financial liabilities is not materially different to the book value.
2012 2011 2012 2011 Group Group Company Company Loans and receivables $ $ $ $
Cash and cash equivalents 3,031,019 4,928,518 2,656,777 4,102,457
Receivables 471,883 40,506 178,367 16,558
Loan to Group Companies - - 33,401,577 25,898,735
Available for sale financial assets
Available for sale investments (valuation level 1) 49,460 31,572 566 566
Other liabilities
Trade and other payables 456,722 789,853 290,551 591,390
Credit riskFinancial assets which potentially subject the Group and the Company to concentrations of credit risk consist principally of cash, short term deposits and other receivables. Cash balances are all held at recognised financial institutions. Other receivables are presented net of allowances for doubtful receivables. Other receivables currently form an insignificant part of the Group’s and the Company’s business and therefore the credit risk associated with them are also insignificant to the Group and the Company as a whole.
The Company has a credit risk in respect to inter-company loans to subsidiaries. The recoverability of these balances in dependent on the commercial viability of the exploration activities undertaken by the respective subsidiary companies. The credit risk of these loans is managed as the directors constantly monitor and assess the viability and quality of the respective subsidiary’s investments in intangible mining assets.
Inter-company loan amounts between the holding company and its Zimbabwean subsidiary Canape Investments, are subject to credit risk in so far as the Zimbabwe’s exchange control regulations, which change from time to time, may prevent timeous settlement.

AFRICAN CONSOLIDATED RESOURCES PLC AND ITS SUBSIDIARIES44
Maximum exposure to credit riskThe Group’s maximum exposure to credit risk by category of financial instrument is shown in the table below:
2012 2012 2011 2011 Carrying Maximum Carrying Maximum value exposure value exposure Loans and receivables $ $ $ $
Cash and cash equivalents 3,031,019 3,031,019 4,928,518 4,928,518
Receivables 471,883 471,883 40,506 40,506
The Company’s maximum exposure to credit risk by class of financial instrument is shown in the table below :
Loans and receivables
Cash and cash equivalents 2,656,777 2,656,777 4,102,457 4,102,457
Receivables 178,367 178,367 16,558 16,558
Loan to Group Companies 33,401,577 33,401,577 25,898,735 25,898,735
Cash flow interest rate riskThe Group has adopted a non speculative policy on managing interest rate risk. Only approved financial institutions with sound capital bases are used to borrow funds and to invest surplus funds in. The Group and the Company had no borrowing facilities at either the current year end or previous period end.
The Group and the Company seeks to obtain a favourable interest rate on its cash balances through the use of bank deposits. At the year end the Group had a cash balance of $3,031,019 (2011: $4,928,518) which was made up as follows:
2012 2011 Group Group $ $
British pounds 739,964 1,443,739
United States dollars 2,291,055 3,484,779
3,031,019 4,928,518
Included within the above are amounts of US$1,443,337 (2011: £811,158 ($1,285,157) and US$1,751,614) held within fixed and floating rate deposit accounts. Interest rates range between 1% to 2% based on bank interest rates.
The Group received interest for the year on bank deposits of $27,616 (2011: $35,328).
The effect of a 10% reduction in interest rates during the year would, all other variables held constant have resulted in reduced interest income of $2,762 (2011: $3,533). Conversely the effect of a 10% increase in interest rates during the year would, on the same basis, have increased interest income by $2,762 (2011: $3,533).
At the year end, the Company had a cash balance of $2,656,777 (2011: $4,102,457) which was made up as follows:
2012 2011 Company Company $ $
Pounds Sterling 739,964 1,443,739
United States dollars 1,916,813 2,658,718
2,656,777 4,102,457
The Group and the Company has no interest bearing debts at either the current year end or previous period end.
Notes to the financial statements

2012 group annual report and its FinanCial stateMents 45
Notes to the financial statements
Liquidity riskAny borrowing facilities are negotiated with approved financial institutions at acceptable interest rates. All assets and liabilities are at fixed and floating interest rate. The Group and the Company seeks to manage its financial risk to ensure that sufficient liquidity is available to meet the foreseeable needs both in the short and long term.
As set out in Note 19 the consolidated trade and other payables balance of $459,609 (2011: $1,118,488) is all due for payment within 45 days of the reporting date, except for $Nil (2011: $385,085) in respect of the share based payment liability. The Company has sufficient cash resources to settle these outstanding liabilities as they fall due.
Foreign currency riskForeign exchange risk is inherent in the Group’s and the Company’s activities and is accepted as such. The majority of the Group’s expenses are denominated in United States Dollars and therefore foreign currency exchange risk arises where any balance are held or costs incurred, in currencies other than the United States Dollars. This foreign exchange risk differs from the risk reported in prior years where the functional and presentational currency of the Group was UK Pounds Sterling.
At 31 March 2012 and 31 March 2011, the currency exposure of the Group was as follows:
UK Sterling US Dollars Other Currencies Total
At 31 March 2012 $ $ $ $
Cash and cash equivalents 739,964 2,291,055 - 3,031,019
Other receivables 46,871 976,596 - 1,023,467
Trade and other payables (167,880) ( 291,277) - (459,157)
Available for sale investments - 65,833 - 65,833
At 31 March 2011
Cash and cash equivalents 1,443,739 3,484,779 - 4,928,518
Other receivables 95,123 307,890 - 403,013
Trade and other payables (140,107) (649,746) - (789,853)
Available for sale investments - 46,789 - 46,789
The effect of a 10% strengthening of Sterling against the US dollar at the balance sheet date, all other variables held constant, would have resulted in increasing post tax losses by $144,374 (2011: $426,373). Conversely the effect of a 10% weakening of Sterling against the US dollar at the balance sheet date, all other variables held constant, would have resulted in decreasing post tax losses by $144,374 (2011: $426,373).
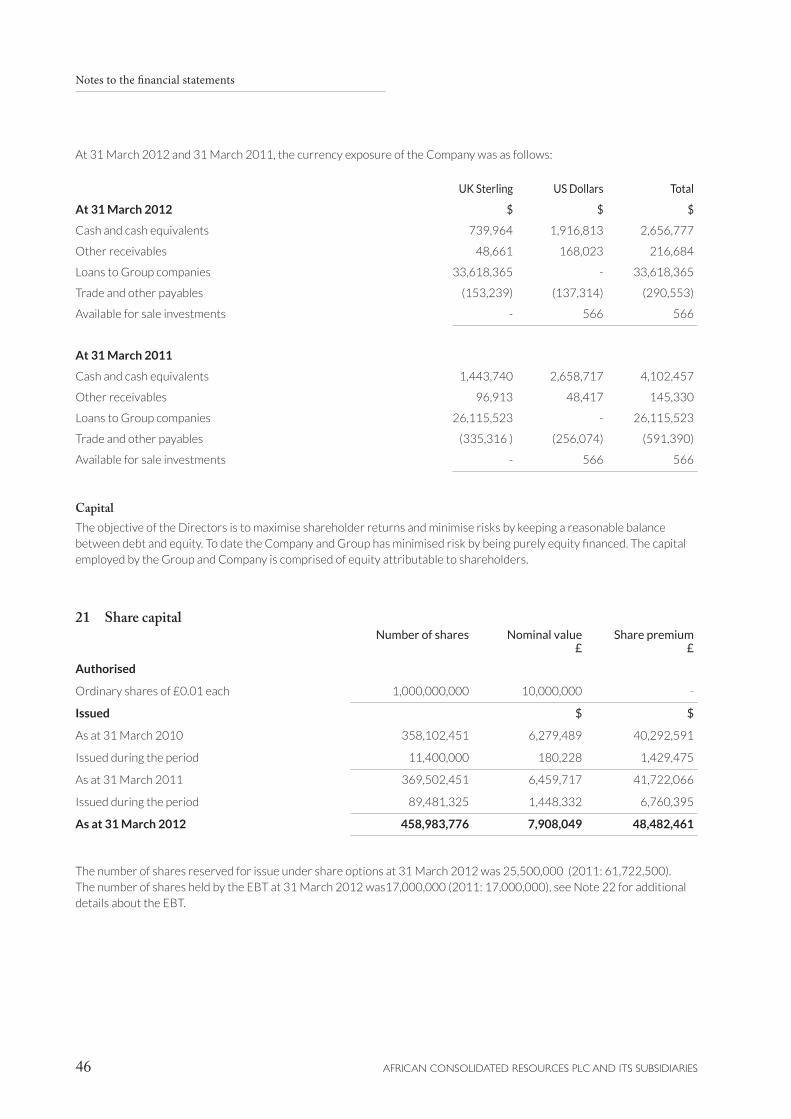
AFRICAN CONSOLIDATED RESOURCES PLC AND ITS SUBSIDIARIES46
At 31 March 2012 and 31 March 2011, the currency exposure of the Company was as follows:
UK Sterling US Dollars Total
At 31 March 2012 $ $ $
Cash and cash equivalents 739,964 1,916,813 2,656,777
Other receivables 48,661 168,023 216,684
Loans to Group companies 33,618,365 - 33,618,365
Trade and other payables (153,239) (137,314) (290,553)
Available for sale investments - 566 566
At 31 March 2011
Cash and cash equivalents 1,443,740 2,658,717 4,102,457
Other receivables 96,913 48,417 145,330
Loans to Group companies 26,115,523 - 26,115,523
Trade and other payables (335,316 ) (256,074) (591,390)
Available for sale investments - 566 566
Capital The objective of the Directors is to maximise shareholder returns and minimise risks by keeping a reasonable balance between debt and equity. To date the Company and Group has minimised risk by being purely equity financed. The capital employed by the Group and Company is comprised of equity attributable to shareholders.
21 Share capital Number of shares Nominal value Share premium £ £
Authorised
Ordinary shares of £0.01 each 1,000,000,000 10,000,000 -
issued $ $
As at 31 March 2010 358,102,451 6,279,489 40,292,591
Issued during the period 11,400,000 180,228 1,429,475
As at 31 March 2011 369,502,451 6,459,717 41,722,066
Issued during the period 89,481,325 1,448,332 6,760,395
As at 31 March 2012 458,983,776 7,908,049 48,482,461
The number of shares reserved for issue under share options at 31 March 2012 was 25,500,000 (2011: 61,722,500). The number of shares held by the EBT at 31 March 2012 was17,000,000 (2011: 17,000,000), see Note 22 for additional details about the EBT.
Notes to the financial statements

2012 group annual report and its FinanCial stateMents 47
Notes to the financial statements
22 Share based paymentsEquity-settled share based paymentsThe Company operates an unapproved share option plan for directors, senior management and staff consultants. The tables below reconcile the opening and closing number of share options in issue at each reporting date:
Share options
Exercise Outstanding at Exercised Lapsed Granted Outstanding at Final price 31 March during last during last during last 31 March exercise 2011 12 months 12 months 12 months 2012 date
4.5p 2,500,000 (2,500,000) - - - June 2011
4.5p 5,250,000 (5,250,000) - - - June 2011
7.0p 37,500 - (37,500) - - June 2011
10.0p 25,500,000 - - - 25,500,000 March 2014
12.0p 5,500,000 - (5,500,000) - - June 2011
14.5p 1,945,000 - (1,945,000) - - June 2011
15.0p 5,500,002 - (5,500,002) - - June 2011
18.0p 5,499,998 - (5,499,998) - - June 2011
14.5p 2,040,000 - (2,040,000) - - June 2011
18.0p 8,000,000 - (8,000,000) - - June 2011
61,772,500 (7,750,000) (28,522,500) - 25,500,000
31 March 2010 12 months 12 months 12 months 31 March 2011
4.5p 2,500,000 - - - 2,500,000 June 2011
4.5p 1,111,111 - (1,111,111) - - June 2010
4.5p 5,250,000 - - - 5,250,000 June 2011
7.0p 37,500 - - - 37,500 June 2011
10.0p - - - 25,500,000 25,500,000 March 2014
12.0p 5,500,000 - - - 5,500,000 June 2011
12.0p 1,965,000 - (1,965,000) - - Dec 2010
14.5p 1,945,000 - - - 1,945,000 June 2011
15.0p 5,500,002 - - - 5,500,002 June 2011
18.0p 5,499,998 - - - 5,499,998 June 2011
14.5p 2,040,000 - - - 2,040,000 June 2011
18.0p 8,000,000 - - - 8,000,000 June 2011
12.0p 500,000 - (500,000) - - June 2013
39,848,611 - (3,576,111) 25,500,000 61,772,500

AFRICAN CONSOLIDATED RESOURCES PLC AND ITS SUBSIDIARIES48
2012 weighted 2012 number 2011 weighted 2011 number average exercise average exercise price (pence) price (pence)
Outstanding at the beginning of the year 12.0 61,772,500 12.9 39,848,611
Granted during the year - - 10.0 25,500,000
Lapsed during the year 15.8 (28,522,500) 9.7 (3,576,111)
Exercised during the year 4.5 (7,750,000) - -
Outstanding at the end of the year 10.0 25,500,000 12.0 61,772,500
Exercisable at the end of the year - - 13.4 36,272,500
The weighted average remaining lives of the options outstanding at the end of the period is 25 months (2011: 17.04 months). Of the 25,500,000 (2011: 61,772,500) options outstanding at 31 March 2012, 25,500,500 (2011: 25,500,000) are not yet exercisable at 31 March 2012.
Fair value of share options The fair values of awards granted under the Employee Share Option Plan have been calculated using the Black Scholes pricing model that takes into account factors specific to share incentive plans such as the vesting periods of the Plan, the expected dividend yield of ACR’s shares and the estimated volatility of those shares. Based on the above assumptions, the fair values of the options granted are estimated to be:
10p options
Grant date March 2011
Vesting periods March 2014
Share price at date of grant 9.0p
Volatility 51%
Option life 3 years
Dividend yield Nil
Risk free investment rate 0.65%
Fair value 0.03c
Volatility has been based on the volatility of comparable listed companies in the mining, oil and gas sector and on historical share price information.
Based on the above fair values and ACR’s expectations of employee turnover, the expense arising from equity-settled share options and share awards made to employees was $87,350 (2011: $20,891).
Cash-settled share based paymentsThe Directors of the Company have set up an Employee Benefit Trust (EBT) in which a number of employees and Directors are participants. The EBT holds shares on behalf of each participant until such time as the participant exercises their right to require the EBT to sell the shares. On the sale of the shares the participant receives the appreciation of the value in the shares above the market price on the date that the shares were purchased by the EBT, subject to the first 5% in growth in the share price, on an annual compound basis, being retained by the EBT. The participant pays 0.01p per share to acquire their rights. The table below sets out the subscription price and the rights exercisable in respect of the EBT.
Notes to the financial statements
2012 group annual report and its FinanCial stateMents 49
Notes to the financial statements
The Company funded (directly and indirectly through another subsidiary) an amount of $Nil (2011 - $2,468,420) to the EBT in order to enable the purchase of shares in the Company. At the year end, the Company had an outstanding loan to African Consolidated Resources (PTC) Limited (under the effective control of African Consolidated Resources plc and trustee of the EBT) of $3,943,805 (2011: $2,250,642) and Millwall International Investments Limited had an outstanding loan to the same entity for $217,778 (2011: $217,778). As set out in the EBT accounting policy note, the EBT has been included as part of the Company financial statements and consolidated as part of the Group financial statements.
EBT
Exercise Outstanding at Exercised Lapsed Granted Outstanding at Date price 31 March during last during last during last 31 March exercisable 2011 12 months 12 months 12 months 2012 from
8.75p 6,000,000 - - - 6,000,000 July 2010
8.75p 6,000,000 - - - 6,000,000 July 2011
9.00p 2,500,000 - - - 2,500,000 August 2011
9.00p 2,500,000 - - - 2,500,000 August 2012
17,000,000 - - - 17,000,000
As at 31 March 2012 14,500,000 of the EBT participation rights were exercisable.
Exercise Outstanding at Exercised Lapsed Granted Outstanding at Date price 31 March during last during last during last 31 March exercisable 2010 12 months 12 months 12 months 2011 from
8.75p 6,000,000 - - - 6,000,000 July 2010
8.75p 6,000,000 - - - 6,000,000 July 2011
9.00p - - - 2,500,000 2,500,000 August 2011
9.00p - - - 2,500,000 2,500,000 August 2012
12,000,000 - - 5,000,000 17,000,000
As at 31 March 2011 6,000,000 of the EBT participation rights were exercisable.
Fair value of EBT participant rights The fair values of the rights granted to participants under the EBT have been calculated using a Monte Carlo valuation model. Based on the assumptions set out in the table below, as well as the limitation on the growth in share price attributable to the participants (as set out in the table above) the fair-values are estimated to be:
July 2010 rights July 2011 rights August 2011 August 2012
Grant date August 2009 August 2009 October 2010 October 2010
Vesting periods August 2009 August 2009 October 2010 October 2010 - July 2010 - July 2011 - August 2011 - August 2012
Share price at date of grant 8.75p 8.75p 9.00p 9.00p
Volatility 51% 51% 51% 51%
Option life 1 year 2 years 1 year 2 years
Dividend yield Nil Nil Nil Nil
Risk free investment rate 0.65% 0.65% 0.65% 0.65%
Fair value Nil Nil Nil Nil
Volatility has been based on historical share price information.

AFRICAN CONSOLIDATED RESOURCES PLC AND ITS SUBSIDIARIES50
Share options write back/(expenses) 2012 2011 Group Group $ $
Share option expense (87,350) (20,891)
EBT expense - (211,294)
Write back of share option expense 111,380 -
Write back of EBT expense 385,083 -
409,113 (232,185)
23 ReservesDetails of the nature and purpose of each reserve within owners’ equity are provided below:
The share premium account holds the balance of consideration received net of fund raising costs in excess of the par value of the shares.
The share options reserve represents the accumulated balance of share benefit charges recognised in respect of share options granted by the Company, less transfers to retained losses in respect of options exercised or lapsed.
The foreign currency translation reserve comprises amounts arising on the translation of the Group and Company financial statements from Pound Sterling to United States Dollars, as set out in Note 1, prior to the change in functional currency to United States Dollars.
The available for sale reserve holds the gains/(losses) arising on recognising financial assets classified as available for sale at fair value.
The EBT reserve has been recognised in respect of the shares purchased in the Company by the EBT; the reserve serves to offset against the increased in share capital and share premium arising from the Company effectively purchasing its own shares.
The retained earnings reserve represents the cumulative net gains and losses recognised in the Group statement of comprehensive income.
24 Related party transactionsGroupThere were no related party transactions during the year in the Group other than directors and key management emoluments which are disclosed in Note 8 and the following :
The Company acquired the entire share capital of Aeromag.com Limited, a private company whose principal assets are a Jabiru J430 aircraft and high tech equipment for radiometrics and aeromagnetics. The substance of this transaction was the acquisition of the aircraft and equipment. These assets will enable the Company to conduct extensive aeromagnetic programmes across its large-scale exploration licences in both Zimbabwe and Zambia at a very low cost per line kilometre. The Company has previously had the benefit of the use of the Aeromag Facility when required, on an arm’s length contractual basis, since March 2010. The consideration for the purchase was £93,500 satisfied by the issue of 1,700,000 ordinary shares of 1p each in the Company plus $61,500 cash, which fairly represents the value of the assets acquired.Michael Kellow, a director of the Company (and ACR’s Technical Director), had an interest in Aeromag.com Limited and received 836,585 ordinary shares in the Company as the consideration due to him.
CompanyThe Company emoluments to directors and key management are disclosed in Note 8 to the financial statements.
Notes to the financial statements

2012 group annual report and its FinanCial stateMents 51
Notes to the financial statements
25 Contingent liabilities and capital commitmentsZimbabwe IndigenisationOn 25 March 2011 the Government of Zimbabwe issued regulations relating to the Mining Sector pursuant to the Indigenisation and Empowerment Act 2007. These regulations require all of Zimbabwean registered mining companies, having a net asset value of $1 or more, to transfer not less than 51% of their issued shares to designated entities by September 2011. These regulations are relevant to Canape Investments (Private) Limited and its subsidiaries which are Group companies registered and operating in Zimbabwe. However, as these subsidiaries were and are all still in exploration phase financed by loans from the holding or other group companies, neither Canape Investments (Private) Limited nor its subsidiaries had or has a net asset value of or above one United States dollar. As such the Directors believe that there is currently no compulsion to effect any transfer of shareholding in the Zimbabwean subsidiaries to any third party. Counsel’s opinion supports this view.
In a response to the Zimbabwean Ministry of Youth Development, Indigenisation and Empowerment, the Company has stated this fact and added that it will take such steps as it can to comply with any indigenisation law in force from time to time. Responses received from the authorities would indicate that this position has been accepted.
The full effect that this legislation might have on the operations of the Group is yet to be quantified and is subject to considerable uncertainty.
26 LitigationIncluded in intangible assets for the Group is an amount of $1,411,300 (2011: $1,411,300) representing costs of title acquisition and of exploration over a diamond deposit near Marange, Zimbabwe. In or about September 2006 and subsequently, the Zimbabwe Minister of Mines challenged the Group’s legal title with respect to Marange. The Group initiated proceedings in the Zimbabwe High Court in order to confirm its title which resulted in a judgement in the Group’s favour on 24 September 2009. The Court ordered that the Group’s title to the Marange claims was valid and had been since the claims were pegged; and that all diamonds mined from the claims should be returned to the Group. The Ministry of Mines subsequently lodged an appeal to the Supreme Court against the High Court judgement (the “Substantive Appeal”).
It is understood that the diamonds seized from the Group’s offices in January 2007 have been deposited at the Reserve Bank of Zimbabwe, in terms of an interim Order made by the Supreme Court. The Group has also filed a further application to the High Court to bring all diamonds mined at Marange (not just those mined up to the date of the High Court Order) within the ambit of the Supreme Court Order.
Subsequent to the High Court Order and apart from the Substantive Appeal, the Ministry of Mines has commenced other proceedings with a view either to undermine or to terminate the Group’s title to the Marange claim (the Other Proceedings) all of which are being vigorously resisted.
On 16 February 2010 The High Court Issued a further judgement (the Rescission Judgement) rescinding the order previously handed down in 2009. Legal opinion is to the effect that the Rescission Judgment is fatally flawed. The Group has lodged an appeal against this judgement, which has yet to be heard.
The Ministry of Mines has subsequently withdrawn its Substantive Appeal against the original judgement of September 2009 in the Group’s favour, which upheld the Group’s entitlement to the Marange claims.
The opinion of Legal Counsel is that neither the actions by the Ministry of Mines in the Other Proceedings nor the case made against the Group resulting in the Rescission Judgement have any merit; accordingly no provision against loss of this asset has been made.
There is no other litigation involving any group company.
AFRICAN CONSOLIDATED RESOURCES PLC AND ITS SUBSIDIARIES52
27 Events after the reporting dateOn 30 March 2012 the Company announced the issue and allotment of 18,911,348 new ordinary shares of 1p each in the Company (‘Shares’) as follows:
• In respect of services by directors and an executive, 2,411,348 shares in settlement of a cash liability for services amounting to $119,354.
• In respect of a bonus to Michael Kellow as announced on 30 September 2011, 1,000,000 Shares at 3.53p, the closing price on 27 September 2011, amounting to $56,001.
• In pursuance of a subscription by the African Consolidated Resources Employee Benefit Trust as announced on 30 September 2011, 15,500,000 Shares at a price of 6p per Share.
These shares were admitted to trading on 5 April 2012.
On 5 June 2012 the Company entered into a tribute agreement with an indigenous Zimbabwean company in respect of the Pickstone sulphide dump, the overall commercial effect of which is to give the Company consideration of $4 million for the grant of the tribute, payable out of gold sales, and where the Company retains a 75% beneficial interest in profits arising from the processing of the dump, after payment of the $4 million.
On 25 July 2012 Galileo Resources plc entered into a heads of agreement with the Company’s joint venture partner, Rare Earth International (REI), in relation to Nkombwa Hill rare earth project under which REI secured finance for their exploration expenditure obligations under REI’s joint venture with the Company.
On 30 August 2012 the Company announced the issue and allotment of 108,021,500 new ordinary shares of 1p each in the Company, at an issue price of 2p per share. These shares were admitted to trading on 3 September 2012. The funds raised amounted to $3,391,875 less costs of $145,467.
Notes to the financial statements
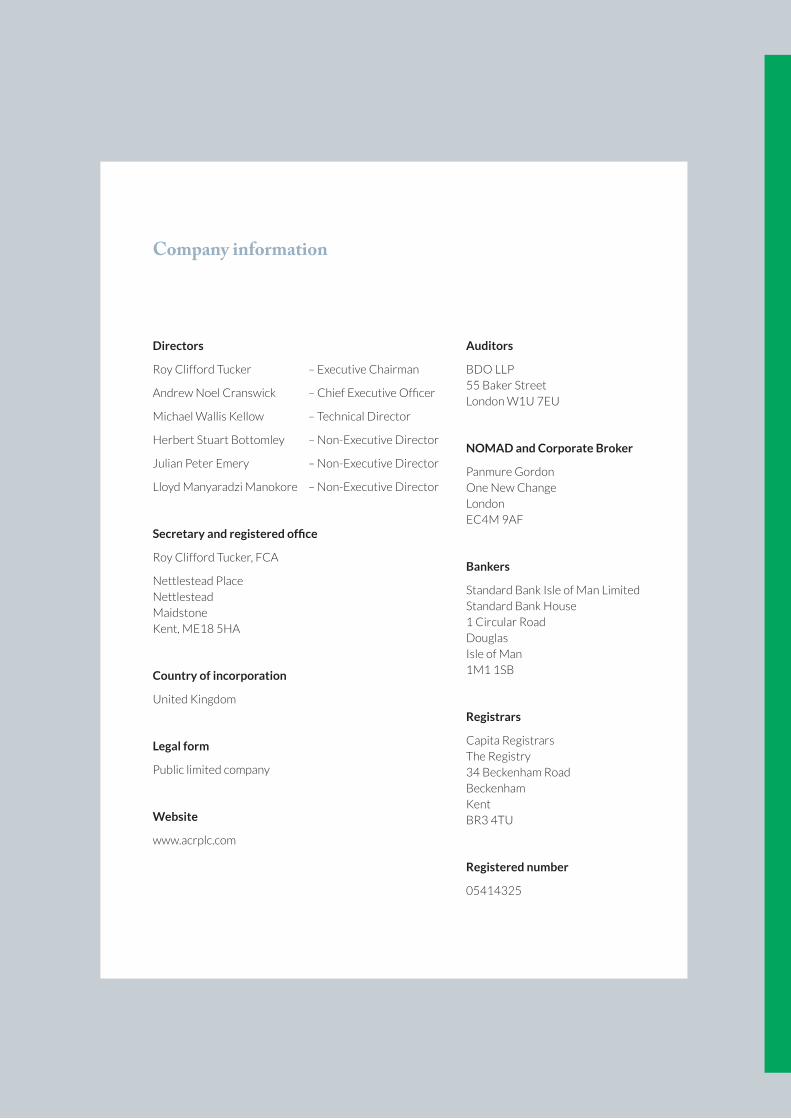
Directors
Roy Clifford Tucker – Executive Chairman
Andrew Noel Cranswick – Chief Executive Officer
Michael Wallis Kellow – Technical Director
Herbert Stuart Bottomley – Non-Executive Director
Julian Peter Emery – Non-Executive Director
Lloyd Manyaradzi Manokore – Non-Executive Director
Secretary and registered office
Roy Clifford Tucker, FCA
Nettlestead Place Nettlestead Maidstone Kent, ME18 5HA
Country of incorporation
United Kingdom
Legal form
Public limited company
Website
www.acrplc.com
Auditors
BDO LLP 55 Baker Street London W1U 7EU
NOMAD and Corporate Broker
Panmure Gordon One New Change London EC4M 9AF
Bankers
Standard Bank Isle of Man Limited Standard Bank House 1 Circular Road Douglas Isle of Man 1M1 1SB
Registrars
Capita Registrars The Registry 34 Beckenham Road Beckenham Kent BR3 4TU
Registered number
05414325
Company information

www.acrplc.com