Organoclay dispersion in linear low-density polyethylene ...
131
Scholars' Mine Scholars' Mine Doctoral Dissertations Student Theses and Dissertations Spring 2012 Organoclay dispersion in linear low-density polyethylene and Organoclay dispersion in linear low-density polyethylene and maleated linear low-density polyethylene via supercritical carbon maleated linear low-density polyethylene via supercritical carbon dioxide processing dioxide processing Matthew J. Factor Follow this and additional works at: https://scholarsmine.mst.edu/doctoral_dissertations Part of the Chemical Engineering Commons Department: Chemical and Biochemical Engineering Department: Chemical and Biochemical Engineering Recommended Citation Recommended Citation Factor, Matthew J., "Organoclay dispersion in linear low-density polyethylene and maleated linear low- density polyethylene via supercritical carbon dioxide processing" (2012). Doctoral Dissertations. 1961. https://scholarsmine.mst.edu/doctoral_dissertations/1961 This thesis is brought to you by Scholars' Mine, a service of the Missouri S&T Library and Learning Resources. This work is protected by U. S. Copyright Law. Unauthorized use including reproduction for redistribution requires the permission of the copyright holder. For more information, please contact [email protected].
Transcript of Organoclay dispersion in linear low-density polyethylene ...

Scholars' Mine Scholars' Mine
Doctoral Dissertations Student Theses and Dissertations
Spring 2012
Organoclay dispersion in linear low-density polyethylene and Organoclay dispersion in linear low-density polyethylene and
maleated linear low-density polyethylene via supercritical carbon maleated linear low-density polyethylene via supercritical carbon
dioxide processing dioxide processing
Matthew J. Factor
Follow this and additional works at: https://scholarsmine.mst.edu/doctoral_dissertations
Part of the Chemical Engineering Commons
Department: Chemical and Biochemical Engineering Department: Chemical and Biochemical Engineering
Recommended Citation Recommended Citation Factor, Matthew J., "Organoclay dispersion in linear low-density polyethylene and maleated linear low-density polyethylene via supercritical carbon dioxide processing" (2012). Doctoral Dissertations. 1961. https://scholarsmine.mst.edu/doctoral_dissertations/1961
This thesis is brought to you by Scholars' Mine, a service of the Missouri S&T Library and Learning Resources. This work is protected by U. S. Copyright Law. Unauthorized use including reproduction for redistribution requires the permission of the copyright holder. For more information, please contact [email protected].


ORGANOCLAY DISPERSION IN LINEAR LOW-DENSITY POLYETHYLENE AND
MALEATED LINEAR LOW-DENSITY POLYETHYLENE VIA
SUPERCRITICAL CARBON DIOXIDE PROCESSING
by
MATTHEW JOHN FACTOR
A DISSERTATION
Presented to the Faculty of the Graduate School of the
MISSOURI UNIVERSITY OF SCIENCE AND TECHNOLOGY
In Partial Fulfillment of the Requirements for the Degree
DOCTOR OF PHILOSOPHY
in
CHEMICAL ENGINEERING
2012
Approved by
Sunggyu Lee, Advisor
Douglas Ludlow, Co-Advisor Yangchuan Xing
David Westenberg Fatih Dogan

© 2012
Matthew John Factor
All Rights Reserved

iii
ABSTRACT
Research into polymer-clay nanocomposites (PCN’s) has been ongoing for
decades as a result of the property enhancements offered by clay. To fully exploit these
property enhancements, organically modified clays (organoclays) are utilized to promote
clay delamination by reducing the disparity between the hydrophilicity of the clay and the
hydrophobicity of the highly used polyolefin polymer. Since the organic modification of
organoclays can degrade at temperatures typical to many polymers during melt-mix
processing, this work utilizes the low-temperature processing fluid supercritical carbon
dioxide (scCO2) to disperse an organoclay into the highly used polymer LLDPE and
ascertains the associated processing conditions for achieving this goal.
Investigations into the LLDPE resin size, scCO2 processing time, scCO2
capability and the processing component compatibility were undertaken to better
understand the important parameters to achieving organoclay dispersion, in terms of
infusion and intercalation/exfoliation behavior. A LLDPE pellet resin showed improved
dispersion and obtainable information over that of a granule resin, securing the choice of
resin for subsequent experiments. Experiments undertaken with pellet resin exhibited
that a 1-hr processing time was insufficient for organoclay infusion into LLDPE,
however when infusion occurs, intercalation/exfoliation can be affected by scCO2.
Increasing the compatibility of LLDPE with clay and the processing fluid revealed that
the increased compatibility had altered the effect of scCO2. Further analysis with the
93A-infused samples was conducted in order to gain a better understanding of the effect
of scCO2 processing, such as the quantity and size of clay particles dispersed and changes
to the polymer incurred by processing.

iv
ACKNOWLEDGMENTS
I would like to express my gratitude to those who have helped me over the course
of my graduate career, aiding in the pursuit of my Ph.D. First and foremost, I would like
to thank Dr. Sunggyu Lee for his moral, intellectual and financial support. His extensive
wisdom enhanced my graduate experience in and out of the lab. It has been an honor to
be his doctoral student and will be a privilege to have him as a confidant in my pursuit of
future endeavors. Also, I would like to thank Dr. Douglas Ludlow for his advisement and
his diligence in handling matters pertinent to the attainment of my Ph.D. I would like to
show my appreciation to the U.S. Department of Education for awarding me the GAANN
fellowship as a source of financial support. My doctoral committee deserves recognition
as well for the time and effort they put forth in assessing the research I conducted for my
Ph.D. Last but not least, I would like to thank my family and friends for their
encouragement and the welcomed diversions they have afforded me over the years.

v
TABLE OF CONTENTS
Page
ABSTRACT....................................................................................................................... iii
ACKNOWLEDGMENTS ................................................................................................. iv
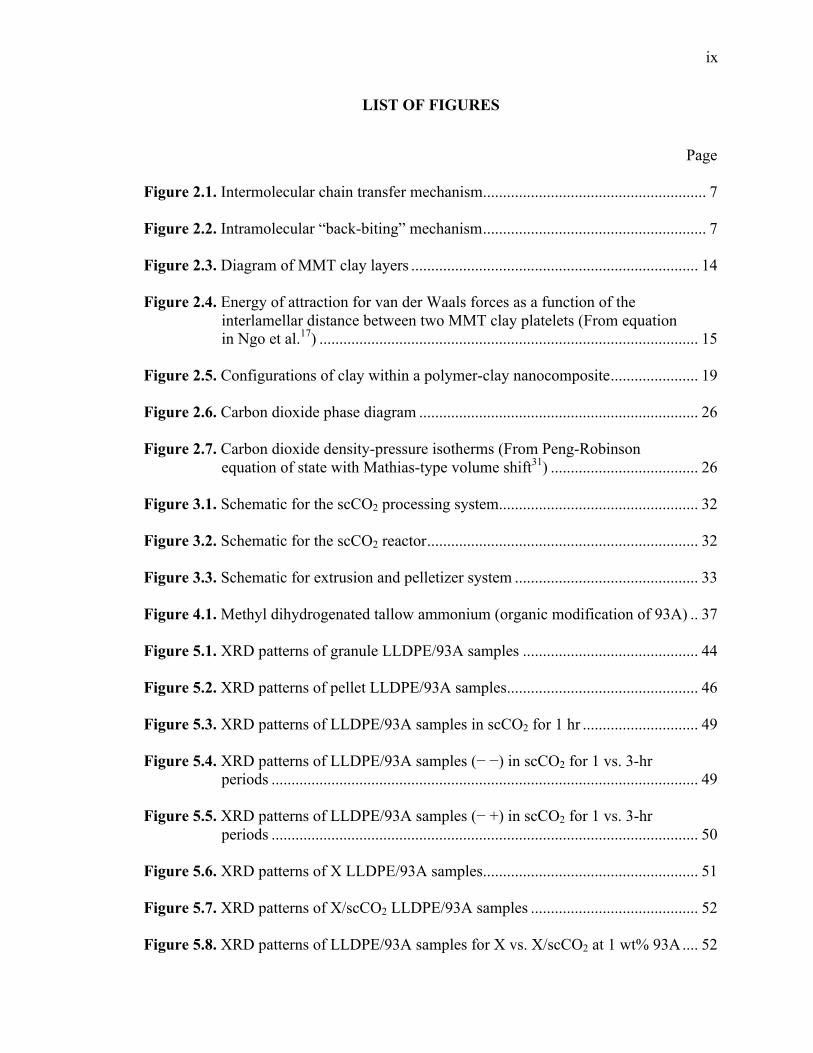
LIST OF FIGURES .......................................................................................................... iix
LIST OF TABLES............................................................................................................ xii
SECTION
1. INTRODUCTION...................................................................................................... 1
1.1. POLYMER-CLAY NANOCOMPOSITES (PCN’s) ......................................... 1
1.2. MOTIVATION................................................................................................... 1
1.3. OBJECTIVE ....................................................................................................... 3
1.4. APPROACH ....................................................................................................... 3
2. REVIEW OF LITERATURE..................................................................................... 5
2.1. POLYETHYLENE ............................................................................................. 5
2.1.1. Polymerization Methods........................................................................... 5
2.1.1.1 Free-radical polymerization ..........................................................6
2.1.1.2 Coordination polymerization ........................................................8
2.1.1.3 Metallocene catalyst polymerization (single-site) ........................9
2.1.2. Grades....................................................................................................... 9
2.1.2.1 High-density polyethylene (HDPE)..............................................9
2.1.2.2 Low-density polyethylene (LDPE) .............................................10
2.1.2.3 Linear low-density polyethylene (LLDPE) ................................11
2.1.2.4 Other polyethylenes ....................................................................12
2.2. CLAY................................................................................................................ 12
2.2.1. Montmorillonite (MMT) ........................................................................ 13
2.2.2. Organoclay ............................................................................................. 16
2.3. POLYMER-CLAY NANOCOMPOSITES...................................................... 18
2.3.1. Polymer-Clay Compatibility .................................................................. 19
2.3.2. Characterization...................................................................................... 20
2.3.2.1 X-ray diffraction (XRD) .............................................................20

vi
2.3.2.2 Fourier transform infrared (FTIR) spectrometry ........................22
2.3.2.3 Scanning electron microscopy (SEM) ........................................23
2.3.2.4 Thermogravimetric analysis (TGA)............................................24
2.3.2.5 Differential scanning calorimetry (DSC)....................................24
2.4. SUPERCRITICAL CARBON DIOXIDE (ScCO2).......................................... 25
2.4.1. ScCO2 Background................................................................................. 25
2.4.2. ScCO2 as a Solvent................................................................................. 27
2.4.3. ScCO2 as a Plasticizer ............................................................................ 27
2.4.4. ScCO2 Diffusion..................................................................................... 28
2.4.5. ScCO2 Intercalation/Exfoliation of Clay................................................ 29
3. EXPERIMENTAL APPARATUS........................................................................... 31
3.1. ScCO2 PROCESSING SYSTEM ..................................................................... 31
3.2. EXTRUSION SYSTEM ................................................................................... 31
3.3. X-RAY DIFFRACTION (XRD) ...................................................................... 33
3.4. FOURIER TRANSFORM INFRARED (FTIR) SPECTROMETRY .............. 34
3.5. THERMOGRAVIMETRIC ANALYSIS (TGA) ............................................. 35
3.6. DIFFERENTIAL SCANNING CALORIMETRY (DSC) ............................... 35
3.7. SCANNING ELECTRON MICROSCOPY (SEM) ......................................... 36
4. EXPERIMENTAL MATERIALS AND PROCEDURE......................................... 37
4.1. MATERIALS.................................................................................................... 37
4.2. PROCEDURE................................................................................................... 39
4.2.1. Granule LLDPE Experiments ................................................................ 39
4.2.2. LLDPE and LLDPE-g-MA Experiments ............................................... 40
4.2.3. LLDPE Experiments (1-hr) .................................................................... 40
4.2.4. Extruded LLDPE/93A Experiments....................................................... 41
5. EXPERIMENTAL ANALYSIS............................................................................... 43
5.1. DISPERSION ANALYSIS BY XRD............................................................... 43
5.1.1. Results .................................................................................................... 43
5.1.1.1 Resin size experiments: granule vs. pellet ..................................43
5.1.1.1.1 LLDPE granules in scCO2 .......................................... 43
5.1.1.1.2 LLDPE pellets in scCO2 ............................................. 45

vii
5.1.1.1.3 Summary ..................................................................... 47
5.1.1.2 Processing time experiments: LLDPE in scCO2 for 1 hr............48
5.1.1.3 ScCO2 capability experiments: extruded LLDPE/93A...............50
5.1.1.4 Compatibility experiments: LLDPE-g-MA ................................54
5.1.2. Discussion .............................................................................................. 57
5.1.2.1 Factors affecting clay gallery......................................................57
5.1.2.1.1 Molecular size............................................................. 57
5.1.2.1.2 Surfactant conformation.............................................. 58
5.1.2.1.3 Surfactant-clay surface interaction ............................. 58
5.1.2.2 Analysis of samples ....................................................................59
5.1.2.2.1 Cause of clay gallery changes..................................... 59
5.1.2.2.2 Effect of processing conditions................................... 60
5.2. EXTENDED ANALYSIS OF 93A-INFUSED LLDPE AND LLDPE-g-MA. 61
5.2.1. Results .................................................................................................... 61
5.2.1.1 DSC.............................................................................................61
5.2.1.2 TGA ............................................................................................65
5.2.1.2.1 LLDPE ........................................................................ 65
5.2.1.2.2 LLDPE-g-MA............................................................. 68
5.2.1.3 FTIR............................................................................................72
5.2.1.3.1 LLDPE ........................................................................ 77
5.2.1.3.2 LLDPE-g-MA............................................................. 77
5.2.1.3.3 Uniform dispersion analysis ....................................... 77
5.2.1.4 SEM ............................................................................................78
5.2.1.4.1 LLDPE ........................................................................ 78
5.2.1.4.2 LLDPE-g-MA............................................................. 78
5.2.2. Discussion .............................................................................................. 80
5.2.2.1 Effect of scCO2 on the polymer ..................................................81
5.2.2.1.1 DSC: crystallinity........................................................ 81
5.2.2.1.2 TGA: thermal stability ................................................ 82
5.2.2.2 Quantity of 93A infused..............................................................83
5.2.2.2.1 TGA vs. FTIR: LLDPE............................................... 84

viii
5.2.2.2.2 TGA vs. FTIR: LLDPE-g-MA ................................... 85
5.2.2.2.3 TGA vs. FTIR: accuracy analysis............................... 86
5.2.2.2.4 Effect of processing conditions: LLDPE .................... 86
5.2.2.2.5 Effect of processing conditions: LLDPE-g-MA......... 87
5.2.2.3 Visual inspection.........................................................................88
5.2.2.3.1 LLDPE ........................................................................ 88
5.2.2.3.2 LLDPE-g-MA............................................................. 90
6. CONCLUSIONS...................................................................................................... 94
APPENDIX....................................................................................................................... 97
BIBLIOGRAPHY........................................................................................................... 110
VITA .............................................................................................................................. 115
ix
LIST OF FIGURES
Page
Figure 2.1. Intermolecular chain transfer mechanism........................................................ 7 Figure 2.2. Intramolecular “back-biting” mechanism........................................................ 7 Figure 2.3. Diagram of MMT clay layers ........................................................................ 14 Figure 2.4. Energy of attraction for van der Waals forces as a function of the
interlamellar distance between two MMT clay platelets (From equation in Ngo et al.17) ............................................................................................... 15 Figure 2.5. Configurations of clay within a polymer-clay nanocomposite...................... 19 Figure 2.6. Carbon dioxide phase diagram ...................................................................... 26 Figure 2.7. Carbon dioxide density-pressure isotherms (From Peng-Robinson equation of state with Mathias-type volume shift31) ..................................... 26 Figure 3.1. Schematic for the scCO2 processing system.................................................. 32 Figure 3.2. Schematic for the scCO2 reactor.................................................................... 32 Figure 3.3. Schematic for extrusion and pelletizer system .............................................. 33 Figure 4.1. Methyl dihydrogenated tallow ammonium (organic modification of 93A) .. 37 Figure 5.1. XRD patterns of granule LLDPE/93A samples ............................................ 44 Figure 5.2. XRD patterns of pellet LLDPE/93A samples................................................ 46 Figure 5.3. XRD patterns of LLDPE/93A samples in scCO2 for 1 hr ............................. 49 Figure 5.4. XRD patterns of LLDPE/93A samples (− −) in scCO2 for 1 vs. 3-hr periods ........................................................................................................... 49 Figure 5.5. XRD patterns of LLDPE/93A samples (− +) in scCO2 for 1 vs. 3-hr periods ........................................................................................................... 50 Figure 5.6. XRD patterns of X LLDPE/93A samples...................................................... 51 Figure 5.7. XRD patterns of X/scCO2 LLDPE/93A samples .......................................... 52 Figure 5.8. XRD patterns of LLDPE/93A samples for X vs. X/scCO2 at 1 wt% 93A.... 52

x
Figure 5.9. XRD patterns of LLDPE/93A samples for X vs. X/scCO2 at 5 wt% 93A.... 53 Figure 5.10. XRD patterns of LLDPE/93A samples for X vs. X/scCO2 at 13 wt% 93A 53 Figure 5.11. XRD patterns of LLDPE-g-MA/93A samples ............................................ 55 Figure 5.12. Example of DSC curves produced by LLDPE/93A and LLDPE-g-MA/93A samples ........................................................................ 62 Figure 5.13. Example of integrating the area under the melting curve............................ 64 Figure 5.14. TGA of pure LLDPE and LLDPE processed with 93A in scCO2............... 66 Figure 5.15. Residual weight of pure LLDPE and LLDPE processed with 93A in scCO2 ........................................................................................................... 67 Figure 5.16. Quantity of 93A infused into LLDPE estimated from TGA residual weight........................................................................................................... 69 Figure 5.17. TGA of pure LLDPE-g-MA and LLDPE-g-MA processed with 93A in
scCO2 ........................................................................................................... 69 Figure 5.18. Residual weight of pure LLDPE-g-MA and LLDPE-g-MA processed with 93A in scCO2 ....................................................................................... 70 Figure 5.19. Quantity of 93A infused into LLDPE-g-MA estimated from TGA residual weight (not to scale) ....................................................................... 71 Figure 5.20. LLDPE/93A standard spectra with absorbance peak 522 cm-1 ................... 74 Figure 5.21. LLDPE/93A standard spectra with absorbance peak 2019 cm-1 ................. 74 Figure 5.22. Calibration curve for LLDPE/93A nanocomposites with 0 to 0.25 wt% 93A loadings ................................................................................................ 75 Figure 5.23. Calibration curve for LLDPE/93A nanocomposites with greater than 0.25 wt% 93A loadings................................................................................ 76 Figure 5.24. SEM of clay particle displaying its measurement dimensions .................... 79 Figure 5.25. SEM of clay particle exhibiting delamination............................................. 80 Figure 5.26. Comparison of the quantity of 93A infused into LLDPE as determined by TGA and FTIR analysis (standard deviation bars included) .................. 84

xi
Figure 5.27. Comparison of the quantity of 93A infused into LLDPE-g-MA as determined by TGA and FTIR analysis (standard deviation bars included) 85
Figure 5.28. SEM of LLDPE/93A sample (− −) surface ................................................. 88 Figure 5.29. SEM of LLDPE/93A sample (− +) surface ................................................. 89 Figure 5.30. SEM of LLDPE/93A sample (+ −) surface ................................................. 89 Figure 5.31. SEM of LLDPE/93A sample (+ +) surface ................................................. 90 Figure 5.32. SEM of LLDPE-g-MA/93A sample (− −) surface ...................................... 92 Figure 5.33. SEM of LLDPE-g-MA/93A sample (− +) surface ...................................... 92 Figure 5.34. SEM of LLDPE-g-MA/93A sample (+ −) surface ...................................... 93 Figure 5.35. SEM of LLDPE-g-MA/93A sample (+ +) surface ...................................... 93

xii
LIST OF TABLES
Page Table 4.1. Properties of LLDPE resins used in scCO2-processing experiments.............. 38 Table 4.2. Conditions for processing 93A with LLDPE granule in scCO2...................... 40 Table 4.3. Conditions for processing 93A with LLDPE and LLDPE-g-MA in scCO2 ... 41 Table 4.4. Conditions for processing 93A with LLDPE in scCO2 for 1 hr...................... 41 Table 4.5. Conditions for processing extruded LLDPE/93A in scCO2............................ 42 Table 5.1. CO2 density vs. d001-spacing of granule LLDPE/93A samples....................... 44 Table 5.2. CO2 density vs. d001-spacing of pellet LLDPE/93A samples.......................... 47 Table 5.3. d001-spacing values of LLDPE/93A samples for X vs. X/scCO2 .................... 54 Table 5.4. CO2 density vs. d001-spacing of LLDPE-g-MA/93A samples ........................ 56 Table 5.5. Melting (Tm) and crystallization (Tc) temperatures of LLDPE and LLDPE-g-MA infused with 93A as measured by DSC.................................. 63 Table 5.6. Crystallinity of LLDPE samples infused with 93A ........................................ 64 Table 5.7. Crystallinity of LLDPE-g-MA samples infused with 93A ............................. 65 Table 5.8. Main decomposition for pure LLDPE and processed LLDPE/93A samples.. 66 Table 5.9. Main decomposition for pure LLDPE-g-MA and processed LLDPE-g-MA/93A samples ........................................................................... 70 Table 5.10. Average weight percentage and standard deviation of 93A in LLDPE........ 77 Table 5.11. Average weight percentage and standard deviation of 93A in LLDPE-g-MA ............................................................................................... 78 Table 5.12. Influence of scCO2-processing conditions on crystallinity (heating 1) for
LLDPE/93A samples..................................................................................... 81 Table 5.13. Influence of scCO2-processing conditions on crystallinity (heating 1) for
LLDPE-g-MA/93A samples.......................................................................... 82

xiii
Table 5.14. Size distribution of clay particles in as-received 93A and LLDPE-g-MA/93A samples.......................................................................... 91
1. INTRODUCTION
1.1. POLYMER-CLAY NANOCOMPOSITES (PCN’s)
Since the late 1980’s when Toyota reported property enhancements in nylon-6
with the addition of clay, polymer-clay nanocomposites (PCN’s) have been of great
interest to researchers.1–3 Possessing properties initially well-suited for a wide variety of
applications from food packaging to car parts,1,2 PCN’s have been able to further expand
their uses to alternative energy applications such as batteries,4 fuel cells5 and solar cells.6
Clay as a polymer filler can improve on a myriad of properties including stiffness,
strength, flame retardancy, dimensional stability, gas permeability, solvent resistivity and
UV resistivity. Abundant in nature, clays are inexpensive and non-toxic to the
environment and humans. Inherently, clays are in a stacked platelet configuration and
agglomerated but offer greater property enhancement when intercalated or exfoliated into
individual layers as a result of their high aspect ratio facilitating greater interaction
between clay and polymer. Conventional composites can require 20 to 40 vol% filler to
achieve the same properties as a nanocomposite that uses 1 to 5 vol% filler. Due to low
filler content, viscosity increases are not a concern for processing, which can be
accomplished at similar conditions to those for the neat polymer. Most nanocomposites
are prepared by melt processing, but can be made by other techniques such as in-situ
polymerization or solvent casting.7
1.2. MOTIVATION
The motivation for this work emerges from a necessity to create PCN’s by a
method capable of operating at low temperatures without employing organic solvents.

2
Typically, PCN’s are created by melt mixing polymer and clay in high shear mixing
devices that utilize high temperatures to melt polymer. High temperatures can degrade
the organic modification of organoclays (e.g., degradation initiates around 180°C3,7),
hindering the compatibilization of polymer and clay. Also during processing with melt-
mixing devices, thermal degradation can occur with some polymers such as
polypropylene (PP) and polytetrafluoroethylene (PTFE).8 Polymer-clay nanocomposite
synthesis methods involving organic solvents, e.g., solvent-casting and in-situ
polymerization, enable the low-temperature mixing of dissolved polymer and clay in
solution, but can require large amounts of toxic chemicals to dissolve the polymer. These
chemicals can be difficult to completely separate from the product and recycle. In
addition, they are harmful to humans and the environment, requiring specialized handling
and disposal, which can be costly, especially on the industrial scale.
Supercritical carbon dioxide (scCO2) processing can be employed as an
alternative method of producing PCN’s. In its supercritical state, accessible at a low
temperature of 31.06°C, carbon dioxide (CO2) can possess the solvating properties
comparable to that of a liquid organic solvent,9 capable of dissolving, swelling and
plasticizing polymers. Processed at low temperatures, organoclays retain their organic
modification to facilitate clay dispersion and a stable morphology, empowering greater
enhancement of PCN’s. In addition, select polymers can be processed without degrading.
The separation of CO2 from the PCN product is straightforward, as depressurization will
revert CO2 to a subcritical gas that can be removed and recycled. Handling and disposal
are also simpler as CO2 is non-toxic to humans and environmentally benign.

3
1.3. OBJECTIVE
The objective of this study is to determine if organoclay Cloisite 93A (93A) can
be dispersed into linear low-density polyethylene (LLDPE) via scCO2 processing.
Dispersion is indicated by infusion and/or the enhanced intercalation/exfoliation behavior
of the organoclay. This work will center around a low processing time for infusion to
add to the industrial viability of the process. In addition, the processing parameters most
conducive to achieving this goal are determined.
1.4. APPROACH
To accomplish the objective of dispersing organoclay into LLDPE with scCO2
using a low infusion time, experiments were conducted to observe the effect LLDPE
resin size has on the dispersion of organoclay and the associated steps of sample analysis.
From these experiments, it appeared that the pellet resin could provide comparable or
improved dispersion as well as additional sample information not afforded by the granule
resin.
The pellet resin underwent experiments to investigate the processing time (1-hr
vs. 3-hr), the capability of scCO2 when clay is infused into the polymer and the effect of
LLDPE compatibility on dispersion. The information gained from the experiments
revealed that a 1-hr processing time was insufficient for infusion, infused clay could still
be affected by scCO2 and a more compatible form of LLDPE could affect dispersion
kinetics. The more compatible polymer, LLDPE grafted with maleic anhydride (a.k.a.
LLDPE-g-MA or maleated LLDPE), was employed to ascertain if the maleic anhydride
4
(MA) compatibilizing modification could enhance infusion and intercalation/exfoliation
behavior of 93A.
Further analysis was conducted on the organoclay-infused polymers, LLDPE and
LLDPE-g-MA, in order to obtain a better understanding of the influence of the scCO2
treatment. The infusion, d001-spacing, morphology and distribution of 93A in the
polymers were determined analytically from X-ray diffraction (XRD) patterns and
observed visually from scanning electron microscopy (SEM). The quantity of infused
clay was estimated by thermogravimetric analysis (TGA) and calculated by Fourier
transform infrared (FTIR) analysis, which used a method novel to PCN’s. And changes
in the polymer due to scCO2 treatment were investigated with differential scanning
calorimetry (DSC) and TGA.

5
2. REVIEW OF LITERATURE
2.1. POLYETHYLENE
Polyolefins are a class of polymers synthesized from double-bonded
hydrocarbons, such as ethylene, propene, butene-1 and isobutene. Polymerized, these
hydrocarbons make polyethylene, polypropylene, polybutylene-1 and polyisobutylene,
respectively.10 The resulting thermoplastic polymers are solid when cool, but soften,
liquefy and degrade, as they are heated to a temperature in which their covalent bonds are
broken. This is in contrast to thermoset polymers where heating will not soften the hard
polymer, but extreme temperatures will degrade the polymer by breaking covalent
bonds.11 Manufactured by the British company ICI in 1939, low-density polyethylene
(LDPE) was the first polyolefin to be commercialized.12
Polyethylene, the most manufactured of the polyolefins, is a semicrystalline
polymer available in a variety grades.12 The most common grades are high-density
polyethylene (HDPE), LDPE and linear low-density polyethylene (LLDPE).
Polyethylene grades are homo- and co-polymerized to exhibit a wide range of properties
in terms of density (low, medium and high), melt flow index (low, medium, and high),
average molecular weight (low, medium, high and ultra-high) and molecular weight
distribution (narrow and broad).10
2.1.1. Polymerization Methods. Ethylene can be polymerized by the following
methods: free-radical polymerization (high-pressure process), coordination
polymerization (medium- and low-pressure catalytic process) or metallocene catalyst
polymerization. Each method produces a different type of polyethylene that can greatly
differ in properties from one another.

6
2.1.1.1 Free-radical polymerization. Free-radical polymerization of ethylene is
a high-pressure process (100 MPa or higher13) that produces highly branched
homopolymers with side chains of different lengths.10 High processing pressures are
important to concentrate a suitable amount of the ethylene monomer, since above 9°C
ethylene is a gas, as well as increase the reaction rate. The increased reaction rates are
also attributed to the high temperatures within the reactor that range from 140°C to
300°C, averaging out to 220°C.13
The polymerization can occur by either an intermolecular chain transfer
mechanism or an intramolecular “back-biting” mechanism.12,13 The intermolecular chain
transfer mechanism (Figure 2.1) occurs when different polyethylene chains react with one
another13 to produce long-chain branches of hexyl or longer.12 Shorter chains (e.g.
typically ethyl and butyl13) are produced by the intramolecular “back-biting” mechanism
(Figure 2.2) that occurs when a polyethylene chain reacts with itself.13 This mechanism
is at higher pressures and achieves lower conversions than the chain transfer mechanism.
Furthermore, crystallinity increases due to short-chains allowing a more compact
structure than long-chains. By increasing polymerization pressure, the number of short-
branches increases to result in a nearly linear polymer.12

7
Figure 2.1. Intermolecular chain transfer mechanism
Figure 2.2. Intramolecular “back-biting” mechanism
Free-radical polymerization of ethylene begins by the initiator, oxygen or
peroxides,10,12–14 cleaving the double bond of ethylene to make it reactive. The reactive
species is an alkyl radical that propagates the reaction by reacting with a nonradical
species, creating an alkyl radical and lengthening the molecule. The reaction continues in

8
this fashion until radicals combine to terminate the reaction. To help control polymer
molecular weight, chain transfer agents are employed such as hydrogen, acetone,
propane, propene, and methyl ethyl ketone.13
2.1.1.2 Coordination polymerization. The coordination polymerization method
using medium and low pressures produces linear (reduced branching) homo- and
copolymers.10,12 Both discovered in the early 1950’s,14,15 two types of catalysts for this
process are Phillips- and Ziegler-type catalysts.
Medium-pressure processes (3 to 4 MPa) at 85 to 180°C use Phillips-type
catalysts made of an aluminum oxide (Al2O3) or silica-alumina base that supports
chromium oxide (CrO3).10,11 In Phillips-type catalysis, choosing a catalyst that favors the
chain termination reaction (β-hydrogen shift reaction) is important to controlling the
polymer molecular weight, thus melt flow index, since typical chain-transfer agents such
as hydrogen poison the catalyst.13
Ziegler-type catalysts consist of titanium esters, titanium halides or aluminum
trialkyls12 for low-pressure processing (0.1 to 5 MPa) in temperatures of 20 to 150°C.
Titanium tetrachloride, TiCl4, and triethyl aluminum, (CH3CH2)3Al, made up the first
Ziegler-type catalysts,12 but many other variations exist.13,14 Ziegler-type catalysts are
typically supported by Mg compounds such as Mg(OH)Cl or MgCl2. Compared to
catalysts without support, a narrower molecular weight distribution is produced in
polyethylene when catalysts are supported with MgCl2. Ziegler catalyst polymerizations
employ hydrogen to help control the polymer molecular weight.13 Intermediate species
when polymerizing in the presence of coordination catalysts are σ- and π-bonded
organometallic compounds.13,14
9
2.1.1.3 Metallocene catalyst polymerization (single-site). A third route to
polyethylene, developed in 1980,12 that allows for further tailoring of its properties is
metallocene catalyst polymerization (a.k.a. single-site catalyst polymerization).
Metallocene catalysts offer markedly increased activity over Ziegler-type catalysts,
offsetting the higher cost of the metallocene catalyst to make them competitive.12
Metallocene catalysts differ from coordination catalysts in that they allow polymers to be
built that have a narrow molecular weight distribution and a particular monomer
sequence can be specified during polymerization.10,12 Control over the monomer
sequence is due to the stable transition metal components with distinct structures,13
allowing a more efficient integration of comonomers such as butene-1, hexene-1 and
octene-1.12 In addition, polymers with a wide range of densities can be produced.
Methyl aluminoxane (MAO) cocatalyst activates transition metal compounds, such as Zr-
or Ti-centers coupled with cyclopentadienyl residuals, to create metallocene catalysts.10
Exhibiting a narrow molecular weight distribution and a high density, the first process
produced a linear polyethylene with the catalyst bis(cyclopentadienyl)zirconium
dichloride (Cp2ZrCl2)-MAO.12 As with Ziegler catalysis, control over molecular weight
can be maintained with hydrogen and the β-shift reaction. And current processes
employing Phillips- and Ziegler-type catalysts for PE production can switch to
metallocene catalysts without making equipment changes.13
2.1.2. Grades. Different grades of polyethylene are produced by employing
different processing methods.
2.1.2.1 High-density polyethylene (HDPE). High-density polyethylene is
produced by coordination polymerization in either a medium- or low-pressure

10
environment. At pressures of 3 to 4 MPa, the medium-pressure process employs a
Philips-type catalyst at 85 to 180°C to synthesize HDPE with a molecular weight of
50,000 g/mol. Ziegler-type catalysts aid in the polymerization of HDPE in a low-
pressure process (0.1 to 5 MPa) at 20 to 150°C. Molecular weight of HDPE using
Ziegler-type catalysts is between 200,000 to 400,000 g/mol. Exceeding that of LDPE,
the crystallinity of HDPE is 60 to 80% and the density is 940 to 970 kg/m3. Trash cans,
gasoline canisters, vehicle fuel tanks, crates, pails, housewares, and transportation and
storage containers10,12 are just a few of the applications for HDPE. Special grades of
HDPE are used for drinking and waste water equipment fittings, high-pressure pipes and
components for the automotive and chemical industries.10
2.1.2.2 Low-density polyethylene (LDPE). Low-density polyethylene is
produced by free-radical polymerization in a continuous process using pipe reactors or a
discontinuous process with stirrer reactors. The ethylene polymerization reaction is
initiated with 0.05 to 0.1% oxygen or peroxides and occurs at temperatures between 150
and 275°C and pressures from 100 to 300 MPa.10,12,13 Since ethylene has a critical
temperature of 9.5°C and a critical pressure of 5.08 MPa, the polymerization reaction
takes place in supercritical ethylene. The resultant polymer has a crystallinity of 40 to
50%, an average molecular weight of up to 600 kg/mol and side chains of dissimilar
lengths. The density of LDPE is 915 to 935 kg/m3. This density range includes medium-
density polyethylene (MDPE) that has a density of 925 to 930 kg/m3. Typical
applications for LDPE include films (packaging, shrink, heavy-duty bags, agriculture),
wire sheathing, pipes, pipe coatings, thermoforming boards and flexible containers and
bottles.10

11
2.1.2.3 Linear low-density polyethylene (LLDPE). Linear low-density
polyethylene is synthesized with a high-efficiency catalyst with one of the following four
methods: in suspension, in solution, in gas-phase low-pressure process or modified high-
pressure process. LLDPE has typically the same applications as LDPE and compared to
LDPE, films made with LLDPE are stronger at low temperatures, more resistant to
penetration and tearing, have a lower tendency for stress cracking and have good optical
properties.10
The suspension (slurry) process is performed in either autoclave reactors or loop
reactors. The autoclave reactor process that can employ multiple cascading reactors
operates in a pressure range of 0.5 to 1.0 MPa and temperature range of 80 to 90°C. And
at conditions of chromium-based Phillips catalysts, the loop reactor process operates at
pressures ranging from 3 to 4 MPa and at a temperature of 100°C.13
The solution process, which can be built for LLDPE production or dual
production of LLDPE and HDPE, operates at pressures near 10 MPa and temperatures
from 200 to 300°C.13
Employing a fluidized bed reactor, a wide range of densities (890 to 970 kg/m3)
and MFIs (0.01 to 100) for PE have been reported for polyethylene production in gas-
phase processes that can be used to create both LLDPE and HDPE. The reaction
temperature range for this process is from 80 to 100°C and the pressure ranges from 0.7
to 2.0 MPa.13
Autoclave or tubular reactors are used in high-pressure processes for polyethylene
production. Functioning at pressures of 150 to 200 MPa, the autoclave process acts like a
continuous stirred-tank reactor (CSTR) with temperatures ranging from 180°C in the first

12
zone to 290°C in the final zone. Operating in the regime of plug flow reactors (PFR), the
tubular reactor withstands reaction pressures of 200 to 350 MPa and the reaction
temperature is dependent upon the initiator. The temperature varies from
peroxydicarbonate initiated polymerizations at 140°C to oxygen initiated polymerizations
occurring at 190°C. This process modified specifically for LLDPE production typically
employs specially designed Ziegler-type catalysts capable of withstanding the high
temperatures.13
2.1.2.4 Other polyethylenes. Other polyethylenes have unique properties that
allow them to be used for more specialized applications. Categorized as high-density
polyethylenes, these include high-molecular weight high-density polyethylene
(HMWHDPE) and ultra high-molecular weight high-density polyethylene
(UHMWHDPE). On the low-density side of the spectrum, PE’s with unique properties
are very low-density polyethylene (VLDPE) and ultra low-density polyethylene
(ULDPE). And polyethylenes produced with metallocene catalysts (PE-M) include
MLLDPE, MMDPE, MHDPE, MVLDPE and PE-MD/HD-(M).13
2.2. CLAY
Clays that have a crystalline structure are categorized as smectites
(phyllosilicates), serpentines, micas (illites), kaolins, chlorites and vermiculites, and other
clays (glauconite, sepiolite-palygorskite-attapulgite and mixed-layer clay minerals).3,16
The crystalline structure and charge characteristics (location and amount) per unit cell are
the foundation for clay classification. The most commercialized clays are classified under
smectites, which include hectorite (HT) and montmorillonite (MMT).3 Due to the limited

13
availability of HT, MMT is the most manufactured clay for use in polymer-clay
nanocomposites.3,12
2.2.1. Montmorillonite (MMT). Montmorillonite is a naturally occurring 2:1
phyllosilicate that can exhibit a broad range of compositions in its three different
layers.3,12 The octahedral layer contains aluminum (Al), magnesium (Mg) and iron (Fe3+)
that vary in compositions of 3.0 to 4.0 wt%, 0 to 1.4 wt% and 0 to 1.0 wt%, respectively.
The tetrahedral layer consists of silicon (Si), ranging in composition from 7.2 to 8.0wt%,
and Al, ranging in composition from 0 to 0.8 wt%. And the interlamellar aqueous layer
contains an exchangeable cation of sodium (Na+) that exists in a composition range of
0.67 to 0.8 wt%.3 The structure of MMT is configured such that a central octahedral
layer (composed mainly of Al) is located between two silica tetrahedral layers, as seen in
Figure 2.3.3,12 Generally, each unit cell has a net negative charge (ideally -0.67) on the
flat side of the platelet due to Mg+2 cations replacing some Al+3 cations. The cation-
exchange capacity (CEC) is typically 0.915 meq/g, but can range from 0.8 to 1.2 meq/g.3
Present between aluminosilicate layers, hydrated Na+, Mg2+, Ca2+, Li+, or K+ cations
balance the negative charge, imparting a slightly positive charge at the edges of the
platelets.12

14
Figure 2.3. Diagram of MMT clay layers
The distance between platelets is referred to as interlamellar gallery height and the
interlayer spacing is the thickness of the platelet plus the interlamellar gallery height,
displayed in Figure 2.3. The interlayer spacing is the d001-spacing (or basal spacing) in
XRD analysis and is nominally 0.96 nm for dry MMT, corresponding to the thickness of
a MMT platelet. Partially hydrated, natural MMT has a d001-spacing of 1.2 to 1.4 nm.
Clays consist of stacks of platelets held together by van der Waals forces that weaken as
platelets are separated (Figure 2.4).3

15
Figure 2.4. Energy of attraction for van der Waals forces as a function of the interlamellar distance between two MMT clay platelets (From equation in Ngo et al.17)
Due to its high water content (typically 23%), clay is oven dried to remove the
majority of water prior to processing. Water can swell MMT up to 30 times its original
volume. Montmorillonite has a specific surface area of 750 to 800 m2/g, which is below
its theoretical value of 834 m2/g. Its density is typically 2.5 g/ml and it possesses a Mohs
hardness (20°C) value of 1.5 to 2.0. The aspect ratio of MMT can be up to 1500, but
commercially the aspect ratio is typically from 10 to 300. Commercial clays consist of

16
particles (~8µm in size) containing upwards of 3000 platelets. The color of clay is
dictated by its composition and can range from blue-grey or pale yellow to dark red. The
Fe3+ content affects the reddish color of clay and also alters the refractive index for
certain MMT clays, ranging from 1.523 to 1.590.3
2.2.2. Organoclay. Organoclays are clays that have been converted from their
natural hydrophilic state to an organophilic (hydrophobic) state. Due to their thixotropic
nature and thus their ability to control the flow behavior of liquids, organoclays were
initially (1940’s) used as additives in paints, waxes, cosmetics, printing inks, lubricants,
etc.3 Since the 1980’s, the interest in organoclays has shifted toward polymeric additives.
The conversion of clay to organoclay is achieved by a cation-exchange reaction
that exchanges the metal cations (Na+) between clay layers with organic cations (RH+)
such as alkylammonium salts.3,12,16 The cation-exchange reaction
Na+-MMT + RH+ Na+ + RH+-MMT
is a reversible process requiring excess organic cations RH+ to ensure the reaction
produces organoclay. The ease at which this is done is determined by the cation-exchange
capacity (CEC), optimally between 0.8 and 1.2 meq/g for MMT (ion concentration range
that deters solid-solid interactions between platelets and promotes acceptable chemical
activity). A variety of factors influence the rate of reaction such as reaction medium,
temperature, pressure, pH, clay type, clay concentration, clay particle geometry,
exchange cation type, etc. For example, the ion exchange reaction proceeds faster in
water than in alcohol (or other organic liquids in aqueous solutions) and at elevated

17
temperatures (recommended from 60 to 80°C). And the fastest reacting type of clay is
Na-MMT.3
The physical process of exchanging cations for other cations in Na-MMT is
accomplished by mechanical shear mixing of a Na-MMT aqueous slurry in the presence
of excess organic cations. The shear mixing aids in the ion exchange and can be
conducted in devices such as a colloid mill. Ultrasonication of the Na-MMT aqueous
slurry can replace shear mixing to facilitate the ion exchange reaction.3
The choice of intercalant is dependent on its ability to diffuse between clay layers,
expand the interlamellar spacing, and improve clay interactions with the organic host
matrix. The organic cation is dual-functional, able to bond strongly to the clay platelets
and have an organic portion that non-ionically interacts with the clay surface. The goal
of the organic part is to expand the interlamellar spacing (reduces solid-solid interactions
between platelets) and render the clay organophilic as to improve the clay-organic matrix
interactions.3 The expansion of interlamellar spacing is in relation to the size of the
organic cation, longer chains forcing clay layers further apart. Many types of exchange
cations, thus organoclays, are available and chosen depending on the end-use of the
clay.3,12,16
Marked by clay discoloration, the organic component (intercalant) of organoclays
may begin to decompose at temperatures lower than 180°C, resulting in reduced
interlayer spacing. The decomposition products for commercial organoclays modified
with a quaternary alkylammonium surfactant can include water, carbon dioxide, alkenes,
alkanes, alcohols, carboxylic acids, aldehydes, aromatics, amines, and dialkyl sulfate.7

18
2.3. POLYMER-CLAY NANOCOMPOSITES
Clays can exist in three different configurations within a polymer matrix:
immiscible (conventional), intercalated and exfoliated. Immiscible composites are
microcomposites containing stacks of clay platelets surrounded by polymer chains.3,12
Clays in intercalated and exfoliated configurations interact with the polymer matrix via
their platelets with nanometer dimensions (~1 nm platelet thickness), making them
nanocomposites.16 In an intercalated configuration, stacks of clay platelets contain
polymer chains between their platelets, increasing the interlayer spacing (d001-spacing <
8.8 nm). If the clay stacks have been delaminated into individual platelets, the
configuration is deemed exfoliated (d001-spacing > 8.8 nm).3,12 Exfoliated clay platelets
can be randomly aligned or aligned in one direction within a polymer matrix, constituting
disordered and ordered exfoliated configurations.3 Most PCN’s exhibit more than one
configuration.16 Figure 2.5 displays the different configurations of clay within a polymer
matrix.

19
Figure 2.5. Configurations of clay within a polymer-clay nanocomposite
2.3.1. Polymer-Clay Compatibility. Compatibility between the polymer matrix
and clay filler plays a significant role in the properties of the resultant composite due to
its ability to affect the clay’s configuration. Clay that is incompatible with the polymer
matrix will favor agglomeration, resulting in a conventional clay structure.18 In addition
to increasing interlamellar gallery distance, clay modifications have been motivated by
the intent of increasing the material compatibility between clay and polymer for use in
PCN’s. Typically clays are modified by organic cations (normally alkylammonium salts)
exchanged with metal cations (Na+) intercalated between clay platelets and are commonly
referred to as organoclays.3,12 By compatibilizing the ions between clay platelets with the
polymer matrix, the polymer chains are more likely to enter the interlamellar galleries of
the clay to create an intercalated structure. In many instances of PCN creation,
intercalation or partial intercalation/exfoliation is the optimal configuration obtained with

20
the use of organoclays. The absence of complete exfoliation could be due to the still
large difference between the hydrophobicity of polymers and the hydrophilicity of the
organoclay. To reconcile this difference, further compatibilization can be employed in
addition to the modifications offered by the organoclay. Grafting maleic anhydride (MA)
onto non-polar polymers (e.g., polyolefins) adds a hydrophilic (polar) component to a
hydrophobic polymer that is capable of interacting with the oxygen groups on the surface
of the hydrophilic clay platelet. The hydrophilic nature of MA aids the polymer in
entering the clay gallery, while the hydrophobic polymer pushes the platelets apart into
an exfoliated structure. The hydrophobic nature of the polymer is important to
exfoliating the clay since a polymer that is hydrophilic will be attracted to the clay
platelets, holding them together as it enters the clay gallery to produce an intercalated
morphology.19,20
2.3.2. Characterization. Characterization of PCN’s is important to determining
the properties they will exhibit. The following methods use x-rays, infrared light,
electrons or heat in order to obtain information about a sample.
2.3.2.1 X-ray diffraction (XRD). X-ray diffraction (XRD) analysis is a
technique employed to analyze materials exhibiting crystallinity (e.g., PCN’s). An XRD
instrument contains an X-ray tube, a monochromator and a detector. A specimen
undergoing XRD analysis is bombarded by X-rays emitted by the X-ray tube. The X-
rays are created by striking a metal such as copper with accelerated electrons, transferring
energy to the metal that in turn releases radiation in the form of X-rays.21 After
impacting the specimen, the diffracted X-rays are collected by a rotating detector and are
converted into a spectrum of peaks that provides details on the crystalline structure
21
depending on location and shape of the peak.3,21 Unknown materials can be identified via
an XRD spectrum since each material exhibits a different pattern.22 An XRD spectrum
will display the diffraction angle (2θ) on the x-axis and the intensity (of arbitrary units)
on the y-axis.3 A specimen can be analyzed in the form of a thin sheet or a powder.
Wide angle X-ray scattering (WAXS) and small angle X-ray scattering (SAXS) are the
two types of XRD devices that typically operate in diffraction angle ranges above and
below 2θ = 2°, respectively.3,12 During analysis of the XRD spectrum, the peak location
is used to calculate the interlayer spacing between adjacent crystallographic planes (e.g.,
clay platelets), a.k.a. the d-spacing, using Bragg’s law:
(1)
where n is an integer indicative of the order of reflection (n = 1 for principal reflection), λ
is the wavelength of the incident X-ray beam (λ = 0.1540562 nm for Cu-Kα1 radiation
source), and θ is the incident (or reflection) angle of the X-ray beam.3
In terms of PCN’s, the typical XRD diffraction angle range for clays is 2θ = 1-
12°.3 Mentioned above, Bragg’s law can be used in conjunction with the peak position to
determine the distance between clay platelets within a polymer matrix, which can
indicate the degree of polymer intercalation or clay modifier removal. Peak shape also
provides information about the clay morphology, as peak broadening can be due to the
partial exfoliation of the clays (i.e., the existence of a range of d-spacing values) or
defects in the crystalline structure of the clays. During exfoliation, the intensity of the

22
peak decreases in addition to its broadening, and completely exfoliated clays display no
peak.3,22
2.3.2.2 Fourier transform infrared (FTIR) spectrometry . Fourier transform
infrared (FTIR) spectrometry is a useful analytical technique capable of detecting minute
amounts of chemicals in solid, liquid or gaseous states. This ability enables the
identification, qualification and quantification of components within a sample. An FTIR
device works by focusing an infrared (IR) beam on a sample that in turn either transmits
or absorbs the frequencies of the beam, depending on the vibrational and rotational
energy levels of the sample’s molecules to create an identifying spectrum or “fingerprint”
unique to the material.22,23 The main components comprising a typical FTIR
spectrometer are the IR source, interferometer, sample chamber, detector and computer.
Beginning with the source (i.e., a glowing black-body source), an IR beam of energy is
emitted that is encoded with all frequencies in the IR range by the interferometer,
drastically enhancing the scanning speed as opposed to a single-frequency beam. Typical
interferometers consist of a beam splitter, transmitting half of the IR beam and reflecting
the other half, a fixed mirror and a mobile mirror.22,23 Upon leaving the interferometer,
the signal-encoded beam (interferogram) is directed through the sample chamber where
the sample is held typically in a nitrogen-purged environment. Mentioned above, the
signals of the IR beam are either transmitted through or absorbed by the sample,
depending on the composition of the sample. The signals not absorbed are collected by
the detector, digitized, and sent to the computer for conversion (employing Fourier
transform) into a spectrum indicative of the sample.23

23
Considering PCN’s, FTIR analysis is advantageous for determining polymer and
clay modifier degradation7 due to processing conditions or the amount of clay within the
sample.24 As the concentration of clay increases within the sample, peaks indicative of
the clay will increase accordingly. Unlike XRD, clay with any morphology can be
detected by FTIR, but the morphology cannot be determined by the spectra. In addition,
FTIR is a non-destructive technique, permitting a sample to be analyzed many times.
2.3.2.3 Scanning electron microscopy (SEM). Scanning electron microscopy
(SEM) is an imaging technique that enables the topographic viewing of a material with a
resolution of 1 to 10 nm and exhibits a large depth of focus.22,25,26 An SEM consists of an
electron gun, electromagnetic lenses, detectors, cathode-ray tube and a charge-coupled
diode (CCD).25,26 The electron gun emits electrons (maximum accelerating voltage is
typically 30 kV) that are focused onto the specimen by electromagnetic lenses.22,25,26 The
source of electrons is usually a tungsten filament or a lanthanum hexaboride crystal.25,26
The electron beam is scanned across the specimen, which in turn produces backscattered
electrons, secondary electrons, X-rays and Auger electrons.22,25,26 The detectors collect
the incident electrons and X-rays for material analysis such as surface imaging or
composition determination.22,26 The image is produced on the cathode-ray tube, and it is
captured on film or digitalized with the CCD.22,25,26 The SEM is kept under high vacuum
(about 10-3 Pa) to prevent the electrons from scattering (due to collisions with air
molecules) before reaching the specimen. To prevent electrons from electrostatically
charging the specimen from an inadequate path to ground, materials with insufficient
electrical conductivity are coated with conducting carbon or metal to make them
conductive. Employing an energy-dispersive spectrometer (EDS) or wavelength-

24
dispersive spectrometer (WDS), SEM is capable of detecting X-rays for determining the
chemical composition of a specimen.25,26 SEM can be used to analyze materials such as
polymers, ceramics, metals and biomaterials. When analyzing the interaction of clay
with the polymer matrix in PCN’s, SEM can aid in revealing morphology, distribution
and particle size of the clay.
2.3.2.4 Thermogravimetric analysis (TGA). Thermogravimetric analysis
(TGA) is a technique that relates a sample’s mass to the temperature of its environment at
a given time. To conduct TGA analysis, a sample is exposed to an increasing (or
decreasing) temperature at a constant rate or an isothermal environment for a set period
of time and measuring the resultant change in the sample. The atmospheric gas can also
be adjusted to analyze the sample in different environments, such as an inert (nitrogen) or
oxidative (air) environment.27,28 A TGA device consists of a microbalance that relays the
changing mass of the sample to a force coil, compensating for the change in terms of an
electromagnetic force that is proportional to the mass change.27 From the resultant
thermal profile of TGA, properties of materials can be ascertained including composition,
thermal stability, oxidative stability, moisture content, volatile content, kinetics of
decomposition,27,28 material lifetime and flammability. Materials that benefit from TGA
include polymers (thermoplastics and thermosets), composites, ceramics, glasses,
pharmaceuticals, food coatings, organic materials, petroleum and explosives.
2.3.2.5 Differential scanning calorimetry (DSC). Differential scanning
calorimetry (DSC) is a useful tool for determining a material’s melting temperature, glass
transition temperature, crystallization point, heat of melting, heat of fusion, degree of
crystallization, composition, blend compatibility, oxidation conditions, curing conditions,

25
purity and phase diagrams. A DSC plot reveals endothermic and exothermic peaks due
to the respective absorbing and releasing of heat by the analysis material.27,29 The
analysis can occur with the material subjected to an increasing, decreasing or constant
temperature. The DSC device functions by subjecting a sample and a reference material
to the same conditions and the difference between the quantities of heat required to
increase their temperatures represents the heat flow, which is plotted against temperature
or time.27,29 Typically samples are analyzed in an inert nitrogen (or argon) environment
unless oxidative studies are being conducted.27 A DSC can be used for investigating
polymers, such as assessing the curing process of thermosets and the phase transitions of
thermoplastics. Also, the food and pharmaceutical industries benefit from the utilization
of DSC.27,29
2.4. SUPERCRITICAL CARBON DIOXIDE (ScCO2)
2.4.1. ScCO2 Background. Supercritical carbon dioxide (scCO2) possesses
properties of both gas and liquid with high diffusion rates and solublizing characteristics,
respectively. Altering these density-driven properties can be accomplished by adjusting
temperature and pressure, making it a tunable fluid. In addition, CO2 is inexpensive, non-
toxic, non-combustible and chemically stable. Carbon dioxide reaches its critical point at
31.06°C and 7.38 MPa, exhibiting a critical density of about 0.466 g/cm3. The phase
diagram and density-pressure isotherms for CO2 are, respectively, displayed in Figures
2.6 and 2.7. Current applications employing scCO2 include coffee decaffeination, dry
cleaning, chemical extraction and separation, fluoropolymerization,30 low-temperature
polymer processing, and biological and pharmaceutical processing.

26
Figure 2.6. Carbon dioxide phase diagram
Figure 2.7. Carbon dioxide density-pressure isotherms (From Peng-Robinson equation of
state with Mathias-type volume shift31)

27
2.4.2. ScCO2 as a Solvent. Due to its properties of dissolution, scCO2 can
possess the high solvating ability of an organic liquid solvent in the presence of
polymers. Carbon dioxide solubility can be greater than 30wt% in certain polymers,9
which can lead to significant polymer swelling depending on a variety of factors such as
chemical makeup, degree of crystallinity, molecular weight, sample dimensions, etc.32
Occurring simultaneously to create a single phase, as the CO2 dissolves in the polymer,
the polymer dissolves in the CO2. Carbon dioxide dissolution in the polymer reduces the
polymer’s viscosity, permitting processing at moderate temperatures. The small
molecules of scCO2 afford a low surface tension and allow it to penetrate smaller spaces
than the larger molecules of liquid solvents. Furthermore, separation of scCO2 from
processed materials is easily achieved by depressurization, facilitating recycling. Making
use of the attributes of scCO2 as a solvent, fluoroalkyl substituted polythiophene
semiconducting polymers were produced in scCO2 and were observed to exhibit
comparable properties to those made in the organic solvent chloroform.33
2.4.3. ScCO2 as a Plasticizer. By dissolving in a polymer, scCO2 is capable of
reversibly plasticizing the polymer at a low temperature, i.e., avoiding thermal
degradation.8,34 The phenomenon of plasticization occurs when the glass transition
temperature of the polymer is reduced below the processing temperature.9 In addition,
plasticization is accompanied by a reduction in the melting temperature and viscosity of
the polymer.8,32,34,35 Reduction in viscosity primarily occurs by increasing the free
volume of the polymer,8 boosting polymer chain mobility.8,32,36 The added freedom of
polymer chains can promote crystallization of the polymer,32,36 evidenced by a rise in the
melting temperature and melting enthalpy.32 Plasticization can also reduce viscosity by

28
dissolved CO2 lowering the concentration of entwined polymer chains.8 In terms of
thermodynamics, an effective plasticizer will interact with the polymer via intermolecular
forces that are on the same scale as the polymer-polymer intermolecular forces. While
the size of the plasticizer molecule decreases, the plasticizer efficiency will increase.34
Due to their ability to absorb more CO2, plasticization occurs to a higher degree in
amorphous polymers as compared to crystalline polymers. Polymer impregnation and
foaming are some applications that benefit from the phenomenon of plasticization.
2.4.4. ScCO2 Diffusion. The rate of CO2 diffusion into a polymer is accelerated
when CO2 is pressurized. The diffusion rate of CO2 is related to its small molecular size
and low surface tension, facilitating its sorption into the polymer to dictate polymer free
volume.36,37 Studies have shown that polymer sorption/desorption of CO2 follows
Fickian diffusion kinetics.9,36–39 Consequently, CO2 diffusivity is related to the initial
linear slope of a plot of the mass uptake of dissolved CO2 in the polymer per total CO2
mass uptake possible (M(t)/M∞) vs. the square root of desorption time divided by the
initial polymer thickness (t1/2/L). Fick’s second law of diffusion (one-dimensional) for
changes in concentration with respect to time is written as
(2)
Using Fick’s second law, diffusion for a slab (e.g., film) of thickness L can be estimated
as

29
(3)
where M(t) is the mass of the substance diffusing into the polymer at time t, M∞ is the
mass at equilibrium sorption (after infinite time) and D is the molecular diffusivity.36–39
Equation (2) assumes the polymer thickness remains constant during CO2 sorption.
Although swelling of the polymer can occur from CO2 sorption, studies have
circumvented the issue by measuring polymer swelling to validate the assumption that it
is small enough to be negligible36 or have adjusted treatment conditions to ensure it is
small.37 The rate of diffusion increases with increasing pressure and temperature,36
relying on solvent density and polymer plasticization that increase, respectively, with
increasing pressure and temperature.36 High diffusion rates in conjunction with its ability
for polymer swelling enable compressed CO2 to deposit additives within a polymer
matrix. Berens et al. reported that the sorption rate of dimethyl phthalate (DMP) into
poly(vinyl chloride) (PVC) in pressurized CO2 could be six orders of magnitude higher
than in PVC without CO2 treatment.9
2.4.5. ScCO2 Intercalation/Exfoliation of Clay. Clay can also benefit from
scCO2 processing as the distance between platelets can be expanded in this environment,
resulting in intercalation or exfoliation. The mechanism proceeds by CO2 molecules,
reduced in size from pressurization, entering the interlamellar galleries of the clay. Once
an adequate soak period has elapsed to allow sufficient time for CO2 to plasticize the
surfactant and induce gallery expansion via surfactant conformation changes,40 the
system is catastrophically depressurized. Quickly expanding, the CO2 molecules further
separate the clay platelets to permit intercalation by plasticized polymer chains or have

30
the potential to bring about platelet delamination.41–43 Mentioned above and displayed in
Figure 2.4, expansion of interlamellar galleries can prompt delamination since van der
Waals forces holding platelets together progressively diminish as platelets are separated.

31
3. EXPERIMENTAL APPARATUS
3.1. ScCO2 PROCESSING SYSTEM
All scCO2 infusion/dispersion experiments were conducted in a 300 mL
Autoclave reactor (Autoclave Engineers) constructed of 316 stainless steel. A pneumatic
motor drives the Magnedrive II magnetic mixer affixed to the reactor head that rotates the
impeller within the reactor. The reactor is equipped with a stainless steel thimble to
simplify insertion and extraction of processing materials. A stainless steel o-ring gasket
is located between the reactor head and body to seal the vessel, and six bolts secure the
reactor head to the body. Cooling coils augment the reactor head, extending into the
interior of the reactor. An Omega temperature controller is manually operated to regulate
reactor temperature via clamp heaters and type J thermocouples. A gas cylinder supplies
the CO2 that is further pressurized by a booster pump, stored in a vessel and transported
throughout the system to the reactor via 1/8” stainless steel tubing. A pressure gauge is
used to monitor the reactor pressure. Valves are located at the reactor inlet and outlet for
supplying and releasing the pressurized gas. The scCO2 processing system and reactor
are shown in Figures 3.1 and 3.2.
3.2. EXTRUSION SYSTEM
Extrusion experiments were conducted with a C. W. Brabender Instruments
(South Hackensack, NJ) counter-rotating twin-screw extruder and a pelletizer to produce
LLDPE pellet resin containing polymer and clay. A Haake Rheocord torque rheometer
drives the twin-screw extruder, and an Eurotherm 808 temperature controller heats the
extruder zones and the fiber die. At the extruder feed zone, a gravity-fed hopper supplies

32
Figure 3.1. Schematic for the scCO2 processing system
Figure 3.2. Schematic for the scCO2 reactor

33
the extruder with a mixture of polymer resin and clay that is subsequently melted, mixed
and extruded through the fiber die. Cooling water circulates the exterior of the extruder
feed zone to curb premature polymer softening. Once extruded, the polymer-clay fiber is
cooled in an ice water bath and spooled. The polymer-clay fiber is supercooled with
liquid nitrogen and fed through an electric pelletizer to produce polymer-clay pellet resin.
The extrusion setup is displayed in Figure 3.3.
Figure 3.3. Schematic for extrusion and pelletizer system
3.3. X-RAY DIFFRACTION (XRD)
X-ray diffraction was completed with a Philips X-Pert diffractometer with a Cu-
Kα1 radiation source having a wavelength of 0.154056 nm. The generator voltage was

34
45 kV and the tube current was 40 mA. The XRD data angle range was from 1 to 10°
with an increment of 2θ.
X-ray diffraction was conducted on polymer-clay pellet samples that were formed
into 1 mm thick coins. Using a Carver Laboratory Press (Carver Model M), the polymer
pellets were heated on a brass plate at 195°C until they were completely melted. Then a
heated metal plate was placed on top of the lower plate with spacers in between them.
The top plate was held in place until the polymer hardened and the coin could be
removed.
3.4. FOURIER TRANSFORM INFRARED (FTIR) SPECTROMETRY
Fourier transform infrared analysis was conducted with a Nicolet Nexus 470
FTIR E.S.P. spectrometer (Nicolet Instrument Co., Madison, WI) that scanned the wave
number range from 400 cm-1 to 4,000 cm-1 an average of 4 times. The spectrometer had a
4 cm-1 resolution and a 1 cm absorption path length. Data from the spectrometer was
collected with Omnic E.S.P. 5.1 computer software (Nicolet Instrument Co., Madison,
WI) and analyzed with Spekwin32 computer software.
Heated to 185°C, a Carver Laboratory Press [Carver Model M] was used to create
films for FTIR analysis by compressing polymer/clay samples to 68.9 MPa for
approximately 50 s. The LLDPE/93A films had a thickness between 50 and 90 µm and
the LLDPE-g-MA/93A films had a thickness ranging from 70 and 180 µm.
In order to determine the weight percent of 93A in the samples with FTIR
analysis, initial calibration standards were made using a twin-screw extruder and an
electric pelletizer. Used to estimate the quantity of clay in the processed samples, the first

35
LLDPE/clay standards contained 0, 1, 5 and 13 wt% 93A. Driven by a Haake Rheocord
torque rheometer and heated with an Eurotherm 808 temperature controller, a batch
mixer was used to produce LLDPE/clay calibration standards for determining precise
amounts of clay within the samples that had 0.25 wt% clay and less. These LLDPE/clay
standards contained 0, 0.05, 0.10, 0.15, 0.20 and 0.25 wt% 93A.
3.5. THERMOGRAVIMETRIC ANALYSIS (TGA)
Thermogravimetric analysis was conducted with samples weighing from 40 to 65
mg. The device is a Netzsch STA 409 C/CD. Samples were heated from 30 to 600°C at
a rate of 10°C/min. Analyses were conducted under nitrogen atmosphere with a flow rate
of 20 ml/min.
3.6. DIFFERENTIAL SCANNING CALORIMETRY (DSC)
Differential scanning calorimetry was conducted with a TA DSC 2010 on
polymer-clay samples that weighed between 5 and 10 mg. Under a nitrogen atmosphere,
the samples were heated from room temperature to 190°C at a rate of 10°C/min. This
temperature was held for three minutes and then the samples were cooled at the same rate
to about 35°C. The same heating/cooling processes were then repeated again and the
data was collected. The first heating/cooling was to remove any thermal history within
the sample. The second heating/cooling was to obtain the melting and
crystallization temperatures. The pressure was at typical atmospheric conditions.
For DSC, polymer-clay resin samples were hermetically sealed in aluminum
sample pans using a DSC sample press.

36
3.7. SCANNING ELECTRON MICROSCOPY (SEM)
Scanning electron microscopy was conducted on samples with a Hitachi S-4700
field emission (FE) SEM. This SEM employs a tungsten electron gun and possesses the
ability for crystal orientation analysis.
Samples were cross-sectioned for SEM by supercooling them in liquid nitrogen
for 2.5 h and then fracturing them with a hammer and a razorblade.

37
4. EXPERIMENTAL MATERIALS AND PROCEDURE
4.1. MATERIALS
The materials employed in this study were an organo-nanoclay, four grades of
LLDPE (pellet form, granule form, extrusion grade, and maleated) and gaseous CO2.
Southern Clay Products, Inc. (Gonzales, TX) supplied the organo-nanoclay Cloisite 93A
(93A). The sizes of the clay particles by volume were as follows: 10% were less than 2
µm, 50% were less than 6 µm and 90% were less than 13 µm in size. The room-
temperature clay density was 1.88 g/cm3. Shown in Figure 4.1, 93A is a natural
montmorillonite that is modified with a quaternary ammonium salt (methyl,
dihydrogenated tallow ammonium) in a concentration of 90 mequiv/100 g of clay. In
comparison to other modified clays, 93A has been reported to possess a high affinity for
CO2.41 Before all experiments, 93A underwent a drying process, where it was placed in
an oven for 24 h at 80°C.
Figure 4.1. Methyl dihydrogenated tallow ammonium (organic modification of 93A)

38
The types of LLDPE resin used in this work and their properties are listed in
Table 4.1. The properties listed in Table 4.1 are the resin form, melting temperature
(Tm), density and melt flow index (MFI) at 190°C. Supercritical CO2-processing
experiments involving LLDPE pellet resin were conducted with Dowlex 2517 (Dow
Chemical Company, Midland, MI). The pellets are egg-shaped with 3 mm x 5 mm
dimensions. Experiments requiring the processing of LLDPE granule resin in scCO2
were undertaken with Exxon LL5100 obtained from ExxonMobil Chemical Company
(Houston, TX). Most LLDPE grains were less than 0.5 mm in their largest dimension,
while few were as large as 1 mm. Extruded samples undergoing scCO2 processing
utilized an extrusion grade LLDPE with trade name Dowlex 2047G (Dow Chemical
Company, Midland, MI). After extrusion and pelletization, the resin was cylindrical with
a diameter of 2 mm and a length of 5 mm. Used for scCO2 processing experiments with
maleated LLDPE, the pellet resin Polybond 3109 (Uniroyal Chemical Company,
Middlebury, CT) has a MA graft level of 1 wt % and cylindrical dimensions of 3 mm
(diameter) x 3.5 mm (length). The MA modification increases the compatibility of
LLDPE with clay16,44–46 and CO2.8,35,47
Table 4.1. Properties of LLDPE resins used in scCO2-processing experiments
Trade Name Dowlex 2517
Exxon LL5100
Dowlex 2047G
Polybond 3109
Resin Pellet Granule Pellet Pellet
Tm (°C) 124 122 122 123
Density (kg/m3) 917 925 917 926
MFI (g/10min) 25 20 2.3 30

39
All supercritical fluid experiments used CO2 that was obtained from Airgas
(Rolla, MO). The CO2 is research grade with a purity of 99.999%.
4.2. PROCEDURE
The procedure for preparing and processing polymer and clay in scCO2 was
comparable for all experiments and any deviations from this procedure are noted in the
sections below. The processing materials, consisting of polymer and 93A, were prepared
by placing them into a stainless steel thimble and mechanically mixing until the polymer
was thoroughly coated with clay. All polymer resin was in pellet form unless otherwise
noted as granule form. In the case of scCO2 experiments with extruded LLDPE/93A
resin, only the polymer-clay resin (no clay added) was processed in the reactor. The
thimble was inserted into the reactor and the reactor was sealed. Next, the reactor was
heated and pressurized. When the reactor reached the desired temperature and pressure,
the experiment was deemed to have begun and was maintained in a batch mode at the
prescribed conditions for a set duration. During the experiment, a constant and uniform
reactor temperature was maintained by flowing water through the reactor head and
driving an impeller within the reactor (~300 rpm). Once the experiment reached
completion, the reactor was rapidly depressurized into an open container, and the samples
were recovered.
4.2.1. Granule LLDPE Experiments. To prepare the polymer-clay mixture for
scCO2 processing experiments with LLDPE granule resin, 4.25 g of resin was
mechanically mixed with 0.75 g of 93A. To observe the effect of two rapid
depressurizations, the reactor was rapidly depressurized after 1 hr, allowed to cool, re-

40
pressurized and processed for 2 more hours before the final rapid depressurization. The
samples were processed in a batch mode for a total of 3 hrs. The processing conditions
and corresponding sample names for the experiments are outlined in Table 4.2.
Table 4.2. Conditions for processing 93A with LLDPE granule in scCO2
Sample T (oC) P (MPa)
= + 37.8 17.2
− − 60.0 10.3
− + 60.0 17.2
− + * 60.0 17.2
+ − 98.9 10.3
+ + 98.9 17.2 * Run repeat
4.2.2. LLDPE and LLDPE-g-MA Experiments. The preparation of the
polymer-clay mixture for 3-hr experimental processing times was identical for LLDPE
and LLDPE-g-MA, accomplished by the mechanical mixing of 10 g of polymer with 2.5
g of 93A. The processing conditions and corresponding sample names for the
experiments are outlined in Table 4.3.
4.2.3. LLDPE Experiments (1-hr). In experiments with LLDPE resin
employing a 1-hr processing time, the polymer-clay mixture was prepared by
mechanically mixing 5 g of LLDPE with 0.5 g of 93A. The processing conditions and
corresponding sample names for the experiments are outlined in Table 4.4.

41
Table 4.3. Conditions for processing 93A with LLDPE and LLDPE-g-MA in scCO2
Sample T (oC) P (MPa)
− − 60.0 10.3
− + 60.0 17.2
+ − 98.9 10.3
+ + 98.9 17.2
Table 4.4. Conditions for processing 93A with LLDPE in scCO2 for 1 hr
Sample T (oC) P (MPa)
= − 37.8 10.3
= + 37.8 17.2
− − 60.0 10.3
− + 60.0 17.2
4.2.4. Extruded LLDPE/93A Experiments. Extruded LLDPE/93A resin was
created by feeding a mixture of LLDPE and 93A through a twin-screw extruder at a
temperature of 190°C. The amount of 93A in the LLDPE/93A mixture was adjusted in
order to obtain nanocomposites containing 1, 5 and 13 wt% 93A. The LLDPE/93A melt
was extruded through a fiber die and cooled in an ice water bath. The resultant
LLDPE/93A fiber was supercooled with liquid nitrogen and pelletized.
Supercritical CO2 experiments with extruded LLDPE/93A resin containing
different amounts of clay were conducted by placing 5 g of the LLDPE/93A resin into the
reactor and processing in a batch mode for 3 hrs. In an attempt to increase separation,

42
disruption and/or dispersion of stacked clay platelets by the rapid expansion CO2
molecules, the reactor was quickly depressurized every half hour. The processing
conditions and corresponding sample names for the experiments are outlined in Table
4.5.
Table 4.5. Conditions for processing extruded LLDPE/93A in scCO2
93A (wt%) T (oC) P (MPa)
1 98.9 17.2
5 98.9 17.2
13 98.9 17.2

43
5. EXPERIMENTAL ANALYSIS
5.1. DISPERSION ANALYSIS BY XRD
5.1.1. Results. Samples underwent XRD analysis in order to determine if the
scCO2 processing had altered the dispersion of 93A.
5.1.1.1 Resin size experiments: granule vs. pellet. Two resin forms of LLDPE,
granule and pellet, were processed in scCO2 to investigate the dependency of clay
dispersion on resin size and the associated steps of sample analysis. The d001-spacings
were determined by XRD and employed to judge the effect of processing on the clay.
The presence of a peak in XRD analysis of pellet LLDPE/93A samples is indicative of
the occurrence of clay infusion, and the movement in the peak position is indicative of
changes in intercalation/exfoliation behavior. Determination of clay infusion into granule
LLDPE was not attempted since once mixed, granule LLDPE and clay could not be
readily separated due to their small particle sizes. So it would be unknown whether any
clay detected by XRD could be attributed to clay mixed with LLDPE, clay infused into
LLDPE or a combination of the two. However, a change in intercalation/exfoliation
behavior was detected as a change in the d001-spacing between clay platelets.
5.1.1.1.1 LLDPE granules in scCO2. The granule LLDPE/93A samples,
processed at conditions in Table 4.1, were analyzed by XRD to determine if alterations
resulted from scCO2 processing. The XRD patterns are shown in Figure 5.1. All samples
exhibited peaks near that of pure 93A, which is at a Bragg angle of 3.385° and thus
represents a d001-spacing of 26.1 Å. As seen in Table 5.1, the d-spacing of 93A platelets
decreased as the CO2 processing density increased up to a certain limit. After reaching a
CO2 density of 0.656 g/cm3, the scCO2 had no effect on the d-spacing of the clay. This is

44
Figure 5.1. XRD patterns of granule LLDPE/93A samples
Table 5.1. CO2 density vs. d001-spacing of granule LLDPE/93A samples
Sample ρCO2 (g/cm3) d001-spacing (Å)
Pure 93A NA 26.1
+ − 0.200 (+) 0.7
− − 0.325 (−) 0.2
+ + 0.402 (−) 0.9
− + 0.656 26.1
− + 0.656 26.1
= + 0.825 26.1

45
postulated to be due to the reduced temperature and elevated pressure, restricting the
mobility of the surfactant and polymer chains as a result of the higher crystallinity and
increased compression. The lowest density condition investigated, sample (+ −), had an
increase in d-spacing, whereas the second and third lowest density conditions had
decreases in d-spacing. High temperature and low pressure both improved surfactant
mobility to prompt an increase in the gallery height. Losses in gallery height can be
attributed to sample conditions involving a low temperature (sample (− −)) or high
pressure (sample (+ +)) that individually, impeded the surfactant in such a way as to
collapse the gallery.
X-ray diffraction pattern intensities are not compared due to the phenomenon of
preferred orientation (especially prominent in powder samples),21 where crystallites are
not randomly oriented within the sample and cannot produce a consistent intensity
profile. The issues associated with preferred orientation are exemplified in Figure 5.1 by
sample (− +) that was experimentally repeated and produced the same d-spacing, but a
largely different intensity profile.
5.1.1.1.2 LLDPE pellets in scCO2. Pellets of LLDPE were processed with 93A
in scCO2 at four different run conditions (Table 4.2). X-ray diffraction analysis was
conducted on the LLDPE/93A pellets to determine if infusion had occurred and also if
d001-spacing was altered. The results are displayed in Figure 5.2. The XRD pattern
reveals 93A creates a peak at a Bragg angle of 3.4° which corresponds to a d001-spacing
of 25.9 Å. All samples display similar peaks around the same angle, indicating that
infusion of 93A occurred.20,41,44,48 The sample (− +) has the lowest almost nonexistent
peak, which could indicate either the clay is well dispersed or almost no clay is in the

46
Figure 5.2. XRD patterns of pellet LLDPE/93A samples
polymer,16,41,44,48 most likely the latter. Presented later in this work, analysis of the
quantity of clay within the sample will help to confirm which of these conjectures is
correct, as XRD alone is not enough to determine if the clay is well dispersed or
exfoliated.48 Samples (− −), (+ −) and (+ +) have clear peaks from the 93A with d001-
spacings of 27.3, 28.1 and 27.3 Å, respectively. The increase in d001-spacings as
compared to pure 93A could be due to the polymer diffusing between platelets and
pushing them apart or changes in conformation of the intercalated surfactant, making
them closer to an exfoliated structure.16,41,44,46,48 As with the granule LLDPE, the low-
pressure and a high-temperature sample (+ −), possessing the lowest density, had the
largest increase in spacing between platelets. This sample experiences an increased

47
platelet spacing possibly since the CO2 molecules, polymer chains and surfactant chains
are more mobile in a low-pressure environment, making it easier for intercalation or
surfactant conformation changes. And to the same end, the high temperature helps
mobility by plasticizing the polymer and surfactant. Displayed in Table 5.2, d-spacing
increased as the CO2 density decreased, exhibiting the same inverse correlation between
d-spacing and fluid density as the granule LLDPE/93A samples. Larger intensities in
XRD peaks can indicate an increase in tactoid size and/or parallel registry of the clay.40,41
The run with the highest conditions, sample (+ +), had the largest peak intensity,
indicating that this environment could create more uniform d-spacings of 93A within the
polymer.40
Table 5.2. CO2 density vs. d001-spacing of pellet LLDPE/93A samples
Sample ρCO2 (g/cm3) d001-spacing (Å)
Pure 93A NA 25.9
+ − 0.200 (+) 2.2
− − 0.325 (+) 1.4
+ + 0.402 (+) 1.4
5.1.1.1.3 Summary. From the XRD results, it is apparent that 93A did not
experience as large of an increase in d-spacing in processing with granule LLDPE as
compared to pellet LLDPE. This is suggested to be due to the lower continuous
processing time of the granule samples. Granule samples underwent two rapid

48
depressurizations with an interrupted processing time in comparison to one rapid
depressurization with a continuous processing time for pellet samples, suggesting that a
continuous processing time is more significant to intercalation/exfoliation behavior. It is
possible that a continuous 3-hr processing time for granule resin could produce similar
results to those obtained for the pellet resin. Also, the pellet resin showed improvement
in d-spacing for three processing conditions whereas the granule resin showed
improvement for one. In terms of sample analysis, as it is not the case with granule
LLDPE, infusion of 93A into pellet LLDPE is determined simultaneously with the d-
spacing determination by XRD, providing more information with a single analysis. In
addition, the larger size of the pellet resin could enable its cross-sectioning to ascertain
the depth of clay infusion. Exhibiting a greater improvement in intercalation/exfoliation
behavior as well as important infusion data, pellet LLDPE samples were employed for
the remainder of this work.
5.1.1.2 Processing time experiments: LLDPE in scCO2 for 1 hr. At the
processing conditions displayed in Table 4.3, LLDPE and 93A were processed in scCO2
for a period of 1 hr in order to determine if these conditions could promote clay infusion
into LLDPE. X-ray diffraction analysis was conducted on the samples and the resultant
patterns were compared. Seen in Figure 5.3, there is no peak present for any of the
processing conditions that can be attributed to 93A. The absence of a peak is due to the
lack of clay infusion into LLDPE and was confirmed by SEM (Figure A.1). Displayed in
Figure 5.4 and 5.5, XRD patterns for experiments at 60°C for 1-hr processing times were
superimposed on patterns for 3-hr processing times to show the importance of the

49
Figure 5.3. XRD patterns of LLDPE/93A samples in scCO2 for 1 hr
Figure 5.4. XRD patterns of LLDPE/93A samples (− −) in scCO2 for 1 vs. 3-hr periods

50
Figure 5.5. XRD patterns of LLDPE/93A samples (− +) in scCO2 for 1 vs. 3-hr periods
extended processing to achieving clay infusion. The figures clearly indicate that at these
conditions, 1 hr of scCO2 processing is insufficient for infusing 93A into LLDPE.
5.1.1.3 ScCO2 capability experiments: extruded LLDPE/93A. To ascertain the
effect of scCO2 processing on clay already within the polymer matrix, scCO2 processing
experiments were conducted with extruded LLDPE/93A samples containing 1, 5 and 13
wt% 93A. If scCO2 has no effect on the clay after it is within the polymer, then it cannot
be expected to aid in intercalation or exfoliation after infusion. This scenario would
require the intercalation/exfoliation of clay to occur before clay infusion is undertaken.
The experiments were all conducted at conditions of 210°C and 17.2MPa, ensuring that
the only variation was the amount of clay within the sample. After processing, the
extruded and scCO2 processed samples (X/scCO2) were analyzed by XRD and compared

51
to their parent samples that only underwent extrusion (X). The XRD patterns are
displayed in Figures 5.6 and 5.7. Due to scCO2 processing, the d-spacing for 5 and 13
wt% 93A increased, while the d-spacing stayed the same for 1wt% 93A (Figures 5.8, 5.9
and 5.10). The largest increase in spacing was observed with 5 wt% 93A, which was an
increase of 11.8 Å from its extruded only counterpart (Table 5.3). Increases in the d-
spacing of platelets are the result of surfactant conformation changes and/or the
intercalation of polymer chains. Most likely, the 1 wt% 93A sample remained unaffected
by scCO2 processing due to the low amount of clay in the sample, corresponding to an
even lower amount of clay near the surface of the LLDPE pellet capable of exposure to
the scCO2. An increase in peak intensity for samples as compared to their non-scCO2
Figure 5.6. XRD patterns of X LLDPE/93A samples

52
Figure 5.7. XRD patterns of X/scCO2 LLDPE/93A samples
Figure 5.8. XRD patterns of LLDPE/93A samples for X vs. X/scCO2 at 1 wt% 93A

53
Figure 5.9. XRD patterns of LLDPE/93A samples for X vs. X/scCO2 at 5 wt% 93A
Figure 5.10. XRD patterns of LLDPE/93A samples for X vs. X/scCO2 at 13 wt% 93A

54
Table 5.3. d001-spacing values of LLDPE/93A samples for X vs. X/scCO2
Sample X (Å) X/scCO2 (Å) Δ (Å)
1wt%93A 25.4 25.4 0
5wt%93A 20.6 32.4 (+) 11.8
13wt%93A 27.0 28.6 (+) 1.6
processed counterparts could indicate an increase in the d-spacing heterogeneity of the
clay.40,41 The treatment increases the mobility of the clay platelets by plasticizing the
intercalated surfactant and surrounding polymer chains, allowing the formation of a more
aligned structure.40 The results indicate that within the LLDPE matrix, the supercritical
fluid can still affect the intercalation/exfoliation behavior of 93A.
5.1.1.4 Compatibility experiments: LLDPE-g-MA. To investigate the effect of
compatibility between processing components has on infusion, maleated LLDPE
(LLDPE-g-MA) was processed with 93A in scCO2 at different temperatures and
pressures (Table 4.2). The polar MA modification increases the compatibility of LLDPE
with the clay and the processing fluid, respectively, capable of interacting favorably with
oxygen groups on the clay surface and the significant quadrupole moment of CO2. The
resultant samples were analyzed by XRD. From the XRD patterns (Figure 5.11), it is
apparent that 93A was successfully infused into the LLDPE-g-MA for all run conditions
since the 93A peak is present.20,41,44,48 Sample (− +) exhibits a less pronounced peak in
comparison to the other samples in the XRD plot. A possible scenario could be that the
clay is almost completely dispersed or scarcely any clay is present within the sample,
giving little to no peak in the XRD pattern.16,41,44,48 As stated above for LLDPE (Section

55
Figure 5.11. XRD patterns of LLDPE-g-MA/93A samples
5.1.1.2), this scenario can be confirmed or disproven by a quantity of clay analysis found
later in this work. The d001-spacings for the clay peaks found in samples (− −), (+ −), and
(+ +) are, respectively, + 2.4, + 1.5 and − 1.0 Å in relation to that of 24.4 Å for 93A.
These differences in distances may not be very large, but may still be significant, as a
trend seems to exist. The d-spacings indicate that in samples (− −) and (+ −), where the
pressure was low, the spacing between clay platelets increased due to processing. In
sample (− −), the lowest temperature and pressure environment, the largest increase in
spacing between clay platelets occurred. In this instance, the afforded chain mobility
from a high temperature is less significant than from a low pressure, as the low-
temperature condition was sufficient to warrant a larger increase in platelet spacing than
that for the high temperature. The MA modification of the polymer could be altering the

56
interaction between the CO2, organoclay and the polymer to enable greater layer
separation at a lower temperature. Sample (+ −) might not have realized such a large
increase in spacing because increased chain mobility from the high temperature could
have resulted in a rearrangement of the surfactant in a manner to lessen the increase in
layer spacing. And at a higher pressure seen in sample (+ +), the spacing between clay
platelets decreased. The mobility afforded by the high temperature could have resulted in
rearrangement of the surfactant chains to allow the compression by the increased pressure
to reduce d-spacing.49 In terms of a relationship between CO2 density and d-spacing, no
trend seems to exist (Table 5.4). The increase in distance between platelets is favored
over a decrease because it can indicate that surfactant conformation has increased or that
polymer has found its way between the platelets, enhancing the intercalation/exfoliation
behavior of the clay.41,44,46,48
Table 5.4. CO2 density vs. d001-spacing of LLDPE-g-MA/93A samples
Sample ρCO2 (g/cm3) d001-spacing (Å)
Pure 93A NA 24.4
+ − 0.200 (+) 1.5
− − 0.325 (+) 2.4
+ + 0.402 (−) 1.0
Comparing LLDPE and LLDPE-g-MA, XRD analysis exhibited different
relations between d-spacing and sample conditions which can be attributed to the MA
modification of LLDPE-g-MA. The high-temperature and low-pressure sample for

57
LLDPE had the largest increase in platelet spacing, indicating preferential conditions
when trying to achieve an intercalated or exfoliated clay structure. However, LLDPE-g-
MA experienced the greatest intercalation/exfoliation behavior with the low-temperature
and -pressure sample. It is proposed that the polar MA groups in LLDPE-g-MA alter the
interaction between CO2, organoclay and polymer to enhance intercalation/exfoliation
behavior at a lower temperature than that for LLDPE.
5.1.2. Discussion. In this section, the different factors that can affect the clay
gallery height are discussed, and the samples are analyzed in terms of the cause of clay
gallery height changes and how the clay gallery is affected by processing conditions.
5.1.2.1 Factors affecting clay gallery. The height of the clay gallery can be
affected by different factors such as the intercalant molecular size, the surfactant
conformation and the interaction between the surfactant and the clay surface.
5.1.2.1.1 Molecular size. In order to determine if changes in gallery height of the
clay were brought on by rearrangement of surfactant or LLDPE intercalation, the sizes of
involved molecules were determined. Following the work of Xi et al.,50 the estimated
molecular size of the 93A surfactant was calculated with data for the van der Waals
radius, covalent bond radius and bond angle. The size of the surfactant molecule was
calculated to be 4.3 Å for the nitrogen-containing head and 23.8 Å for the length of the
tail composed of 18 carbon atoms, resulting in 28.1 Å for the full length of the molecule.
The molecular diameter of the surfactant tail and the LLDPE chain were assumed
equivalent as they are both composed of a chain of carbon and hydrogen atoms, giving
them a 4.1 Å diameter in the smallest dimension.

58
5.1.2.1.2 Surfactant conformation. Under certain conditions, the surfactant can
undergo conformation changes within the gallery; leading to increases or decreases in
gallery height. Conformation terminology is adopted from Xi et al.50 to explain the
arrangement of the surfactant from observed d-spacing values. In its initial state, the 93A
surfactant was assumed to exist in a paraffin-type monomolecular conformation between
the clay layers, whereby the surfactant tail is angled away from the clay surface. To
make this determination, the gallery height was calculated by subtracting the thickness of
a clay platelet of 9.6 Å3 from the d001-spacing of 93A (e.g., a 93A d001-spacing of 25.9 Å
corresponds to a gallery height of 16.3 Å). The gallery was then used to determine the
molecular packing arrangement. For a surfactant monolayer conformation, gallery height
would be near 4.1 Å for the minimum dimension whereas around twice this value would
indicate an assumed bilayer conformation. With greater gallery heights, the
conformation is assumed to transition to the paraffin-type monomolecular arrangement
that characterizes the 93A surfactant conformation. (Other conformations can exist,
however, only these have been discussed to explain the methodology applied in
determining the surfactant conformation.) The paraffin-type chain arrangement is altered
by an increase or decrease in the tilt angle away from the clay surface. At a low enough
angle, the chain will transition to a bilayer arrangement and further losses in gallery
height will result in transition to a monolayer arrangement.
5.1.2.1.3 Surfactant-clay surface interaction. Changes in the gallery of 93A
from scCO2 processing can result from changes in the surfactant interaction with the clay
surface. In the gallery, 93A surfactant is either tethered to the clay surface by ion-dipole
interactions or bound tail-to-tail to adjacent surfactant chains by van der Waals forces.49

59
During processing, the scCO2 fluid plasticizes the surfactant, increasing its mobility.
Mobilization of tail-to-tail bound chains can induce their cation exchange with residual
sodium cations, tethering the surfactant chains to the clay surface via ion-dipole bonds.
The increased packing from the newly bound surfactant can prompt conformation
changes that lead to increases in gallery height.
5.1.2.2 Analysis of samples. The above factors were applied to sample results in
order to determine the cause of changes in clay gallery height, and the effect of
processing conditions on the intercalation/exfoliation behavior of samples was examined.
5.1.2.2.1 Cause of clay gallery changes. Except for the case of extruded
LLDPE/93A with 5 wt% 93A in scCO2, the maximum increase in gallery spacing
considering all experiments was 2.4 Å (LLDPE-g-MA sample). Since the gallery height
experienced an increase less than the diameter of a LLDPE chain (4.1 Å) and the even
larger LLDPE-g-MA chain, no intercalation is postulated to have taken place and
increases in spacing are due to the conditions favoring increased cation exchange of
surfactant, increasing bound surfactant concentration. This expands the gallery by
forcing a packing arrangement wherein the surfactant is tilted at a larger angle away from
the clay surface. For extruded LLDPE/93A with 5 wt% 93A, LLDPE intercalation could
have occurred since the increase in gallery height of 6.3 Å is greater than that of the
diameter of a LLDPE chain. However, it is more likely intercalation did not occur, but
rather the surfactant concentration increased to a level where the chain is closer to being
perpendicular to the clay surface, as noted by the gallery height (22.8 Å) being near to the
length of the surfactant tail (23.8 Å). Losses in gallery height, at a maximum of 1 Å
(LLDPE-g-MA sample), were attributed to the processing conditions enabling the

60
surfactant to form a more efficient packing arrangement without further cation exchange,
decreasing the angle of the surfactant chain to allow the layer to collapse.
5.1.2.2.2 Effect of processing conditions. The scCO2 environment best suited
for enhancing the intercalation/exfoliation behavior of LLDPE/93A samples was
determined to result from high-temperature (98.9°C) and low-pressure (10.3 MPa)
experiments. High temperatures reduce the crystallinity of the surfactant by melting,
enabling increased plasticization by CO2 to enhance chain mobility. In addition, the
relatively lower experimental pressure improves chain mobility by decreasing surfactant
compression. Thompson et al.40 predominantly observed that increases in pressure led to
an expansion in the gallery of organoclays. This result was due to the increase in CO2
concentration furthering surfactant plasticization to enhance mobility. The maximum
pressure employed in the Thompson et al. study of 8.4 MPa is below the minimum
employed in this work of 10.3 MPa that led to improved intercalation/exfoliation
behavior. It is postulated that a critical pressure exists (i.e., the solubility pressure) and
above this pressure, CO2 concentration in the surfactant remains constant, preventing
increases in plasticization due to dissolving CO2. Any further increases in pressure are
detrimental to platelet separation due to compression forces brought on by the hydraulic
pressure effect. It is important to note that as the CO2 is interacting with the surfactant, it
is also interacting in a similar fashion with the polymer that could alter interaction of CO2
with the surfactant.
Intercalation/exfoliation behavior of LLDPE-g-MA samples was best enhanced
with conditions employing a low temperature (60°C) and a low pressure (10.3 MPa).
Mentioned above, the lower pressure is favored for gallery expansion to alleviate the

61
hydraulic pressure effect. In comparison to LLDPE, the reduction in temperature for
increasing the gallery height can be explained by the increased compatibility of LLDPE-
g-MA with the processing fluid and the clay. Greater dissolution of CO2 occurs in the
maleated polymer, enabling greater access of CO2 to the clay galleries. Additionally, the
maleated polymer allows the clay platelets to separate more easily due to attractive forces
between MA and the clay surface. The combination of these factors led to a lower
temperature required for mobilizing surfactant to give rise to expansion of clay galleries.
5.2. EXTENDED ANALYSIS OF 93A-INFUSED LLDPE AND LLDPE-g-MA
5.2.1. Results. Further analysis was conducted on samples of LLDPE and
LLDPE-g-MA infused with 93A at scCO2–processing conditions displayed in Table 4.2.
The methods used to analyze the samples were DSC, TGA, FTIR spectrometry and SEM.
5.2.1.1 DSC. Samples of LLDPE and LLDPE-g-MA infused with 93A were
analyzed by DSC to ascertain endothermic and exothermic changes attributed to the
respective melting and crystallization of the PCN. Samples underwent two
heating/cooling cycles during DSC, where the first cycle was used to determine changes
in the polymer crystallinity induced by the scCO2 processing. The second cycle was used
to determine changes in the polymer processing conditions and crystallinity due to the
infusion of clay.
The DSC analysis of LLDPE and LLDPE-g-MA samples infused with 93A
produced curves that are exemplified by those displayed in Figure 5.12. The maximum
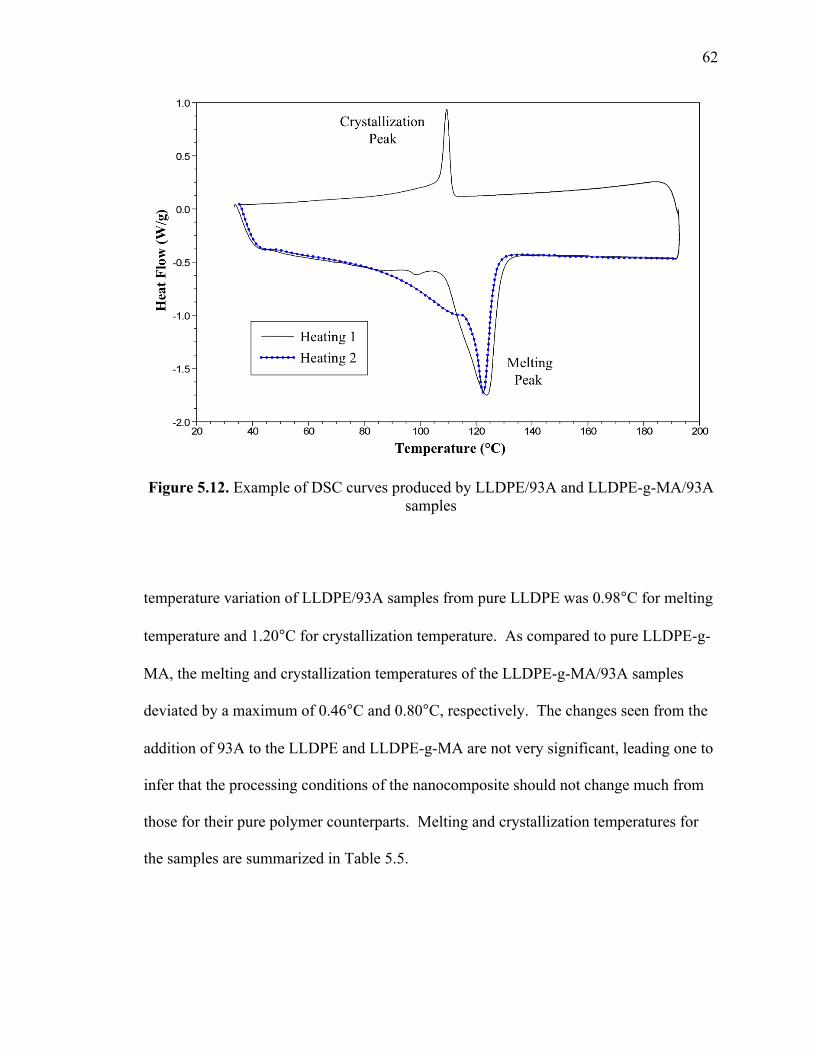
62
Figure 5.12. Example of DSC curves produced by LLDPE/93A and LLDPE-g-MA/93A samples
temperature variation of LLDPE/93A samples from pure LLDPE was 0.98°C for melting
temperature and 1.20°C for crystallization temperature. As compared to pure LLDPE-g-
MA, the melting and crystallization temperatures of the LLDPE-g-MA/93A samples
deviated by a maximum of 0.46°C and 0.80°C, respectively. The changes seen from the
addition of 93A to the LLDPE and LLDPE-g-MA are not very significant, leading one to
infer that the processing conditions of the nanocomposite should not change much from
those for their pure polymer counterparts. Melting and crystallization temperatures for
the samples are summarized in Table 5.5.

63
Table 5.5. Melting (Tm) and crystallization (Tc) temperatures of LLDPE and LLDPE-g-MA infused with 93A as measured by DSC
LLDPE LLDPE-g-MA
Sample Tm (°C) Tc (°C) Tm (°C) Tc (°C)
Pure 123.11 105.23 122.58 108.67
− − (+) 0.68 (+) 1.20 (−) 0.46 (+) 0.16
− + (+) 0.85 (+) 1.05 (−) 0.11 (+) 0.26
+ − (+) 0.98 (+) 1.10 (−) 0.02 (+) 0.80
+ + (+) 0.86 (+) 0.41 (+) 0.08 (+) 0.41
From the PCN sample melting curves, the crystallinity (α) of the polymer was
calculated using the equation
(4)
where Hf is the melting enthalpy (aka heat of fusion) for the polymer sample and Hf100% is
the melting enthalpy for a theoretical 100% crystalline polymer. The value of Hf100% for
100% crystalline polyethylene is nominally 293 J/g.51 The enthalpy of melting (Hf) for
the sample is determined by integrating the area under the melting curve, as exemplified
in Figure 5.13. The crystallinities of PCN samples are displayed in Table 5.6 and Table
5.7. Compared to pure LLDPE, the maximum variation in crystallinity observed for
processed samples was 2.35% and 3.21% for heating 1 and heating 2, respectively.
Processed samples of LLDPE-g-MA varied in crystallinity by a maximum of 3.28% for
heating 1 and 1.30% for heating 2 in comparison to pure LLDPE-g-MA.

64
Figure 5.13. Example of integrating the area under the melting curve
Table 5.6. Crystallinity of LLDPE samples infused with 93A
Sample Heating 1 (%) Heating 2 (%)
LLDPE 34.64 36.11
− − (+) 0.75 (+) 3.21
− + (−) 0.54 (−) 1.33
+ − (+) 2.29 (+) 2.12
+ + (+) 2.35 (+) 1.98

65
Table 5.7. Crystallinity of LLDPE-g-MA samples infused with 93A
Sample Heating 1 (%) Heating 2 (%)
LLDPE-g-MA 47.88 49.42
− − (+) 0.34 (+) 0.65
− + (+) 1.33 (+) 1.16
+ − (+) 0.65 (−) 1.30
+ + (+) 3.28 (+) 1.30
5.2.1.2 TGA. The TGA of PCN samples helped to determine sample
composition and thermal stability. This information led to the quantification of 93A
infused and the determination of the effect of scCO2 on the polymer.
5.2.1.2.1 LLDPE. Pure LLDPE and processed LLDPE/93A samples underwent
TGA to determine their thermal stability and the resultant curves are displayed in Figure
5.14. The onset temperature of the main decomposition for pure and processed samples
varies between 455°C and 460°C (Table 5.8). Decomposition ends in the range of 488°C
to 493°C, while weight loss is between 98.8 and 99.4%. In comparing the amount of
residue remaining after polymer decomposition, processed samples left a residue from
0.61 to 0.82 wt% while pure LLDPE left a higher residue of 1.19 wt%. Residual weights
for individual processing conditions are displayed in Figure 5.15. As all LLDPE/93A
sample residual weights were between 30 to 50% lower than the residual weight for pure
LLDPE, processing the samples in scCO2 appears to alter the polymer in such a way that
increases the degree of decomposition. An investigation by Shieh et al.32 exhibited this
phenomenon to a larger extent after processing polyethylene terephthalate (PET) in a
compressed CO2 environment. Polymer weight that was not accounted for as degraded

66
Figure 5.14. TGA of pure LLDPE and LLDPE processed with 93A in scCO2
Table 5.8. Main decomposition for pure LLDPE and processed LLDPE/93A samples
Sample Start T (°C)
Finish T (°C)
Weight Loss (%)
LLDPE 459.9 487.7 98.8
− − 457.9 491.9 99.3
− + 459.5 492.5 99.4
+ − 457.8 490.1 99.1
+ + 454.7 488.5 99.3

67
Figure 5.15. Residual weight of pure LLDPE and LLDPE processed with 93A in scCO2
polymer or residue was attributed to water evaporation. Pure LLDPE contained no water
whereas the processed samples contained between 0.01 and 0.08 wt% water, suggesting
minor infusion of the hydrophilic clay.
The quantity of clay within the polymer was determined from the residual weight
obtained by TGA. The quantity of clay in a PCN has been estimated to be equivalent to
its residual weight after TGA,45 assuming near complete degradation of the polymer with
only clay remaining. Complete polymer degradation did not occur for pure LLDPE and
LLDPE-g-MA, which both left a residual weight of 1.19 wt%. Since the quantity of clay
within the polymer is expected to be small for the samples, i.e., around 1 wt% 93A and
below, applying the above assumption of equivalence to the residual weight would
introduce more than 100% error to the calculation. Additionally after TGA, only 76 wt%

68
of 93A is anticipated to remain as its residual weight due to the degradation of its organic
modification.7 In order to increase the accuracy when calculating the quantity of 93A in
samples, the residual weight left by the pure polymer and the 93A were adjusted for by
applying the equation
(5)
where RS and RP are the residual weight (wt%) left by the sample and the pure polymer
(RP = 1.19 wt%), respectively. For LLDPE samples, the residual weights are lower than
that of the pure polymer (Figure 5.16), resulting in below zero clay infusion quantities.
Since such a scenario is not possible, it is proposed that no 93A was infused.
5.2.1.2.2 LLDPE-g-MA. From TGA curves for pure LLDPE-g-MA and
processed LLDPE-g-MA/93A samples (Figure 5.17), it was observed that the samples
began to lose weight at about 147°C, which is associated with a loss of bound water.7
Similar to the above TGA curves for LLDPE samples, the main decomposition for
LLDPE-g-MA/93A starts at about 459°C and finishes at 492°C (Table 5.9). The residual
weight left by pure and processed samples is between 0.82 and 2.19 wt%, as displayed in
Figure 5.18. The higher residual weight of the LLDPE-g-MA samples as compared to
the LLDPE samples is attributed to a larger amount of 93A infused into the polymer
since both pure samples of LLDPE and LLDPE-g-MA left the same residual weight of
1.19 wt%. Weight loss from water and, to a much lesser extent, from degradation of the
organic modifier of 93A was determined to vary from 0.14 to 0.26 wt%. The degradation

69
Figure 5.16. Quantity of 93A infused into LLDPE estimated from TGA residual weight
Figure 5.17. TGA of pure LLDPE-g-MA and LLDPE-g-MA processed with 93A in
scCO2

70
Table 5.9. Main decomposition for pure LLDPE-g-MA and processed LLDPE-g-MA/93A samples
Sample Start T (°C)
Finish T (°C)
Weight Loss (%)
LLDPE-g-MA 459.0 493.4 98.6
− − 459.3 491.9 98.2
− + 461.5 495.0 98.9
+ − 457.5 489.7 98.2
+ + 458.5 489.9 97.7
Figure 5.18. Residual weight of pure LLDPE-g-MA and LLDPE-g-MA processed with 93A in scCO2
temperature of the organic modifier was undetectable as a result of the low weight of clay
infused, corresponding to an even lower (i.e., undetectable) organic modifier weight. As

71
compared to LLDPE samples, LLDPE-g-MA samples contain higher water content
mainly due to the polar nature of the maleic anhydride interacting favorably with the
polar water molecule.
Applying the same methodology as that used for LLDPE/93A samples to LLDPE-
g-MA/93A samples, the residual weight of sample (− +) is below that of pure LLDPE-g-
MA, suggesting that no clay infusion occurred. In order of increasing residual weight,
samples (− −), (+ −) and (+ +) have residual weights above that of pure LLDPE-g-MA,
indicating that 93A was infused into the polymer. Using Equation (5), samples (− −), (+
−) and (+ +) contain 0.43, 0.66 and 1.34 wt% 93A (Figure 5.19), respectively.
Figure 5.19. Quantity of 93A infused into LLDPE-g-MA estimated from TGA residual weight (not to scale)

72
5.2.1.3 FTIR. Samples of LLDPE/93A and LLDPE-g-MA/93A nanocomposites
were analyzed with FTIR spectrometry. First, pellets were cleaned of residual clay on
their surface by using a soft brush followed by wiping with a paper towel to ensure the
only clay detected was infused clay. The clay infused from the outer polymer surface
inward. Since clay infusion was assumed to be non-uniform throughout the pellets, the
polymer/clay samples were melted, mixed manually, and then pressed into films for FTIR
analysis. For the melt mixing, the pellets were placed on a metal plate on the heated film
press platen. Once the pellets were melted, the molten polymer was mixed with a metal
spatula to achieve a more uniform dispersion so an accurate bulk clay percentage in the
polymer could be obtained.
Spectra obtained from the FTIR analysis of calibration standards in conjunction
with the resultant calibration curve were used to determine the quantity of 93A infused
into the polymer. To accomplish this, the following technique adapted from Clark et al.52
was employed for calculating the weight percentage from the absorbance spectra. The
absorbance for small concentrations of IR-absorbing species is approximated by the
Beer-Lambert law:
(6)
where A, IO, IT, Ki, d, and Ci are the absorbance, intensity of the incident IR beam,
intensity of the transmitted IR beam, absorbance coefficient, absorbing layer thickness,
and absorbing species concentration, respectively. In this technique, an absorbance
equation with contributions from the clay and polymer was combined with an absorbance

73
equation with only a polymer contribution. The Beer-Lambert law used to convey the
absorbance equation for a nanocomposite of polymer (LLDPE or LLDPE-g-MA) and
93A was
(7)
where C93A and CPolymer are the concentrations of 93A and the polymer (either LLDPE or
LLDPE-g-MA), respectively. The absorption of the polymer only was represented as
(8)
To remove the absorbing layer thickness from the calculation and separate the polymer
absorbance contribution from the clay absorbance contribution, a peak that had an
absorbance contribution from both the polymer and 93A was divided by a peak that only
had an absorbance due to the polymer. This resulted in the linear equation
(9)
The absorption peak attributable to clay within the polymer was found at 522 cm-1 on the
spectra7 and is shown in Figure 5.20. The absorption peak solely dedicated to the
polymer (either LLDPE or LLDPE-g-MA) was found at 2019 cm-1 on all spectra and is
displayed in Figure 5.21. The absorbance for each peak was determined by integration of
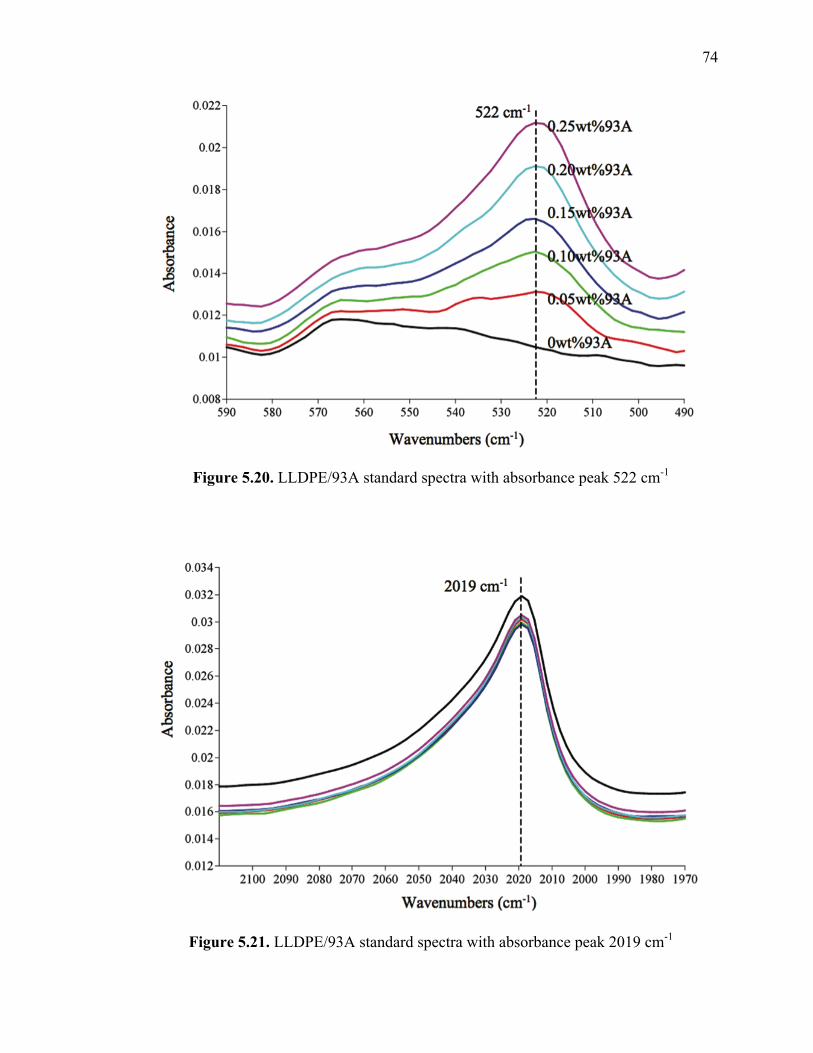
74
Figure 5.20. LLDPE/93A standard spectra with absorbance peak 522 cm-1
Figure 5.21. LLDPE/93A standard spectra with absorbance peak 2019 cm-1

75
the area under the peak. Using the linear absorbance Equation (9) and the spectra
obtained from the polymer/clay standards, calibration curves were regressed, that are
shown, along with their corresponding squares of the Pearson autocorrelation coefficient,
in Figures 5.22 and 5.23. Upon analysis, the absorbance ratios from the sample spectra
were used with the calibration curves to calculate the weight percentage of 93A infused
into the polymer samples. Two calibration curves were used, one for samples with clay
percentages ranging from 0 to 0.25 wt% (Figure 5.22) and another for samples with clay
percentages above 0.25 wt% (Figure 5.23). The larger range calibration curve used for
clay amounts greater than 0.25 wt% contained a standard error of 6.3%, whereas the
standard error was 2.8% for the smaller range calibration curve for 0−0.25 wt% clay.
Figure 5.22. Calibration curve for LLDPE/93A nanocomposites with 0 to 0.25 wt% 93A loadings

76
Figure 5.23. Calibration curve for LLDPE/93A nanocomposites with greater than 0.25 wt% 93A loadings
This method is applicable to different types of natural and modified clay because
all clays should possess an absorption peak identifiable by FTIR analysis that will
increase with clay concentration. Careful choice of the absorption peaks (for either
polymer or clay) is important, as a peak can be overlapped by other peaks or can contain
signal noise that could result in miscalculation of the peak absorbance and, thus,
concentration. In addition, if the absorption peak chosen is indicative of the clay and not
its modification, clay modifier degradation due to processing should not affect the results.
However, polymer degradation could affect the results if the chosen absorption peak
attributed solely to the polymer is altered by degradation. For this work, no degradation
was expected because the processing conditions were below the degradation temperatures
of the materials.

77
5.2.1.3.1 LLDPE. Nanocomposites of LLDPE/93A showed little to no clay
infusion, as determined by FTIR analysis. The maximum amount of clay infusion into
LLDPE was 0.16 wt%, and the minimum was 0 wt%. As displayed in Table 5.10, the
lowest average clay infusion is found in the high-pressure and low-temperature run,
whereas the highest average clay infusion seemed to have occurred in a low-pressure and
low-temperature processing environment.
Table 5.10. Average weight percentage and standard deviation of 93A in LLDPE
Sample Average (wt%)
Standard Deviation
(wt%) − − 0.08 0.04
− + 0.04 0.06
+ − 0.05 0.04
+ + 0.07 0.03
5.2.1.3.2 LLDPE-g-MA. In terms of maximum clay infusion determined by
FTIR analysis, nearly eight times more clay was infused into LLDPE-g-MA in
comparison to pristine LLDPE. Clay infusion into LLDPE-g-MA reached a maximum at
1.27 wt% and a minimum at 0.04 wt%. The lowest average clay infusion into LLDPE-g-
MA was 0.07 wt% and occurred in a high-pressure and low-temperature run, as exhibited
in Table 5.11.
5.2.1.3.3 Uniform dispersion analysis. Although the aim of mixing was uniform
clay dispersion, it was not achieved in most cases, as evidenced visually by white specs

78
Table 5.11. Average weight percentage and standard deviation of 93A in LLDPE-g-MA
Sample Average (wt%)
Standard Deviation
(wt%) − − 0.48 0.04
− + 0.07 0.02
+ − 0.73 0.20
+ + 0.83 0.24
in the film and analytically by the large standard deviation present throughout a single
sample. This may be due to polymer pellets within the same processing environment
being infused with different amounts of clay depending on their location in the reactor.
To some extent, the large standard deviations in clay percentages were the cause of
defects in the film samples, which resulted in oscillations or slight shifts in the spectra.
The film defects, although minor, may have come from surface imperfections, i.e.,
scratches and divots, in the brass plates that were transferred to the film during its
preparation. Furthermore, improvements in the preparation of the polymer/clay standards
and samples are expected to reduce the standard error contained within the calibration
curves and reduce the standard deviation within the samples, respectively.
5.2.1.4 SEM. Samples of LLDPE and LLDPE-g-MA processed with 93A in
scCO2 were cross-sectioned and then viewed via a SEM.
5.2.1.4.1 LLDPE. No clay particles were observed within the LLDPE/93A
samples due to the almost nonexistent amount of clay within the samples.
5.2.1.4.2 LLDPE-g-MA. Clay particles were observed within all LLDPE-g-
MA/93A samples except for sample (− +) as a result of its almost nonexistent clay

79
loading. For this reason, values concerning clay particles are reported on only for
LLDPE-g-MA/93A samples (− −), (+ −) and (+ +). Clay particles within the samples
were measured in two dimensions, consisting of a major and a minor dimension, as
shown in Figure 5.24. The size of clay particles infused into LLDPE-g-MA samples
ranged from 0.9 µm in the smallest dimension to 52.4 µm in the largest dimension. Clay
particles were observed to predominantly exist in agglomerated configurations within the
polymer matrix. In Figure 5.25, some delamination appears to have occurred, which
could be due to the scCO2 processing or due to the fracturing of the sample. In addition
to the size dimensions, the location of the clay particle relative to the edge of the polymer
cross-section was recorded to ascertain its depth of infusion. As the radius of the
LLDPE-g-MA polymer cross-section is approximately 1500 µm, the edge, interior and
Figure 5.24. SEM of clay particle displaying its measurement dimensions

80
Figure 5.25. SEM of clay particle exhibiting delamination
center regions of the polymer cross-section are, respectively, defined as 0-499 µm, 500-
999 µm and 1000+ µm from the edge of the cross-section. The infusion depth of 93A is
significant, as it seems the 93A was successful in reaching the center region of the
polymer for samples (− −), (+ −) and (+ +). However, clay particles were more readily
observed near the edge region of the polymer, which could indicate a higher
concentration of particles or larger particles in this region. The location, depth of
infusion and size dimensions of all observed clay particles can be found in the Appendix
in Tables A.5 through A.7.
5.2.2. Discussion. Using the above analyses, the effect of scCO2 on the polymers,
the quantity of 93A infused into the polymers and, from a visual inspection, the 93A size
distribution and changes in the appearance of samples were determined.

81
5.2.2.1 Effect of scCO2 on the polymer. Processing in scCO2 can affect
polymers by increasing their crystallinity or their thermal stability. As CO2 dissolves and
plasticizes the amorphous regions of the polymer, the mobility of the polymer chains is
enhanced, which can induce them to adopt a more crystalline structure. Thermal stability
of a polymer can be increased after processing with CO2 due to the extraction of low
molecular weight compounds from the polymer such as monomers, oligomers or
additives.
5.2.2.1.1 DSC: crystallinity. The crystallinity of LLDPE and LLDPE-g-MA
samples was calculated from DSC analysis. It was observed that the crystallinity did not
significantly change due to scCO2 processing (heating 1) or as a result of the presence of
93A in the polymer (heating 2).
Although there was not a significant change in crystallinity, some trends were
observed that could be significant. For LLDPE, scCO2-processing conditions that
employed higher temperatures resulted in samples with higher crystallinities (Table 5.12).
At higher temperatures, polymer chains are more mobile as the result of a more molten
Table 5.12. Influence of scCO2-processing conditions on crystallinity (heating 1) for LLDPE/93A samples
Sample Crystallinity (%)
− + 34.10
− − 35.39
+ − 36.93
+ + 37.00

82
polymer and a higher CO2 diffusion rate that enable greater plasticization of the polymer.
This higher polymer chain mobility enhances their ability to adopt a more crystalline
structure. In comparison to temperature, pressure had a more significant effect on
crystallinity for LLDPE-g-MA samples, as higher pressure processing environments
yielded higher sample crystallinities (Table 5.13). Increased CO2 concentration from the
higher pressure could be enhancing plasticization of the polymer chains to enable
crystallization. Due to the increased compatibility of LLDPE-g-MA with CO2, pressure
had a more significant effect on LLDPE-g-MA, as compared to LLDPE, since it dictates
CO2 concentration in the polymer. The low compatibility of LLDPE with CO2 can also
explain the greater influence of temperature on its crystallinity as compared to pressure.
Temperature also had an effect on the crystallinity of LLDPE-g-MA as a higher
temperature resulted in a higher crystallinity at constant pressure conditions.
Table 5.13. Influence of scCO2-processing conditions on crystallinity (heating 1) for
LLDPE-g-MA/93A samples
Sample Crystallinity (%)
− − 48.23
+ − 48.53
− + 49.22
+ + 51.16
5.2.2.1.2 TGA: thermal stability. From the TGA curves displayed in Figures
5.14 and 5.17, it was observed that thermal stability during the main decomposition event

83
predominantly decreased for LLDPE and LLDPE-g-MA samples processed in scCO2 as
compared to their pure counterparts. Low-temperature processing conditions produced
the highest thermal stability for both polymers, which is proposed to be the result of a
reduction in the diffusion of CO2 and plasticization of the polymer that inhibits the
infusion of low molecular weight compounds. For both LLDPE and LLDPE-g-MA, an
increase in thermal stability occurred for sample (− +) in comparison to the pure polymer,
where the fluid density is the highest. Extraction ability of CO2 increases with higher
densities and these conditions could have enabled the extraction of low molecular weight
compounds from the polymers, enhancing the thermal stability. In contrast, processing
conditions employing a lower CO2 fluid density and a higher temperature are typically
better for infusion and could have introduced low molecular weight compounds into the
polymer to result in a reduced thermal stability. The surfactant of 93A is a low molecular
weight compound that could be degrading during the main PCN decomposition. This is
above its typical degradation temperature of ca. 270°C and could be the result of the high
level of interaction between the surfactant chain and the polymer matrix.18,45 In support
of this, the thermal stability of LLDPE-g-MA/93A samples decreased as the quantity of
93A infused increased, keeping in mind that the quantities of 93A infused into LLDPE-g-
MA/93A samples (+ −) and (+ +) can swap order due to their overlapping 93A infusion
values. Thus, as the quantity of 93A increases, the quantity of surfactant will also
increase, decreasing thermal stability. However, at a high enough concentration of 93A,
the clay is anticipated to increase the thermal stability of the PCN.45
5.2.2.2 Quantity of 93A infused. The quantity of 93A infused into samples was
determined by TGA and FTIR analysis, and a comparison between the methods was

84
conducted. In addition, the effect of processing conditions on the quantity of 93A infused
into samples was investigated.
5.2.2.2.1 TGA vs. FTIR: LLDPE. Samples involving the infusion of 93A into
LLDPE were determined by TGA and FTIR analysis to have little to no clay infusion.
The results from both methods are displayed in Figure 5.26. The results from TGA are
within the range of FTIR analysis for sample (− +), whereas samples (− −), (+ −) and (+
+) are below the FTIR range by 0.04, 0.01 and 0.04 wt%, respectively. The difference in
results could be due to the combination of the low quantity of clay in the samples and the
error associated with the TGA and FTIR analysis methods. An alternative reasoning for
the difference in results between the two methods is presented in the following section.
Figure 5.26. Comparison of the quantity of 93A infused into LLDPE as determined by TGA and FTIR analysis (standard deviation bars included)

85
5.2.2.2.2 TGA vs. FTIR: LLDPE-g-MA. Comparing 93A infusion results of
FTIR analysis to TGA for LLDPE-g-MA (Figure 5.27), the FTIR analysis exhibits the
same order of decreasing 93A quantity for samples (+ +), (+ −) and (− −) with sample (−
+) exhibiting a near zero 93A infusion amount. Sample (+ −) for TGA is within the
range of the average clay quantity attained from FTIR analysis, whereas samples (− −)
and (− +) are 0.01 and 0.05 wt% below the FTIR range, respectively. Sample (+ +) is
0.27 wt% above the average FTIR range, however it is only 0.07 wt% above this
sample’s maximum infusion quantity of 1.27 wt% 93A. The disparity between results
could be due to scCO2 altering the samples to influence polymer degradation during TGA
or due to a difference in sample preparation between the two methods. Namely, sampling
Figure 5.27. Comparison of the quantity of 93A infused into LLDPE-g-MA as determined by TGA and FTIR analysis (standard deviation bars included)

86
for TGA involves only one polymer pellet to contribute to clay infusion whereas FTIR
analysis involves many melt-mixed polymer pellets to contribute to an average clay
infusion. The higher amount of 93A in LLDPE-g-MA as compared to LLDPE is
associated with the higher compatibility of the maleated polymer with both the modified
clay and the scCO2 medium.
5.2.2.2.3 TGA vs. FTIR: accuracy analysis. Once a calibration curve has been
created, determination of the quantity of clay within the polymer by FTIR analysis is
quick, nondestructive and potentially more accurate than TGA. It is proposed that TGA
could be less accurate since scCO2 appears to alter the polymer, decreasing the TGA
residual weight in such a way that so far has been unaccountable by changes in
crystallinity (DSC analysis) or thermal stability (TGA). This unaccountable change
resulted in the estimation of all LLDPE/93A samples to contain zero weight percent 93A,
which is not strictly true as 93A was detected by XRD analysis. The presence of 93A in
LLDPE/93A samples was detected by FTIR analysis, in which the sample possessing the
lowest clay infusion quantity range (sample (− +)) corresponded to the lowest almost
nonexistent XRD peak (Figure 5.2). However, the difference between the results could
also be attributed to the difference in sample preparation or the error associated with the
two methods.
5.2.2.2.4 Effect of processing conditions: LLDPE. For LLDPE/93A samples
processed in scCO2, the processing conditions appearing to possess the least ability to
infuse 93A into LLDPE employed the combination of high pressure and low temperature,
which confirms that the almost nonexistent peak in the XRD plot (Figure 5.2) is from
little to no 93A present within the sample. However, the pressure and temperature effects

87
remain elusive as a result of the TGA zero 93A infusion amount and the FTIR analysis
sample standard deviations exhibiting the same order of magnitude as the average 93A
infusion amount (Table 5.26); this resulted in no difference between values and an
overlapping of values with the respective analytical methods.
5.2.2.2.5 Effect of processing conditions: LLDPE-g-MA. The effect of
processing conditions on the quantity of 93A infused into LLDPE-g-MA is the same for
TGA and FTIR analysis since both methods produced comparable results (Figure 5.27).
For LLDPE-g-MA/93A sample (− +), it is proposed that the high pressure reduced
mobility of carbon dioxide molecules and clay particles and that the low temperature led
to a lower diffusion rate and a harder polymer; this resulted in less clay moving to a
polymer interface that was too hard to permit adequate infusion. The near zero clay
infusion quantity confirms that the almost nonexistent peak seen in the XRD plot (Figure
5.11) is not from a near complete exfoliation or dispersion of the clay, but from little to
no clay existing in the polymer. High-pressure and high-temperature conditions
produced the largest clay infusion of 1.34 wt% from TGA and the largest average clay
infusion of 0.83 wt% from FTIR analysis. In actuality, these conditions could result in
the same amount of clay infused as the low-pressure and high-temperature run because
their standard deviations gave overlapping values during FTIR analysis. Dependent upon
the critical pressure, these infusion results could suggest that the reduced mobility from
high pressures was less significant at high temperatures when the fluid density was
decreased, the diffusion rate was increased, and the polymer was sufficiently softened to
promote infusion. In another scenario, the increased CO2 concentration from the high
pressure could have aided infusion by enhancing dissolution of LLDPE-g-MA as a result

88
of its compatibility with CO2. Furthermore, the larger clay infusion amount into LLDPE-
g-MA over that into pristine LLDPE was attributed to the greater compatibility of
LLDPE-g-MA with the nanoclay and CO2 offered by the MA modification.16,44–46
5.2.2.3 Visual inspection. A SEM was used to visually inspect a cross-section of
the samples in order to measure the size of infused clay particles. The results were used
to calculate the size distribution of clay particles within samples. Additionally, changes
in the appearance of samples due to scCO2 processing were observed.
5.2.2.3.1 LLDPE. The appearance of cross-sectioned LLDPE/93A samples
remained unaltered as the result of different processing conditions, which can be seen in
Figures 5.28 to 5.31.
Figure 5.28. SEM of LLDPE/93A sample (− −) surface

89
Figure 5.29. SEM of LLDPE/93A sample (− +) surface
Figure 5.30. SEM of LLDPE/93A sample (+ −) surface
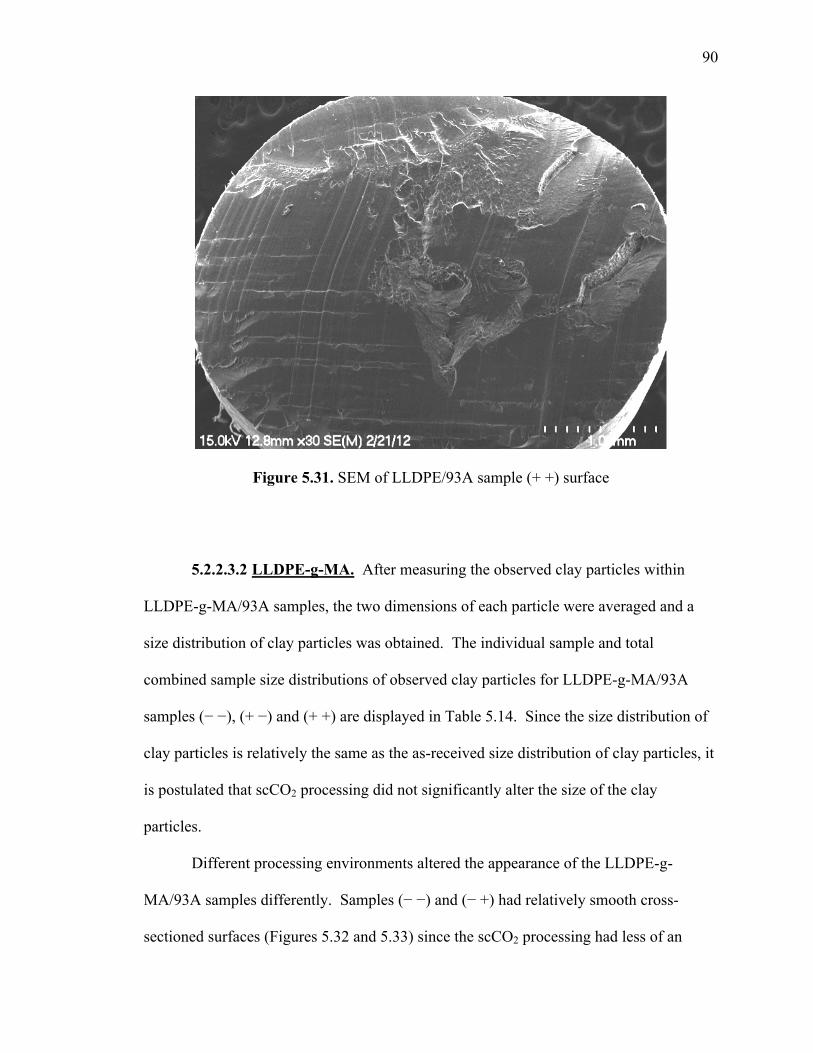
90
Figure 5.31. SEM of LLDPE/93A sample (+ +) surface
5.2.2.3.2 LLDPE-g-MA. After measuring the observed clay particles within
LLDPE-g-MA/93A samples, the two dimensions of each particle were averaged and a
size distribution of clay particles was obtained. The individual sample and total
combined sample size distributions of observed clay particles for LLDPE-g-MA/93A
samples (− −), (+ −) and (+ +) are displayed in Table 5.14. Since the size distribution of
clay particles is relatively the same as the as-received size distribution of clay particles, it
is postulated that scCO2 processing did not significantly alter the size of the clay
particles.
Different processing environments altered the appearance of the LLDPE-g-
MA/93A samples differently. Samples (− −) and (− +) had relatively smooth cross-
sectioned surfaces (Figures 5.32 and 5.33) since the scCO2 processing had less of an

91
Table 5.14. Size distribution of clay particles in as-received 93A and LLDPE-g-MA/93A samples
Clay Particle Size
Sample < 2 µm < 6 µm < 13 µm
As-Received 10% 50% 90%
− − 8% 50% 92%
+ − 19% 48% 86%
+ + 10% 50% 90%
Total 14% 49% 88%
effect on the polymer. Bubbles and fissures appeared in the middle portion of sample (+
−) (Figure 5.34) as the result of CO2 significantly infusing into the polymer. However, at
the higher pressure of sample (+ +), fissures can be observed in the surface without
bubbles (Figure 5.35). It is postulated that bubbles were unable to form due to the high
pressure compressing the polymer during processing.

92
Figure 5.32. SEM of LLDPE-g-MA/93A sample (− −) surface
Figure 5.33. SEM of LLDPE-g-MA/93A sample (− +) surface

93
Figure 5.34. SEM of LLDPE-g-MA/93A sample (+ −) surface
Figure 5.35. SEM of LLDPE-g-MA/93A sample (+ +) surface

94
6. CONCLUSIONS
Directed by XRD analysis, it was determined that a 1-hr processing time was
insufficient for 93A infusion into LLDPE, scCO2 has the capability to improve
intercalation/exfoliation behavior after 93A is within LLDPE and increasing the
compatibility of LLDPE affects the dispersion kinetics of 93A during scCO2 processing.
After a thorough analysis of the samples, it is proposed that intercalation by the polymer
into the clay gallery did not occur and increases in the gallery height were the result of
surfactant chain conformation changes. The largest conformation increases during scCO2
processing of 93A with LLDPE were brought about by high-temperature and low-
pressure conditions, improving the mobility of surfactant chains via enhancement of
plasticization and reduction of compression forces. Increased packing from surfactant
mobilization led to increases in the angle of tilt for surfactant chains, expanding the
gallery. Considering the chemical compatibility of the processing components, the
application of LLDPE-g-MA permitted the enhancement of intercalation/exfoliation
behavior at a lower temperature than that for LLDPE. The reduction in processing
temperature is the result of the increased affinity of the LLDPE-g-MA for CO2 and clay,
enabling greater polymer dissolution and polymer-clay interaction.
Further analysis on LLDPE and LLDPE-g-MA samples was conducted with DSC,
TGA, FTIR and SEM, which were used to determine the effect of processing conditions
on crystallinity, thermal stability, clay infusion quantity, clay particle size, clay
morphology, and depth of clay infusion. Varying the scCO2–processing conditions did
not significantly alter the crystallinity or thermal stability of the samples. Although, in
terms of crystallinity, some trends emerged that could be significant, such as higher

95
crystallinities were observed with LLDPE/93A samples processed at higher temperatures
and LLDPE-g-MA/93A samples processed at higher pressures. As compared to LLDPE,
the increased influence of pressure on crystallinity for LLDPE-g-MA is attributed to its
higher compatibility with CO2. At low-temperature and high-pressure conditions, where
the extraction potential was the highest and low molecular weight compounds could be
removed, it was observed that the thermal stability for both polymers was the highest in
comparison to the other conditions investigated while clay infusion quantity was
observed to be almost nonexistent. For LLDPE, little to no clay infusion was achieved
for all processing conditions investigated, which is postulated to be primarily due to the
incompatibility between LLDPE, 93A and CO2. However, the processing conditions did
influence the amount of 93A infused into LLDPE-g-MA. The largest 93A infusion
quantity was 1.34 wt%, which was observed for the high-temperature and high-pressure
processing conditions. This is the result of the high temperature increasing plasticization
of the polymer and diffusion rate of the CO2. In comparison to LLDPE, LLDPE-g-MA
had a greater 93A infusion quantity due to its maleic anhydride modification increasing
its compatibility with 93A and CO2. Particles of 93A were observed to predominantly
exist in agglomerated configurations and their size distribution was similar to that of as-
received 93A. Infusion of 93A particles was observed to have reached a depth within the
center region of the polymer. In addition, the high-temperature scCO2–processing
conditions were able to significantly alter the appearance of the interior of the LLDPE-g-
MA by introducing fissures and/or bubbles into the polymer.
In future work employing scCO2 processing to disperse 93A into LLDPE and
LLDPE-g-MA, experiments should be conducted with higher temperatures and lower
96
pressures to determine the optimum processing conditions for enhancing dispersion.
Investigation of temperatures up to the surfactant degradation temperature (~ 212°C7)
would reveal the effect of molten polymer as well as the temperature dependency of the
process. Experimenting with reduced pressures would lead to determination of the
critical pressure, whereby the hydraulic pressure effect is minimized and CO2
concentration is maximized, optimizing chain mobility to enhance dispersion.
Employing higher temperatures in conjunction with lower pressures would also elucidate
if further decreases in fluid density continue to increase gallery height, following the
same trend as the results of this work. In terms of 93A infusion quantity, investigation
into higher pressures with higher temperatures for LLDPE-g-MA samples would also be
beneficial since high-temperature and high-pressure conditions exhibited the greatest
infusion potential. After determining the optimal processing conditions, further
investigation into other processing parameters such as clay particle size should be
undertaken. By delaminating clay platelets prior to processing with polymer, it would be
possible to determine if the smaller platelet particles allow increased clay infusion
amount as compared to agglomerated stacked platelets. And if clay can be sufficiently
exfoliated in scCO2, it is proposed that polymer and clay could undergo processing in
separate but connected chambers. After the clay has been exfoliated and the polymer has
been dissolved by the CO2, the exfoliated clay could then be injected into the polymer
chamber to undergo infusion, potentially allowing the creation of exfoliated PCN’s with a
single working fluid.

97
APPENDIX
Figure A.1. SEM micrograph of 93A processed with LLDPE in scCO2 for 1 hr

98
XRD
The tables below include the Bragg angle 2θ that was used to calculate the d001-
spacing for LLDPE/93A and LLDPE-g-MA/93A samples with Bragg’s law from
Equation (1).
Table A.1. CO2 density vs. 2θ and d001-spacing of pellet LLDPE/93A samples from XRD analysis
Sample ρCO2 (g/cm3) 2θ d001-spacing (Å)
Pure 93A NA 3.415 25.9
+ − 0.200 3.145 2.81
− − 0.325 3.235 2.73
+ + 0.402 3.235 2.73
Table A.2. CO2 density vs. 2θ and d001-spacing of LLDPE-g-MA/93A samples from XRD analysis
Sample ρCO2 (g/cm3) 2θ d001-spacing (Å)
Pure 93A NA 3.625 24.4
+ − 0.200 3.415 25.9
− − 0.325 3.295 26.8
+ + 0.402 3.775 23.4
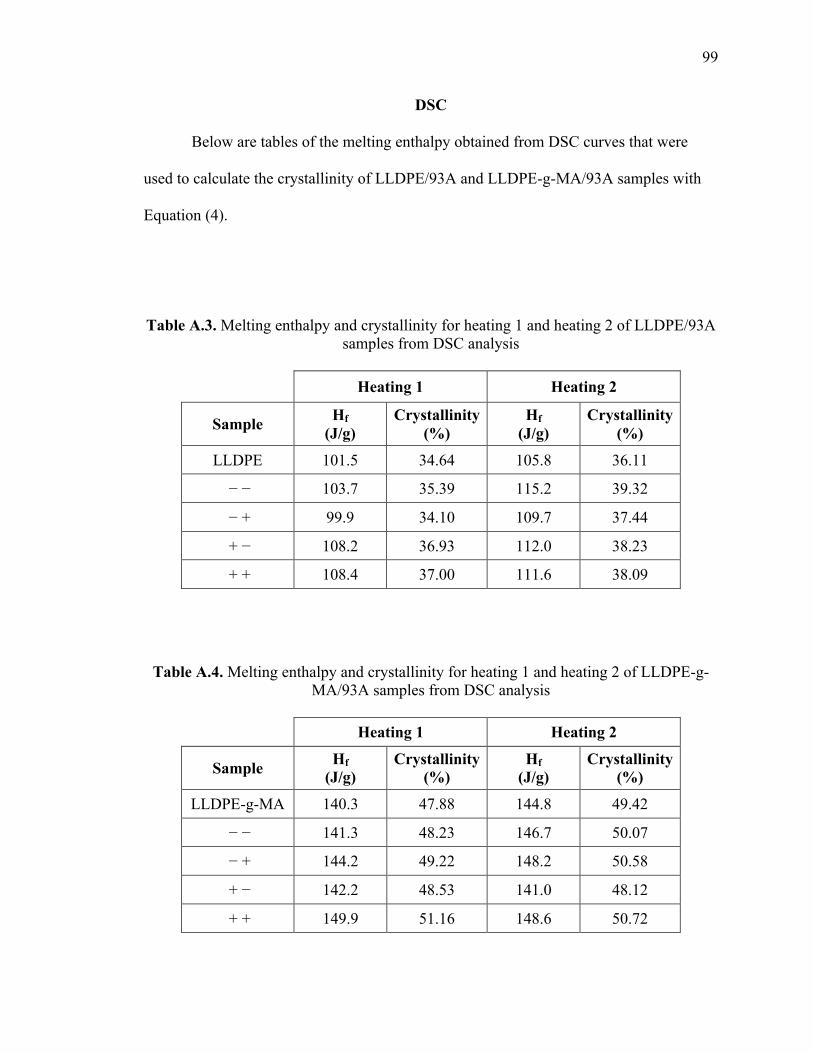
99
DSC
Below are tables of the melting enthalpy obtained from DSC curves that were
used to calculate the crystallinity of LLDPE/93A and LLDPE-g-MA/93A samples with
Equation (4).
Table A.3. Melting enthalpy and crystallinity for heating 1 and heating 2 of LLDPE/93A samples from DSC analysis
Heating 1 Heating 2
Sample Hf (J/g)
Crystallinity (%)
Hf (J/g)
Crystallinity (%)
LLDPE 101.5 34.64 105.8 36.11
− − 103.7 35.39 115.2 39.32
− + 99.9 34.10 109.7 37.44
+ − 108.2 36.93 112.0 38.23
+ + 108.4 37.00 111.6 38.09
Table A.4. Melting enthalpy and crystallinity for heating 1 and heating 2 of LLDPE-g-MA/93A samples from DSC analysis
Heating 1 Heating 2
Sample Hf (J/g)
Crystallinity (%)
Hf (J/g)
Crystallinity (%)
LLDPE-g-MA 140.3 47.88 144.8 49.42
− − 141.3 48.23 146.7 50.07
− + 144.2 49.22 148.2 50.58
+ − 142.2 48.53 141.0 48.12
+ + 149.9 51.16 148.6 50.72
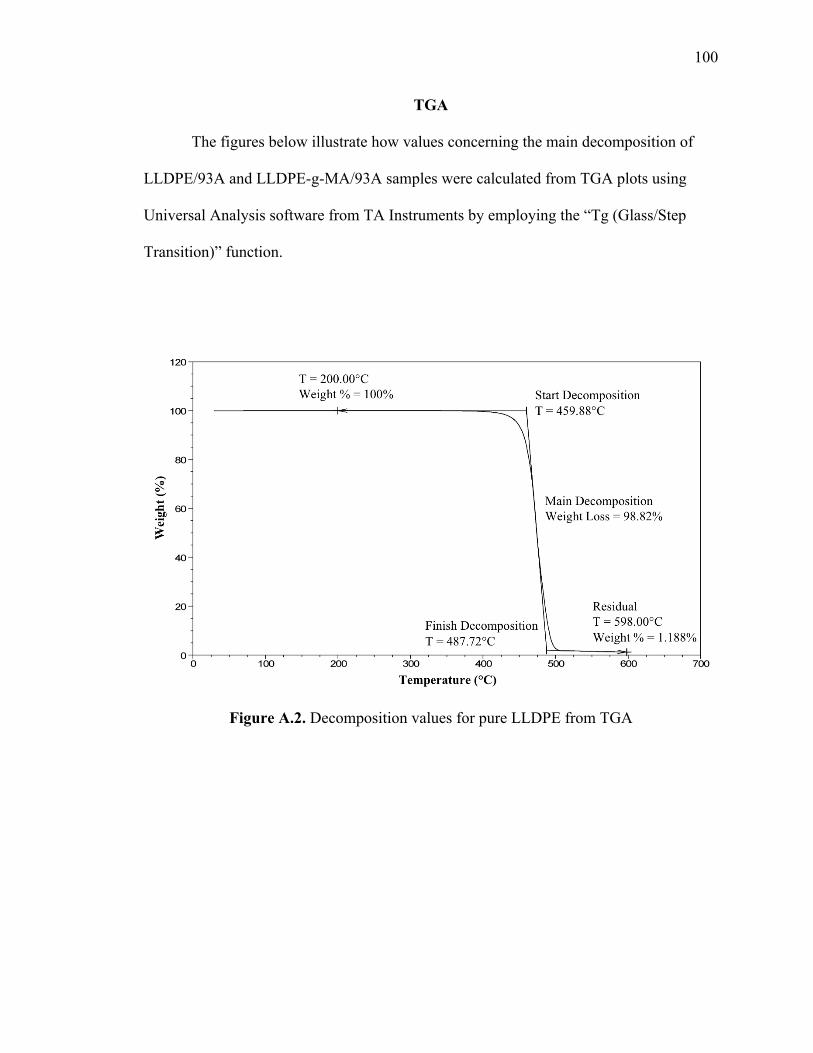
100
TGA
The figures below illustrate how values concerning the main decomposition of
LLDPE/93A and LLDPE-g-MA/93A samples were calculated from TGA plots using
Universal Analysis software from TA Instruments by employing the “Tg (Glass/Step
Transition)” function.
Figure A.2. Decomposition values for pure LLDPE from TGA

101
Figure A.3. Decomposition values for LLDPE/93A sample (− −) from TGA
Figure A.4. Decomposition values for LLDPE/93A sample (− +) from TGA

102
Figure A.5. Decomposition values for LLDPE/93A sample (+ −) from TGA
Figure A.6. Decomposition values for LLDPE/93A sample (+ +) from TGA

103
Figure A.7. Decomposition values for pure LLDPE-g-MA/93A from TGA
Figure A.8. Decomposition values for LLDPE-g-MA/93A sample (− −) from TGA

104
Figure A.9. Decomposition values for LLDPE-g-MA/93A sample (− +) from TGA
Figure A.10. Decomposition values for LLDPE-g-MA/93A sample (+ −) from TGA

105
Figure A.11. Decomposition values for LLDPE-g-MA/93A sample (+ +) from TGA
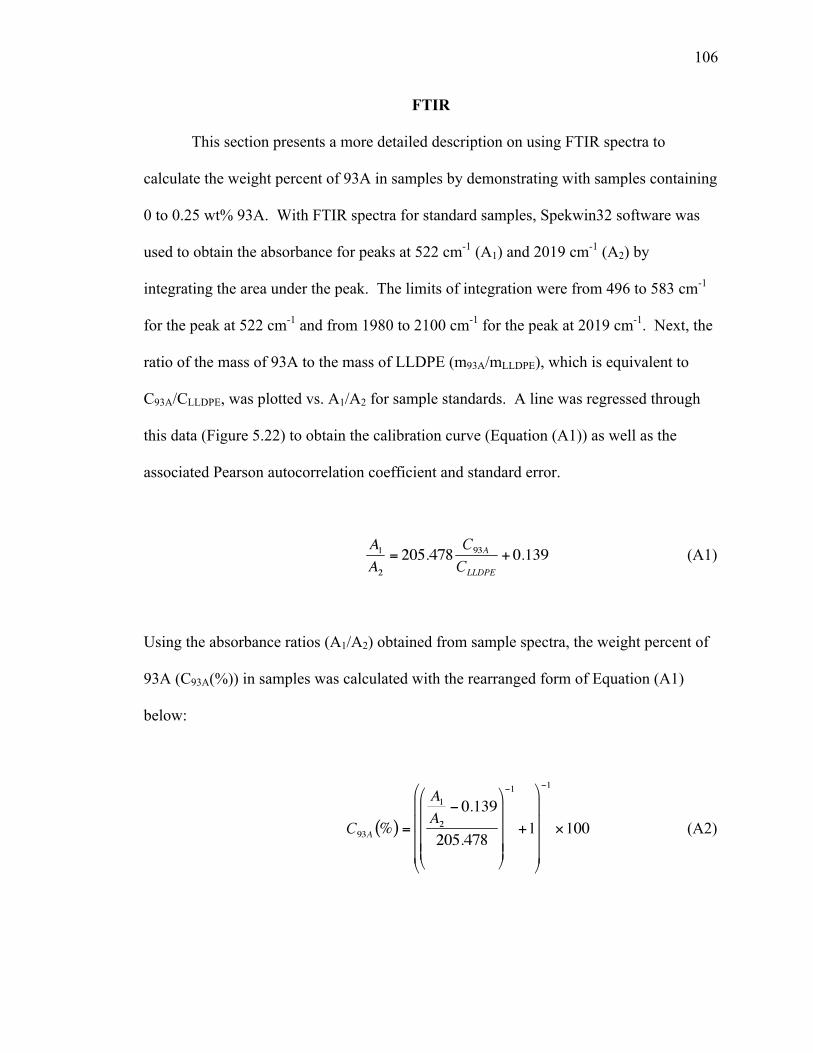
106
FTIR
This section presents a more detailed description on using FTIR spectra to
calculate the weight percent of 93A in samples by demonstrating with samples containing
0 to 0.25 wt% 93A. With FTIR spectra for standard samples, Spekwin32 software was
used to obtain the absorbance for peaks at 522 cm-1 (A1) and 2019 cm-1 (A2) by
integrating the area under the peak. The limits of integration were from 496 to 583 cm-1
for the peak at 522 cm-1 and from 1980 to 2100 cm-1 for the peak at 2019 cm-1. Next, the
ratio of the mass of 93A to the mass of LLDPE (m93A/mLLDPE), which is equivalent to
C93A/CLLDPE, was plotted vs. A1/A2 for sample standards. A line was regressed through
this data (Figure 5.22) to obtain the calibration curve (Equation (A1)) as well as the
associated Pearson autocorrelation coefficient and standard error.
(A1)
Using the absorbance ratios (A1/A2) obtained from sample spectra, the weight percent of
93A (C93A(%)) in samples was calculated with the rearranged form of Equation (A1)
below:
(A2)
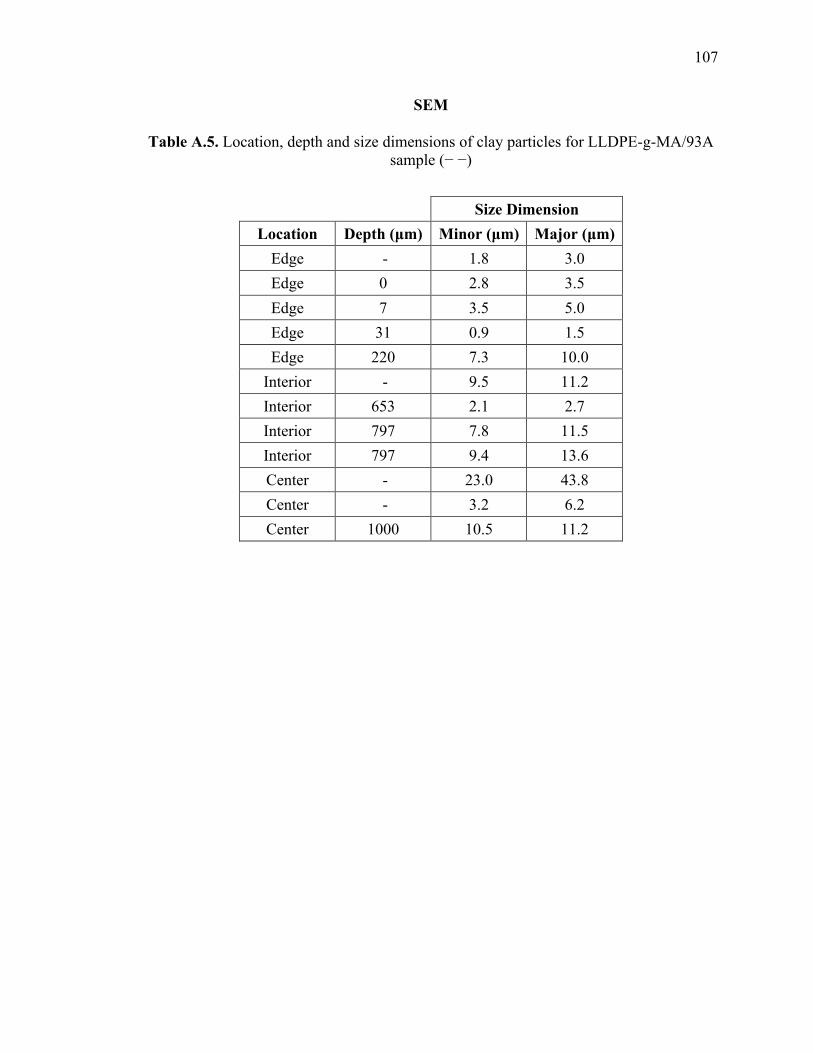
107
SEM
Table A.5. Location, depth and size dimensions of clay particles for LLDPE-g-MA/93A sample (− −)
Size Dimension Location Depth (µm) Minor (µm) Major (µm)
Edge - 1.8 3.0 Edge 0 2.8 3.5 Edge 7 3.5 5.0 Edge 31 0.9 1.5 Edge 220 7.3 10.0
Interior - 9.5 11.2 Interior 653 2.1 2.7 Interior 797 7.8 11.5 Interior 797 9.4 13.6 Center - 23.0 43.8 Center - 3.2 6.2 Center 1000 10.5 11.2
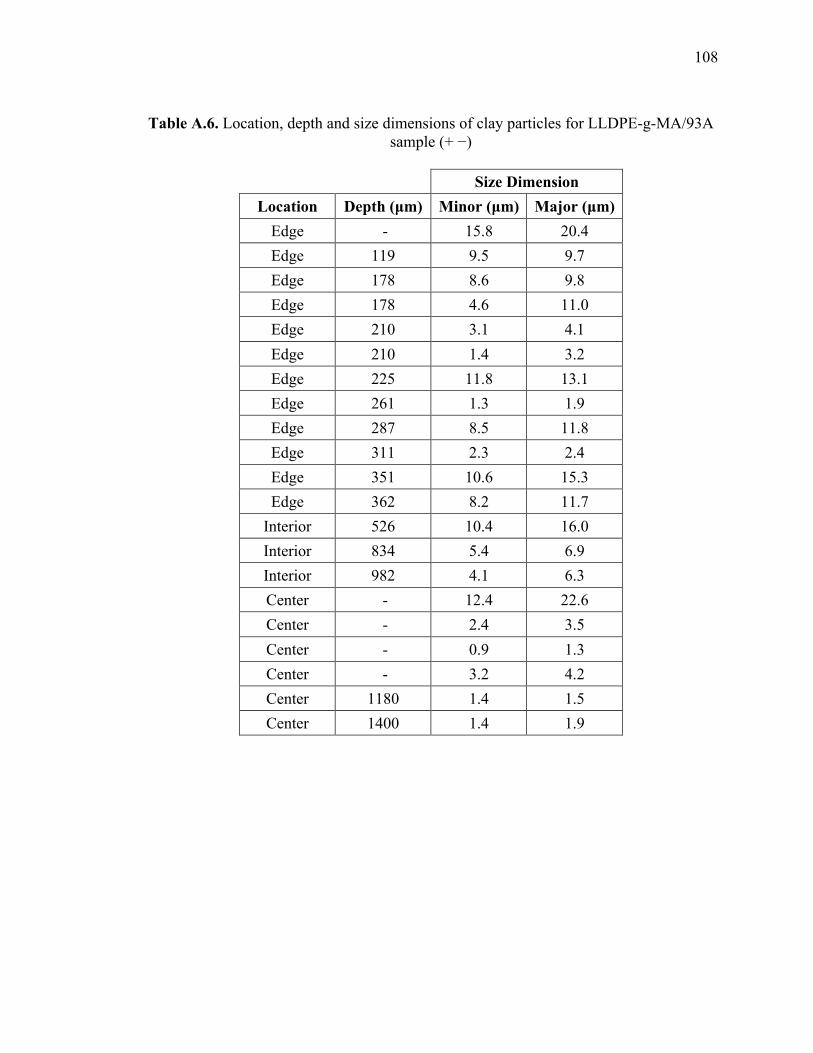
108
Table A.6. Location, depth and size dimensions of clay particles for LLDPE-g-MA/93A
sample (+ −)
Size Dimension Location Depth (µm) Minor (µm) Major (µm)
Edge - 15.8 20.4 Edge 119 9.5 9.7 Edge 178 8.6 9.8 Edge 178 4.6 11.0 Edge 210 3.1 4.1 Edge 210 1.4 3.2 Edge 225 11.8 13.1 Edge 261 1.3 1.9 Edge 287 8.5 11.8 Edge 311 2.3 2.4 Edge 351 10.6 15.3 Edge 362 8.2 11.7
Interior 526 10.4 16.0 Interior 834 5.4 6.9 Interior 982 4.1 6.3 Center - 12.4 22.6 Center - 2.4 3.5 Center - 0.9 1.3 Center - 3.2 4.2 Center 1180 1.4 1.5 Center 1400 1.4 1.9

109
Table A.7. Location, depth and size dimensions of clay particles for LLDPE-g-MA/93A
sample (+ +)
Size Dimension Location Depth (µm) Minor (µm) Major (µm)
Edge - 9.2 15.8 Edge 3 0.9 1.0 Edge 22 2.7 5.7
Interior 558 35.0 52.4 Interior 661 3.0 4.2 Interior 900 4.0 5.1 Interior 985 3.4 5.9 Center - 6.0 7.7 Center 1000 9.0 15.0 Center 1280 4.2 7.9

110
BIBLIOGRAPHY
1. Kojima, Y.; Usuki, A.; Kawasumi, M.; Okada, A.; Fukushima, Y.; Kurauchi, T.; Kamigaito, O. Mechanical Properties of Nylon 6-Clay Hybrid. Journal of Materials Research 1993, 8, 1185-1189.
2. Kawasumi, M. The Discovery of Polymer-Clay Hybrids. Journal of Polymer Science Part A: Polymer Chemistry 2004, 42, 819-824.
3. Utracki, L. A. Clay-Containing Polymeric Nanocomposites: Volume 1; Rapra
Technology Limited, UK, 2004.
4. Sandı́, G.; Carrado, K. A.; Joachin, H.; Lu, W.; Prakash, J. Polymer Nanocomposites for Lithium Battery Applications. Journal of Power Sources 2003, 119-121, 492-496.
5. Song, M.; Park, S.; Kim, Y.; Kim, K.; Min, S.; Rhee, H. Characterization of
Polymer-Layered Silicate Nanocomposite Membranes for Direct Methanol Fuel Cells. Electrochimica Acta 2004, 50, 639-643.
6. Ito, B. I.; Freitas, J. N. D.; Paoli, M.-A. D.; Nogueira, A. F. Application of a
Composite Polymer Electrolyte Based on Montmorillonite in Dye-Sensitized Solar Cells. The Journal of the Brazilian Chemical Society 2008, 19, 688-696.
7. Cervantes-Uc, J. M.; Cauich-Rodriguez, J. V.; Vazquez-Torres, H.; Garfias-
Mesias, L. F.; Paul, D. R. Thermal Degradation of Commercially Available Organoclays Studied by TGA–FTIR. Thermochimica Acta 2007, 457, 92-102.
8. Nalawade, S. P.; Picchioni, F.; Janssen, L. P. B. M. Supercritical Carbon Dioxide
as a Green Solvent for Processing Polymer Melts: Processing Aspects and Applications. Progress in Polymer Science 2006, 31, 19-43.
9. Berens, A. R.; Huvard, G. S.; Korsmeyer, R. W.; Kunig, F. W. Application of
Compressed Carbon Dioxide in the Incorporation of Additives into Polymers. Journal of Applied Polymer Science 1992, 46, 231-242.
10. Osswald, T. A.; Baur, E.; Brinkmann, S.; Oberbach, K.; Schmachtenberg, E.
International Plastics Handbook: The Resource for Plastics Engineers; 4th ed. Hanser Gardner Publications, Inc.: Cincinnati, 2006.
11. Callister, W. D. J. Thermoplastic and Thermosetting Polymers. In Materials
Science and Engineering: An Introduction; John Wiley & Sons, Inc.: New York, 2003; p. 467.

111
12. Fried, J. R. Polymer Science and Technology; Prentice Hall Professional Technical Reference: New Jersey, 2003.
13. Whiteley, K. S.; Heggs, T. G.; Koch, H.; Mawer, R. L.; Immel, W. Polyolefins;
Wiley-VCH Verlag GmbH & Co. KGaA: Weinheim, 2005.
14. Carey, F. A. Organic Chemistry; 4th ed. McGraw Hill: Boston, 2000.
15. Fang, Y.; Liu, B.; Terano, M. Various Activation Procedures of Phillips Catalyst for Ethylene Polymerization. Kinetics and Catalysis 2006, 47, 295-302.
16. Chen, B. Polymer–Clay Nanocomposites: An Overview with Emphasis on
Interaction Mechanisms. British Ceramic Transactions 2004, 103, 241-249.
17. Ngo, T.-D.; Wood-Adams, P. M.; Hoa, S. V.; Ton-That, M.-T. Modeling the Delamination Process During Shear Premixing of Nanoclay/Thermoset Polymer Nanocomposites. Journal of Applied Polymer Science 2011, 122, 561-572.
18. Peprnicek, T.; Kalendova, A.; Pavlova, E.; Simonik, J.; Duchet, J.; Gerard, J. F.
Poly(Vinyl Chloride)-Paste/Clay Nanocomposites: Investigation of Thermal and Morphological Characteristics. Polymer Degradation and Stability 2006, 91, 3322-3329.
19. Lyatskaya, Y.; Balazs, A. C. Modeling the Phase Behavior of Polymer−Clay
Composites. Macromolecules 1998, 31, 6676-6680.
20. Park, C. I.; Park, O. O.; Lim, J. G.; Kim, H. J. The Fabrication of Syndiotactic Polystyrene/Organophilic Clay Nanocomposites and Their Properties. Polymer 2001, 42, 7465–7475.
21. Bish, D. L.; Post, J. E. Modern Powder Diffraction; The Mineralogical Society of
America: Washington, D.C., 1989. 22. Wachtman, J. B.; Kalman, Z. H. Characterization of Materials; Butterworth-
Heinemann: Stoneham, 1993. 23. Introduction to Fourier Transform Infrared Spectrometry; Thermo Nicolet
Corporation: Madison, WI, 2001. 24. Factor, M. J.; Lee, S. Quantitative Analysis of Cloisite 93A Infused into Linear
Low-Density Polyethylene (LLDPE) and Maleated Linear Low-Density Polyethylene (LLDPE-g-MA) in a Supercritical Carbon Dioxide Medium. Journal of Applied Polymer Science 2012, 124, 3329-3333.
25. Egerton, R. F. Physical Principles of Electron Microscopy: An Introduction to
TEM, SEM, and AEM; Springer: New York, 2005.

112
26. Wang, W. Reverse Engineering: Technology of Reinvention; CRC Press: Boca Raton, 2011.
27. Kaur, H. Instrumental Methods of Chemical Analysis; Global Media: Meerut,
IND, 2010. 28. A Beginner’s Guide to Thermogravimetric Analysis (TGA); PerkinElmer, Inc.:
Waltham, MA, 2010. 29. Hohne, G. W. H.; Hemminger, W. F.; Flammersheim, H.-J. Differential Scanning
Calorimetry; 2nd ed. Springer: New York, 2003. 30. Lee, S.; Lanterman, H. B.; Sardesai, A.; Wenzel, J.; Marshall, B.; Yen, J.; Amin-
Sanayei, R.; Moucharik, M. Polymerization of Poly(vinylidene fluoride) in a Supercritical Fluid Medium. U.S. Patent No. 7,091,288, August 15, 2006.
31. Boyle, T. B.; Carroll, J. J. Study Determines Best Methods for Calculating Acid-
Gas Density. Oil & Gas Journal 2002, 100, 45-53. 32. Shieh, Y. T.; Su, J. H.; Manivannan, G.; Lee, P. H. C.; Sawan, S. P.; Spall, W. D.
Interaction of Supercritical Carbon Dioxide with Polymers. I. Crystalline Polymers. Journal of applied polymer science 1996, 59, 695–705.
33. Ganapathy, H.; Yuvaraj, H.; Hwang, H.; Kim, J.; Choi, B.; Gal, Y.; Lim, K. CO2-
Soluble Semiconducting Polymers Synthesized in Supercritical Carbon Dioxide. Synthetic Metals 2006, 156, 576-581.
34. Alessi, P.; Cortesi, A.; Kikic, I.; Vecchione, F. Plasticization of Polymers with
Supercritical Carbon Dioxide: Experimental Determination of Glass-Transition Temperatures. Journal of Applied Polymer Science 2003, 88, 2189-2193.
35. Shieh, Y. T.; Su, J. H.; Manivannan, G.; Lee, P. H. C.; Sawan, S. P.; Spall, W. D.
Interaction of Supercritical Carbon Dioxide with Polymers. II. Amorphous Polymers. Journal of Applied Polymer Science 1996, 59, 707-717.
36. Brantley, N. H.; Kazarian, S. G.; Eckert, C. a In situ FTIR measurement of carbon
dioxide sorption into poly(ethylene terephthalate) at elevated pressures. Journal of Applied Polymer Science 2000, 77, 764-775.
37. Areerat, S.; Funami, E.; Hayata, Y.; Nakagawa, D.; Ohshima, M. Measurement
and Prediction of Diffusion Coefficients of Supercritical CO2 in Molten Polymers. Polymer Engineering and Science 2004, 44, 1915-1924.
38. Duarte, A. R. C.; Martins, C.; Coimbra, P.; Gil, M. H. M.; de Sousa, H. C.;
Duarte, C. M. M. Sorption and Diffusion of Dense Carbon Dioxide in a Biocompatible Polymer. The Journal of Supercritical Fluids 2006, 38, 392-398.

113
39. Muth, O.; Hirth, T.; Vogel, H. Investigation of Sorption and Diffusion of Supercritical Carbon Dioxide into Poly(vinyl chloride). Journal of Supercritical Fluids 2001, 19, 299- 306.
40. Thompson, M. R.; Balogh, M. P.; Speer, R. L.; Fasulo, P. D.; Rodgers, W. R. In
Situ X-Ray Diffraction Studies of Alkyl Quaternary Ammonium Montmorillonite in a CO2 Environment. The Journal of Chemical Physics 2009, 130, 1-8.
41. Horsch, S.; Serhatkulu, G.; Gulari, E.; Kannan, R. M. Supercritical CO2
Dispersion of Nano-Clays and Clay/Polymer Nanocomposites. Polymer 2006, 47, 7485-7496.
42. Manitiu, M.; Bellair, R. J.; Horsch, S.; Gulari, E.; Kannan, R. M. Supercritical
Carbon Dioxide-Processed Dispersed Polystyrene−Clay Nanocomposites. Macromolecules 2008, 41, 8038-8046.
43. Manke, C. W.; Gulari, E.; Mielewski, D. F.; Lee, E. C. C. System and Method of
Delaminating a Layered Silicate Material by Supercritical Fluid Treatment. U.S. Patent No. 6,469,073 B1, October 22, 2002.
44. Wang, K. H.; Choi, M. H.; Koo, C. M.; Choi, Y. S.; Chung, I. J. Synthesis and Characterization of Maleated Polyethylene/Clay Nanocomposites. Polymer 2001, 42, 9819–9826.
45. Luyt, A. S.; Geethamma, V. G. Effect of Oxidized Paraffin Wax on the Thermal and Mechanical Properties of Linear Low-Density Polyethylene-Layered Silicate Nanocomposites. Polymer Testing 2007, 26, 461-470.
46. Ryu, S. H.; Chang, Y.-W. Factors Affecting the Dispersion of Montmorillonite in LLDPE Nanocomposite. Polymer Bulletin 2005, 55, 385-392.
47. McHugh, M. A.; Park, I.-H.; Reisinger, J. J.; Ren, Y.; Lodge, T. P.; Hillmyer, M. A. Solubility of CF2-Modified Polybutadiene and Polyisoprene in Supercritical Carbon Dioxide. Macromolecules 2002, 35, 4653-4657.
48. Morgan, A. B.; Gilman, J. W. Characterization of polymer-layered silicate (clay) nanocomposites by transmission electron microscopy and X-ray diffraction: A comparative study. Journal of Applied Polymer Science 2003, 87, 1329–1338.
49. Thompson, M. R.; Liu, J.; Krump, H.; Kostanski, L. K.; Fasulo, P. D.; Rodgers, W. R. Interaction of Supercritical CO2 with Alkyl-Ammonium Organoclays: Changes in Morphology. Journal of Colloid and Interface Science 2008, 324, 177-84.
114
50. Xi, Y.; Frost, R. L.; He, H. Modification of the Surfaces of Wyoming Montmorillonite by the Cationic Surfactants Alkyl Trimethyl, Dialkyl Dimethyl, and Trialkyl Methyl Ammonium Bromides. Journal of Colloid and Interface Science 2007, 305, 150-158.
51. Schubnell, M. Determination of Polymer Crystallinity with DSC Measurements.
UserCom 2001, 13, 12-13.
52. Clark, K. Synthesis of Maleated Poly(Vinylidene Fluoride) in Supercritical Carbon Dioxide Medium. Ph. D. Dissertation, University of Missouri – Columbia, Columbia, MO, 2004.

115
VITA
Matthew John Factor was born in St. Louis, Missouri. His undergraduate
education started in 2001 at the University of Missouri – Columbia and was completed in
2005 with the attainment of a B.S. in Chemical Engineering. In 2012, he obtained a
Ph.D. in Chemical Engineering from the Missouri University of Science and Technology.

116