Organizational Assessment of the Community Development ......2013/04/02 · Folsom (Sacramento)...
177
Management Consultants Folsom (Sacramento) 2250 East Bidwell Street, Suite 100 Folsom, CA 95630 (916) 458-5100 Fax: (916) 983-2090 Organizational Assessment of the Community Development Department for the April 2, 2013 City of San Luis Obispo, CA
Transcript of Organizational Assessment of the Community Development ......2013/04/02 · Folsom (Sacramento)...
Management Consultants Folsom (Sacramento)
2250 East Bidwell Street, Suite 100 Folsom, CA 95630
(916) 458-5100 Fax: (916) 983-2090
Organizational
Assessment of the
Community Development
Department for the
April 2, 2013
City of San Luis
Obispo, CA

This page was intentionally left blank

Table of Contents page i
TABLE OF CONTENTS
Section Page
Executive Summary and Strategic Action Plan ......................................................................... 1
Organization of this Report ......................................................................................... 2
Advice to the Reader: How Best to Handle Peer Review .......................................... 2
The Story and the Good News .................................................................................... 2
Five Important Contextual Themes ............................................................................. 3
Theme One: The Community Knows San Luis Obispo is a Very Special
Place ................................................................................................... 4
Theme Two: Push-Pull Exists Between Community Preservation and
Economic Development ..................................................................... 4
Theme Three: Push-Pull Exits Between Citizen Involvement and Efficient
Development Permit Review Processing ........................................... 5
Theme Four: The Organization is Respected, Dedicated, and Collegial, Yet
Professionally Isolated ....................................................................... 5
Theme Five: If You Can’t Be Predictable, Communicate! ............................ 6
Ten Strategic Recommendations ................................................................................. 6
Other Recommendations ............................................................................................. 7
Overview of Strategic Action Plan .............................................................................. 7
Section I—Introduction .............................................................................................................. 25
1.1 Study Scope and Objectives......................................................................... 25
1.2 Work Conducted .......................................................................................... 25
1.3 Citygate’s Approach and Assessment Factors ............................................. 27
1.4 The Key to Success: There’s a Role for Everyone ...................................... 28
1.4.1 Elected Officials............................................................................... 28
1.4.2 Customers and Stakeholders ............................................................ 29
1.4.3 City Manager’s Office ..................................................................... 29
1.4.4 Community Development Staff ....................................................... 29
1.4.5 Key Staff in Other City Program Areas: Public Works, Utilities,
Fire, Economic Development, and Information Technology .......... 30
Table of Contents page ii
Section II—City of San Luis Obispo’s Unique Situation ........................................................ 31
2.1 The Story and the Good News ..................................................................... 31
2.2 Five Important Contextual Themes ............................................................. 31
2.2.1 Theme One: The Community Knows San Luis Obispo is a Very
Special Place .................................................................................... 31
2.2.2 Theme Two: Push-Pull Exists Between Community Preservation and
Economic Development ................................................................... 32
2.2.3 Theme Three: Push-Pull Exits Between Citizen Involvement and
Efficient Development Permit Review Processing .......................... 32
2.2.4 Theme Four: The Organization is Respected, Dedicated, and
Collegial, Yet Professionally Isolated.............................................. 33
2.2.5 Theme Five: If You Can’t Be Predictable, Communicate! .............. 33
Section III—What Stakeholders Say About the Community Development Department .... 35
3.1 Elected Officials........................................................................................... 35
3.2 Applicants Large and Small ......................................................................... 35
3.2.1 Focus Group Meeting ...................................................................... 35
3.2.2 Customer Survey .............................................................................. 36
3.3 Interested Parties and Stakeholders ............................................................. 41
3.3.1 Focus Group Meeting ...................................................................... 41
3.4 Residents ...................................................................................................... 42
3.4.1 Resident Survey ............................................................................... 42
3.5 City’s Employees ......................................................................................... 44
3.5.1 Employee Survey ............................................................................. 44
3.6 Comparing Customer and Employee Survey Responses ............................. 52
3.6.1 Comparing Customer/Employee Development Review Results ..... 53
3.6.2 Comparing Customer/Employee Long-Range Planning Results ..... 54
3.6.3 Comparing Customer/Employee Building and Safety Results ........ 55
3.6.4 Comparing Customer/Employee Public Works Engineering
Results .............................................................................................. 56
Section IV—Department Organizational Structure ................................................................ 57
4.1 Administration ............................................................................................. 57
4.2 Long-Range Planning .................................................................................. 57

Table of Contents page iii
4.3 Development Review ................................................................................... 57
4.4 Building and Safety...................................................................................... 57
Section V—Ten Strategic Recommendations ........................................................................... 61
Strategic Recommendation #1: Develop an Award-Winning Community Outreach
Program ..................................................................................................................... 61
Strategic Recommendation #2: Establish Cycle-Time Standards: Synchronize;
Widely Publicize; Measure; and Report Out ............................................................. 62
Strategic Recommendation #3: Develop an Annual Work Program with the City
Council that is Dynamic and Interactive ................................................................... 64
Strategic Recommendation #4: Increase Efficiency, Effectiveness, and Credibility of
the Development Review Team ................................................................................ 66
Strategic Recommendation #5: Institute an Award-Winning “Unanticipated Service”
Program for Customers of All Types ........................................................................ 71
Strategic Recommendation #6: Increase Professional Training, Cross-Training, and
Co-Management to Promote Excellence and Organizational Nimbleness ............... 72
Strategic Recommendation #7: Establish a “Continual Improvement Group” ......... 75
Strategic Recommendation #8: Move the Public Works Engineering Development
Review Program into the Community Development Department to Align Service
Goals .......................................................................................................................... 76
Strategic Recommendation #9: Make Full Use of Technology to Enhance the
Customer Experience ................................................................................................ 81
Strategic Recommendation #10: Develop a Solution for the Cyclical Nature of
Development ............................................................................................................. 82
Section VI—Other Recommendations ...................................................................................... 87
6.1 Front Counter ............................................................................................... 87
6.2 Building and Safety...................................................................................... 88
6.3 Code Enforcement ....................................................................................... 90
6.4 Good of the Order ........................................................................................ 91
6.5 Policy Setters ............................................................................................... 91
Section VII—Review of Literature Sources ............................................................................. 93
7.1 Articles ......................................................................................................... 93
7.2 Books ........................................................................................................... 93
7.2.1 General Public Agency Management .............................................. 94

Table of Contents page iv
7.2.2 Management ..................................................................................... 94
7.2.3 Fiction .............................................................................................. 94
Appendices
Appendix A San Luis Obispo Customer Survey Analysis
Appendix B San Luis Obispo Employee Survey Analysis
Appendix C San Luis Obispo Resident Survey Analysis

Executive Summary and Strategic Action Plan page 1
EXECUTIVE SUMMARY AND STRATEGIC ACTION PLAN
This Executive Summary highlights the results of Citygate Associates, LLC’s organizational
assessment of the City of San Luis Obispo Community Development Department. Citygate
conducted the fieldwork for this study between November 2012 and February 2013.
The goal of the assessment was to provide an independent, objective, rigorously analytical third
party analysis of the policies, procedures, management and operations of the Community
Development Department, as it now exists, and to design a constructive, forward-looking, and
creative strategic action plan for improvement, as needed. As part of the study Citygate reviewed
and analyzed the current organizational structure and service delivery of the Community
Development Department as well as, to the extent necessary, the associated land development
services provided by other departments of the City.
A key purpose in the design of a general performance analysis, such as this engagement, is to
ensure that sufficient flexibility is provided to the consultant and the City to pursue issues that are
most rewarding, while functioning within an agreed-upon contract budget. To accomplish this
objective, the early analytical efforts were designed for the consultant to establish a familiarity with
the Community Development Department’s overall planning and development review permitting
processes, and the systems and procedures that support it, and to "scan" for issues that are material
to the study in its early stages. This was done to make sure that the study was outcome-driven. As
a result of these early analytical efforts and our discussions with the leadership team, Citygate was
able to focus its time and attention on the issues we identified in the Department and the actual
issues identified by the City’s employees, customers and stakeholders during our one-on-one
interviews, focus groups, and our on-line surveys.
During the course of this study Citygate received input from Community Development
Department customers of various types, applicants, business community stakeholders, non-
applicant neighborhood stakeholders, the City Council, City Manager, Department Heads,
division managers, supervisors, and frontline professional and support staff. This input helped
define the additional goals and priorities that we would consider in analyzing potential
alternatives for improvement.
We also had access to extensive public records and documents throughout the course of the
study.

Executive Summary and Strategic Action Plan page 2
ORGANIZATION OF THIS REPORT
Section I Introduction
Section II City of San Luis Obispo’s Unique Situation
Section III What Stakeholders Say About the Community Development
Department
Section IV Department Organizational Structure
Section V Ten Strategic Recommendations
Section VI Other Recommendations
Section VII Review of Literature Sources
ADVICE TO THE READER: HOW BEST TO HANDLE PEER REVIEW
From time to time throughout the report, we speak clearly and to the point without pulling any
punches. It is not our intent to offend anyone. However, we believe that our client is best served
by frankness. The characteristics of the City’s Community Development Department, and more
importantly the overall development review permitting process and the Department’s
relationships with its stakeholders, have evolved over an extended period of time as a result of
many factors. The process has both good and bad characteristics, none of which are the fault of
any one person. This also applies to non-Community Development departments and programs
that touch applications moving through the development review permitting process, such as
Public Works Engineering Development Review, Utilities, Transportation, and the Fire
Department.
To the extent improvements need to be made, it is due to process problems, as opposed to
personnel problems. The attitudes and philosophies of the Department’s employees are among
the best that we have encountered in our twenty years of conducting such studies. The
Community Development Department staff involved in the development review permitting
process is, more often than not, working very hard and in a conscientious manner to do what is in
the best interest of the City of San Luis Obispo. Their affection for the City and community is
deep and abiding. Many of them labor under difficult circumstances, due to time pressures, the
complex regulatory environment, and the high level of community involvement and
expectations.
THE STORY AND THE GOOD NEWS
San Luis Obispo’s situation with its Community Development Department is fundamentally
good. Relative to many of the agencies Citygate has assisted in recent years, the organization as a
whole is very dedicated, very talented, honest, professional, and competent.

Executive Summary and Strategic Action Plan page 3
The Department is in a good position to modernize, adapt to a shifting set of priorities, and to
make service delivery changes that will increase efficiency, effectiveness, and customer
satisfaction in all stakeholder categories.
The City Council and the community, as a whole, believe that the City has a well-intended,
talented, and dedicated Community Development staff.
The customers of the City’s Community Development Department are like a collage. In the
collage there are: permit applicants; residents and members of the general public; complainants;
property owners being investigated for code violations; and small businesses wishing to make
improvements to their facilities. In addition, there are the Architectural Review, Cultural
Heritage, and Planning Commission advisory bodies and other groups wishing to protect and
enhance the fabric of the community; homeowners wishing to make improvements and
neighbors wishing to protect their views and rights.
The City Council has been approached and heard stories about the difficulties of the City’s
development review permitting process. All of this presents a challenge for the Department and
its staff, but in Citygate’s view, it is a challenge that can be met.
The Department is in a good position to make positive organizational changes that will place it
among the top “best practice” agencies in California. These are the indicators:
1. To its credit, the Community Development Department has successfully instituted
many customer service best practices that are now in use. The Department can
build on these successes.
2. The City Council is likely to support departures from the status quo if they are
well thought out and implementable, even if done in phases over time.
3. The City is now in a better position to afford change; reserves are adequate to
handle one-time investments that might be necessary to improve efficiency and
effectiveness.
4. To his credit, the Community Development Director is already taking the
initiative to make needed changes that he has developed or we have suggested,
within his existing authority.
5. Several of the best practice recommendations made in this study already exist in
the Department; they simply need to be more formalized and applied more
vigorously.
FIVE IMPORTANT CONTEXTUAL THEMES
In order to best understand the Community Development Department’s current challenges and
opportunities it is important for the reader to consider the contextual themes that have been

Executive Summary and Strategic Action Plan page 4
identified during the course of our organizational assessment. These five contextual themes
underlie and affect everything the Department does day in and day out. They include the
following:
Theme One: The Community Knows San Luis Obispo is a Very Special Place
San Luis Obispo is arguably one of the most livable, unique, and beautiful cities in California. It
enjoys nearly perfect weather, a varied growing season, a university, and a lovely downtown. It
is a few minutes away from the beach, but not so close that it’s foggy all the time!
Everybody who lives here knows it is a special place. The early Spanish settlers knew it.
Families that have been in the County for generations know it. Students that go to college at Cal
Poly know it. Many stay. If they leave, they often come back. Newcomers know it. Residents in
the neighborhoods know it. Business owners know it.
Throughout our interviews we witnessed this strong sense of place. Preservation of the City as a
special place is a value shared by everyone we met.
Theme Two: Push-Pull Exists Between Community Preservation and Economic
Development
During our interviews we noted strong objections to urban sprawl. We often heard “we don’t
want to become like L.A.”
Many of the City’s stakeholders, activists and non-activists alike, value the architectural and
cultural heritage of San Luis Obispo. This value is embodied by the City Council establishing
robust Architectural Review and Cultural Heritage advisory bodies.
We also heard repeatedly that the City and its stakeholders have a desire to maintain and improve
the business environment. We often heard during our interviews that the City needs and wants
“head of household” jobs.
These two values—community preservation and economic development—exist in support of one
another and in opposition of one another, all at the same time. San Luis Obispo’s architectural
and cultural assets add great economic value to the business community. At the same time,
preservation of these assets, with all the rules, regulations, and additional costs, create a burden
on the business community and a burden on investors.
This push-pull makes for a difficult and challenging work environment for the Community
Development Department and its staff. It is easy to get “policy whiplash;” thus, it is in the
interest of City leadership and community stakeholders to recognize the push-pull, discuss it,
respect it, and support the Department as it wrestles with this challenge. In turn, staff’s obligation
is to be fair, objective, and balanced in all that they do, to recognize and embrace the diversity of
the Department’s customer base, and to deliver responsive, transparent service to all.

Executive Summary and Strategic Action Plan page 5
Theme Three: Push-Pull Exits Between Citizen Involvement and Efficient
Development Permit Review Processing
The City Council and the community together place a high value on citizen involvement. This is
not uncommon in university towns, particularly those that have distinct neighborhoods and deep
historical roots, as does San Luis Obispo.
The high level of citizen involvement leads to rich collaborations and high development
standards, all of which benefits the community. However, the high level of citizen input makes
for a development permit review process that can often be slow and complicated.
We heard vocal complaints from stakeholders that staff was too applicant-oriented and that staff
did not give enough deference to neighborhood groups, residents, and the advisory bodies during
the review process.
On the other hand, we heard repeatedly from the business and development community that the
development permit review process was overly complicated and too deferential to parties that
were not vested financially. However, we should note that there was a general consensus that
high development standards, albeit burdensome, protected their business investments over the
long term.
Theme Four: The Organization is Respected, Dedicated, and Collegial, Yet
Professionally Isolated
The community and its varied stakeholders generally respect the talents and dedication of the
individual staff members within the Community Development Department. Our survey data also
supports this conclusion. Staff’s dedication to the City was observed throughout our assessment.
The working environment is friendly, upbeat, positive, and collegial. It is a happy workforce,
overall.
Nonetheless, we also observed several indicators that the Department has fallen behind in certain
core areas of work as a result, we believe, of its geographical and professional isolation. This
phenomenon was visible in the areas of technology (website, smart-phones, social media,
customer surveying), outreach, cross-training, co-managing, and financial management.
We know that talent and professional commitment is present in the organization. It is critical to
the long-term success of the Department that it institutionalizes efforts to harvest “best practices”
from its respective professions. Thus, we have made recommendations that will move the
Department in this direction by establishing Professional Development Plans, ongoing training,
and a Continual Improvement Program. We believe that, if given the opportunity, staff will
thrive and stay ahead in their respective fields of professional endeavor.
Executive Summary and Strategic Action Plan page 6
Theme Five: If You Can’t Be Predictable, Communicate!
Everybody would be happy if the City could devise a development permit review processing
system that was fast, cheap, transparent, responsive to neighborhood input, AND predictable.
Improvements to the existing system can and should be made, as witnessed by our numerous
suggestions and recommendations.
Nonetheless, notwithstanding these efforts, the system will remain unpredictable to one degree or
another. This is due to the push-pull as we described and because the inherent nature of planning
and building affords great latitude in exercising judgment on projects. This intrinsic problem
presents risk and concerns for all stakeholders, regardless of their priorities.
The best remedy for this reality is for staff to communicate, and then communicate some more,
including with applicants and non-applicants alike. Advances in technology and social media
make this easier currently, and will continue to do so. Keeping the channels of collaboration and
mutual respect alive and well maintained is an ever-growing community expectation, and thus
needs to be a central organizational value of the Department.
TEN STRATEGIC RECOMMENDATIONS
In this section Citygate identifies and briefly discusses the Ten (10) Strategic Recommendations
formulated during the course of this study. All of these Strategic Recommendations are
important to understanding what needs to be done to continue reshaping the organization, to
build upon its current successes, and to make real organizational improvements that will be
visible and meaningful.
Put another way, if the City implements all of the other recommendations presented later in this
report but does not faithfully implement the following Ten Strategic Recommendations, we
would not expect much in the way of success.
These Ten Strategic Recommendations are as follows:
1. Develop an Award-Winning Community Outreach Program
2. Establish Cycle-Time Standards: Synchronize; Widely Publicize; Measure;
and Report Out
3. Develop an Annual Work Program with the City Council that is Dynamic
and Interactive
4. Increase Efficiency, Effectiveness, and Credibility of the Development
Review Team
5. Institute an Award-Winning “Unanticipated Service” Program for
Customers of All Types

Executive Summary and Strategic Action Plan page 7
6. Increase Professional Training, Cross-Training, and Co-Management to
Promote Excellence and Organizational Nimbleness
7. Establish a “Continual Improvement Group”
8. Move the Public Works Engineering Development Review Program into the
Community Development Department to Align Service Goals
9. Make Full Use of Technology to Enhance the Customer Experience
10. Develop a Solution for the Cyclical Nature of Development.
OTHER RECOMMENDATIONS
In addition to the Ten Strategic Recommendations listed above, this assessment includes more
recommendations to improve the efficiency and effectiveness of the Community Development
Department. These recommendations are wide reaching in their scope and are designed to
support the Strategic Recommendations within the realities of the contextual themes described
above. These additional recommendations address the following:
1. Front Counter Operations and Staffing
2. Building and Safety Improvements
3. Code Enforcement Improvements
4. Good of the Order: Department-Wide Improvements
5. Things Policy Setters Can Do to Improve the Department’s Effectiveness.
OVERVIEW OF STRATEGIC ACTION PLAN
A listing of our recommendations and a blueprint for their implementation are presented in the
Strategic Action Plan. This Plan contains:
1. The priority of each recommendation
2. The suggested implementation time frame
3. The anticipated benefits of each recommendation
4. The responsible parties.
The legend at the bottom of each page of the Strategic Action Plan defines the level of each
priority indicated by the letters “A” through “D.” It is important to note that priorities have been
established independent of the suggested timeframe. For example, a recommendation may have
the highest priority (indicated by the letter “A”) but may require an estimated six months to
implement. Conversely, a recommendation with the letter “C” priority, which indicates that the

Executive Summary and Strategic Action Plan page 8
recommendation is not critical but will improve operations, may have a two month timeframe,
since the estimated implementation effort would not require an extended period of time.
It is also important to note that an “A” priority, which indicates that the recommendation is
deemed “mandatory or critical,” should not be interpreted to mean that the recommendation is
“mandated” by a statute or regulation – it is simply an “urgent” recommendation of the highest
priority.
The timeframes indicated in the Strategic Action Plan do not necessarily mean the anticipated
completion dates for the implementation of each recommendation.

Strategic Action Plan—page 9
LEGEND
A Recommendation mandatory or critical
B Strongly recommended
C Not critical, but will improve operations
D Recommended, but additional study required
STRATEGIC ACTION PLAN
Recommendation
Priority
A/B/C/D
Time Frame for
Implementation Anticipated Benefits Responsible Party(ies)
1. DEVELOP AN AWARD-WINNING COMMUNITY OUTREACH PROGRAM
Recommendation 1.1:
Prepare and implement a proactive
Community Outreach and
Communication Plan.
A 1 year This would promote openness, transparency,
goodwill and trust; enhance public respect, value and
appreciation for the Department; increase the amount
of interaction between the staff and the community;
and build mutually beneficial working relationships.
Gather public input on the plan before adopting it.
Community Development
Director
2. ESTABLISH CYCLE-TIME STANDARDS: SYNCHRONIZE; WIDELY PUBLICIZE; MEASURE; AND REPORT OUT
Recommendation 2.1:
Establish, synchronize, and widely
publicize cycle-time standards for all
development permit types.
A 180 days This would establish processing performance goals
for the Department that truly matter to the customer;
it will also make sure that policy setters and advisory
boards are continually aware of these values.
Community Development
Director, Deputy
Community Development
Director
3. DEVELOP AN ANNUAL WORK PROGRAM WITH THE CITY COUNCIL THAT IS DYNAMIC AND INTERACTIVE
Recommendation 3.1:
Develop an Annual Work Program with
the City Council that is dynamic and
reviewed publicly with the Director at
least twice a year in a study session.
A 180 days This would establish priorities for the Department
that reflect the collective views and values of the
City Council; communicate the targeted objectives to
the employees and the community; and make it
possible to evaluate and hold the Department
accountable for its performance.
City Council, City Manager,
Community Development
Director

Strategic Action Plan—page 10
LEGEND
A Recommendation mandatory or critical
B Strongly recommended
C Not critical, but will improve operations
D Recommended, but additional study required
Recommendation
Priority
A/B/C/D
Time Frame for
Implementation Anticipated Benefits Responsible Party(ies)
Recommendation 3.2:
Consider the Annual Work Program
when adding or subtracting new
Department programs, initiatives, or
services.
A 180 days This would ensure that the Department remains
committed and focused on implementing the
objectives in the Annual Work Program while still
providing the opportunity to make mid-course
corrections or revisions based on a change in
conditions or the emergence of critical issues or
opportunities.
City Council, City Manager,
Community Development
Director
Recommendation 3.3:
Include in the Annual Work Program
measurable objectives, timelines, and
outcomes that are tied to the
Department’s annual budget.
A 1 year This would make it possible to systematically
measure, monitor and evaluate the productivity and
timeliness of the Department’s performance; link
specific outcomes to budgeted expenditures; and
promote Department accountability.
City Council, City Manager,
Community Development
Director
Recommendation 3.4:
Increase linkage between Employee
Performance Evaluation System and the
Department’s Annual Work program.
A 1 year This would link the employees’ formal performance
evaluation to the needs and priorities of the City and
the Department and would also promote
accountability.
Community Development
Director
4. INCREASE EFFICIENCY, EFFECTIVENESS, AND CREDIBILITY OF THE DEVELOPMENT REVIEW TEAM
Recommendation 4.1:
Establish and publish the criteria for
projects requiring Pre-Application
review.
A 1 year This would communicate the City’s regulatory
expectations; minimize confusion, surprises, and
unnecessary delays; and expedite the processing of
applications.
Deputy Community
Development Director
Recommendation 4.2:
Meet and coordinate staff’s issues and
concerns BEFORE pre-application
meetings with customers.
A 90 days This would allow staff to collaboratively work out
and resolve potential issues and concerns; coordinate
needs and responses; and expedite the review
process.
Deputy Community
Development Director

Strategic Action Plan—page 11
LEGEND
A Recommendation mandatory or critical
B Strongly recommended
C Not critical, but will improve operations
D Recommended, but additional study required
Recommendation
Priority
A/B/C/D
Time Frame for
Implementation Anticipated Benefits Responsible Party(ies)
Recommendation 4.3:
Open up the Pre-Application process by
offering early community review.
A 1 year This would promote early public awareness and
participation to minimize surprises for everyone;
give the applicant an opportunity to understand and
address the community’s concerns early in the
review process; and promote community building.
Deputy Community
Development Director
Recommendation 4.4:
Establish a formal DRT agenda.
A 1 year This would promote communication and
coordination between the various reviewing
departments; minimize confusion and conflicts
between departments; create a unified team
environment; and benefit the applicant by speeding
up the development review process.
Deputy Community
Development Director
Recommendation 4.5:
Utilize Determinate Processing
Agreements for high priority projects.
A 1 year This would improve timeliness of the permit review
process and increase customer satisfaction.
Deputy Community
Development Director
Recommendation 4.6:
Standardize Conditions of Approval to
promote internal consistency.
B 2 years This would promote staff consistency and uniformity
of reviews; increase staff productivity; reduce
processing times; and facilitate code enforcement.
Deputy Community
Development Director,
Supervising Civil Engineer
Recommendation 4.7:
Examine the practice of issuing Blue
Cards for projects that may not have
fully met Conditions of Approval.
B 180 days This would improve enforceability of Conditions of
Approval, especially neighborhood-sensitive issues.
Deputy Community
Development Director
Recommendation 4.8:
Improve coordination and consistency
of planners and engineers signing-off
on, and being accountable for, the
application of non-standard fees.
B 180 days This would improve enforceability of Conditions of
Approval, especially neighborhood-sensitive issues.
Deputy Community
Development Director/
Supervising Civil Engineer

Strategic Action Plan—page 12
LEGEND
A Recommendation mandatory or critical
B Strongly recommended
C Not critical, but will improve operations
D Recommended, but additional study required
Recommendation
Priority
A/B/C/D
Time Frame for
Implementation Anticipated Benefits Responsible Party(ies)
Recommendation 4.9:
Shorten the time it takes for an
applicant to get to the Cultural Heritage
Committee.
A 1 year This would reduce processing time while still
ensuring that the project is fully and appropriately
reviewed.
Deputy Community
Development Director
Recommendation 4.10:
Use the time between now and when
the EnerGov system is due to be
delivered to update, streamline, and
shorten development permit review
processing procedures.
A 1 year This would increase customer satisfaction and
increase the effectiveness of the electronic permit
tracking system when it goes online; this will
increase the effectiveness of the Development
Review Team.
Deputy Community
Development Director
5. INSTITUTE AN AWARD-WINNING “UNANTICIPATED SERVICE” PROGRAM FOR CUSTOMERS OF ALL TYPES
Recommendation 5.1:
Institute an “Unanticipated Service”
program.
A 180 days This would increase the awareness, respect and
appreciation of citizens and customers for the
Department’s employees; promote higher levels of
customer satisfaction with local government;
motivate employees to take personal responsibility
for developing personal relationships with their
customers; empower employees to take co-
responsibility for working with their customers to
resolve unexpected problems; and empower
customers to help themselves.
Community Development
Director, Deputy
Community Development
Director/Development
Review

Strategic Action Plan—page 13
LEGEND
A Recommendation mandatory or critical
B Strongly recommended
C Not critical, but will improve operations
D Recommended, but additional study required
Recommendation
Priority
A/B/C/D
Time Frame for
Implementation Anticipated Benefits Responsible Party(ies)
6. INCREASE PROFESSIONAL TRAINING, CROSS TRAINING, AND CO-MANAGEMENT TO PROMOTE EXCELLENCE AND
ORGANIZATIONAL NIMBLENESS
Recommendation 6.1:
Conduct a training needs assessment.
A 2 years This would help identify deficiencies and training
needs and opportunities for improving the
knowledge and capabilities of the Department’s
employees.
Community Development
Director, Supervising
Administrative Assistant
Recommendation 6.2:
Commit to and fund a professional
development plan for all employees.
A 2 years This would provide a customized training and
professional development program with each
employee that gives them a career pathway guide
identifying future professional growth
responsibilities and employment opportunities with
the City.
City Council, Community
Development Director,
Supervising Administrative
Assistant
Recommendation 6.3:
Develop Core Competencies Training
program for new planners.
A 2 years This would ensure that new planners have the skills
and knowledge that are uniquely required in San
Luis Obispo; it will equip planners to avoid having to
“sink or swim.”
Community Development
Director, Supervising
Administrative Assistant
Recommendation 6.4:
Provide continual training in the use of
all forms of modern graphics and
illustration.
B 1 year This would increase the ability of the employees to
communicate with the community, elected officials
and other employees in the City through the use of
traditional graphics and innovative communication
and information technology.
Community Development
Director, Supervising
Administrative Assistant
Recommendation 6.5:
Provide training for the best use of
PowerPoint presentations.
B 2 years This would improve the ability of staff to
communicate at public hearings and community
meetings.
Community Development
Director, Supervising
Administrative Assistant

Strategic Action Plan—page 14
LEGEND
A Recommendation mandatory or critical
B Strongly recommended
C Not critical, but will improve operations
D Recommended, but additional study required
Recommendation
Priority
A/B/C/D
Time Frame for
Implementation Anticipated Benefits Responsible Party(ies)
Recommendation 6.6:
Co-manage important projects by
assigning a lead planner and support
planner.
A 1 year This would promote team building, coordination and
cooperation; minimize silos; leverage the knowledge
and experience of employees in the Community
Development Department and in other departments,
agencies and organizations; and reduce finger
pointing and blame shifting.
Community Development
Director
Recommendation 6.7:
Integrate Current Planners into the
Long-Range Planning Work program.
B 1 year This would provide enhanced regulatory
enforcement when the current planners have a
working knowledge and familiarity with the planning
principles and concepts behind the regulations, and
further value is added when current planners share
their regulatory knowledge, experience and
perspectives with the planners developing the long-
range plans.
Community Development
Director, Deputy Director
Recommendation 6.8:
Establish a weekly training program for
all plan check, inspection, and code
enforcement personnel.
A 180 days This would improve morale, enhance uniformity and
educate staff to a higher level.
Chief Building Official
7. ESTABLISH A “CONTINUAL IMPROVEMENT GROUP”
Recommendation 7.1:
Establish a Continual Improvement
Group on the Development Review
Team.
A 1 year This would provide the opportunity to proactively
and continuously monitor, evaluate and improve all
regulatory processes and procedures with the intent
of simplifying and streamlining development
approvals while protecting the health, safety and
welfare of the community.
Deputy Community
Development Director

Strategic Action Plan—page 15
LEGEND
A Recommendation mandatory or critical
B Strongly recommended
C Not critical, but will improve operations
D Recommended, but additional study required
Recommendation
Priority
A/B/C/D
Time Frame for
Implementation Anticipated Benefits Responsible Party(ies)
8. MOVE THE PUBLIC WORKS ENGINEERING DEVELOPMENT REVIEW PROGRAM INTO THE COMMUNITY DEVELOPMENT DEPARTMENT
TO ALIGN SERVICE GOALS
Recommendation 8.1:
Effective January 1, 2014, move the
Public Works Engineering
Development Review Division into the
Community Development Department.
A January 1, 2014 This would increase customer service; improve
coordination between disciplines in the development
permit review process; align resources and skills
with customer needs; and build the Division such
that it can meet turnaround time expectations.
Community Development
Director, Public Works
Director, Public Works
Deputy Director
9. MAKE FULL USE OF TECHNOLOGY TO ENHANCE THE CUSTOMER EXPERIENCE
Recommendation 9.1:
Maximize the EnerGov system to
enhance customer experience—do not
just digitize and automate the City’s
existing processes and procedures.
A 1 year This would maximize the value and benefits of the
EnerGov system by streamlining the regulatory
review process; increase staff productivity; provide
applicants with the opportunity for reduced
processing cost via electronic submittals; create an
open and transparent online monitoring of the staff’s
evaluation and review process; reduce City costs by
using the Internet instead of paper and staff delivery
of printed material; and save staff time by making
information available on the Internet instead of
forcing people to call or visit the offices to obtain
information.
Community Development
Director
Recommendation 9.2:
Use technology (EnerGov) to promote
transparency in the regulatory process.
A 2 years This would create trust and build public appreciation,
respect and confidence in the City’s regulatory
processes.
Community Development
Director

Strategic Action Plan—page 16
LEGEND
A Recommendation mandatory or critical
B Strongly recommended
C Not critical, but will improve operations
D Recommended, but additional study required
Recommendation
Priority
A/B/C/D
Time Frame for
Implementation Anticipated Benefits Responsible Party(ies)
Recommendation 9.3:
Increase the amount of information and
self-help services provided online via
the Internet.
A 2 years This would reduce costs; increase convenience; save
time for applicants and citizens; and improve
customer satisfaction.
Community Development
Director
Recommendation 9.4:
Make use of social media to increase
public access and participation.
B 2 years This would help to improve the civic engagement
experience; promote higher levels of community
participation; and allow more effective two-way
communication to take place.
Community Development
Director
Recommendation 9.5:
Update the Department’s website home
page on a regularly scheduled basis.
A 2 years This would help improve communication with the
public and therefore reduce unnecessary
interruptions from the public requesting information
that can be found on the website.
Community Development
Director
Recommendation 9.6:
Create a webpage that allows the public
to view all properties that are ready for
development.
B 2 years This would provide convenience to the public and
development community and promote economic
development.
Community Development
Director
Recommendation 9.7:
Purchase and use smart phones,
computer-based mobile units, GPS
devices, and cameras for Building
Inspection and Code Enforcement
personnel.
A 1 year This would greatly improve the transfer of
information from the office to the field staff which
would improve efficiency. Also the need for
cameras would be eliminated if smart phones were
purchased.
Chief Building Official

Strategic Action Plan—page 17
LEGEND
A Recommendation mandatory or critical
B Strongly recommended
C Not critical, but will improve operations
D Recommended, but additional study required
Recommendation
Priority
A/B/C/D
Time Frame for
Implementation Anticipated Benefits Responsible Party(ies)
Recommendation 9.8:
Target accepting and tracking plans for
plan check electronically by January 1,
2015; target declining non-electronic
plans by January 1, 2016.
B January 1, 2016 This would eliminate the need to accept bulky paper
plans and physically deliver and pick them up from
each department.
Chief Building Official
Recommendation 9.9:
Target providing all staff plan check
comments on Building Plans
electronically, and make the comments
accessible to the public at the time they
are generated, by January 1, 2015.
B January 1, 2015 This would allow the public to access their plan
check comments (from all departments) directly
which would decrease the number of phone calls and
public counter contacts.
Chief Building Official
Recommendation 9.10:
Offer online permit issuance for small
projects (e.g., re-roofs, water heaters,
etc.); process via credit card or PayPal.
B January 1, 2015 This would reduce the number of front counter
contacts and allow staff to process certain permits
during slower periods.
Assistant Building Official
Recommendation 9.11:
Establish website-based inspection
request system for 24/7 accessibility.
A 1 year This would allow the public to request inspections
anytime which would decrease the number of phone
calls to City Hall and require the public to provide
accurate information in the “required fields” shown
on the inspection request screen.
Assistant Building Official
Recommendation 9.12:
Include Information Technology
support costs in the City’s fee program.
A January 1, 2016 All permit and plan check fees should reflect the
costs for I.T. support. This would help fund the
purchase and maintenance of all Building Division
technology.
Chief Building Official, I.T.
Manager
Strategic Action Plan—page 18
LEGEND
A Recommendation mandatory or critical
B Strongly recommended
C Not critical, but will improve operations
D Recommended, but additional study required
Recommendation
Priority
A/B/C/D
Time Frame for
Implementation Anticipated Benefits Responsible Party(ies)
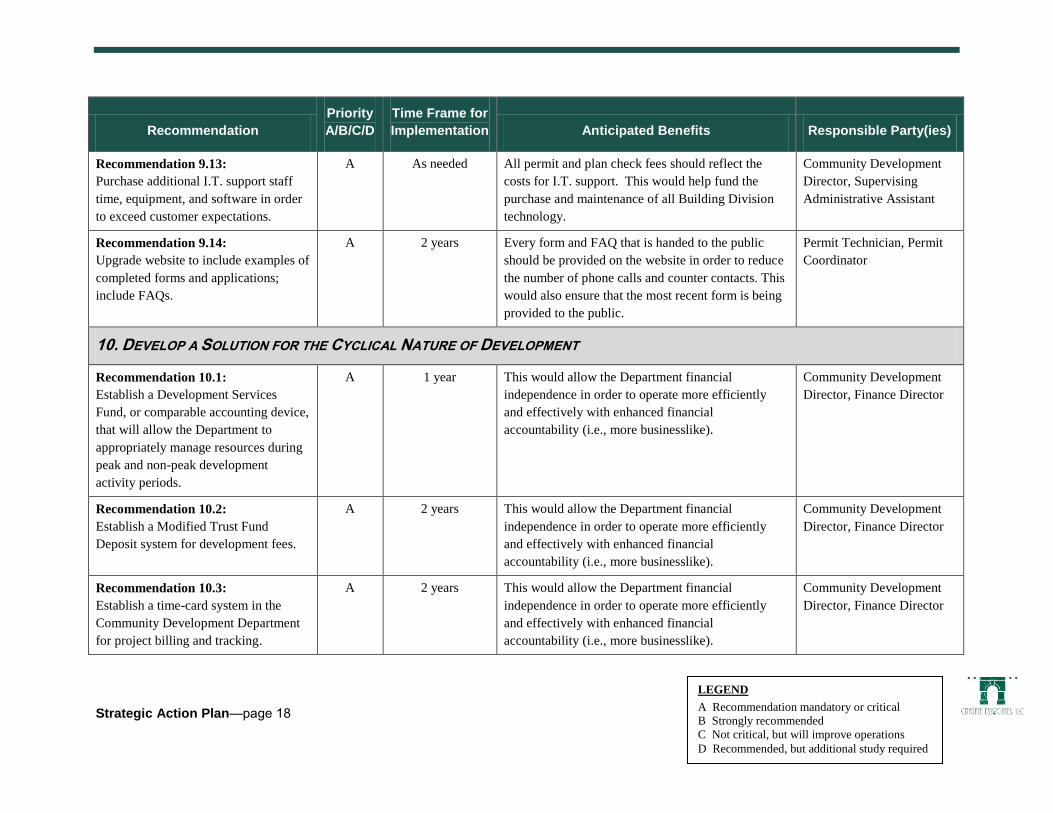
Recommendation 9.13:
Purchase additional I.T. support staff
time, equipment, and software in order
to exceed customer expectations.
A As needed All permit and plan check fees should reflect the
costs for I.T. support. This would help fund the
purchase and maintenance of all Building Division
technology.
Community Development
Director, Supervising
Administrative Assistant
Recommendation 9.14:
Upgrade website to include examples of
completed forms and applications;
include FAQs.
A 2 years Every form and FAQ that is handed to the public
should be provided on the website in order to reduce
the number of phone calls and counter contacts. This
would also ensure that the most recent form is being
provided to the public.
Permit Technician, Permit
Coordinator
10. DEVELOP A SOLUTION FOR THE CYCLICAL NATURE OF DEVELOPMENT
Recommendation 10.1:
Establish a Development Services
Fund, or comparable accounting device,
that will allow the Department to
appropriately manage resources during
peak and non-peak development
activity periods.
A 1 year This would allow the Department financial
independence in order to operate more efficiently
and effectively with enhanced financial
accountability (i.e., more businesslike).
Community Development
Director, Finance Director
Recommendation 10.2:
Establish a Modified Trust Fund
Deposit system for development fees.
A 2 years This would allow the Department financial
independence in order to operate more efficiently
and effectively with enhanced financial
accountability (i.e., more businesslike).
Community Development
Director, Finance Director
Recommendation 10.3:
Establish a time-card system in the
Community Development Department
for project billing and tracking.
A 2 years This would allow the Department financial
independence in order to operate more efficiently
and effectively with enhanced financial
accountability (i.e., more businesslike).
Community Development
Director, Finance Director

Strategic Action Plan—page 19
LEGEND
A Recommendation mandatory or critical
B Strongly recommended
C Not critical, but will improve operations
D Recommended, but additional study required
Recommendation
Priority
A/B/C/D
Time Frame for
Implementation Anticipated Benefits Responsible Party(ies)
11. OTHER RECOMMENDATIONS
Recommendation 11.1:
Expand front counter hours of operation
carefully as the economy improves.
A 1 year Would provide a measured response in service-level
improvements at the front counter as the economy
recovers; would maximize the most efficient “back
office” work hours for staff.
Community Development
Director
Recommendation 11.2:
Assign a full-time Building Division
Permit Technician to cover the counter
40 hours per week as soon as practical.
B 1 year This would allow the Plans Examiner to maintain the
guaranteed turnaround time frames for plan checks
as opposed to issuing permits at the public counter
each day.
Building Official
Recommendation 11.3:
Move Administrative Assistants to the
back office.
B 180 days This would ensure that the customers walking in the
door are greeted by technician staff that is trained to
help them and will strengthen the efficiency and
effectiveness of the Administrative Division.
Community Development
Director
Recommendation 11.4:
Include Fire in “One-Stop Shop”
program immediately.
A 90 days This would improve customer service by allowing
the public to process permits and obtain
development-related information without the need to
drive to different locations.
Building Official, Fire Chief
Recommendation 11.5:
Modify front counter “sign-in sheet” in
order to offer express service for drop-
offs and quick questions.
A 180 days This feature would eliminate the need for the public
to wait long periods of time in order to receive
assistance from staff that takes less than a couple of
minutes.
Assistant Building Official

Strategic Action Plan—page 20
LEGEND
A Recommendation mandatory or critical
B Strongly recommended
C Not critical, but will improve operations
D Recommended, but additional study required
Recommendation
Priority
A/B/C/D
Time Frame for
Implementation Anticipated Benefits Responsible Party(ies)
Recommendation 11.6:
Maximize cross-training skills for
Planning, Building, and Engineering
Development Review front counter
staff.
A 2 years All front counter staff should be trained to provide at
least “routinely requested permit-related
information” to the public. This would result in
higher levels of customer service when staff are
absent and provide additional support when
departments are overloaded with work.
Building Official
Recommendation 11.7:
Use plan check and inspection
consultants when staff cannot perform
within the guaranteed time frames.
A 120 days As plan check and inspection workloads rise and fall,
“contract staff” should be utilized to maximize
efficiency and adhere to guaranteed time frames.
Building Official
Recommendation 11.8:
Create a career ladder for the Permit
Coordinator position.
C 1 year This position is key in terms of the levels of
responsibility. Consideration should be given to
upgrading this position to a higher non-supervisory
level. This would result in the position acquiring
higher skill sets needed to perform the job duties.
Building Official
Recommendation 11.9:
Consider assigning a part-time
Assistant Permit Coordinator.
C 1 year The current workload of the Permit Coordinator
appears to be excessive. Consideration should be
given to hiring an intern or part-time Assistant
Permit Coordinator to reduce the workload and assist
other staff members when the workload declines.
Assistant Building Official
Strategic Action Plan—page 21
LEGEND
A Recommendation mandatory or critical
B Strongly recommended
C Not critical, but will improve operations
D Recommended, but additional study required
Recommendation
Priority
A/B/C/D
Time Frame for
Implementation Anticipated Benefits Responsible Party(ies)
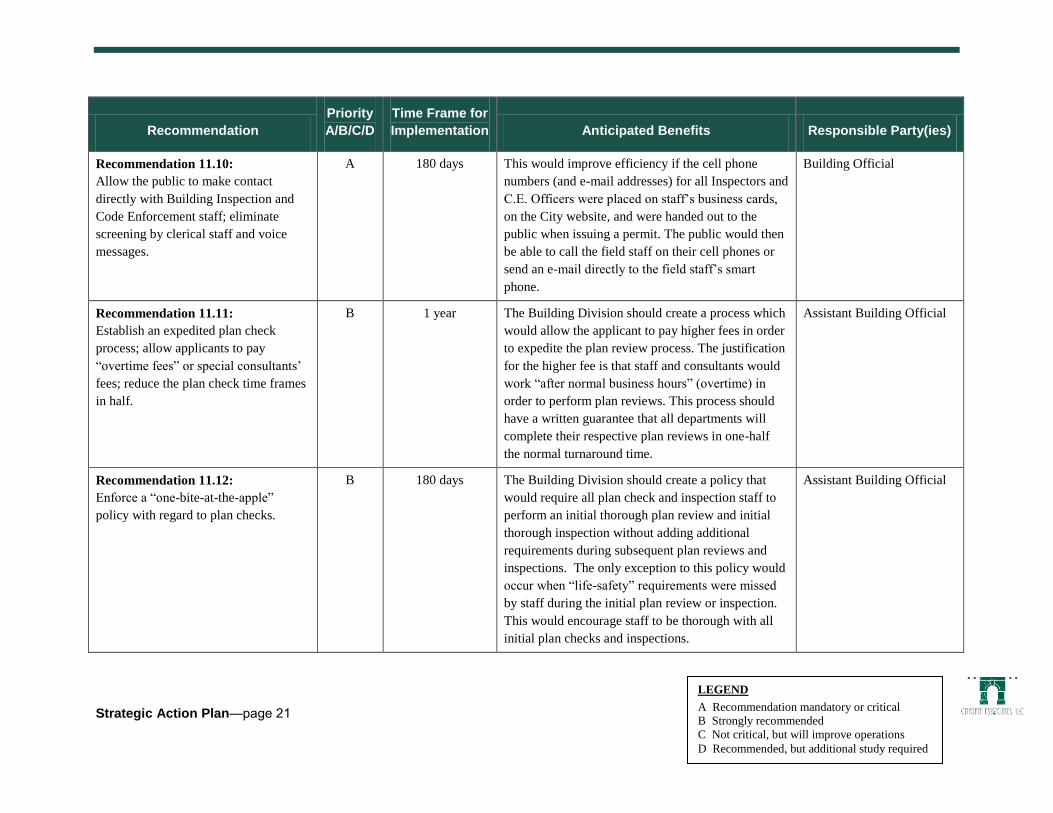
Recommendation 11.10:
Allow the public to make contact
directly with Building Inspection and
Code Enforcement staff; eliminate
screening by clerical staff and voice
messages.
A 180 days This would improve efficiency if the cell phone
numbers (and e-mail addresses) for all Inspectors and
C.E. Officers were placed on staff’s business cards,
on the City website, and were handed out to the
public when issuing a permit. The public would then
be able to call the field staff on their cell phones or
send an e-mail directly to the field staff’s smart
phone.
Building Official
Recommendation 11.11:
Establish an expedited plan check
process; allow applicants to pay
“overtime fees” or special consultants’
fees; reduce the plan check time frames
in half.
B 1 year The Building Division should create a process which
would allow the applicant to pay higher fees in order
to expedite the plan review process. The justification
for the higher fee is that staff and consultants would
work “after normal business hours” (overtime) in
order to perform plan reviews. This process should
have a written guarantee that all departments will
complete their respective plan reviews in one-half
the normal turnaround time.
Assistant Building Official
Recommendation 11.12:
Enforce a “one-bite-at-the-apple”
policy with regard to plan checks.
B 180 days The Building Division should create a policy that
would require all plan check and inspection staff to
perform an initial thorough plan review and initial
thorough inspection without adding additional
requirements during subsequent plan reviews and
inspections. The only exception to this policy would
occur when “life-safety” requirements were missed
by staff during the initial plan review or inspection.
This would encourage staff to be thorough with all
initial plan checks and inspections.
Assistant Building Official

Strategic Action Plan—page 22
LEGEND
A Recommendation mandatory or critical
B Strongly recommended
C Not critical, but will improve operations
D Recommended, but additional study required
Recommendation
Priority
A/B/C/D
Time Frame for
Implementation Anticipated Benefits Responsible Party(ies)
Recommendation 11.13:
Lower the volume of building
inspections per day to ensure quality
and value.
A 1 year The Building Division should approve several
Professional Services Agreements with private firms
to provide overflow inspections services on an “as-
needed basis.” This would reduce the current
workload to an optimum inspection workload of 150
inspections per week per Inspector, or 12 stops per
day. This should be the target workload.
Assistant Building Official
Recommendation 11.14:
Cross-train plan check staff to perform
minor inspections.
A 2 years The plan check and Permit Technician staff should
be trained at a minimum of 3 hours per week in order
to perform routine inspections such as block wall,
patio cover, swimming pools etc. in order to become
more well-rounded and assist when the inspection
workload peaks.
Building Official
Recommendation 11.15:
Update all existing Building Division
policies and create new ones, as needed,
by January 1, 2016.
B 3 years Large portions of the Building Division policies are
obsolete. Many of these policies are based on model
codes that have been replaced by more recent state
codes. These obsolete policies should be updated by
January 1, 2016.
Assistant Building Official
Recommendation 11.16:
Designate the Assistant Building
Official as a supervisorial position, with
the corresponding authority, in order to
strengthen its leadership role.
A 60 days The current job description for the Assistant Building
Official (ABO) position includes supervisory duties
and, therefore, should not be in the General
Employee category. This position is critical to the
operation of the Building Division and should be
upgraded to a management position. This change
would enhance management structure of this
division.
Building Official

Strategic Action Plan—page 23
LEGEND
A Recommendation mandatory or critical
B Strongly recommended
C Not critical, but will improve operations
D Recommended, but additional study required
Recommendation
Priority
A/B/C/D
Time Frame for
Implementation Anticipated Benefits Responsible Party(ies)
Recommendation 11.17:
Assign Assistant Building Official to
manage and supervise the Code
Enforcement program.
A 60 days First, reclassify the ABO position into a middle-
management position. Since Building Inspection
duties and C.E. duties are similar, place the C.E.
division under the supervision of the ABO in order to
create a higher level of efficiency and uniformity.
Building Official
Recommendation 11.18:
Increase by 75 percent the amount of
time Code Enforcement Officers spend
out of the office and in the field.
A 180 days
(smart phones)
1 year (MDTs)
C.E. Officers are spending an excessive amount of
time in the office as opposed to canvassing the City.
This could vastly improve if they were provided with
smart phones and mobile data terminals and if they
were to receive calls directly from the public while in
the field.
Assistant Building Official
Recommendation 11.19:
Stagger the workweek so that at least
one officer is working on Saturdays.
A 1 year It is commonly known by the public that Code
Enforcement and Neighborhood Services staff do not
work weekends which is actually the time of the
week that promulgates violations such as special
events, signage, etc. The number of violations would
be significantly reduced with a staggered workweek.
Building Official
Recommendation 11.20:
Establish response time standards for
code enforcement complaints; advertise
standards on the Department website.
A 180 days In order to make staff accountable and assure the
public that their complaints will be handled in a
timely fashion, a time frame standard for the “initial
contact” should be established.
Building Official
Recommendation 11.21:
Rethink the Department-wide staff
meeting.
A 90 days Increasing the frequency of Director staff meetings
would create opportunities for all staff to establish
day-to-day priorities that are better aligned with the
priorities of the City Council; thus, avoiding the
“piling on” syndrome staff currently experiences.
Community Development
Director

Strategic Action Plan—page 24
LEGEND
A Recommendation mandatory or critical
B Strongly recommended
C Not critical, but will improve operations
D Recommended, but additional study required
Recommendation
Priority
A/B/C/D
Time Frame for
Implementation Anticipated Benefits Responsible Party(ies)
Recommendation 11.22:
Examine compaction between
Associate Planner and Senior Planner.
B 180 days The salary relationships may or may not be
appropriate under the circumstances; nonetheless, it
is important to examine the compensation and to
have an open discussion about the issue and to take
action, if needed.
Supervising Administrative
Assistant, Human Resources
Department
Recommendation 11.23:
Redesign packet distribution system to
improve access to Planning
Commission, Architectural Review and
Cultural Heritage Review processes.
B 180 days This would provide improved input from interested
stakeholders and enhanced credibility of the process.
Deputy Community
Development Director
Recommendation 11.24:
Continue to encourage proponents to
meet “early and often” with
neighborhood groups.
A 180 days This would increase the chances of resolving issues
of concern having to do with neighborhood
compatibility.
Deputy Community
Development Director
Recommendation 11.25:
Institute a Ride-Along for elected and
appointed officials to help familiarize
them with the City’s Inspection and
Code Enforcement programs.
B 180 days This would increase policy setters’ understanding of
the challenges, sensitivities, and opportunities unique
to the City’s Code Enforcement program.
Chief Building Official
Recommendation 11.26:
Develop a Continuing Education
Program for Architectural Review and
Cultural Heritage advisory body
members.
B 2 years This would increase the credibility and effectiveness
of the advisory bodies, would clarify their role and
authority, and improve meeting management.
Community Development
Director

Section I—Introduction page 25
SECTION I—INTRODUCTION
Citygate Associates, LLC is pleased to present this organizational assessment of San Luis
Obispo’s Community Development Department. This introductory section will discuss the goals
of the report, the work Citygate conducted, including our approach and assessment factors, and
advise the reader on how best to handle this peer review. We will also discuss the reality and
complexity of the community setting that is uniquely San Luis Obispo. These unique community
characteristics shape the opportunities and constraints that are available to the City and the
Community Development Department as a whole.
1.1 STUDY SCOPE AND OBJECTIVES
The goal of the study is to provide an independent, objective, rigorously analytical third party
analysis of the policies, procedures, management and operations of the Community Development
Department, as it now exists, and to design a constructive, forward-looking, and creative
strategic plan for improvement, as needed. As part of the study Citygate reviewed and analyzed
the current organizational structure and service delivery of the Community Development
Department as well as, to the extent necessary, the associated land development services
provided by other departments of the City (e.g., the Public Works Engineering Development
Review Division, Economic Development Program, and the City Manager’s Office).
As set forth in the scope of this engagement, Citygate solicited input from residents, customers,
stakeholders and employees to help define the goals and priorities that the City will consider in
analyzing potential alternatives for improvement.
A key purpose in the design of a general performance analysis, such as this engagement, is to
ensure that sufficient flexibility is provided to the consultant and the City to pursue issues that are
most rewarding, while functioning within an agreed-upon contract budget. To accomplish this
objective, the early analytical efforts were designed for the consultant to establish a familiarity with
the Community Development Department’s overall planning and development review permitting
processes, and the systems and procedures that support it, and to "scan" for issues that are material
to the study in its early stages. This was done to make sure that the study was outcome-driven, as
opposed to simply being task-driven. As a result of these early analytical efforts and our
discussions with the leadership team, Citygate was able to focus its time and attention on the issues
we identified in the Department and the actual issues identified by the City’s employees, customers
and stakeholders during our one-on-one interviews, focus groups, and our on-line surveys.
1.2 WORK CONDUCTED
In varying degrees, Citygate Associates examined the following:
1. Communication among staff and customers

Section I—Introduction page 26
2. Current and future performance measures
3. Support systems such as information technology, human resources, and
accounting
4. Management structure and effectiveness
5. Customer satisfaction
6. Allocation of employees and other resources
7. Personnel management, supervision, and reporting
8. Staffing, budgeting, and the systems by which the organization routinely
reassesses its key programs and activities
9. Workload trends
10. Physical layout of building and workspace.
The scope of Citygate’s engagement included neither a financial audit nor a compliance audit.
Citygate also set a goal of providing realistic recommendations that can be implemented to help
improve the Community Development Department as well as the overall effectiveness of the
development review permitting process, while meeting the needs of the San Luis Obispo City
Council and the citizens whom they serve.
In executing this study, Citygate engaged in the following processes:
1. Conducted interviews with the City Council, City Manager, Assistant City
Manager, and Community Development Director
2. Conducted focus groups with external customers such as development applicants
and non-applicant organizations and neighborhood groups
3. Conducted a web-based survey of external customers of the Community
Development Department
4. Conducted a web-based survey of Community Development Department
employees, and employees from Public Works, Fire, and Utilities that participate
in the development permit review process.
5. Conducted a web-based survey of City residents
6. Conducted interviews with all levels of the Community Development staff
7. Reviewed available documents and records relating to the management,
operation, and budgeting of the Community Development Department

Section I—Introduction page 27
8. Considered best practices in comparable agencies for applicability in San Luis
Obispo.
Throughout this process, it was our policy to review findings of the study with multiple sources
in order to validate findings used in the report. The data also was presented and discussed with
the Community Development Director and a multi-department steering committee to allow an
opportunity to provide evidence concerning aspects of the report that they felt were unclear or
needed further input.
Based on our understanding of the City’s environment, Citygate Associates developed its own
mission-oriented goals to guide our efforts in conducting the engagement, as follows:
1. Citygate Associates will deploy the City's investment in this assessment to
enhance the City’s development permit review process, when measured by the
criteria of efficiency, effectiveness, responsiveness, timeliness, balance, and
transparency towards all stakeholders.
2. Citygate Associates will make recommendations to improve the Community
Development Department by maximizing its organizational performance, to the
extent possible, within a finite resource base.
3. Citygate Associates will ensure that San Luis Obispo City receives an
independent, objective, and rigorous organizational assessment, while
respecting unique local conditions and needs and encouraging constructive,
positive results.
1.3 CITYGATE’S APPROACH AND ASSESSMENT FACTORS
Citygate analyzed the goals of the City’s Community Development Department and overall
philosophy. We assessed the congruence of these critical guidelines with the orientation of the
San Luis Obispo City Council. Once this important step was completed, we examined the
profile of processes to evaluate organizational structure and management systems, organizational
relationships, allocation of employees and other resources, performance variables, budgeting and
training, workload trends, communications systems, information technology, facilities and
equipment, relationships with citizens, comparability to other jurisdictions and related aspects to
determine if these were in alignment with the departments’ mission and policies as they relate to
planning, development, building and safety, and code enforcement, including the new
Neighborhood Services program.

Section I—Introduction page 28
In conducting our study, we used the following assessment factors:
Citygate’s Profile of Assessment Factors
1.4 THE KEY TO SUCCESS: THERE’S A ROLE FOR EVERYONE
In preparing our findings and recommendations, Citygate attempted to produce a report that can
be owned by as many of the City’s employees as possible. Ownership of change is the key to
bringing about real lasting change. We believe that most people are not averse to change, they
just do not like being changed, and they do not want to be told what to do and how to do it. If it
is not their idea there may be resistance to it, lack of effort to implement it, or sometimes even a
forceful opposition to the suggested improvement.
The degree to which the recommendations in our report reflect the information and ideas
suggested by the City’s employees, customers, stakeholders, elected officials, residents, and
administrative leaders will determine the extent to which lasting changes and improvements will
be made. Great things can happen for the City if everyone takes an active role in owning and
implementing the recommended solutions. There is an essential supporting participatory role for
everyone.
1.4.1 Elected Officials
Congratulations. Very few local government agencies take the time to conduct rotating, citywide
organizational assessments as a matter of course. It is smart preventative maintenance and clearly
a “best practice.” Most cities wait until their affairs are so dysfunctional that they find
themselves sitting on top of a community and organizational volcano. By then, the needed
repairs can be very disruptive and costly.
Mission, Goals
and Objectives
Financial
Performance,
Control, and
Contracting
Staffing,
Supervision,
and Training
Policies and
Procedures
Tools and
Technology
Workload
Distribution
Performance Measures: Efficiency,
Effectiveness and Quality
Service to
Business and
Development
Communities
Optimal
Performance
Optimal
PerformanceManagement
Structure and
Leadership
Service to the
Public

Section I—Introduction page 29
Act now so that all San Luis Obispo community stakeholders and City employees know you are
willing to do what you can to support and enhance the Community Development Department in
its efforts to provide excellent service to all its varied customers. Make a commitment to fund the
Department’s development permit review process and community outreach programs at a level
that will, over time, establish San Luis Obispo to a leadership position among the best-run
departments in California. Fully endorse the recommendations within this report and direct your
staff to work on implementation of the Strategic Action Plan. Support your leadership team.
Think and act strategically.
1.4.2 Customers and Stakeholders
Expect great things from the City. Expect the City to treat you like a valued customer and to
treat you with the highest respect at all times. In turn, recognize that City staff often labors under
difficult circumstances due to the controversial nature of their work and its legal framework,
which is often outside of local control. Give them your respect and, when appropriate, your
support. Be accurate, complete, and forthcoming with the details of your application submittals.
Be quick to resolve issues through the Community Development Department chain-of-command
so that successful processing can become an organizational habit. Activist stakeholders and
applicants alike are encouraged to avoid end-runs, thus weakening the process and reinforcing
dysfunctional behavior in the development permit review process. Delaying due processing of an
application should never intentionally be used as a tactic to force exactions from a private party.
1.4.3 City Manager’s Office
You have taken key steps in the right direction by recognizing the need for ongoing peer review
for all departments. You are supporting key technology initiatives. It is clear that you care about
your City customers and your staff and that you are working hard under difficult circumstances
to do everything you can to make the City’s development permit review process and
responsiveness to stakeholders run better. Take your talents and experience and bring them to
bear by boldly implementing the recommendations in this report.
1.4.4 Community Development Staff
Embrace and support the Strategic Action Plan included in this report and support your
department leaders as they make improvements in the City’s development permit review process
and the manner in which the Department interacts with its stakeholder customers. You may or
may not see your individual recommendations in this report, and it may not contain everything
you wanted, but it will go a long way towards making the San Luis Obispo Community
Development Department among the best and most progressive in the state. Be patient, yet
diligent. Expect and insist on working in one of the best community development agencies in
California. Increase your skills and level of expertise. Be flexible and supportive. Put your
customers first in all that you do. Identify their expectations, and then exceed their expectations.

Section I—Introduction page 30
1.4.5 Key Staff in Other City Program Areas: Public Works, Utilities, Fire,
Economic Development, and Information Technology
You have the opportunity to support positive changes for the City. It cannot happen without you.
Embrace and support the Strategic Action Plan in this report. Be flexible and supportive. For
many of you, the Community Development Department is the direct customer: put your
customers first in all that you do, identify their expectations, and then exceed their expectations.

Section II—City of San Luis Obispo’s Unique Situation page 31
SECTION II—CITY OF SAN LUIS OBISPO’S UNIQUE SITUATION
2.1 THE STORY AND THE GOOD NEWS
San Luis Obispo’s situation with its Community Development Department is fundamentally
good. Relative to many of the agencies Citygate has assisted in recent years, the organization as a
whole is very dedicated, very talented, honest, professional, and competent.
The Department is in a good position to modernize, adapt to a shifting set of priorities, and to
make service delivery changes that will increase efficiency, effectiveness, and customer
satisfaction in all stakeholder categories.
The City Council and the community, as a whole, believe that the City has a well-intended,
talented, and dedicated Community Development staff.
Overall, staff is proud and grateful to be a part of the City of San Luis Obispo Community
Development Department, and it shows. We rarely find this in cities.
2.2 FIVE IMPORTANT CONTEXTUAL THEMES
In order to best understand the Community Development Department’s current challenges and
opportunities it is important for the reader to understand the contextual themes that have been
identified during the course of our organizational assessment. These five contextual themes
underlie and affect everything the Department does day in and day out. They include the
following:
2.2.1 Theme One: The Community Knows San Luis Obispo is a Very Special
Place
San Luis Obispo is arguably one of the most livable, unique, and beautiful cities in California. It
enjoys nearly perfect weather, a varied growing season, a university, and a lovely downtown. It
is a few minutes away from the beach, but not so close that it’s foggy all the time!
Everybody who lives here knows it is a special place. The early Spanish settlers knew it.
Families that have been in the County for generations know it. Students that go to college at Cal
Poly know it. Many stay. If they leave, they often come back. Newcomers know it. Residents in
the neighborhoods know it. Business owners know it.
Throughout our interviews we witnessed this strong sense of place. Preservation of the City as a
special place is a value shared by everyone we met.

Section II—City of San Luis Obispo’s Unique Situation page 32
2.2.2 Theme Two: Push-Pull Exists Between Community Preservation and
Economic Development
During our interviews we noted strong objections to urban sprawl. We often heard “we don’t
want to become like L.A.”
Many of the City’s stakeholders, activists and non-activists alike, value the architectural and
cultural heritage of San Luis Obispo. This value is embodied by the City Council establishing
robust Architectural Review and Cultural Heritage advisory bodies.
We also heard repeatedly that the City and its stakeholders have a desire to maintain and improve
the business environment. We often heard during our interviews that the City needs and wants
“head of household” jobs.
These two values—community preservation and economic development—exist in support of one
another and in opposition of one another, all at the same time. San Luis Obispo’s architectural
and cultural assets add great economic value to the business community. At the same time,
preservation of these assets, with all the rules, regulations, and additional costs, create a burden
on the business community and a burden on investors.
This push-pull makes for a difficult and challenging work environment for the Community
Development Department and its staff. It is easy to get “policy whiplash;” thus, it is in the
interest of City leadership and community stakeholders to recognize the push-pull, discuss it,
respect it, and support the Department as it wrestles with this challenge. In turn, staff’s obligation
is to be fair, objective, and balanced in all that they do, to recognize and embrace the diversity of
the Department’s customer base, and to deliver responsive, transparent service to all.
2.2.3 Theme Three: Push-Pull Exits Between Citizen Involvement and Efficient
Development Permit Review Processing
The City Council and the community together place a high value on citizen involvement. This is
not uncommon in university towns, particularly those that have distinct neighborhoods and deep
historical roots, as does San Luis Obispo.
The high level of citizen involvement leads to rich collaborations and high development
standards, all of which benefits the community. However, the high level of citizen input makes
for a development permit review process that can often be slow and complicated.
We heard vocal complaints from stakeholders that staff was too applicant-oriented and that staff
did not give enough deference to neighborhood groups, residents, and the advisory bodies during
the review process.
On the other hand, we heard repeatedly from the business and development community that the
development permit review process was overly complicated and too deferential to parties that
were not vested financially. However, we should note that there was a general consensus that

Section II—City of San Luis Obispo’s Unique Situation page 33
high development standards, albeit burdensome, protected their business investments over the
long term.
2.2.4 Theme Four: The Organization is Respected, Dedicated, and Collegial, Yet
Professionally Isolated
The community and its varied stakeholders generally respect the talents and dedication of the
individual staff members within the Community Development Department. Our survey data also
supports this conclusion. Staff’s dedication to the City was observed throughout our assessment.
The working environment is friendly, upbeat, positive, and collegial. It is a happy workforce,
overall.
Nonetheless, we also observed several indicators that the Department has fallen behind in certain
core areas of work as a result, we believe, of its geographical and professional isolation. This
phenomenon was visible in the areas of technology (website, smart-phones, social media,
customer surveying), outreach, cross-training, co-managing, and financial management.
We know that talent and professional commitment is present in the organization. It is critical to
the long-term success of the Department that it institutionalizes efforts to harvest “best practices”
from its respective professions. Thus, we have made recommendations that will move the
Department in this direction by establishing Professional Development Plans, ongoing training,
and a Continual Improvement Program. We believe that, if given the opportunity, staff will
thrive and stay ahead in their respective fields of professional endeavor.
2.2.5 Theme Five: If You Can’t Be Predictable, Communicate!
Everybody would be happy if the City could devise a development permit review processing
system that was fast, cheap, transparent, responsive to neighborhood input, AND predictable.
Improvements to the existing system can and should be made, as witnessed by our numerous
suggestions and recommendations.
Nonetheless, notwithstanding these efforts, the system will remain unpredictable to one degree or
another. This is due to the push-pull as we described and because the inherent nature of planning
and building affords great latitude in exercising judgment on projects. This intrinsic problem
presents risk and concerns for all stakeholders, regardless of their priorities.
The best remedy for this reality is for staff to communicate, and then communicate some more,
including with applicants and non-applicants alike. Advances in technology and social media
make this easier currently, and will continue to do so. Keeping the channels of collaboration and
mutual respect alive and well maintained is an ever-growing community expectation, and thus
needs to be a central organizational value of the Department.

This page was intentionally left blank

Section III—What Stakeholders Say About the Community Development Department page 35
SECTION III—WHAT STAKEHOLDERS SAY ABOUT THE COMMUNITY
DEVELOPMENT DEPARTMENT
During the course of conducting Citygate’s one-on-one interviews, focus group meetings, and
three on-line surveys we were able to get a strong sense of how various stakeholders viewed the
Community Development Department, its leadership, and staff as a whole. Relative to other
agencies we have studied and advised, the Community Development staff enjoys a healthy
measure of respect and support. That is not to say that challenges and areas for growth and
improvement do not exist; they do. However, we are of the opinion that the attitudes, skills, and
will to improve the Department’s performance for the community, and the political leadership
support, are very promising.
3.1 ELECTED OFFICIALS
The City Council recognizes the talent and dedication of the staff in the Community
Development Department. They recognize that staff labors in a complex working environment
that involves cross currents between the various values and stakeholders in the community:
preservation; business; environment; cultural; architectural; development; university needs;
neighborhood needs; young adults; older adults; residents; and non-residents.
3.2 APPLICANTS LARGE AND SMALL
3.2.1 Focus Group Meeting
During the course of our study in San Luis Obispo, Citygate held a focus group meeting with
individuals who had processed development permits within the last two years. We asked the
focus group participants two simple questions:
1. How is the Community Development Department doing?
2. How can the Community Development Department improve its efficiency and
effectiveness?
After a very lively 90-minute session the participants reached a loose consensus. In order of
priority, here is what they had to say:
1. Create a “can do” customer service attitude.
2. Enforce cycle-time standards; improve predictability; use Determinate Processing
Agreements.
3. Improve the website: make forms and applications available; include FAQs;
provide samples of completed applications and forms; make it more user-friendly;
make ongoing updates to the website.

Section III—What Stakeholders Say About the Community Development Department page 36
4. Improve interdepartmental coordination.
5. Place the most experienced planners at the front counter.
6. Establish an annual Zoning Code Amendment Process in order to clarify,
simplify, and modernize the Code, and to sunset outdated provisions; push
authority towards over-the-counter approvals.
7. Enforce a “one bite at the apple” policy (e.g., a Conditional Use Permit was
required AFTER the building permit was issued). If the project is materially
redesigned, then limit new requirements (“bites”) to the redesign only.
8. Improve CEQA process: be more inclusive with applicant who is paying the bills;
rely more on licensed professionals’ signatures.
9. Make sure during Commissioners’ orientation that they clearly understand their
roles and limits.
10. Use tailor-made conditions of approval (currently 90 percent are irrelevant).
3.2.2 Customer Survey
Citygate conducted an Internet-based Customer Survey for customers of the City of San Luis
Obispo Community Development Department. The survey was “open” to accept input between
December 28, 2013 and January 25, 2013. The availability of the survey was advertised via hard
copy invitation letters sent to approximately 2,000 randomly-selected applicants who have had
an application processed within the past two years. Invitation letters were also available at the
Department’s front counter. In total, there were 129 completed surveys.1
The survey consisted of a number of closed-ended and yes/no questions with one concluding
open-ended question. Customers were asked to rate the divisions of Development Review,
Long-Range Planning, Building and Safety, and Public Works Engineering, and were only asked
to rate the division(s) they had business with.
Of the 129 total completed surveys, 59 customers responded to questions about Development
Review; 12 responded to questions about Long-Range Planning; 91 responded to questions about
Building and Safety; and 40 responded to questions about Public Works Engineering. For each
of the four divisions addressed in the survey, respondents were asked to rate their satisfaction
with specific aspects of each division. In the Development Review section of the survey, there
were 27 of these aspects; in the Long-Range Planning section, there were 18; in the Building and
Safety section, there were 27; and in the Public Works Engineering section, there were 26.
1 While the number of responses is not statistically significant, these results, when used in tandem with the stakeholder
interviews, provide a very good indicator of the perceptions of customers.

Section III—What Stakeholders Say About the Community Development Department page 37
The rating scale for each aspect was “Far Exceeds Expectations” (5) to “Unacceptable” (1).
Respondents were also asked a few additional “yes” or “no” and rating scale questions with one
concluding open-ended question about the Community Development Department and the Public
Works Engineering Division overall.
Below, a summary of the results for each division are provided, showing the 5 highest ranking
aspects (in descending order) and the 5 lowest ranking aspects (in ascending order).2
Development Review Results
Of the 129 total completed surveys, 59 customers responded to questions about Development
Review. Customers were asked to rate 27 specific aspects of Development Review. A summary
is provided below:
5 Highest Ratings
Subject Mean Median Mode Std Dev
Courtesy 4.03 4 4 0.76
Helpfulness of front counter assistance 3.82 4 4 0.92
Positive attitude 3.66 4 3 0.81
Knowledge of development review 3.61 4 4 0.79
Providing complete process information at public counter 3.47 3 3 0.99
5 Lowest Ratings
Subject Mean Median Mode Std Dev
Cost of processing application (fees) 2.17 2 2 1.12
Complexity of regulations 2.42 3 3 1.05
Processing / turnaround times of construction plan review 2.45 2 2 1.16
Understanding of private business 2.45 2 2 1.19
Coordinated review between divisions and departments of the City 2.55 3 2 1.04
2 Note: If a tie in the mean score exists for the 5th highest or lowest ranking aspect of any division, the aspects with the same
mean score are also shown. Thus, in some cases more than 5 aspects will be shown.

Section III—What Stakeholders Say About the Community Development Department page 38
Long-Range Planning Results
Of the 129 total completed surveys, 10 customers responded to questions about Long-Range
Planning. Customers were asked to rate 18 specific aspects of Long-Range Planning. A
summary is provided below:
5 Highest Ratings
Subject Mean Median Mode Std Dev
Courtesy 4.60 5 5 0.52
Positive attitude 4.50 5 5 0.53
Helpfulness and inclusiveness 4.22 5 5 1.09
Knowledge of long-range planning 4.20 4 4 0.63
Use of technology (web site, plan check, document submittal) 4.00 4 4 0.82
Ease of accessing project manager to discuss project 4.00 4 5 1.05
5 Lowest Ratings
Subject Mean Median Mode Std Dev
Cost of processing application (fees) 2.33 3 3 1.21
Understanding of private business 3.44 3 3 1.42
Coordinated review between divisions and departments of the City 3.56 4 4 1.13
Providing consistent and dependable information 3.60 4 5 1.17
Communication on project status 3.67 4 5 1.32
Building and Safety Results
Of the 129 total completed surveys, 89 customers responded to questions about Building and
Safety. Customers were asked to rate 27 specific aspects of Building and Safety. A summary is
provided below:

Section III—What Stakeholders Say About the Community Development Department page 39
5 Highest Ratings
Subject Mean Median Mode Std Dev
Courtesy 3.80 4 3 0.82
Thoroughness of inspections 3.74 4 3 0.92
Helpfulness of front counter assistance 3.71 4 4 1.04
Timeliness of inspections 3.71 4 4 0.98
Positive attitude 3.70 4 4 0.86
5 Lowest Ratings
Subject Mean Median Mode Std Dev
Cost of processing applications (fees) 2.48 3 3 1.21
Understanding of private business 2.72 3 3 1.29
Coordinated review between divisions and departments of the City 2.93 3 3 1.12
Complexity of regulations 2.93 3 3 1.06
Accuracy/consistency of code interpretations 3.06 3 3 1.06
Public Works Engineering Results
Of the 129 total completed surveys, 38 customers responded to questions about Public Works
Engineering. Customers were asked to rate 26 specific aspects of Public Works Engineering. A
summary is provided below:
5 Highest Ratings
Subject Mean Median Mode Std Dev
Courtesy 3.95 4 4 0.73
Knowledge of public works engineering 3.76 4 4 0.79
Positive attitude 3.71 4 3 0.80
Helpfulness of front counter assistance 3.54 4 4 0.82
Providing complete process information at public counter 3.20 3 3 0.87

Section III—What Stakeholders Say About the Community Development Department page 40
5 Lowest Ratings
Subject Mean Median Mode Std Dev
Cost of processing application (fees) 2.22 2 1 1.17
Processing / turnaround times of construction plan review 2.27 2 1 1.22
Coordinated review between divisions and departments of the City 2.44 2 1 1.28
Understanding of private business 2.47 2 1 1.19
Timeliness/number of re-checks 2.53 3 3 1.21
General Open-Ended Comments
Below, a summary of the responses to the open-ended Customer Survey question is presented.
The results are summarized by common themes identified in each response and are organized by
count (frequency) of each response. Only the top 5 most common themes are shown below.
Please add any specific comments or suggestions you may have for improving services in the
City's Community Development Department and Public Works Engineering Division.
Count Customer OVERALL Responses (Summarized)
12 Improve timeliness of decisions and process flow; reduce time of checking process and plan reviews; approve simple construction over-the-counter, rather than require multi-week reviews.
9 Permit/development/building fees too expensive; permit fees for development are more expensive than other communities; professional and time considerations of plan check services should not require extra fees.
7 City is too restrictive/has too many regulations; apply regulations in a reasonable, goal-oriented fashion; distinguish between "regulations" and "guidelines."
5 Letters to customers should encourage cooperation and not be threatening / intimidating; better communication to customers regarding expected timeframe, costs, and procedures in the Planning process; make review process more "applicant friendly."
4 Better communication and organization between all departments; permitting process breaks down at Public Works.
For a more detailed explanation of the results, please see Appendix A provided at the end of this
report.

Section III—What Stakeholders Say About the Community Development Department page 41
3.3 INTERESTED PARTIES AND STAKEHOLDERS
3.3.1 Focus Group Meeting
In addition, during the course of our study, Citygate held a focus group meeting with residents
and individuals who were not development permit applicants but who had historically been
active and visible community stakeholders with a track record of providing input during the
development permit review process. We asked the participants in this focus group the same two
simple questions:
1. How is the Community Development Department doing?
2. How can the Community Development Department improve its efficiency and
effectiveness?
Again, after a very lively 90-minute session the participants reached a loose consensus. Due to
time constraints, we were not able to establish priorities with the non-applicants focus group.
Nonetheless, here is what they had to say:
1. Redefine the customer; definition currently includes applicants but leaves out the
community.
2. Limit the City’s streamlining efforts to maintenance and replacement building
permits only (e.g., water heaters, roofs).
3. It is difficult to get written materials to the City’s advisory bodies in advance of
hearings, especially the Cultural Heritage Committee.
4. Examine packet distribution system to allow for greater earlier public input at the
Architectural Review Commission and Cultural Heritage Committee.
5. Develop an aggressive “Community Outreach Tactical Plan” that would: use
modern technology; use simple language in public notices and announcements;
provide for public input early in the permitting process; explain why the pending
action is important to the neighborhood; make sure the venue has capacity to
handle the public turnout; have a checklist box with the name of the staff person
who decided whether a pending action had a neighborhood impact.
6. Establish a Committee of the Chairs in order to bring together on a regular basis
the chairpersons of each neighborhood association for discussion of common
interests.
7. Include alternatives at the beginning, with equal weight, in staff reports; include
pros and cons of each alternative; STOP advocacy planning; show fiscal and non-
fiscal impacts on residents.

Section III—What Stakeholders Say About the Community Development Department page 42
8. Meet with neighborhoods first in the application process.
9. General Plan Update currently underway should include an Environmental Task
Force and a Neighborhoods Task Force to provide balance to the Economic
Development Task Force.
3.4 RESIDENTS
3.4.1 Resident Survey
Citygate conducted an Internet-based Resident Survey for residents of San Luis Obispo. The
purpose of the survey was to understand resident opinions of how the Community Development
Department is meeting or not meeting the needs of the residents. The survey was “open” to
accept input between March 7 and March 18, 2013. The availability of the survey was
announced via direct email invitations to 2,000 randomly-selected residents. In addition,
approximately ten (10) interested stakeholders asked to be sent invitations to the survey. Their
requests were accommodated. In total, there were 220 completed surveys.
Residents were asked to rate 15 different aspects of the Community Development Department.
The rating scale for each aspect was “Strongly Agree” (5) to “Strongly Disagree” (1).
Respondents were also asked one open-ended question about the Community Development
Department overall.
Below, a summary of the results is provided, showing the 5 highest ranking aspects (in
descending order) and the 5 lowest ranking aspects (in ascending order).
5 Highest Ratings
Subject Mean Median Mode Std Dev
The Community Development Department does a good job protecting the City's cultural heritage resources (e.g., historic preservation).
3.50 4 4 1.07
The ability to safely move around the City by car is generally efficient. 3.50 4 4 1.11
The Community Development Department contributes to the overall quality of life in San Luis Obispo.
3.43 3 3 0.98
The Community Development Department does a good job protecting the unique architectural character of the City's various neighborhoods (e.g., infill development, code enforcement, etc.).
3.38 3 4 1.08
The Community Development Department does a good job planning for the City's growth and development.
3.29 3 3 1.01

Section III—What Stakeholders Say About the Community Development Department page 43
5 Lowest Ratings
Subject Mean Median Mode Std Dev
The Community Development Department favors the City's residents over the City's businesses. 2.64 3 3 0.91
Information is generally available and I feel informed about planning and development projects.
3.04 3 4 1.18
The quality of life has improved since the City began proactive code enforcement. 3.04 3 3 1.08
The Community Development Department favors the City's businesses over the City's residents. 3.09 3 3 0.98
The Community Development Department's staff reports presented at public meetings are informative and balanced.
3.14 3 3 0.95
General Open-Ended Comments
Below, a summary of the responses to the open-ended Resident Survey question is presented.
The results are summarized by common themes identified in each response and are organized by
count (frequency) of each response. The top 6 most common themes are shown below
Please add any specific comments or suggestions you may have for improving services in the
City's Community Development Department.
Count Resident OVERALL Responses (Summarized)
9
Listen to long-term residents instead of the political flow; Community Development staff have consistently avoided involving residents in issues that affect them; Residents are being bullied and over-run by staff; Our input is constantly neglected, avoided even!; Decisions have already been made prior to public meetings; City seems intent on a top-down approach to planning and only involving people when what they have decided is already finalized, i.e., Hillside ordinance, historical ordinance, wildland/urban fire boundaries; CDD is out of control and out of line. They have their own agenda and throw tried and true policies "under the bus" and deny residents ability to know implications of what is being considered and changed; Essential information is withheld from the public, making any presentation by staff, suspect. This results in a lot of bad feelings.
8
Need to place more emphasis on planning that reduces and mitigates the "homeless problem;" promote development goals that address the problem of the homeless and residents sharing the same space in a thoughtful way that discourages negative interactions; approach the city-wide "aggressive pan handling" problem with other agencies/departments; need better services for at-risk populations, specifically homeless outreach.
8
Continue to maintain a vision of SLO being a safe place to bicycle and a pedestrian-friendly town. Improving this infrastructure on current and future streets should be a continual consideration. Connect bike trails. Need safer walking paths on South Higuera; more walking trails and bike right-of-ways established.

Section III—What Stakeholders Say About the Community Development Department page 44
Count Resident OVERALL Responses (Summarized)
6
SLO Community Development Department needs more visibility and outreach to help residents know this department exists, use fliers or ads, not just social media, or put inserts in utility bills by snail mail; perhaps branding to give the Department and its projects more recognizability; the Department should spend money on letting the public know what they do and how.
4
More resident involvement; There is no staff commitment to reach out to residents and try and solve problems; We hear about things after they are a done deal, or right before council approval; City staff does not notify residents when items are being proposed that will affect them.
4
Develop a more user-friendly code enforcement system. People aren't sure who to call, someone should be willing to talk to the complainer and work out a plan of action; provide information on the number of infractions and what types are being handled, and if they are being resolved in a timely manner; complaints are not being heard.
For a more detailed explanation of the results, please see Appendix C provided at the end of this
report.
3.5 CITY’S EMPLOYEES
The morale among employees is, as a group, good. As mentioned earlier in this report, most
employees are proud and pleased to be working for the City of San Luis Obispo’s Community
Development Department. They are open to change and optimistic about their future and what
they can do to improve operations.
The planners were concerned about being caught in the middle between business and developer
applicants, on one side, and community preservationists, environmentalist, and neighborhood
activists on the other side. Planners are also concerned about the Department’s Annual Work
Program and the manner in which substantial work items are added to their “to-do” list without
additional staffing or financial resources. We observed a sentiment amongst the line staff of
“what do we do first, and what should drop off the list?” This sentiment is supported by our
observations that in many areas, expectations and workload exceed current available resources.
There exists a great deal of frustration and disappointment over the conversion to a new
electronic permit processing system. This EnerGov system has not lived up to expectations.
Despite the shortcomings, we did observe a “can-do” attitude of wanting to see the system work
and provide better customer service.
There also exists concern over the staffing levels and responsibilities at the front counter and in
the Development Review Planning Division.
3.5.1 Employee Survey
Citygate conducted an Internet-based Employee Survey for staff in the divisions of Development
Review, Long-Range Planning, Building and Safety, Administration, Public Works Engineering,

Section III—What Stakeholders Say About the Community Development Department page 45
Utilities, and Fire Prevention involved in the Community Development
Department/Development Permit Review Process of San Luis Obispo. This survey consisted of
the same closed-ended questions asked about the divisions of Development Review, Long-Range
Planning, Building and Safety, and Public Works Engineering in the Customer Survey that
Citygate conducted prior to the Employee Survey. The purpose of the survey was to understand
how similar or dissimilar the staff opinions were of how they were performing compared to the
customers’ perception. A summary of this comparison is provided in Section 3.6, immediately
following this summary of Employee Survey results.
The survey was “open” to accept input between January 31 and February 21, 2013. The
availability of the survey was announced via direct email invitations to staff. In total, there were
28 completed surveys.
Of the 28 total completed surveys, 10 employees responded from Development Review; 4
responded from Long-Range Planning; 6 responded from Building and Safety; 6 responded from
Administration; 4 responded from Public Works Engineering; 0 responded from Utilities; and 1
responded from Fire Prevention.3
For each of the seven divisions addressed in the survey, employees were asked to rate their
perception of how they were performing regarding a number specific aspects. In the
Development Review section of the survey, there were 27 of these aspects; in the Long-Range
Planning section, there were 18; in the Building and Safety section, there were 27; in the
Administration section, there were 24; in the Public Works Engineering section, there were 26;
in the Utilities section, there were 26; and in the Fire Prevention section, there were 27.
The rating scale for each aspect was “Far Exceeds Expectations” (5) to “Unacceptable” (1).
Respondents were also asked one open-ended question about the Community Development
Department/Development Permit Review Process overall.
Below, a summary of the results for each division are provided, showing the 5 highest ranking
aspects (in descending order) and the 5 lowest ranking aspects (in ascending order).4
Development Review Results
Of the 28 total completed surveys, 10 employees responded from Development Review.
Employees were asked to rate 27 specific aspects of Development Review. A summary is
provided below:
3 The response totals of 10, 4, 6, 6, 4 and 1 for Development Review, Long-Range Planning, Building and Safety,
Administration, Public Works Engineering, and Fire Prevention, respectively, do not add up to 28 since several employees
completed the survey for more than one division.
4 Note: If a tie in the mean score exists for the 5th highest or lowest ranking aspect of any division, the aspects with the same
mean score are also shown. Thus, in some cases more than 5 aspects will be shown.

Section III—What Stakeholders Say About the Community Development Department page 46
5 Highest Ratings
Subject Mean Median Mode Std Dev
Customer service when compared with cities within San Luis Obispo County 4.70 5 5 0.48
Knowledge of development review 4.50 4.5 4 0.53
Helpfulness of front counter assistance 4.50 5 5 0.71
Ease of accessing project manager to discuss project 4.50 4.5 5 0.53
Courtesy 4.40 4 4 0.52
Providing complete process information at public counter 4.40 4 4 0.52
Responsiveness to / consideration of customer concerns 4.40 4 4 0.52
5 Lowest Ratings
Subject Mean Median Mode Std Dev
Helpfulness of informative handouts on processes 3.60 3 3 0.84
Cost of processing application (fees) 3.60 3 3 0.84
Clarity of codes and policies 3.60 3.5 3 0.97
Coordinated review between divisions and departments of the City 3.60 4 4 1.07
Timeliness/number of re-checks 3.70 3.5 3 0.82
Complexity of regulations 3.70 3.5 3 1.06
Use of technology (web site, plan check, document submittal) 3.70 4 4 0.95
Long-Range Planning Results
Of the 28 total completed surveys, 4 employees responded from Long-Range Planning.
Employees were asked to rate 18 specific aspects of Long-Range Planning. A summary is
provided below:

Section III—What Stakeholders Say About the Community Development Department page 47
5 Highest Ratings
Subject Mean Median Mode Std Dev
Customer service when compared with cities within San Luis Obispo County 4.50 5 5 1.00
Helpfulness and inclusiveness 4.50 5 5 1.00
Courtesy 4.25 4 4 0.50
Returning phone calls in a timely manner 4.25 4.5 5 0.96
Providing complete information 4.25 4.5 5 0.96
Providing consistent and dependable information 4.25 4.5 5 0.96
5 Lowest Ratings
Subject Mean Median Mode Std Dev
Cost of processing application (fees) 3.00 3 3 0.00
Coordinated review between divisions and departments of the City 3.00 3 3 0.82
Use of technology (web site, plan check, document submittal) 3.25 3.5 4 0.96
Communication on project status 3.50 4 4 1.00
Understanding of private business 3.50 3.5 3 0.58
Building and Safety Results
Of the 28 total completed surveys, 6 employees responded from Building and Safety.
Employees were asked to rate 27 specific aspects of Building and Safety. A summary is
provided below:
5 Highest Ratings
Subject Mean Median Mode Std Dev
Customer service when compared with cities within San Luis Obispo County 5.00 5 5 0.00
Helpfulness of front counter assistance 4.67 5 5 0.82
Timeliness of inspections 4.67 5 5 0.52
Thoroughness of inspections 4.67 5 5 0.82
Communication on project status 4.60 5 5 0.89

Section III—What Stakeholders Say About the Community Development Department page 48
5 Lowest Ratings
Subject Mean Median Mode Std Dev
Cost of processing applications (fees) 2.67 2 2 1.21
Complexity of regulations 3.00 3 3 0.63
Coordinated review between divisions and departments of the City 3.00 3 4 0.89
Use of technology (web site, plan check, document submittal) 3.17 3 2 1.17
Understanding of private business 3.67 4 4 0.52
Administration Results
Of the 28 total completed surveys, 6 employees responded from Administration. Employees
were asked to rate 24 specific aspects of Administration. A summary is provided below:
5 Highest Ratings
Subject Mean Median Mode Std Dev
Communication on project status 4.25 4.5 5 0.96
Knowledge of Urban Planning issues and best practices 4.00 4 4 0.82
Knowledge of Building Code issues and best practices 4.00 4 - 1.00
Ability to creatively garner technical resources to assist department employees 4.00 4 4 0.82
Customer service when compared with cities within San Luis Obispo County 4.00 4 4 0.82
Accuracy/consistency of interpreting policies and procedures 4.00 4 4 0.82
5 Lowest Ratings
Subject Mean Median Mode Std Dev
Understanding of private business 2.75 2.5 2 0.96
Ability to anticipate organizational problems 2.80 3 3 1.10
Ability to articulate a vision for the Department 3.00 3 - 1.00
Ability to build consensus on important issues 3.00 3 2 1.00
Responsiveness to / consideration of customer concerns 3.00 3 2 1.00

Section III—What Stakeholders Say About the Community Development Department page 49
Public Works Engineering Results
Of the 28 total completed surveys, 4 employees responded from Public Works Engineering.
Employees were asked to rate 26 specific aspects of Public Works Engineering. A summary is
provided below:
5 Highest Ratings
Subject Mean Median Mode Std Dev
Providing complete process information at public counter 4.50 4.5 4 0.58
Ability to solve problems as opposed to create problems 4.50 4.5 4 0.58
Customer service when compared with cities within San Luis Obispo County 4.50 5 5 1.00
Courtesy 4.25 4.5 5 0.96
Knowledge of public works engineering 4.25 4.5 5 0.96
Helpfulness of front counter assistance 4.25 4.5 5 0.96
Providing consistent and dependable process information at public counter 4.25 4.5 5 0.96
Helpfulness of informative handouts on processes 4.25 4.5 5 0.96

Section III—What Stakeholders Say About the Community Development Department page 50
5 Lowest Ratings
Subject Mean Median Mode Std Dev
Timeliness/number of re-checks 3.50 3.5 2 1.73
Positive attitude 3.75 4 5 1.50
Fulfilling commitments 3.75 4 5 1.50
Returning phone calls in a timely manner 3.75 4 5 1.50
Cost of processing application (fees) 3.75 4 5 1.50
Processing / turnaround times of construction plan review 3.75 4 5 1.50
Clarity of codes and policies 3.75 4 5 1.50
Communication on project status 3.75 4 5 1.50
Use of technology (web site, plan check, document submittal) 3.75 4 5 1.50
Ease of accessing project manager to discuss project 3.75 4 5 1.50
Understanding of private business 3.75 4 5 1.50
Coordinated review between divisions and departments of the City 3.75 4 5 1.50
Overall process 3.75 4 5 1.50
Fire Prevention Results
Of the 28 total completed surveys, 1 employee responded from Fire Prevention. Employees
were asked to rate 27 specific aspects of Fire Prevention. A summary is provided below:

Section III—What Stakeholders Say About the Community Development Department page 51
5 Highest Ratings
Subject Response Median Mode Std Dev
Courtesy 5.00 - - -
Positive attitude 5.00 - - -
Knowledge of Best Management Practices in applying fire code as part of one-stop development permit review process
5.00 - - -
Customer service when compared with cities within San Luis Obispo County 5.00 - - -
Ease of accessing project manager to discuss project 5.00 - - -
Understanding of private business 5.00 - - -
Coordinated review between divisions and departments of the City 5.00 - - -
Providing complete upfront information regarding inspections 5.00 - - -
Thoroughness of plan review 5.00 - - -
Timeliness of inspections 5.00 - - -
Thoroughness of inspections 5.00 - - -
5 Lowest Ratings
Subject Response Median Mode Std Dev
Helpfulness of front counter assistance 2.00 - - -
Providing complete process information at public counter 2.00 - - -
Providing consistent and dependable process information at public counter 2.00 - - -
Use of technology (web site, plan check, document submittal) 2.00 - - -
Returning phone calls in a timely manner 3.00 - - -
Helpfulness of informative handouts on processes 3.00 - - -
Cost of processing applications (fees) 3.00 - - -
Communication on project status 3.00 - - -
General Open-Ended Comments
Below, a summary of the responses to the open-ended Employee Survey question is presented.
The results are summarized by common themes identified in each response and are organized by

Section III—What Stakeholders Say About the Community Development Department page 52
count (frequency) of each response. Only the top 2 most common themes are shown below, since
no other themes occurred more than once.
Please add any specific comments or suggestions you may have for improving services in your
division or the Community Development Department/Development Permit Review Process
overall.
Count Employee OVERALL Responses (Summarized)
5
Need additional staff to reduce processing times with current and anticipated increase of workload; Permit Technician for Building and Public Works need to be full-time and permanent as they are essential to the entire flow of the Development Review process; due to an increased development workload, the Fire Department counter Administrative Assistant and 1 1/4 Fire Inspector positions should be restored.
2
Need better entitlement routing system with more user-friendly documents; upgraded website with handouts for common counter questions. Re-design website to be more user-friendly with drop down menus to links such as "living here" or "doing business here" to minimize time spent on phone helping customers navigate the website. The homepage should include links to zoning and regulations checklists, and the GIS parcel viewer should be easily accessible for customers' own research.
For a more detailed explanation of the results, please see Appendix B provided at the end of this
report.
3.6 COMPARING CUSTOMER AND EMPLOYEE SURVEY RESPONSES
As indicated earlier, both the Customer and Employee Surveys consisted of the same closed-
ended questions regarding the divisions of Development Review, Long-Range Planning,
Building and Safety, and Public Works Engineering. This was done to compare how similar or
dissimilar the staff opinions were of how they were performing compared to the customers’
perception.
Below, for each division we compare the five scores with the greatest difference and the five
scores with the lowest difference. The rating scale for each aspect was “Far Exceeds
Expectations” (5) to “Unacceptable” (1). The highest differences represent aspects of the
division where perspectives of customers and employees are misaligned. The lowest differences
represent aspects where customers and employees are closer in agreement.
Generally speaking, the employees rated themselves considerably higher than the customers. In
many cases, a difference of more than one point existed. The exception to this is in Long-Range
Planning, where there was a much closer alignment of scores and where the employees actually
rated themselves lower than the customers on many questions.

Section III—What Stakeholders Say About the Community Development Department page 53
3.6.1 Comparing Customer/Employee Development Review Results
Below the comparison for Development Review is shown:
Highest Differences
Subject Customer
Survey Mean Employee
Survey Mean Difference
Customer service when compared with cities within San Luis Obispo County 3.03 4.70 1.67
Cost of processing application (fees) 2.17 3.60 1.43
Processing / turnaround times of construction plan review 2.45 3.80 1.35
Understanding of private business 2.45 3.80 1.35
Ability to solve problems as opposed to create problems 3.02 4.30 1.28
Complexity of regulations 2.42 3.70 1.28
Lowest Differences
Subject Customer
Survey Mean Employee
Survey Mean Difference
Helpfulness of informative handouts on processes 3.27 3.60 0.33
Courtesy 4.03 4.40 0.37
Use of technology (web site, plan check, document submittal) 3.16 3.70 0.54
Positive attitude 3.66 4.20 0.54
Timeliness/number of re-checks 3.02 3.70 0.68

Section III—What Stakeholders Say About the Community Development Department page 54
3.6.2 Comparing Customer/Employee Long-Range Planning Results
Below the comparison for Long-Range Planning is shown:
Highest Differences
Subject Customer
Survey Mean Employee
Survey Mean Difference
Overall process 2.33 3.00 0.67
Helpfulness and inclusiveness 3.60 4.25 0.65
Understanding of private business 3.86 4.50 0.64
Ability to solve problems as opposed to create problems 3.70 4.25 0.55
Returning phone calls in a timely manner 3.78 4.25 0.47
Negative Differences5
Subject Customer
Survey Mean Employee
Survey Mean Difference
Knowledge of long-range planning 4.00 3.25 -0.75
Coordinated review between divisions and departments of the City 3.56 3.00 -0.56
Providing consistent and dependable information 4.50 4.00 -0.50
Cost of processing application (fees) 4.60 4.25 -0.35
Courtesy 4.00 3.75 -0.25
5 Unlike the other divisions where “Lowest Differences” are shown, for Long-Range Planning this table represents
the five scores where the employee scores were the farthest below the customer scores.
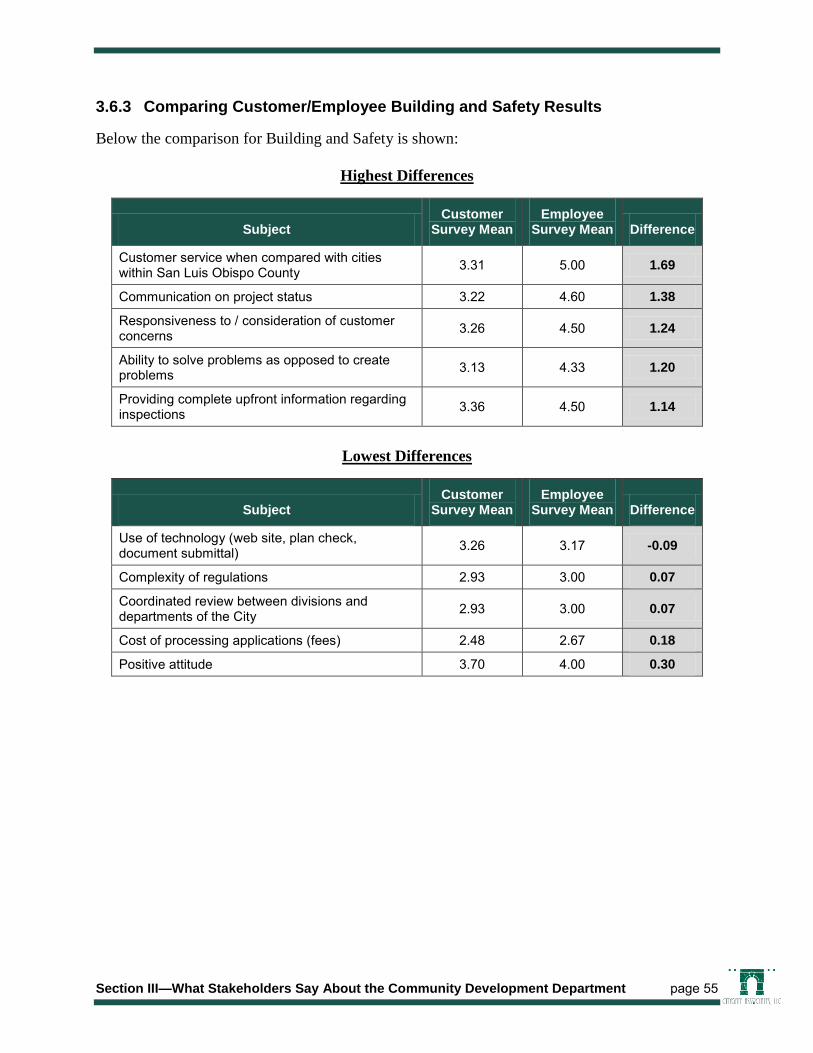
Section III—What Stakeholders Say About the Community Development Department page 55
3.6.3 Comparing Customer/Employee Building and Safety Results
Below the comparison for Building and Safety is shown:
Highest Differences
Subject Customer
Survey Mean Employee
Survey Mean Difference
Customer service when compared with cities within San Luis Obispo County 3.31 5.00 1.69
Communication on project status 3.22 4.60 1.38
Responsiveness to / consideration of customer concerns 3.26 4.50 1.24
Ability to solve problems as opposed to create problems 3.13 4.33 1.20
Providing complete upfront information regarding inspections 3.36 4.50 1.14
Lowest Differences
Subject Customer
Survey Mean Employee
Survey Mean Difference
Use of technology (web site, plan check, document submittal) 3.26 3.17 -0.09
Complexity of regulations 2.93 3.00 0.07
Coordinated review between divisions and departments of the City 2.93 3.00 0.07
Cost of processing applications (fees) 2.48 2.67 0.18
Positive attitude 3.70 4.00 0.30

Section III—What Stakeholders Say About the Community Development Department page 56
3.6.4 Comparing Customer/Employee Public Works Engineering Results
Below the comparison for Public Works Engineering is shown:
Highest Differences
Subject Customer
Survey Mean Employee
Survey Mean Difference
Ability to solve problems as opposed to create problems 2.79 4.50 1.71
Customer service when compared with cities within San Luis Obispo County 2.88 4.50 1.62
Cost of processing application (fees) 2.22 3.75 1.53
Processing / turnaround times of construction plan review 2.27 3.75 1.48
Process for final/parcel map approval 2.58 4.00 1.42
Lowest Differences
Subject Customer
Survey Mean Employee
Survey Mean Difference
Positive attitude 3.71 3.75 0.04
Courtesy 3.95 4.25 0.30
Knowledge of public works engineering 3.76 4.25 0.49
Use of technology (web site, plan check, document submittal) 3.06 3.75 0.69
Helpfulness of front counter assistance 3.54 4.25 0.71
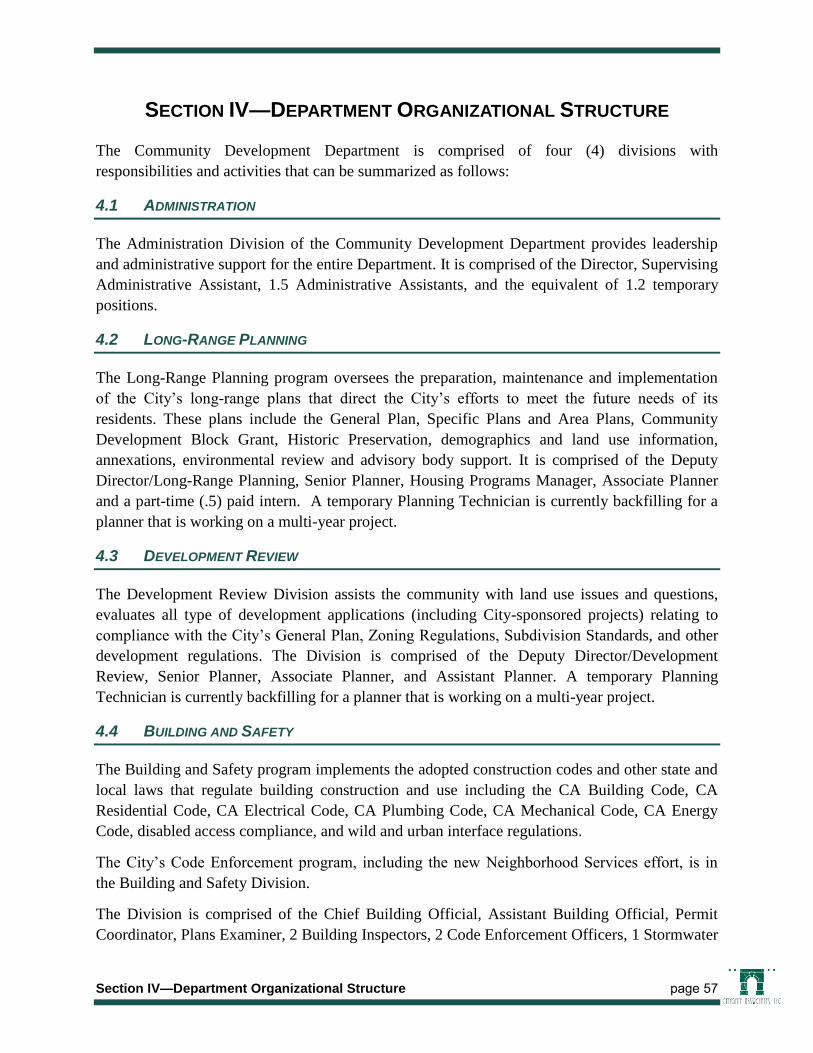
Section IV—Department Organizational Structure page 57
SECTION IV—DEPARTMENT ORGANIZATIONAL STRUCTURE
The Community Development Department is comprised of four (4) divisions with
responsibilities and activities that can be summarized as follows:
4.1 ADMINISTRATION
The Administration Division of the Community Development Department provides leadership
and administrative support for the entire Department. It is comprised of the Director, Supervising
Administrative Assistant, 1.5 Administrative Assistants, and the equivalent of 1.2 temporary
positions.
4.2 LONG-RANGE PLANNING
The Long-Range Planning program oversees the preparation, maintenance and implementation
of the City’s long-range plans that direct the City’s efforts to meet the future needs of its
residents. These plans include the General Plan, Specific Plans and Area Plans, Community
Development Block Grant, Historic Preservation, demographics and land use information,
annexations, environmental review and advisory body support. It is comprised of the Deputy
Director/Long-Range Planning, Senior Planner, Housing Programs Manager, Associate Planner
and a part-time (.5) paid intern. A temporary Planning Technician is currently backfilling for a
planner that is working on a multi-year project.
4.3 DEVELOPMENT REVIEW
The Development Review Division assists the community with land use issues and questions,
evaluates all type of development applications (including City-sponsored projects) relating to
compliance with the City’s General Plan, Zoning Regulations, Subdivision Standards, and other
development regulations. The Division is comprised of the Deputy Director/Development
Review, Senior Planner, Associate Planner, and Assistant Planner. A temporary Planning
Technician is currently backfilling for a planner that is working on a multi-year project.
4.4 BUILDING AND SAFETY
The Building and Safety program implements the adopted construction codes and other state and
local laws that regulate building construction and use including the CA Building Code, CA
Residential Code, CA Electrical Code, CA Plumbing Code, CA Mechanical Code, CA Energy
Code, disabled access compliance, and wild and urban interface regulations.
The City’s Code Enforcement program, including the new Neighborhood Services effort, is in
the Building and Safety Division.
The Division is comprised of the Chief Building Official, Assistant Building Official, Permit
Coordinator, Plans Examiner, 2 Building Inspectors, 2 Code Enforcement Officers, 1 Stormwater

Section IV—Department Organizational Structure page 58
Inspector, a part-time (.75 FTE) Permit Technician, 2 Neighborhood Services Specialists and a
part-time (.2 FTE) Scanning Intern.
The following chart illustrates the Community Development Department’s current organizational
structure:

Section IV—Department Organizational Structure page 59
Community Development Organizational Chart
Director(FTE 1.0)
Administration(3.7 FTE)
Planning Intern
(FTE .50)
Admin Assistant
(FTE 0.5)
Sup. Admin Asst.
(FTE 1.0)
Admin Assistant(FTE 1.0)
Recording Secretary
(FTE 0.2)
Planning Intern(FTE .50)
Development Review(4.5 FTE)
Associate Planner
(FTE 1.0)
Deputy Director
(FTE 1.0)
Senior Planner(FTE 1.0)
Assistant Planner
(FTE 1.0)
Temp. Planning Technician(FTE .50)
Temp. Planning Technician(FTE .50)
Long-Range Planning(5.0 FTE)
Senior Planner
(FTE 1.0)
Deputy Director
(FTE 1.0)
Housing Programs Manager(FTE 1.0)
Associate Planner
(FTE 1.0)
Paid Intern(FTE .50)
Scanning Intern
(Vacant)(FTE 0.2)
Building & Safety(11.95 FTE)
Chief Building Official
(FTE 1.0)
Code Enforcement
(FTE 1.0)
Stormwater Inspector (Vacant)(FTE 1.0)
Code Enforcement
(Vacant)(FTE 1.0)
Neighborhood Service Specialist(FTE 1.0)
Neighborhood Service
Specialist(FTE 1.0)
Building Inspector
(FTE 1.0)
Assistant Building Official(FTE 1.0)
Building Inspector
(FTE 1.0)
Plans Examiner
(FTE 1.0)
Permit Coordinator
(FTE 1.0)
Permit Technician
(FTE 0.75)
Full Time Supervisor
Full Time Manager
Full Time
Part Time
Paid Intern
Legend:
Total FTE: 26.15

This page was intentionally left blank

Section V—Ten Strategic Recommendations page 61
SECTION V—TEN STRATEGIC RECOMMENDATIONS
In this section Citygate identifies and briefly discusses the Ten (10) Strategic Recommendations
that were developed during the course of this study. All of these Strategic Recommendations are
important to understanding what needs to be done to continue reshaping the organization, to
build upon its current successes, and to make real organizational improvements that will be
visible and meaningful. Put another way, if the Department makes all the “Other
Recommendations” set forth in this study but does not implement the Ten (10) Strategic
Recommendations, the overall improvement program is likely to end in failure. The list of ten is
not intended to reflect an order of priority.
STRATEGIC RECOMMENDATION #1: DEVELOP AN AWARD-WINNING COMMUNITY
OUTREACH PROGRAM
As mentioned earlier in this report, San Luis Obispo places a high value on community
communication, openness and transparency, neighborhood involvement, and having a vibrant
public participation and civic engagement process. Though activist stakeholders are important
vested participants in the development permit review and plan development process, it is
important that ordinary residents and other elements of the community not be overlooked in the
process. This is important in any community, but it is even more important in San Luis Obispo
because of its very unique physical, historical, cultural, educational, and demographic
characteristics.
In order to preserve the balance, integrity and credibility of the Department, staff should be
empowered and directed to make an extraordinary effort to ensure that the Department gets out
ahead of the issues and aggressively communicates and fully engages the community. The
Department can and should use robust, proactive, multi-directional communication with the
community. The Department should put an emphasis on using the Internet and the Department’s
website. It should also stay current on the use of evolving communication technologies and
social media such as Facebook, Twitter, MindMixer, mobile apps, crowdsourcing and Virtual
Town Hall (VTH) meetings. By communicating and interacting with all the various stakeholders
in the community and their varying interests, the Department will build trusting and working
relationships that will strengthen the ability of its staff to effectively and efficiently function in
San Luis Obispo’s unique and complex operating environment.
We believe the Department has a higher degree of knowledge and experience in using
information technology than most other local governments and that the City has the potential,
opportunity and the necessary interest in the community to be a national leader in state-of-the-art
community outreach programs.

Section V—Ten Strategic Recommendations page 62
Recommendation 1.1: Prepare and implement a proactive Community Outreach and
Communication Plan.
With the continually improving power of communication and information technology, a
community outreach program can be as robust and powerful as the City Council, Community
Development Department, and stakeholders want it to be.
At a minimum, an effective Community Outreach and Communication Plan would include a
clear statement of purpose, values, and commitments.
In addition, the Plan should also clearly describe how the Department intends to use information
and communication technology to:
1. Communicate with the community
2. Facilitate communication from the community to the Department
3. Encourage and maximize public participation and civic engagement in the
preparation of plans and in the development, implementation and enforcement of
regulations
4. Maximize the ability of community members to obtain information and services
using the Internet
5. Design the Department’s website to be a communications portal to other
departments and services
6. Continually improve the outreach program by measuring and adjusting
7. Provide public reports on outreach successes and failures.
It is our understanding that the Department has already begun the early work on a community
outreach program.
STRATEGIC RECOMMENDATION #2: ESTABLISH CYCLE-TIME STANDARDS:
SYNCHRONIZE; WIDELY PUBLICIZE; MEASURE; AND REPORT OUT
The Building and Safety Division has done a good job of establishing and publishing cycle-time
standards. The Department’s planners and engineers that touch the development permit review
process need to do the same thing. The Development Review Team, which is described in
greater detail later in this report, must give particular attention to managing and measuring cycle
times and turnaround times and adjusting practices to ensure that cycle times and commitments
are realized. It may at first be difficult for the Department to do, but it can be done and it should
be done. It will be well worth the effort, for the reasons discussed below.

Section V—Ten Strategic Recommendations page 63
Based on our observations and interviews, Department staff has little to no awareness of its
processing times for discretionary permits. When we asked staff, we either got unsure answers or
no answer at all.
This low level of awareness is not adequate. Managers should have ongoing statistics and reports
that track how specific projects are moving through the system so that they can identify problems
that need to be addressed.
Tracking cycle times and turnaround times helps all staff, and particularly managers:
Assign projects, allocate hours, and check assigned workloads of individual
planners to projects and match resources to workloads
Position the Department to advocate for resources to meet cycle times
Establish and monitor review cycles times and other performance measures
Know all the activities going on in the Department
Be able to tell the Director, staff, and applicant at each step of the process, what
the issues are, where each project is in the review process, what documents are
still missing, when an approval was given and on what conditions, etc
Know the number of re-submittals required before an application is deemed
complete and the reasons those applications were incomplete
Determine how long it takes to get a project through the process and how that
compares with other governmental entities
Identify problems and investigate why project reviews do not meet cycle times
Receive weekly status reports, including a list of projects being reviewed by
name, number, detailed status, comments, and what projects are overdue
Make judgments regarding appropriate staffing levels and accurately match
resources to the level of service expectations established by the City Council
Understand the issues at the Planning Commission, Architectural Review
Commission, and Cultural Heritage Committee that might be holding up the
efficiency of the review process.
Cycle-time and turnaround reports are basic in scope and will be effective tools in monitoring the
activities of the Department and the work done by each planner. Much of the data needed to
reach the objectives listed above will be available through the electronic permit tracking system
purchased by the City.
The Community Development managers have recognized the need for such tracking reports.
Citygate cannot emphasize more strongly that the problems with EnerGov need to be worked out

Section V—Ten Strategic Recommendations page 64
quickly and that performance management needs to be integrated into the DNA of this electronic
permit tracking system. Many of our recommendations hinge on the ability of the Department to
closely track project turnaround times, planner productivity, and providing a means by which the
applicant can have access to all information related to their project.
It is not possible to deliver excellent customer service without diligently monitoring and
reporting out on how much time it is taking to move applications through the review process.
The applicants deserve to know, staff needs to know, other departments need to know, the City
Council deserves to know, advisory bodies need to know, and activists and other stakeholder
groups deserve to know. Without this knowledge of cycle times, the process will be inherently
unfair, out of balance, less than efficient, and of questionable effectiveness and credibility.
Recommendation 2.1: Establish, synchronize, and widely publicize cycle-time
standards for all development permit types.
The Department, as a group, should dedicate whatever time is necessary to identify the key steps
in the development permit review process and to assign reasonable cycle and turnaround times
for each step in the process. These steps would typically include, at a minimum:
1. Application submitted
2. Application deemed complete
3. Environmental Assessment completed
4. Staff evaluation completed
5. Advisory body review(s) completed
6. Planning Commission action completed.
The measurement of cycle-time and turnaround time results should be reported out publicly to
the City Manager, City Council, and all customer and interested stakeholder groups on a regular
basis. Everyone involved in the development permit review process should be aware of how long
it is taking to process permits.
STRATEGIC RECOMMENDATION #3: DEVELOP AN ANNUAL WORK PROGRAM
WITH THE CITY COUNCIL THAT IS DYNAMIC AND INTERACTIVE
The Department operates day-in and day-out by interacting with stakeholders and customers that
have competing values and expectations. In this respect, its operating environment is like no
other department in the City. Because of this unique situation, the Department needs to make an
extra effort to maintain at all times its credibility with the City Council, City Manager, and the
community. Continual alignment and re-alignment of the City Council’s and City Manager’s
expectations, and the time and resources allocated to these expectations, is critical to the
Department’s success.

Section V—Ten Strategic Recommendations page 65
Currently, the Department’s quarterly and midyear reports are presented by the Finance
Department, not the Community Development Department. These reports are focused primarily
on budgetary objectives and, as such, do not adequately address the desired outcomes of the
Department’s Annual Work Program.
It is our understanding that the Annual Work Program is now being integrated into the annual
report on the General Plan. However, it does not institutionalize an ongoing conversation
between the City Council, City Manager, and Department regarding ever-changing and
sometimes conflicting Work Program expectations and corresponding resource allocation.
The only other opportunity for the Department to align its day-to-day efforts with the
expectations and assignments from the City Council comes when there are new initiatives or
assignments for the Department that come up extemporaneously at City Council meetings. This
is a common problem in busy and complex municipal environments. Based on our interviews, it
is our understanding that the Department struggles to meet the City Council’s workload
expectations. We did not observe just a few disgruntled individuals; rather it was a pervasive
sentiment of concern throughout the organization. This is a sign that expectations, time, and
resources are out of balance. All cities to one degree or another can get out of balance in this
regard. However, because San Luis Obispo has such strong, complex, and visible competing
interests, it cannot afford to let this imbalance go unattended too long. It affects employee
morale, and just as importantly, if left unattended, misunderstandings with regard to expectations
and the allocation of Department resources will lead to mistakes and lead to the Department
becoming too demoralized to try new approaches to problem solving that might require risk and
innovation.
Recommendation 3.1: Develop an Annual Work Program with the City Council that is
dynamic and reviewed publicly with the Director at least twice a
year in a study session.
Recommendation 3.2: Consider the Annual Work Program when adding or subtracting
new Department programs, initiatives, or services.
Recommendation 3.3: Include in the Annual Work Program measurable objectives,
timelines, and outcomes that are tied to the Department’s annual
budget.
Recommendation 3.4: Increase linkage between Employee Performance Evaluation
System and the Department’s Annual Work Program.

Section V—Ten Strategic Recommendations page 66
STRATEGIC RECOMMENDATION #4: INCREASE EFFICIENCY, EFFECTIVENESS,
AND CREDIBILITY OF THE DEVELOPMENT REVIEW TEAM
The Department has a well-established Development Review Team (DRT) that meets weekly. A
seasoned planning professional at the Deputy Director level leads the DRT. Having a DRT is an
important “best practice.” Many cities and counties do not have development review teams;
fortunately it is already in place in San Luis Obispo. The DRT members include representatives
from the City’s Transportation, Public Works, Utilities, Fire, Natural Resources, Economic
Development and Building and Safety programs.
A “best practice” DRT has ten (10) basic functions, which include the following:
1. Monitoring customer service through all aspects of the development review
permitting program; reminding staff that customers include both applicants and
stakeholders and other interested parties in the community
2. Placing conditions of approval on discretionary entitlement applications
3. Tracking development applications to make sure they are processed in a timely
manner
4. Holding pre-application conferences with applicants, and institutionalizing a
criteria for priority projects
5. Managing items going to the Planning Commission and City Council, and
advisory bodies such as the Architectural Review Commission and the Cultural
Heritage Committee
6. Monitoring for consistent application of planning, engineering and building
standards
7. Identifying and resolving development review permitting problems
8. Effectively managing the map finalization and the Certificate of Occupancy
process
9. Disseminating information regarding development review policies and procedures
to other staff members in the City, and provide training as needed
10. Celebrating successes.
Highly effective DRT meetings begin and end on time. Attendance is mandatory.
A mature DRT will continually heighten awareness of time frames, produce consistent and clear
development standards, and deliver reliable fee cost estimates for the customer.

Section V—Ten Strategic Recommendations page 67
We found that San Luis Obispo’s DRT is collegial and unstructured relative to teams we have
observed and advised in other cities. For example, in San Luis Obispo the DRT has no formal
agenda. Nor is there a rigorous project tracking system in place. Each planner tracks his or her
own projects and reports orally to the DRT as to where the application is in process.
The DRT, as it operates today, is nonetheless a positive program for the Department and its
customers.
We believe the DRT could be even more efficient and effective if it employed the “best practice”
techniques listed above. These improvements would serve to broaden its scope and
accountability and strengthen its customer-orientation.
The DRT already has in place a commitment to providing “early assistance” to its customers. It
offers Pre-Applications for its more complex projects. This service helps both the applicant and
the City identify problems and issues at the beginning of the review process before the applicant
has made investments of time and money. It allows staff the opportunity to solve technical
development issues in advance and to make the applicant aware of neighborhood compatibility
issues that can be addressed in advance. The Pre-Application fee is refunded to the applicant if
he or she files the formal application permit within 6 months. Applicants are encouraged to meet
with neighborhood groups that will be affected by development activities.
Recommendation 4.1: Establish and publish the criteria for projects requiring Pre-
Application review.
It is best to institutionalize success by formally establishing the criteria by which Pre-Application
review is required. The categories of projects should be established by the DRT, in consultation
with the City Council or, at a minimum, the City Manager. The criteria might include, for
example only:
Residential projects that have more than 20 dwelling units
Commercial projects that have over 20,000 square feet of new development
Projects located in San Luis Obispo’s historical downtown area
Projects that create more than 20 head-of-household jobs
Projects that generate more than $10,000 per year in new sales tax revenue.
Recommendation 4.2: Meet and coordinate staff’s issues and concerns BEFORE pre-
application meetings with customers.
Recommendation 4.3: Open up the Pre-Application process by offering early
community review.

Section V—Ten Strategic Recommendations page 68
During the course of our study we encountered both applicant and activist stakeholders who were
frustrated with the development permit review process. Applicants expressed their fear of
investing in San Luis Obispo because of the high level of multi-layered planning, architectural,
and cultural review. Activist stakeholders complained of being locked out of the process until it
was too late to make a difference. It is our understanding that too many development decisions
are being pulled up by the City Council to their level, rather than being resolved earlier in the
review process.
We recommend that the Department continue to encourage applicants of larger, more
consequential projects to meet with neighborhood groups as early as possible in the Pre-
Application process. This would allow the applicants and interested stakeholders to be talking to
each other and working informally to resolve issues to the extent possible at the front-end of the
development permit review process.
Opening up the Pre-Application process in this manner should be addressed as part of the
previously mentioned Community Outreach Plan.
Recommendation 4.4: Establish a formal DRT agenda.
The DRT should establish a formal agenda for its weekly meetings, identifying categories of
permits, existing timelines for each permit type and mechanisms for streamlining the review
process for each permit category to meet cycle-time standards. As an example, the DRT agenda
could include:
DRT Weekly Meeting Agenda
1. Review conditioning of pending projects and action items from last
meeting
2. Discussion of upcoming commission and council action items
3. Review of new projects
4. Review of Pre-Applications for priority projects
5. Status of DRT continual improvement items
6. Status of Development Services Fund
7. Around-the-table comments and requests for help
8. Meeting action items-due dates, required coordination, etc.
9. Adjourn.

Section V—Ten Strategic Recommendations page 69
The precise agenda that would work best in San Luis Obispo should be refined and developed
collaboratively by the DRT members, the Deputy Director, and the Department Director.
In short, the DRT should be the center stage for development coordination and problem solving
in the City.
Recommendation 4.5: Utilize Determinate Processing Agreements for high priority
projects.
Successful development review permitting programs are able to provide entitlements and permits
in a way that is consistent and predictable. A highly evolved DRT approach to development
review permitting can help San Luis Obispo achieve this objective.
The Department should, in addition, establish a “Determinate Processing” program for
discretionary permits. Using a Determinate Processing program will help reduce the steps in the
development review permitting process into a simple, non-binding, outcome-oriented Schedule
of Performance agreement between the City and the applicant.
Citygate recommends that the City use Determinate Processing Agreements only for high
priority projects. These agreements, which should be used selectively to further the City’s
economic development objectives, are simple and highly effective. The agreements are non-
binding and typically are limited to two pages in length. The City could choose, for example
only, to offer Determinate Processing Agreements for:
1. Commercial projects in downtown San Luis Obispo
2. Business Park and Industrial projects that generate or retain over 20 head-of-
household jobs
3. Commercial projects that generate over $10,000 per year in new sales tax revenue
4. Affordable housing projects of 10 units or more.
In a fashion similar to establishing the Pre-Application requirements, the DRT participants and
the City’s leadership team should discuss and decide which type of projects should be afforded
Determinate Processing Agreements and the exact content of the document. Determinate
Processing Agreements should include basic project information and a back-and-forth schedule.
It is best to keep it simple, as provided in the following example:

Section V—Ten Strategic Recommendations page 70
CITY OF SAN LUIS OBISPO
DETERMINATE PROCESSING AGREEMENT
Date:
Project Name:
Priority Category:
Proponent Contact:
Location:
Case Planner:
SCHEDULE OF PERFORMANCE
ACTION (RESPONSIBLE PARTIES) COMPLETE DATE
1. Pre-application Conference (All Hands) January 5, 2014
2. Submission of Complete Application (Applicant) January 19, 2014
3. Deemed Incomplete Letter (Case Planner) February 12, 2014
4. Project Meeting (All Hands) February 14, 2014
5. Second Submission (Applicant) February 21, 2014
6. Deemed Complete Letter (Case Planner) March 1, 2014
7. Call for Conditions of Approval (Case Planner) March 3, 2014
8. Review Conditions at DRT (All Staff) March 24, 2014
9. Discussion with Applicant regarding conditions (Case Planner/Applicant) March 26, 2014
10. Project Refinements Due (Applicant) April 1, 2014
11. Staff Report Prepared (Case Planner) April 15, 2014
12. Staff Report to Director for Review (Case Planner/Director) April 15, 2014
13. Final Service Check with Applicant (Case Planner/Applicant) April 16, 2014
14. Post Hearing Notice April 17, 2014
15. Advisory Body Hearing May1, 2014
Signatures indicating concurrence:
________________________________________ ________________________
Community Development Director Applicant
______________________________________
Economic Development Manager
______________________________________
Assistant City Manager
NOTE: This Determinate Processing Agreement is intended to increase effective communication between the City of San
Luis Obispo and the Project Proponent. It is a “good-faith” commitment to cooperate and to advance the subject project in
a manner consistent with the public interest.

Section V—Ten Strategic Recommendations page 71
The following are additional recommendations for improvements that should be made in the
Development Review Team program as soon as practical for the Department.
Recommendation 4.6: Standardize Conditions of Approval to promote internal
consistency.
Recommendation 4.7: Examine the practice of issuing Blue Cards for projects that may
not have fully met Conditions of Approval.
Recommendation 4.8: Improve coordination and consistency of planners and engineers
signing-off on, and being accountable for, the application of non-
standard fees.
Recommendation 4.9: Shorten the time it takes for an applicant to get to the Cultural
Heritage Committee.
Recommendation 4.10: Use the time between now and when the EnerGov system is due to
be delivered to update, streamline, and shorten development
permit review processing procedures.
STRATEGIC RECOMMENDATION #5: INSTITUTE AN AWARD-WINNING
“UNANTICIPATED SERVICE” PROGRAM FOR CUSTOMERS OF ALL TYPES
Recommendation 5.1: Institute an “Unanticipated Service” program.
This is a system for consistently exceeding customer expectations in the development review
permitting process. It is based on principles and practices used by Nordstrom stores and best
practice public agencies.
Instituting an “Unanticipated Service” program in the Community Development Department is
likely to increase customer satisfaction and reduce complaints from applicants.
Community Development Department customers are often frustrated by their inability to obtain
reliable and timely information about the status of their applications. This frustration, Citygate
believes, only adds fuel to customers’ concerns about other aspects of the development review
permitting process. In our experience, when applicants are kept informed, they are less likely to
assume the worst. Conversely, when applicants are not kept informed, they assume the worst
with regard to what is happening to their applications and their project. It is axiomatic that in the
absence of information, people “fill in the blank” with negative perceptions or fear of worst-case
scenarios. This negative perception can take hold and be very difficult to reverse, irrespective of
a public agency’s efforts to improve systems and procedures.

Section V—Ten Strategic Recommendations page 72
The principle of “Unanticipated Service” is a simple one:
“Customer satisfaction increases most dramatically
when a customer receives a service they did not expect.”
Examples of how it could be used in the Community Development Department include the
following:
1. The Community Development Director sends a personal letter to the
Department’s most active applicants, consultants, or environmental advocacy
groups describing to them improvements and changes that are underway in the
Department.
2. The staff member assigned as Project Planner calls applicants and stakeholders on
larger projects at least every week to let them know the status of the application
and to identify and discuss how issues can best be resolved in a mutually
satisfactory manner. The applicant and stakeholders, when interested, are also
asked if they have any concerns regarding the application’s status.
3. Make Friday morning “call your clients day” for all planners.
4. The developer and stakeholders, when interested, receive a letter from the Project
Manager at the conclusion of the hearing wherein they are asked how the
Department might improve their efficiency, effectiveness, and transparency.
Holding employees accountable for delivering “Unanticipated Service” is an essential element of
a successful development review permitting process customer service program.
Citygate believes that once the “Unanticipated Service” program is developed, adopted, and
publicized, San Luis Obispo’s Community Development Department employees will embrace it
enthusiastically and meet the new expectations, particularly if the time spent providing the
service is recognized as a legitimate and tracked project cost.
STRATEGIC RECOMMENDATION #6: INCREASE PROFESSIONAL TRAINING,
CROSS-TRAINING, AND CO-MANAGEMENT TO PROMOTE EXCELLENCE AND
ORGANIZATIONAL NIMBLENESS
The Department shows signs of being professionally isolated. The most notable and
consequential examples of this isolation are the Department’s lag in technology, lag in the use of
social media, and its lag in the use of modern communication techniques. We theorize that much
of the lag can be attributed to the geographic location of San Luis Obispo. Cal Poly offers
opportunities to engage academic and other professionals in the building and planning field;
however, the approaches and practices often originate from the same source. Looking out of the
area could be of great benefit to the Department. Also, to offset this geographic reality, the City

Section V—Ten Strategic Recommendations page 73
should make a conscientious effort to continually invest and reinvest in its personnel. It is
otherwise far too easy to become professionally complacent. Though it is cliché to say so, the
Community Development Department’s people ARE its most important asset.
Recommendation 6.1: Conduct a training needs assessment.
The Department, with the assistance of the Human Resources Office, should conduct a training
needs assessment for all employees in the Department.
Training comes in several forms: in-house training on various processes and technology, training
by experts related to specific aspects of their job, and training provided by professional
organizations.
At the present time, in-house training only includes new planners shadowing experienced
planners for a short period of time. To some degree, informal non-structured training on specific
topics takes place in the planning staff meetings.
This level of training in the Community Development Department is not adequate for the
responsibilities these planners have, in light of community expectations and the fact that San
Luis Obispo is so geographically and professionally isolated. It has been de-emphasized because
of workload pressures, but it needs to become a top priority.
Two goals of such training are: (1) consistency, so that everyone interprets the code in a similar
fashion, and (2) to make planners comfortable enough that they know where they have flexibility
to deviate to accommodate nuances and when to seek management or policy-maker direction
when circumstances so dictate.
The professional planning seminars, particularly those located in the Los Angeles, San
Francisco, and Sacramento regions, are important, not only for the sessions presented, but also
for the interaction with other planners to share experiences, observations, and frustrations. It is
important that the planning staff be given the opportunity to attend sessions provided by such
professional organizations. It is encouraging that staff routinely attend these conferences, but
more emphasis should be placed on making sure that new staff are also engaged in outside
training.
The Director should be encouraged to participate in leadership roles within his profession and
should attend both regional and national level conferences on an annual basis.
Recommendation 6.2: Commit to and fund a professional development plan for all
employees.
A conscious effort needs to be made to broaden the exposure that all employees have to current
business methods within their respective jobs and professions. This is particularly important
among the Department leadership and mid-management and professional planning and
engineering ranks.

Section V—Ten Strategic Recommendations page 74
Recommendation 6.3: Develop Core Competencies Training program for new planners.
All staff in the Department should develop the particulars of a Core Competencies Training
program collaboratively. The program might include, for example:
1. Delivering excellent customer service
2. Working the Department filing system
3. Interacting with other departments
4. Being resourceful and knowing how to ask for help
5. Writing a good staff report
6. Linking your performance plan to the Annual Work Program
7. Tracking your time for each project
8. Understanding the Planning Commission and City Council packet preparation
schedule.
This would ensure that new planners have the skills and knowledge that are uniquely required in
San Luis Obispo; it will equip planners to avoid having to “sink or swim.”
Recommendation 6.4: Provide continual training in the use of all forms of modern
graphics and illustration.
Recommendation 6.5: Provide training for the best use of PowerPoint presentations.
Recommendation 6.6: Co-manage important projects by assigning a lead planner and
support planner.
The Department and its customers and stakeholders would be better served if each major
planning project had two planners assigned to it. There could be a lead planner and a support
planner. Both would be charged with providing collaboration-based high quality service to the
applicant and participating stakeholders and other parties of interest, as needed.
Recommendation 6.7: Integrate Current Planners into the Long-Range Planning Work
program.
We observed that Long-Range Planning could benefit from the professional assistance and input
of other planners within the Department. Given the size of the Department, we believe it would
work best if all planners were working in both the long-range planning and current planning

Section V—Ten Strategic Recommendations page 75
arenas, as a matter of course. Doing so will promote teamwork and the quality of the work will
increase by using systemic collaboration within the Department.
Recommendation 6.8: Establish a weekly training program for all plan check,
inspection, and code enforcement personnel.
This would enhance uniformity, create a “closer team” and strengthen front counter morale.
STRATEGIC RECOMMENDATION #7: ESTABLISH A “CONTINUAL IMPROVEMENT
GROUP”
Recommendation 7.1: Establish a Continual Improvement Group on the Development
Review Team.
A Continual Improvement Group should be established to focus on processing improvements
that are directly linked to customer satisfaction for all stakeholder categories: businesses;
applicants; and neighborhood participants. The Continual Improvement Group’s activities should
be ongoing and never complete. An emphasis should be given to technology-based
improvements, such as website self-help and permit-cycle time management. The Group,
through observation, conversation, and collaboration, should establish the work items with the
Department’s various customers. The Group should operate openly and organically so that
opportunities to improve operations can be seized when they present themselves. As examples
only, here are some possible actionable items for the Continual Improvement Group to take on:
Update the customer service evaluation cards; place an emphasis on getting the
cards into the hands of customers and getting them returned to the Department for
continual evaluation and systems improvement
Continue to redesign written staff reports to provide brevity, simplicity, balance,
and objectivity
Continue to clarify, simplify, sunset, and modernize the City’s zoning code on an
annual basis as is the current practice.
A Continual Improvement Group of five members will work well. There are approaches to
constituting and managing the Continual Improvement Group that will enhance its success. It
should be broad-based in its makeup and skill sets. This will ensure meaningful input and ensure
that the Group’s tasks do not become overly burdensome to any one employee. The Team
should meet often outside of the DRT format, but the meetings should be brief. Working teams
should be assigned around specific improvement tasks. Their work should be done between
DRT meetings, not at the meetings. The Continual Improvement Group should report out to the
DRT on progress and successes. A sample agenda would be as follows:

Section V—Ten Strategic Recommendations page 76
This is a proven model that works in many best practice agencies that want to place a high
priority on customer satisfaction.
STRATEGIC RECOMMENDATION #8: MOVE THE PUBLIC WORKS ENGINEERING
DEVELOPMENT REVIEW PROGRAM INTO THE COMMUNITY DEVELOPMENT
DEPARTMENT TO ALIGN SERVICE GOALS
During the course of our interviews we concluded it is difficult for the City to meet customer
expectations regarding turnaround times for the important engineering work that needs to be
performed during the development permit review process. The engineering work is highly
technical and, unlike planning, less subjective in nature. Unfortunately, delays in getting
planning items and reports reviewed, and conditions of approval finalized, are not uncommon.
It is worth reaffirming that, to the extent changes might be needed to meet turnaround
expectations, we suspect it is due to problems associated with juggling priorities and with the
process itself, as opposed to personnel problems. The skills and attitudes of the Division’s
employees are outstanding.
We believe it would be helpful to move the Public Works Engineering Development Review
Division into the Community Development Department. This would foster a closer alignment of
the Engineering Development Review team’s service goals with the service goals of the Planning
and Building divisions.
CONTINUAL IMPROVEMENT GROUP
MEETING AGENDA
9:00 a.m. to 10:00 a.m.
1. Review of goals and objectives and reaffirmation of
principles
2. Consensus around newly identified needed
improvements
3. Review and status of new Group projects
4. Review and status of ongoing Group projects
5. Around-the-table comments and requests for help
6. Adjourn.

Section V—Ten Strategic Recommendations page 77
Moving the Engineering Development Review Division into the Community Development
Department is merely Step One. Step Two, which is more important, would be to thoroughly
review the structural issues that have led to the perceptions that turnaround times are
problematic. Things to consider as part of this structural review could include:
1. Are the turnaround times set by the Community Development Department well
established, clear, published, and understood by all stakeholders (applicants, staff,
advisory bodies, City Council)?
2. Is the Engineering Development Review Division adequately resourced to meet
the turnaround cycle-time standards established by the Community Development
Department?
3. Does the Engineering Development Review Division have unfettered access to
qualified consultants to ensure the Division can meet the turnaround expectations
on a routine basis?
Delays in the development permit review process will arise even under the best of circumstances.
Often the factors contributing to the delay are beyond the control of staff. When delays occur, it
is best for the planners and engineers to work closely together, like a seamless team, as they
endeavor to satisfy the customer by resolving problems that occur as a result of the delay. If staff
needs to deliver bad news, it is always best to do it as a team.
We believe the Engineering Development Review Division will thrive in the Community
Development Department. This is a model that works in many best practice agencies,
particularly those that have high customer and stakeholder expectations regarding development,
design, preservation, and economic development, as is the case in San Luis Obispo.
As part of our analysis, in making this recommendation, we considered the entire development
permit review process at it now exists in the City. Although most of the review process takes
place in the Community Development Department, many important review activities take place
in other departments. These elements of review include:
Engineering Development Review
Utilities review
Transportation review
Traffic review
Fire Marshall review.
The Engineering Development Review Division, currently operating out of the Public Works
Department, is comprised of the Supervising Civil Engineer, 1 Senior Civil Engineer, .75 Permit
Technician, and a .3 FTE part-time employee.

Section V—Ten Strategic Recommendations page 78
As a matter of course, when studying reorganizational options Citygate utilizes the following
prioritized principles, in descending order, to determine which functions would be included or
not included in a newly reorganized entity:
1. Create a positive and successful customer experience. Throughout our analysis we
first seek to make organizational changes that will improve customer service by
putting the customer first, period, ahead of organizational wants and ahead of
individual wants.
2. Maximize the visibility and public awareness of changes that are practical and
make common sense. We do not propose changes just for the sake of making
changes. Rather, we wish to promote reorganizations that will be understood and
supported by the public and City staff because the changes are simple in design
and an obvious improvement over the current structure.
3. Inventory of all functions touching development permit review process. As part of
our analysis we carefully study and understand the steps in the review process as
they stand in 2013, after the City’s latest moves and staff reductions and the
impacts such moves have had on customer service.
4. Cradle to Grave vs. Checks and Balances. This involves weighing the trade-offs
between the two approaches to structuring an entitlement permit review and
approval process. A “Cradle to Grave” approach means having the same
department responsible for a project throughout the approval process:
environmental review; entitlement; plan check; construction; occupancy; and
post-occupancy monitoring. A “Checks and Balances” approach means having
different departments responsible for each phase in the approval process, as is the
City’s current condition.
5. Whole vs. fractional units. As part of our analysis we consider the practical
advantages and disadvantages of moving entire work units versus, as an
alternative, moving just part of a work unit. We consider the affect such a move
will have on the department from which the function is being removed.
6. Function vs. persons. During the course of our analysis we look at where it is best
to house each function of the development permit review process independent of
the skills and talents of the individuals currently assigned to these functions. This
is done to ensure that the organizational design will hold up over time.
7. Reorganization vs. co-location. In a few instances a department’s involvement in
the overall permit review process is relatively minimal. Moreover, the personnel
conducting the review function have other responsibilities within their own
department. In such instances co-location at or near the permit counter is the best
option for the City and for the customer.

Section V—Ten Strategic Recommendations page 79
8. Financial impacts and consequences. Throughout our analysis we are mindful of
the City’s commitment to full cost recovery and keeping fees to levels that are
competitive with other jurisdictions. Having said this, we look first to what would
be best for the customer, and then work with City staff to make sure our
recommendations are financially achievable.
Recommendation 8.1: Effective January 1, 2014, move the Engineering Development
Review Division into the Community Development
Department.
Fortunately, the Engineering Development Review Division as it currently functions is a single
purpose, stand-alone program. That is, all of the Division’s activities and responsibilities are
directly linked to the development permit review process: reviewing permit applications,
reviewing parcel map and track map plans, reviewing public infrastructure improvement plans,
and reviewing development-related studies. The Utilities, Transportation, and Traffic
Engineering functions are staffed and administered wholly separate from the Engineering
Development Review Division. Therefore, from an organizational and functional standpoint, the
City can move the entire division and its 3.05 (FTE) employees into the Community
Development Department without any other significant organizational shifts.
However, notwithstanding the stand-alone composition of the Engineering Development Review
Division, it is important that cooperation between the Division and the engineering field
operations and engineering inspections operations, for example, continue to be supported in a
seamless fashion. It is critically important that during construction the public improvements are
installed properly and built according to the plans approved by the City’s civil engineers.
The following steps should be taken by the City to accommodate the move in a seamless and
effective manner:
1. Establish lines of authority and cooperation with City Engineer. It is
important to note that the City’s public infrastructure standards are established
and maintained by the City Engineer of record, not the Engineering Development
Review Division. This position has historically, like in nearly all cities the size of
San Luis Obispo, reported directly to the Public Works Director. The City
Engineer is a statutory position vested with certain authorities by the State of
California. This important designation cannot and need not change under this
proposed move of the Engineering Development Review Division.
The City cannot afford to have its customers suffer from poor communication,
mixed messages, or delays between the City Engineer and the Community
Development Department. Time is of the essence when it comes to providing high
quality customer service. Regulations and workable alternatives and common
sense solutions must be brought to the customer on a routine basis. To ensure this

Section V—Ten Strategic Recommendations page 80
happens, the City should execute an interdepartmental support agreement between
the Community Development Department and the Public Works Department in
order to support the development permit review process under the new
organizational structure.
The support agreement should include:
A statement of purpose clearly stating the City’s obligation to provide
excellent customer service on a routine basis across departmental lines
A detailed explanation of the services the Public Works Department will
provide to the Community Development Department, particularly the City
Engineer and Traffic Engineer
A detailed explanation of the responsibility and authority that will be
granted to the Community Development Department by the City Engineer
and Traffic Engineer
A detailed explanation of the services the Engineering Development
Review team will continue to coordinate and provide to the Public Works
Department (e.g., field services, inspection services, other services)
A detailed explanation of protocols for quickly handling special conditions
and variances from established City Engineer and Traffic Engineer
standards and regulations
A commitment to ongoing continual improvement meetings between the
City Engineer and the Community Development Department regarding the
development permit review process, and to reporting out results.
2. Make HR and Budgetary changes. Prior to the January 1, 2014 cut over date,
Department administrative staff should confer with the Human Resources and
Finance departments in order to put in place the necessary changes to the City’s
payroll and budgeting systems to accommodate the move.
3. Establish performance evaluation process. Prior to the January 1, 2014 cut over
date, the Community Development Director, in consultation with the Human
Resources Director and the City Engineer, should establish a protocol to allow for
input from the City Engineer into the personnel performance evaluation process
relative to the incumbent management employee in the Engineering Development
Review Division.
4. Measure and report out. The Community Development Director should measure
the cycle time turnaround performance of the newly organized Division, and
report out publicly to the City Council, City Manager, and stakeholder customers

Section V—Ten Strategic Recommendations page 81
on a quarterly basis until the desired outcomes are achieved. At part of the
measuring, the Director should seek input from applicant customers by means of
surveys or focus groups.
STRATEGIC RECOMMENDATION #9: MAKE FULL USE OF TECHNOLOGY TO
ENHANCE THE CUSTOMER EXPERIENCE
The Department has fallen behind in its use of technology. Staff should use the time between
now and when the EnerGov system is due to be delivered to continue to update, streamline, and
shorten development permit review processing procedures by implementing the suggestions
outlined in the Development Review Team sections of this report. Attention and energy to
employing “best practices” in the technology arena will yield significant improvement results.
The following represent actionable items targeted at developing a work program and list of
desired outcomes for technology-related improvements in the Department.
Recommendation 9.1: Maximize the EnerGov system to enhance customer experience—
do not just digitize and automate the City’s existing processes and
procedures.
Recommendation 9.2: Use technology (EnerGov) to promote transparency in the
regulatory process.
Recommendation 9.3: Increase the amount of information and self-help services
provided online via the Internet.
Recommendation 9.4: Make use of social media to increase public access and
participation.
Recommendation 9.5: Update the Department’s website home page on a regularly
scheduled basis.
Recommendation 9.6: Create a webpage that allows the public to view all properties that
are ready for development.
Recommendation 9.7: Purchase and use smart phones, computer-based mobile units,
GPS devices, and cameras for Building Inspection and Code
Enforcement personnel.
Recommendation 9.8: Target accepting and tracking plans for plan check electronically
by January 1, 2015; target declining non-electronic plans by
January 1, 2016.

Section V—Ten Strategic Recommendations page 82
Recommendation 9.9: Target providing all staff plan check comments on Building Plans
electronically, and make the comments accessible to the public at
the time they are generated, by January 1, 2015.
Recommendation 9.10: Offer online permit issuance for small projects (e.g., re-roofs,
water heaters, etc.); process via credit card or PayPal.
Recommendation 9.11: Establish website-based inspection request system for 24/7
accessibility.
Recommendation 9.12: Include Information Technology support costs in the City’s fee
program.
Recommendation 9.13: Purchase additional I.T. support staff time, equipment, and
software in order to exceed customer expectations.
Recommendation 9.14: Upgrade website to include examples of completed forms and
applications; include FAQs.
STRATEGIC RECOMMENDATION #10: DEVELOP A SOLUTION FOR THE CYCLICAL
NATURE OF DEVELOPMENT
The Community Development Department’s financial health depends greatly upon the flow of
revenue generated off building and development activity. In recent years, as is well documented,
the Department had to endure significant declines in revenue and the resulting cuts in programs,
services, and personnel.
Planning and building activities can be as unpredictable as the economy, interest rates, financial
bubbles, and the weather. Even at its best, development is cyclical from year to year. These
cycles create instabilities for the Department that affect its ability to provide reliable quality
service through the ups and downs of development.
In order to smooth out the cyclical nature of development, “best practice” agencies have made
moves to segregate out of the City’s General Fund all development-related revenues and
expenditures. Establishing a Development Services Fund or comparable mechanism typically
does this. Establishing such a fund would allow the Community Development Department to
carry over its year-end balances into subsequent years for activities directly related to
development permit review process activities. Doing so would have several notable positive
effects for the Community Development Department, including:
1. Financial stability over a multi-year time period by giving the Department the
authority and responsibility to manage its allowable reserves.

Section V—Ten Strategic Recommendations page 83
2. Financial stability even though most revenues are collected at the building permit
phase, which is at the end of the project development cycle.
3. Stronger financial accountability and stronger generally accepted accounting
compliance methods by segregating its development permit review resources
outside the General Fund.
4. The ability to operate more like a business because “savings” as a result of
working efficiently will be retained in the Department’s budget; thus, the
incentives are properly aligned.
In the private sector, businesses are constantly focused on the services they provide their
customers. This is because their revenues, and thus the fate of the company and its employees,
are dependent upon customer satisfaction. It is good to establish in the employees’ minds this
link between services, revenues, and organizational stability and employee paychecks. Everyone
in the organization should see and understand this relationship. Heightening staff’s awareness in
this regard will increase efficiency, effectiveness, and employee pride and satisfaction. This can
be accomplished, notwithstanding the fact that the City is in a regulatory business.
The first step in running things like a business is to set up the accounting records so that all the
employees in the Department can clearly see the relationship between their work and the
Department’s revenues and expenditures.
Recommendation 10.1: Establish a Development Services Fund, or comparable
accounting device, that will allow the Department to
appropriately manage resources during peak and non-peak
development activity periods.
Citygate Associates recommends establishing a Development Services Fund (DSF), or
comparable accounting device, for the City’s Planning, Engineering Development Review, and
Building and Safety programs. All development-related revenues and expenditures would be
accounted for in the DSF. The DSF would include several important features:
1. Beginning Balance
2. Ending Balance
3. Operating Reserve
4. Designated Reserves
5. Fee revenue from both applicants and fees charged to other departments for
services rendered, when applicable
6. Annual operating deficits and surpluses, to the extent they are experienced

Section V—Ten Strategic Recommendations page 84
7. Overhead allocation charges that would be adjusted annually and assessed to the
DSF according to the City’s approved Indirect Cost Ration program
8. More accurate tracking and management of full cost recovery.
The Development Review Team, as described earlier in this report, needs to constantly discuss
and be made aware of the status of the DSF. The Team should be asking these questions: How
do revenues look? How do our expenditures look? Our reserves? Can we hire people? Can we
increase net revenues and build reserves by using consultants? The DSF should be reported on
as a standing agenda item for purposes of creating a sense of urgency and business acumen.
Recommendation 10.2: Establish a Modified Trust Fund Deposit system for development
fees.
Currently the City uses a fee structure that is based upon an estimate of the costs associated with
providing staff review and processing of development-related applications and permits. The City
intentionally reduces select fees so that they are not an inappropriate burden on taxpayers, which
is a common practice in California cities. The Finance Department has taken steps to update the
City’s development fees and to continue to do so on a biennial basis into the future. This current
“best practice” should continue so that the City’s General Fund does not end up subsidizing
development, which would be contrary to a City Council policy.
The next step towards full cost recovery would be to establish a trust fund deposit approach to
planning fees. Under this approach, which is the “best practice,” applicants pay the City for
costs associated with their individual development permit. Overall, this is a fairer and more
justifiable approach to fee and cost management. For example, subdivisions that are large,
complex and controversial pay higher fees. On the other hand, straightforward and simple
subdivisions pay lower fees. The same principle would apply to Conditional Use Permits, Parcel
Maps, Planned Unit Developments, General Plan Amendments, Variances, Zone Changes and
any other major type of discretionary development permit. While some services lend themselves
to flat fees, other planning services should be funded through an applicant deposit in a trust
account so the Department can recover the actual costs.
Citygate recommends using a modified trust fund deposit system wherein the City would use
both set fees and trust fund deposits. The set fees would be for smaller, “Mom and Pop” type
permits; whereas, larger developer-sponsored permit types would be on a trust fund basis. In
both instances, the fees and deposits would be established to maximize full cost recovery to the
City overall. This is a pragmatic approach used by progressive “best practice” cities.
State law requires development permit fees to be based upon the City’s actual costs of providing
the review and regulatory service. The City needs to closely manage its fee program to ensure
full compliance with this requirement. It is also important that costs charged to a proponent’s
application could be well documented at any point in time.

Section V—Ten Strategic Recommendations page 85
Recommendation 10.3: Establish a project and program time-card tracking system in the
Community Development Department for project billing and
tracking.
The City can and should support this objective by converting to a time-card system for at least
the Department’s Planning and Engineering Development Review services. This is a common
“best practice” in today’s growing and dynamic communities.
Time-card systems can vary significantly in terms of sophistication. The City may wish to
integrate the time-card system into the City’s financial reporting system, the City’s payroll
system, or Electronic Permit Tracking System. The extent to which this integration takes place
is not as important as simply making sure a reliable time-card system is established and
functioning and that it links back in support of the Development Services Fund.

This page was intentionally left blank

Section VI—Other Recommendations page 87
SECTION VI—OTHER RECOMMENDATIONS
6.1 FRONT COUNTER
The following recommendations are not strategic in nature but are nonetheless important
improvements that should be made as part of managing the Department’s front counter program
as soon as practical for the Department. The recommendations are based on our onsite
observations, interviews with staff, review of the budget, personnel, workflow documentation
provided to us by staff, and our interaction with customers and stakeholders.
Recommendation 11.1: Expand front counter hours of operation carefully as the
economy improves.
In an up economy front counter hours would be open to the public from 8:00 a.m. to 5:00 p.m.
and would not be closed for lunch. Currently, the front counter is closed during lunch hours and
after 3:00 p.m. Based on our observations and focus group meetings, we believe most customers
have adjusted to these hours. However, the economy is beginning to improve. Demand for front
counter services will no doubt increase in the coming months and years, so staffing levels will
also need to increase.
It should be noted that closing the front counter at 3:00 p.m. provides staff with quiet, highly
productive time that they use to catch up on their “back office” and support duties. This is critical
to smooth operations of the Department. This needs to be taken into consideration when the
Department inevitably increases its front counter services. We would suggest that the
Department consider first staggering lunch hours to allow for service increases and adding staff,
if necessary, before extending hours to 5:00 p.m.
Recommendation 11.2: Assign a full-time Building Division Permit Technician to cover
the counter 40 hours per week as soon as practical.
This would allow the Plans Examiner to maintain the guaranteed turnaround time frames for plan
checks as opposed to issuing permits at the public counter each day.
Recommendation 11.3: Move Administrative Assistants to the back office.
This would allow for more seamless attention to the front counter from staff members who are
trained to help at the front counter.
Recommendation 11.4: Include Fire and Transportation/Traffic in “One-Stop Shop”
program immediately.
The City currently, for the most part, runs a “One-Stop Shop” at its front counter. Our focus
group sessions and interviews led us to conclude that customers did not view the front counter as
a problem area of the Department.

Section VI—Other Recommendations page 88
Nonetheless, a representative from Fire should be assigned to be fully available at all times to
serve the public counter in order to assist the public with technical information immediately
when they walk in the door, as do the other reviewing divisions. Fire does not need to necessarily
maintain hours at the counter or be physically present at all times; that would be overkill and
impractical. However, the current practice of leaving phone messages, having the customer walk
over to a separate building, or sending e-mails does not meet “One-Stop Shop” requirements. If a
customer needs help, the Fire representative should be available on the telephone for immediate
service.
Recommendation 11.5: Modify front counter “sign-in sheet” in order to offer express
service for drop-offs and quick questions.
This feature would eliminate the need for the public to wait long periods of time in order to
receive assistance from staff that takes less than a couple of minutes.
Recommendation 11.6: Maximize cross-training skills for Planning, Building, and
Engineering Development Review front counter staff.
All front counter staff should be trained to provide at least “routinely requested permit-related
information” to the public.
6.2 BUILDING AND SAFETY
The following recommendations are not strategic in nature but are nonetheless important
improvements that should be made in the Building and Safety program as soon as practical for
the Department.
Recommendation 11.7: Use plan check and inspection consultants when staff cannot
perform within the guaranteed time frames.
As plan check and inspection workloads rise and fall, “contract staff” should be utilized to
maximize efficiency and adhere to guaranteed time frames.
Recommendation 11.8: Create a career ladder for the Permit Coordinator position.
This position is key in terms of the levels of responsibility. Consideration should be given to
upgrading this position to a higher level without being a supervisory position.
Recommendation 11.9: Consider assigning a part-time Assistant Permit Coordinator.
The current workload of the Permit Coordinator appears to be excessive. The Director, in
consultation with Permit Coordinator and the Human Resources Director, should examine this.
Consideration should be given to hiring an intern or part-time Assistant Permit Coordinator to
reduce the workload and assist other staff members when the workload declines.

Section VI—Other Recommendations page 89
Recommendation 11.10: Allow the public to make contact directly with Building
Inspection and Code Enforcement staff; eliminate screening by
clerical staff and voice messages.
Currently, in order for the public to make verbal contact with the Building Inspection and Code
Enforcement staff, they are required to call City Hall and have a dialogue with the clerical staff.
The clerical staff then forwards the person to voice mail or calls the Inspector or C.E. Officer,
who then calls the citizen/contractor back. It would be much more efficient if the cell phone
numbers (and e-mail addresses) for all Inspectors and C.E. Officers were placed on staff’s
business cards, on the City website and were handed out to the public when issuing a permit.
The public would then be able to call the field staff on their cell phones or send e-mail directly to
the field staff’s smart phone.
Recommendation 11.11: Establish an expedited plan check process; allow applicants to
pay “overtime fees” or special consultants’ fees; reduce the plan
check time frames in half.
The Building Division should create a process that would allow the applicant to pay higher fees
in order to expedite the plan review process. The justification for the higher fee is that staff and
consultants would work “after normal business hours” (overtime) in order to perform plan
reviews. This process should have a written guarantee that all departments will complete their
respective plan reviews in one-half the normal turnaround time.
Recommendation 11.12: Enforce a “one-bite-at-the-apple” policy with regard to plan
checks.
The Building Division should create a policy that would require all plan check and inspection
staff to perform an initial thorough plan review and initial thorough inspection without adding
additional requirements during subsequent plan reviews and inspections. The only exception to
this policy would occur when staff missed “life-safety” requirements during the initial plan
review or inspection.
Recommendation 11.13: Lower the volume of building inspections per day to ensure
quality and value.
The Building Division should approve several Professional Services Agreements with private
firms to provide overflow inspections services on an “as needed basis.” This would reduce the
current workload to a maximum of 213 inspections per week, per Inspector (i.e., 1 framing
inspection which includes structural, plumbing, electrical, and heating, venting, and air
conditioning = 4 inspections) and not more than 14 stops per day. The optimum inspection
workload that would allow the Inspectors to perform thorough and quality inspections is 150
inspections per week or 12 stops per day. This should be the target workload.
Section VI—Other Recommendations page 90
Recommendation 11.14: Cross-train plan check staff to perform minor inspections.
The plan check and Permit Technician staff should have at least 3 hours of training per week so
that they can perform routine inspections such as block wall, patio cover, swimming pools and
other such routine inspections. Cross-training will allow the technicians to become more well-
rounded and assist when the inspection workload peaks.
Recommendation 11.15: Update all existing Building Division policies and create new ones,
as needed, by January 1, 2016.
Large portions of the Building Division policies are obsolete. Many of these policies are based
on model codes that have been replaced by more recent state codes. These obsolete policies
should be updated by January 1, 2016.
Recommendation 11.16: Designate the Assistant Building Official as a supervisorial
position, with the corresponding authority, in order to strengthen
its leadership role.
The current job description for the Assistant Building Official (ABO) position includes
supervisory duties and, therefore, should not be in the General Employee category. Examples of
this are: “The ABO directs operations,” “trains and evaluates performance of assigned
personnel,” “provides direction to Building Inspectors, Plans Examiners, and clerical staff,”
“performs appraisal of Building Inspectors,” and “administers and coordinates activities.” This
position is critical to the operation of the Building Division and should be upgraded to a
management position.
6.3 CODE ENFORCEMENT
The following recommendations are not strategic in nature but are nonetheless important
improvements that should be made in the Code Enforcement program as soon as practical for the
Department.
Recommendation 11.17: Assign Assistant Building Official to manage and supervise the
Code Enforcement program.
First, reclassify the ABO position into a middle management position. Since Building Inspection
duties and C.E. duties are similar, place the C.E. division under the supervision of the ABO in
order to create a higher level of efficiency and uniformity.
Recommendation 11.18: Increase by 75 percent the amount of time Code Enforcement
Officers spend out of the office and in the field.

Section VI—Other Recommendations page 91
C.E. Officers are spending an excessive amount of time in the office as opposed to canvassing
the City. This could vastly improve if they were provided with smart phones, mobile data
terminals and received calls directly from the public while in the field.
Recommendation 11.19: Stagger the workweek so that at least one officer is working on
Saturdays.
It is commonly known by the public that Code Enforcement and Neighborhood Services staff do
not work weekends which is actually the time of the week that promulgates violations such as
special events, signage, etc. The number of violations would be significantly reduced with a
staggered workweek.
Recommendation 11.20: Establish response time standards for code enforcement
complaints; advertise standards on the Department website.
In order to make staff accountable and assure the public that their complaints will be handled in a
timely fashion, a time frame standard for the “initial contact” should be established.
6.4 GOOD OF THE ORDER
The following recommendations are not directly associated with any specific strategic
recommendation, division, or program within the Department. Yet, based on our observations
and experience, these items deserve attention.
Recommendation 11.21: Rethink the Department-wide staff meeting.
Recommendation 11.22: Examine compaction between Associate Planner and Senior
Planner.
Recommendation 11.23: Redesign packet distribution system to improve access to
Planning Commission, Architectural Review and Cultural
Heritage Review processes.
Recommendation 11.24: Continue to encourage proponents to meet “early and often” with
community members.
6.5 POLICY SETTERS
The following recommendations are not strategic in nature but are nonetheless important
improvements that the City’s policy setters can do. These good ideas came up during our
interviews with staff and our interaction with customers and stakeholders.

Section VI—Other Recommendations page 92
Recommendation 11.26: Institute a Ride-Along for elected and appointed officials to help
familiarize them with the City’s Inspection and Code
Enforcement programs.
Recommendation 11.27: Develop a Continuing Education Program for advisory body
members.
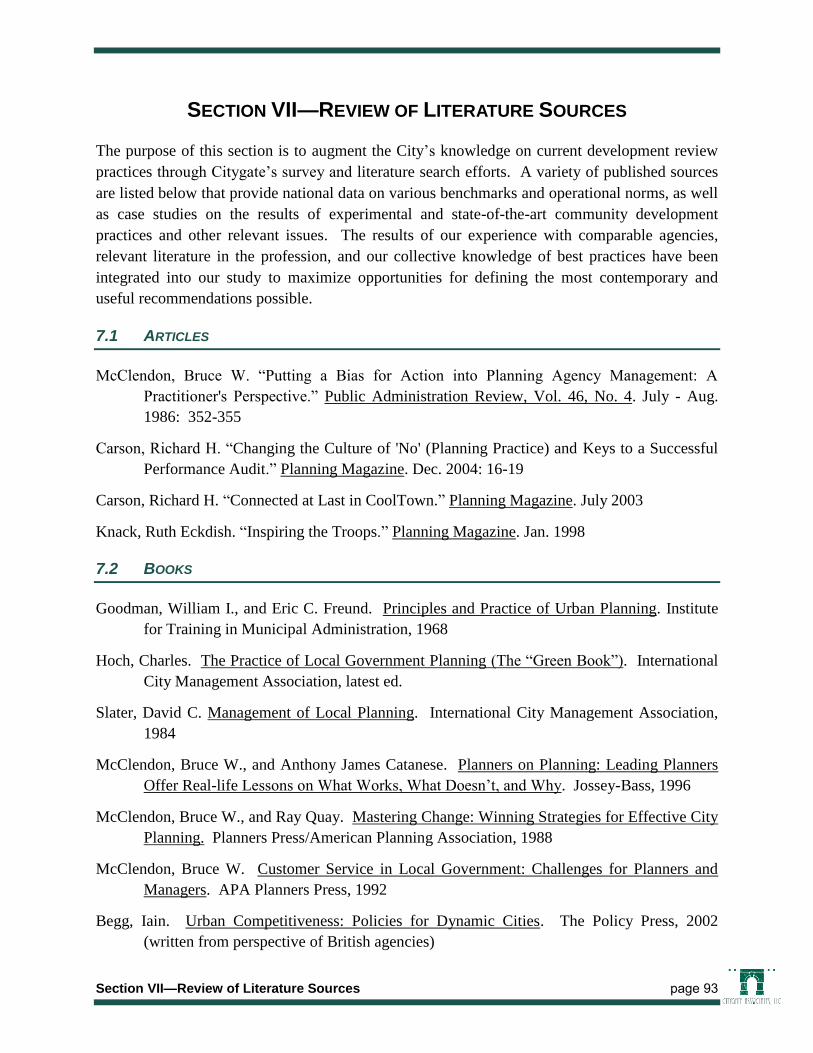
Section VII—Review of Literature Sources page 93
SECTION VII—REVIEW OF LITERATURE SOURCES
The purpose of this section is to augment the City’s knowledge on current development review
practices through Citygate’s survey and literature search efforts. A variety of published sources
are listed below that provide national data on various benchmarks and operational norms, as well
as case studies on the results of experimental and state-of-the-art community development
practices and other relevant issues. The results of our experience with comparable agencies,
relevant literature in the profession, and our collective knowledge of best practices have been
integrated into our study to maximize opportunities for defining the most contemporary and
useful recommendations possible.
7.1 ARTICLES
McClendon, Bruce W. “Putting a Bias for Action into Planning Agency Management: A
Practitioner's Perspective.” Public Administration Review, Vol. 46, No. 4. July - Aug.
1986: 352-355
Carson, Richard H. “Changing the Culture of 'No' (Planning Practice) and Keys to a Successful
Performance Audit.” Planning Magazine. Dec. 2004: 16-19
Carson, Richard H. “Connected at Last in CoolTown.” Planning Magazine. July 2003
Knack, Ruth Eckdish. “Inspiring the Troops.” Planning Magazine. Jan. 1998
7.2 BOOKS
Goodman, William I., and Eric C. Freund. Principles and Practice of Urban Planning. Institute
for Training in Municipal Administration, 1968
Hoch, Charles. The Practice of Local Government Planning (The “Green Book”). International
City Management Association, latest ed.
Slater, David C. Management of Local Planning. International City Management Association,
1984
McClendon, Bruce W., and Anthony James Catanese. Planners on Planning: Leading Planners
Offer Real-life Lessons on What Works, What Doesn’t, and Why. Jossey-Bass, 1996
McClendon, Bruce W., and Ray Quay. Mastering Change: Winning Strategies for Effective City
Planning. Planners Press/American Planning Association, 1988
McClendon, Bruce W. Customer Service in Local Government: Challenges for Planners and
Managers. APA Planners Press, 1992
Begg, Iain. Urban Competitiveness: Policies for Dynamic Cities. The Policy Press, 2002
(written from perspective of British agencies)

Section VII—Review of Literature Sources page 94
Duncan, James, and Arthur Nelson. Growth Management Principles and Practices. APA
Planners Press, 1995
Zucker, Paul. ABZs of Planning Management. West Coast Publishing, 1983
Branch, Melville. Urban Planning Theory. Dowden, Hutchinson & Ross, 1975
Chapin, Stuart, and Edward Kaiser. Urban Land Use Planning. University of Illinois Press,
1979
Blair, Fredrick. Planning Cities. APA Planners Press, 1970
7.2.1 General Public Agency Management
Radin, Beryl. Challenging the Performance Movement: Accountability, Complexity, and
Democratic Values (Public Management and Change). Georgetown University Press,
2006
Managing Government Services: A Practical Guide, 3rd ed. International City/County
Management Association
Agranoff, Robert, and Michael McGuire. Collaborative Public Management. Georgetown
University Press, 2003
Bryson, John M. Strategic Planning for Public and Nonprofit Organizations. Jossey-Bass, 1995
7.2.2 Management
A few interesting books for the manager:
Gardner, Howard, Mihaly Csikszentmihalyi, and William Damon. Good Work: When
Excellence and Ethics Meet. Basic Books, 2002
Csikszentmihalyi, Mihaly. Good Business: Leadership. Flow, and the Making of Meaning.
Viking, 2003
Susskind, Lawrence, and Patrick Field. Dealing with an Angry Public: The Mutual Gains
Approach to Resolving Disputes. The Free Press, 1996
7.2.3 Fiction
Fiction has innumerable lessons for the manager. A couple of metaphorical guides to managing
human assets that are also enjoyable reads:
Asprin, Robert Lynn. Phule’s Company. The Berkley Publishing Group, 1990
Asprin, Robert Lynn. Another Fine Myth. The Berkley Publishing Group, 1978
APPENDIX A
SAN LUIS OBISPO CUSTOMER SURVEY ANALYSIS

This page was intentionally left blank

Appendix A—Customer Survey Analysis: Overview and Methodology page 1
SECTION I—CUSTOMER SURVEY ANALYSIS: OVERVIEW AND
METHODOLOGY
Citygate conducted an Internet-based Customer Survey for customers of the City of San Luis
Obispo Community Development Department. The survey was “open” to accept input between
December 28, 2013 and January 25, 2013. The availability of the survey was advertised via hard
copy invitation letters sent to approximately 2,000 randomly-selected applicants who have had
an application processed within the past two years. Invitation letters were also available at the
Department’s front counter. In total, there were 129 completed surveys. 1
Details of the deployment are shown below.
Customer Survey
Launch Date 12/28/2013
Close Date 1/25/2013
Partials2 47
Completes3 129
The survey consisted of a number of closed-ended and yes/no questions with one concluding
open-ended question. Customers were asked to rate the divisions of Development Review,
Long-Range Planning, Building and Safety, and Public Works Engineering, and were only asked
to rate the division(s) they had business with.
Of the 129 total completed surveys, 59 customers responded to questions about Development
Review; 12 responded to questions about Long-Range Planning; 91 responded to questions about
Building and Safety; and 40 responded to questions about Public Works Engineering. For each
of the four divisions addressed in the survey, respondents were asked to rate their satisfaction
with specific aspects of each division. In the Development Review section of the survey, there
were 27 of these aspects; in the Long-Range Planning section, there were 18; in the Building and
Safety section, there were 27; and in the Public Works Engineering section, there were 26.
The rating scale for each aspect was “Far Exceeds Expectations” (5) to “Unacceptable” (1).
Respondents were also asked a few additional “yes” or “no” and rating scale questions with one
concluding open-ended question about the Community Development Department and the Public
Works Engineering Division overall.
1 While the number of responses is not statistically significant, these results, when used in tandem with the stakeholder
interviews, provide a very good indicator of the perceptions of customers. 2 “Partial” – the number of surveys that were begun but not completed. These surveys cannot be added to the database. 3 “Completes” – the number of surveys that were completed and successfully added to the database.
Appendix A—Customer Survey Analysis: Overview and Methodology page 2
It should be noted in reviewing the results that customers were not required to answer any
question. Additionally, they were permitted to respond “Not Applicable” to the rating
statements, and these responses are not included in the mean response calculations. Therefore,
the response totals do not always add to the totals of 59, 12, 91, or 40 completed surveys for
Development Review, Long-Range Planning, Building and Safety, and Public Works
Engineering, respectively.
ORGANIZATION OF ANALYSIS
This survey appendix is organized in the following order:
Classification Statements
The types of customers who responded to the survey are presented.
Detailed Results for each Division Surveyed
Detailed survey results for each division are presented in the following order: Development
Review, Long-Range Planning, Building and Safety, and Public Works Engineering. The results
for each division are presented in the following format:
Summary of Findings – The 5 statements receiving the overall highest and
lowest mean score.
Statistical Analysis for Each Statement – All the survey statements are
presented with the calculation of the Mean, Median, Mode and Standard
Deviation along with the percentage of each type of response. These are sorted
from highest to lowest mean score.
General and Yes/No Questions
The responses to 4 yes/no questions, 3 general closed-ended questions, and 1
general open-ended question are presented.
DEFINITION OF TERMS
The terms defined below are encountered in the information that follows:
Mean: An arithmetic mean that is the sum of the responses for each statement divided by the
number of responses for each statement.
Median: "Middle value" of a list. That is, half the numbers in the list are greater than the
median response and half are less.
Mode: The most frequently occurring number in a list. In the case of the Customer Survey, it
was the response (from “Far Exceeds Expectations” to “Unacceptable”) that was the most often
chosen for any one statement.

Appendix A—Customer Survey Analysis: Overview and Methodology page 3
Standard Deviation: Standard deviation tells how spread out the responses are from the
arithmetic mean. A standard deviation close to zero indicates that most responses are close to
the mean response and that a greater degree of agreement exists among survey takers with regard
to the statement. A greater standard deviation indicates that there was a wider spread of
variation in the responses and that a greater degree of disagreement exists among customers with
regard to the statement.

Appendix A—Customer Survey Analysis: Classification Statements page 4
SECTION II—CLASSIFICATION STATEMENTS
The survey began with the following classification statements. They are included here to
demonstrate the type of customers who responded to the survey.
* (e.g., engineer, architect, landscape architect, lawyer, planner, etc.)
** Other responses include: (1) Multi-unit dwellings/Building; (2) Owner/Contractor (3) Home owner/Builder;
(4) Local business; (5) Owner/Builder; (6) Chimney rebuild permit by our mason.
11%
64%
9%
4%
15%
5%
5%
3%
1%
0%
1%
0%
1%
0%
1%
0%
5%
0% 15% 30% 45% 60% 75%
Individual Applicant - frequent Individual Applicant - one-time/infrequent
Developer/Builder (company) - frequent Developer/Builder (company) - one-time/infrequent
Development Consultant* - frequent Development Consultant - one-time/infrequent
General or Subcontractor - frequent General or Subcontractor - one-time/infrequent
Commercial Real Estate Broker - frequent customer Commercial Real Estate Broker - one-time/infrequent
Councilmember - frequent customer Councilmember - one-time/infrequent
Homeowner/Resident - frequent customer Homeowner/Resident - one-time/infrequent
Non-profit developer - frequent customer Non-profit developer - one-time/infrequent
Other, please specify**
First, please mark all of the categories that apply to you as a customer.

Appendix A—Customer Survey Analysis: Classification Statements page 5
25%
47%
18%
16%
19%
19%
2%
6%
0% 10% 20% 30% 40% 50%
Single Family Detached - New construction
Single Family Detached - Modification
Single Family Attached/Multi-Family - New construction
Single Family Attached/Multi-Family - Modification
Commercial/Industrial Facility - New construction
Commercial/Industrial Facility - Modification
Church/Institutional - New construction
Church/Institutional - Modification
Please mark the types of project(s) you have been involved with.

Appendix A—Customer Survey Analysis: Development Review page 6
SECTION III—DEVELOPMENT REVIEW RESULTS
SUMMARY OF FINDINGS
The results for the Development Review section of the Customer Survey are summarized below.
Of the 129 total completed surveys, 59 customers responded to questions about Development
Review. As part of the survey, customers were asked to rate 27 specific aspects of Development
Review on a scale from “Far Exceeds Expectations” (5) to “Unacceptable” (1). This summary
includes the 5 highest ranking aspects and the 5 lowest ranking aspects.
5 Highest Ratings
(Presented in descending order. 5 is the highest score)
Subject Mean Median Mode Std Dev
Courtesy 4.03 4 4 0.76
Helpfulness of front counter assistance 3.82 4 4 0.92
Positive attitude 3.66 4 3 0.81
Knowledge of development review 3.61 4 4 0.79
Providing complete process information at public counter 3.47 3 3 0.99
The mean of each response is presented graphically below.
4.03
3.82
3.66
3.61
3.47
1.00 2.00 3.00 4.00 5.00
Courtesy
Helpfulness of front counter assistance
Positive attitude
Knowledge of development review
Providing complete process information at public counter
5 Highest Ratings(presented in descending order)

Appendix A—Customer Survey Analysis: Development Review page 7
5 Lowest Ratings
(Presented in ascending order. 1 is the lowest score)
Subject Mean Median Mode Std Dev
Cost of processing application (fees) 2.17 2 2 1.12
Complexity of regulations 2.42 3 3 1.05
Processing / turnaround times of construction plan review 2.45 2 2 1.16
Understanding of private business 2.45 2 2 1.19
Coordinated review between divisions and departments of the City 2.55 3 2 1.04
The mean of each response is presented graphically below.
2.17
2.42
2.45
2.45
2.55
1.00 2.00 3.00 4.00 5.00
Cost of processing application (fees)
Complexity of regulations
Processing / turnaround times of construction plan review
Understanding of private business
Coordinated review between divisions and departments of the City
5 Lowest Ratings(presented in ascending order)

Appendix A—Customer Survey Analysis: Development Review page 8
STATISTICAL ANALYSIS FOR EACH STATEMENT (SORTED HIGHEST TO LOWEST)
Below, each of the 27 aspects are presented with the calculation of the Mean, Median, Mode and Standard Deviation along with the
percentage of each type of response, including “Not Applicable” and those left blank. They are presented from highest to lowest.
Statistical Analysis for Each Statement – Development Review
Mean Median Mode
Std
Dev
% Far
Exceeds
Expctn.
%
Above
Expctn.
% Met
Expctn.
% Below
Expctn.
%
Unaccept-
able
% Not
Applicable
% Left
Blank Total
Courtesy 4.03 4 4 0.76 31% 42% 27% 0% 0% 0% 0% 100%
Helpfulness of front counter assistance 3.82 4 4 0.92 25% 32% 29% 7% 0% 7% 0% 100%
Positive attitude 3.66 4 3 0.81 17% 34% 44% 3% 0% 0% 2% 100%
Knowledge of development review 3.61 4 4 0.79 12% 44% 37% 7% 0% 0% 0% 100%
Providing complete process information at public counter
3.47 3 3 0.99 19% 17% 44% 8% 2% 10% 0% 100%
Providing consistent and dependable process information at public counter
3.35 3 3 1.03 15% 19% 37% 15% 2% 12% 0% 100%
Ease of accessing project manager to discuss project
3.32 3 3 1.11 17% 19% 34% 17% 3% 10% 0% 100%
Helpfulness of informative handouts on processes
3.27 3 3 0.94 8% 20% 41% 8% 3% 17% 2% 100%
Responsiveness to / consideration of customer concerns
3.21 3 3 1.05 12% 25% 34% 22% 3% 2% 2% 100%
Returning phone calls in a timely manner 3.20 3 3 1.19 17% 19% 31% 20% 7% 7% 0% 100%
Fulfilling commitments 3.19 3 3 1.03 12% 25% 32% 27% 2% 2% 0% 100%
Communication on project status 3.19 3 3 0.93 8% 22% 41% 19% 2% 8% 0% 100%

Appendix A—Customer Survey Analysis: Development Review page 9
Statistical Analysis for Each Statement – Development Review
Mean Median Mode
Std
Dev
% Far
Exceeds
Expctn.
%
Above
Expctn.
% Met
Expctn.
% Below
Expctn.
%
Unaccept-
able
% Not
Applicable
% Left
Blank Total
Use of technology (web site, plan check, document submittal)
3.16 3 3 0.91 5% 25% 34% 19% 2% 14% 2% 100%
Overall process 3.09 3 4 0.98 5% 32% 31% 27% 3% 2% 0% 100%
Process of "minor" changes to plans 3.08 3 3 0.92 3% 27% 29% 24% 2% 15% 0% 100%
Customer service when compared with cities within San Luis Obispo County
3.03 3 3 1.11 5% 14% 24% 8% 7% 41% 2% 100%
Timeliness/number of re-checks 3.02 3 3 1.04 10% 12% 41% 20% 5% 12% 0% 100%
Ability to solve problems as opposed to create problems
3.02 3 4 1.23 12% 25% 24% 24% 12% 3% 0% 100%
Accuracy/consistency of code interpretations
2.93 3 3 0.91 3% 19% 42% 22% 5% 7% 2% 100%
Clarity of codes and policies 2.84 3 3 1.10 5% 24% 31% 25% 12% 3% 0% 100%
Process for tentative/parcel map approval 2.80 3 3 0.91 0% 8% 22% 7% 5% 54% 3% 100%
Process for final/parcel map approval 2.71 3 3 0.91 0% 7% 20% 8% 5% 56% 3% 100%
Coordinated review between divisions and departments of the City
2.55 3 2 1.04 2% 14% 25% 25% 14% 20% 0% 100%
Understanding of private business 2.45 2 2 1.19 5% 10% 15% 27% 17% 24% 2% 100%
Processing / turnaround times of construction plan review
2.45 2 2 1.16 2% 19% 15% 27% 20% 17% 0% 100%
Complexity of regulations 2.42 3 3 1.05 0% 14% 37% 17% 25% 7% 0% 100%
Cost of processing application (fees) 2.17 2 2 1.12 2% 14% 14% 31% 31% 10% 0% 100%

Appendix A—Customer Survey Analysis: Long-Range Planning page 10
SECTION IV—LONG-RANGE PLANNING RESULTS
SUMMARY OF FINDINGS
The results for the Long-Range Planning section of the Customer Survey are summarized below.
Of the 129 total completed surveys, 10 customers responded to questions about Long-Range
Planning. As part of the survey, customers were asked to rate 18 specific aspects of Long-Range
Planning on a scale from “Far Exceeds Expectations” (5) to “Unacceptable” (1). This summary
includes the 5 highest ranking aspects and the 5 lowest ranking aspects.
5 Highest Ratings
(Presented in descending order. 5 is the highest score)
Subject Mean Median Mode Std Dev
Courtesy 4.60 5 5 0.52
Positive attitude 4.50 5 5 0.53
Helpfulness and inclusiveness 4.22 5 5 1.09
Knowledge of long-range planning 4.20 4 4 0.63
Use of technology (web site, plan check, document submittal) 4.00 4 4 0.82
Ease of accessing project manager to discuss project 4.00 4 5 1.05
The mean of each response is presented graphically below.
4.60
4.50
4.22
4.20
4.00
4.00
1.00 2.00 3.00 4.00 5.00
Courtesy
Positive attitude
Helpfulness and inclusiveness
Knowledge of long-range planning
Use of technology (web site, plan check, document submittal)
Ease of accessing project manager to discuss project
5 Highest Ratings(presented in descending order)
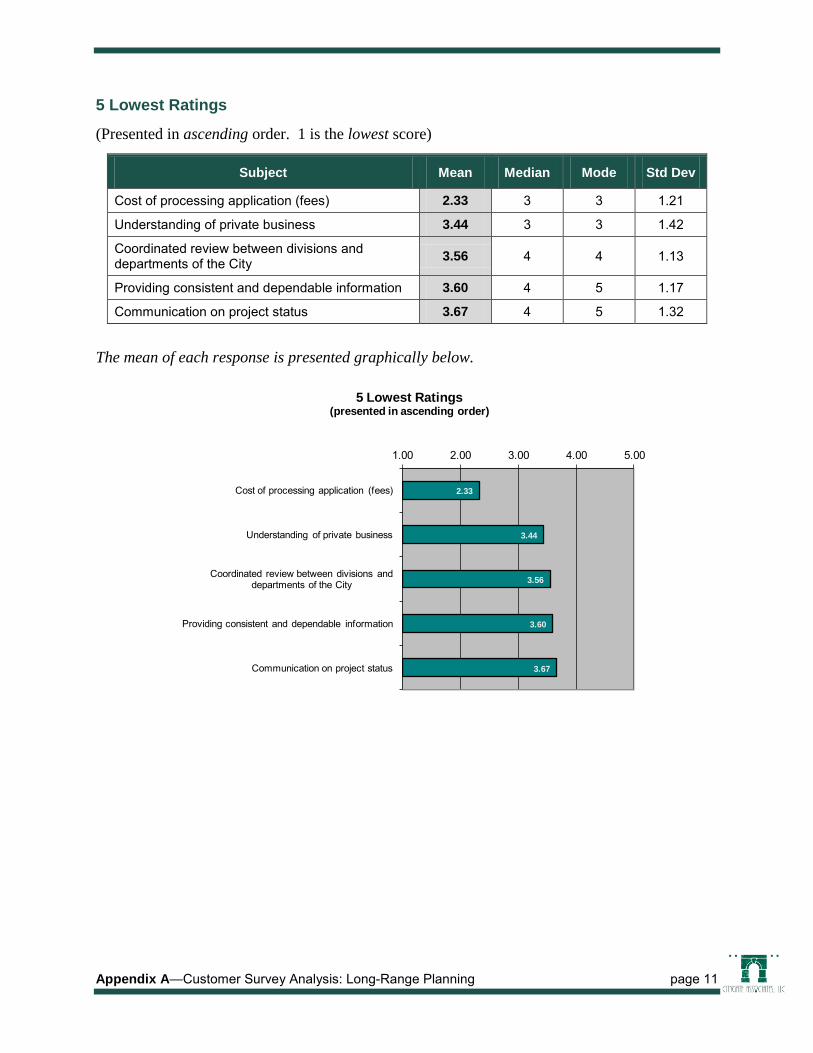
Appendix A—Customer Survey Analysis: Long-Range Planning page 11
5 Lowest Ratings
(Presented in ascending order. 1 is the lowest score)
Subject Mean Median Mode Std Dev
Cost of processing application (fees) 2.33 3 3 1.21
Understanding of private business 3.44 3 3 1.42
Coordinated review between divisions and departments of the City 3.56 4 4 1.13
Providing consistent and dependable information 3.60 4 5 1.17
Communication on project status 3.67 4 5 1.32
The mean of each response is presented graphically below.
2.33
3.44
3.56
3.60
3.67
1.00 2.00 3.00 4.00 5.00
Cost of processing application (fees)
Understanding of private business
Coordinated review between divisions and departments of the City
Providing consistent and dependable information
Communication on project status
5 Lowest Ratings(presented in ascending order)

Appendix A—Customer Survey Analysis: Long-Range Planning page 12
STATISTICAL ANALYSIS FOR EACH STATEMENT (SORTED HIGHEST TO LOWEST)
Below, each of the 18 aspects are presented with the calculation of the Mean, Median, Mode and Standard Deviation along with the
percentage of each type of response, including “Not Applicable” and those left blank. They are presented from highest to lowest.
Statistical Analysis for Each Statement - Long-Range Planning
Mean Median Mode
Std
Dev
% Far
Exceeds
Expctn.
%
Above
Expctn.
% Met
Expctn.
% Below
Expctn.
%
Unaccept-
able
% Not
Applicable
% Left
Blank Total
Courtesy 4.60 5 5 0.52 50% 33% 0% 0% 0% 0% 17% 100%
Positive attitude 4.50 5 5 0.53 42% 42% 0% 0% 0% 0% 17% 100%
Helpfulness and inclusiveness 4.22 5 5 1.09 42% 17% 8% 8% 0% 8% 17% 100%
Knowledge of long-range planning 4.20 4 4 0.63 25% 50% 8% 0% 0% 0% 17% 100%
Use of technology (web site, plan check, document submittal) 4.00 4 4 0.82 25% 33% 25% 0% 0% 0% 17% 100%
Ease of accessing project manager to discuss project 4.00 4 5 1.05 33% 25% 17% 8% 0% 0% 17% 100%
Customer service when compared with cities within San Luis Obispo County 3.86 4 5 1.46 25% 17% 8% 0% 8% 25% 17% 100%
Responsiveness to / consideration of customer concerns 3.80 4 5 1.23 33% 17% 17% 17% 0% 0% 17% 100%
Overall process 3.80 4 5 1.32 42% 0% 25% 17% 0% 0% 17% 100%
Fulfilling commitments 3.78 4 5 1.30 33% 8% 17% 17% 0% 8% 17% 100%
Returning phone calls in a timely manner 3.78 3 5 1.20 33% 0% 33% 8% 0% 8% 17% 100%
Providing complete information 3.70 4 3 1.06 25% 17% 33% 8% 0% 0% 17% 100%
Ability to solve problems as opposed to create problems 3.70 4 5 1.16 25% 25% 17% 17% 0% 0% 17% 100%
Communication on project status 3.67 4 5 1.32 25% 17% 25% 0% 8% 8% 17% 100%
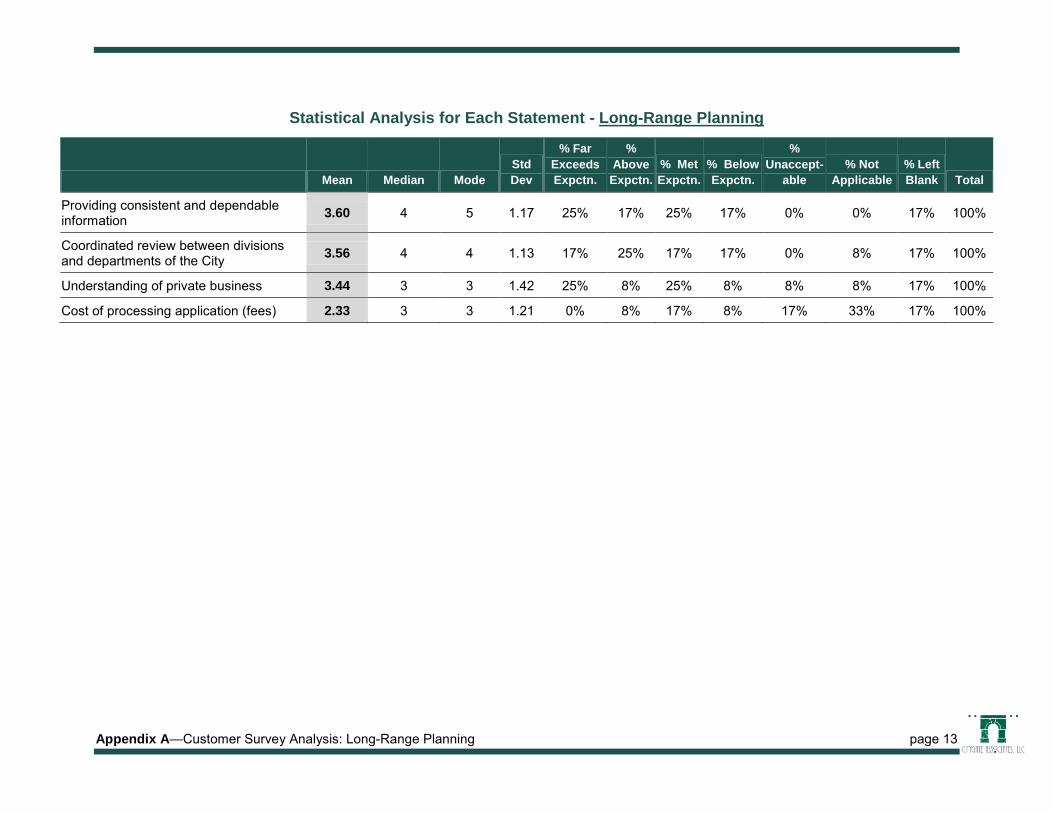
Appendix A—Customer Survey Analysis: Long-Range Planning page 13
Statistical Analysis for Each Statement - Long-Range Planning
Mean Median Mode
Std
Dev
% Far
Exceeds
Expctn.
%
Above
Expctn.
% Met
Expctn.
% Below
Expctn.
%
Unaccept-
able
% Not
Applicable
% Left
Blank Total
Providing consistent and dependable information 3.60 4 5 1.17 25% 17% 25% 17% 0% 0% 17% 100%
Coordinated review between divisions and departments of the City 3.56 4 4 1.13 17% 25% 17% 17% 0% 8% 17% 100%
Understanding of private business 3.44 3 3 1.42 25% 8% 25% 8% 8% 8% 17% 100%
Cost of processing application (fees) 2.33 3 3 1.21 0% 8% 17% 8% 17% 33% 17% 100%
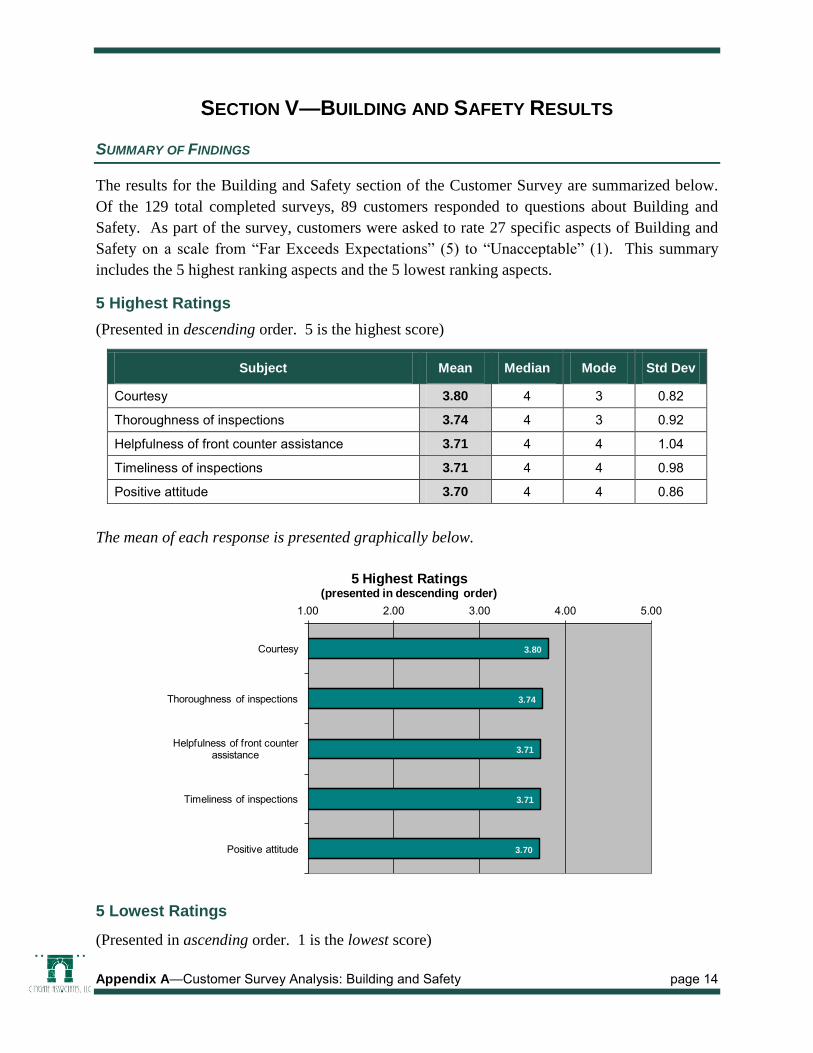
Appendix A—Customer Survey Analysis: Building and Safety page 14
SECTION V—BUILDING AND SAFETY RESULTS
SUMMARY OF FINDINGS
The results for the Building and Safety section of the Customer Survey are summarized below.
Of the 129 total completed surveys, 89 customers responded to questions about Building and
Safety. As part of the survey, customers were asked to rate 27 specific aspects of Building and
Safety on a scale from “Far Exceeds Expectations” (5) to “Unacceptable” (1). This summary
includes the 5 highest ranking aspects and the 5 lowest ranking aspects.
5 Highest Ratings
(Presented in descending order. 5 is the highest score)
Subject Mean Median Mode Std Dev
Courtesy 3.80 4 3 0.82
Thoroughness of inspections 3.74 4 3 0.92
Helpfulness of front counter assistance 3.71 4 4 1.04
Timeliness of inspections 3.71 4 4 0.98
Positive attitude 3.70 4 4 0.86
The mean of each response is presented graphically below.
5 Lowest Ratings
(Presented in ascending order. 1 is the lowest score)
3.80
3.74
3.71
3.71
3.70
1.00 2.00 3.00 4.00 5.00
Courtesy
Thoroughness of inspections
Helpfulness of front counter assistance
Timeliness of inspections
Positive attitude
5 Highest Ratings(presented in descending order)

Appendix A—Customer Survey Analysis: Building and Safety page 15
Subject Mean Median Mode Std Dev
Cost of processing applications (fees) 2.48 3 3 1.21
Understanding of private business 2.72 3 3 1.29
Coordinated review between divisions and departments of the City 2.93 3 3 1.12
Complexity of regulations 2.93 3 3 1.06
Accuracy/consistency of code interpretations 3.06 3 3 1.06
The mean of each response is presented graphically below.
2.48
2.72
2.93
2.93
3.06
1.00 2.00 3.00 4.00 5.00
Cost of processing applications (fees)
Understanding of private business
Coordinated review between divisions and departments of the City
Complexity of regulations
Accuracy/consistency of code interpretations
5 Lowest Ratings(presented in ascending order)

Appendix A—Customer Survey Analysis: Building and Safety page 16
STATISTICAL ANALYSIS FOR EACH STATEMENT (SORTED HIGHEST TO LOWEST)
Below, each of the 27 aspects are presented with the calculation of the Mean, Median, Mode and Standard Deviation along with the
percentage of each type of response, including “Not Applicable” and those left blank. They are presented from highest to lowest.
Statistical Analysis for Each Statement - Building and Safety
Mean Median Mode
Std
Dev
% Far
Exceeds
Expctn.
%
Above
Expctn.
% Met
Expctn.
% Below
Expctn.
%
Unaccept-
able
% Not
Applicable
% Left
Blank Total
Courtesy 3.80 4 3 0.82 22% 35% 36% 2% 0% 1% 3% 100%
Thoroughness of inspections 3.74 4 3 0.92 22% 26% 35% 3% 1% 10% 2% 100%
Helpfulness of front counter assistance 3.71 4 4 1.04 20% 34% 21% 7% 3% 13% 2% 100%
Timeliness of inspections 3.71 4 4 0.98 21% 29% 26% 8% 1% 10% 5% 100%
Positive attitude 3.70 4 4 0.86 19% 36% 34% 7% 0% 1% 3% 100%
Knowledge of building and safety 3.64 4 4 0.86 16% 36% 35% 8% 0% 2% 2% 100%
Providing complete process information at public counter 3.55 3 3 0.99 18% 21% 40% 3% 3% 13% 2% 100%
Fulfilling commitments 3.46 3 3 0.99 16% 24% 40% 10% 2% 3% 4% 100%
Ease of accessing project manager to discuss project 3.43 3 3 1.06 16% 14% 34% 10% 2% 20% 3% 100%
Thoroughness of plan review 3.38 3 3 0.92 12% 19% 44% 7% 2% 13% 3% 100%
Providing consistent and dependable process information at public counter 3.38 3 3 1.03 14% 19% 41% 7% 4% 13% 2% 100%
Providing complete upfront information regarding inspections 3.36 3 3 1.05 14% 19% 37% 9% 4% 13% 3% 100%
Returning phone calls in a timely manner 3.34 3 3 1.11 14% 21% 29% 13% 4% 16% 2% 100%
Helpfulness of informative handouts on processes 3.33 3 3 0.96 12% 13% 42% 8% 2% 20% 3% 100%

Appendix A—Customer Survey Analysis: Building and Safety page 17
Statistical Analysis for Each Statement - Building and Safety
Mean Median Mode
Std
Dev
% Far
Exceeds
Expctn.
%
Above
Expctn.
% Met
Expctn.
% Below
Expctn.
%
Unaccept-
able
% Not
Applicable
% Left
Blank Total
Customer service when compared with cities within San Luis Obispo County 3.31 3 3 1.14 10% 13% 22% 7% 4% 41% 3% 100%
Responsiveness to / consideration of customer concerns 3.26 3 3 1.10 12% 25% 32% 13% 7% 9% 2% 100%
Use of technology (web site, plan check, document submittal) 3.26 3 3 1.02 11% 16% 33% 14% 2% 20% 3% 100%
Communication on project status 3.22 3 3 1.07 12% 19% 37% 13% 5% 10% 3% 100%
Overall process 3.18 3 3 1.06 12% 19% 43% 13% 7% 3% 3% 100%
Ability to solve problems as opposed to create problems 3.13 3 4 1.19 12% 26% 26% 19% 10% 4% 2% 100%
Clarity of regulations 3.08 3 3 1.04 11% 15% 45% 16% 7% 4% 1% 100%
Processing / turnaround times of application review 3.07 3 3 1.10 11% 19% 35% 21% 7% 5% 2% 100%
Accuracy/consistency of code interpretations 3.06 3 3 1.06 10% 18% 35% 21% 5% 10% 1% 100%
Complexity of regulations 2.93 3 3 1.06 8% 16% 38% 21% 9% 7% 1% 100%
Coordinated review between divisions and departments of the City 2.93 3 3 1.12 8% 12% 31% 15% 9% 23% 2% 100%
Understanding of private business 2.72 3 3 1.29 9% 9% 22% 15% 15% 25% 4% 100%
Cost of processing applications (fees) 2.48 3 3 1.21 5% 12% 32% 16% 27% 3% 3% 100%

Appendix A—Customer Survey Analysis: Public Works Engineering page 18
SECTION VI—PUBLIC WORKS ENGINEERING RESULTS
SUMMARY OF FINDINGS
The results for the Public Works Engineering section of the Customer Survey are summarized
below. Of the 129 total completed surveys, 38 customers responded to questions about Public
Works Engineering. As part of the survey, customers were asked to rate 26 specific aspects of
Public Works Engineering on a scale from “Far Exceeds Expectations” (5) to “Unacceptable”
(1). This summary includes the 5 highest ranking aspects and the 5 lowest ranking aspects.
5 Highest Ratings
(Presented in descending order. 5 is the highest score)
Subject Mean Median Mode Std Dev
Courtesy 3.95 4 4 0.73
Knowledge of public works engineering 3.76 4 4 0.79
Positive attitude 3.71 4 3 0.80
Helpfulness of front counter assistance 3.54 4 4 0.82
Providing complete process information at public counter 3.20 3 3 0.87
The mean of each response is presented graphically below.
5 Lowest Ratings
3.95
3.76
3.71
3.54
3.20
1.00 2.00 3.00 4.00 5.00
Courtesy
Knowledge of public works engineering
Positive attitude
Helpfulness of front counter assistance
Providing complete process information at public counter
5 Highest Ratings(presented in descending order)

Appendix A—Customer Survey Analysis: Public Works Engineering page 19
(Presented in ascending order. 1 is the lowest score)
Subject Mean Median Mode Std Dev
Cost of processing application (fees) 2.22 2 1 1.17
Processing / turnaround times of construction plan review 2.27 2 1 1.22
Coordinated review between divisions and departments of the City 2.44 2 1 1.28
Understanding of private business 2.47 2 1 1.19
Timeliness/number of re-checks 2.53 3 3 1.21
The mean of each response is presented graphically below.
2.22
2.27
2.44
2.47
2.53
1.00 2.00 3.00 4.00 5.00
Cost of processing application (fees)
Processing / turnaround times of construction plan review
Coordinated review between divisions and departments of the City
Understanding of private business
Timeliness/number of re-checks
5 Lowest Ratings(presented in ascending order)

Appendix A—Customer Survey Analysis: Public Works Engineering page 20
STATISTICAL ANALYSIS FOR EACH STATEMENT (SORTED HIGHEST TO LOWEST)
Below, each of the 26 aspects are presented with the calculation of the Mean, Median, Mode and Standard Deviation along with the
percentage of each type of response, including “Not Applicable” and those left blank. They are presented from highest to lowest.
Statistical Analysis for Each Statement - Public Works Engineering
Mean Median Mode
Std
Dev
% Far
Exceeds
Expctn.
%
Above
Expctn.
% Met
Expctn.
% Below
Expctn.
%
Unaccept-
able
% Not
Applicable
% Left
Blank Total
Courtesy 3.95 4 4 0.73 23% 45% 28% 0% 0% 0% 5% 100%
Knowledge of public works engineering 3.76 4 4 0.79 18% 40% 35% 3% 0% 0% 5% 100%
Positive attitude 3.71 4 3 0.80 18% 35% 40% 3% 0% 0% 5% 100%
Helpfulness of front counter assistance 3.54 4 4 0.82 10% 35% 35% 8% 0% 8% 5% 100%
Providing complete process information at public counter 3.20 3 3 0.87 8% 18% 50% 10% 3% 8% 5% 100%
Providing consistent and dependable process information at public counter 3.09 3 3 0.95 8% 18% 40% 20% 3% 8% 5% 100%
Use of technology (web site, plan check, document submittal) 3.06 3 3 1.06 8% 15% 38% 10% 8% 15% 8% 100%
Helpfulness of informative handouts on processes 3.03 3 3 0.96 8% 10% 38% 18% 3% 20% 5% 100%
Accuracy/consistency of code interpretations 2.92 3 3 1.06 8% 18% 35% 25% 8% 3% 5% 100%
Fulfilling commitments 2.89 3 3 1.23 15% 10% 30% 30% 10% 0% 5% 100%
Overall process 2.89 3 3 1.03 8% 18% 33% 33% 5% 0% 5% 100%
Process of "minor" changes to plans 2.89 3 3 1.05 5% 18% 38% 18% 10% 8% 5% 100%
Customer service when compared with cities within San Luis Obispo County 2.88 3 3 1.03 3% 15% 28% 13% 8% 28% 8% 100%

Appendix A—Customer Survey Analysis: Public Works Engineering page 21
Statistical Analysis for Each Statement - Public Works Engineering
Mean Median Mode
Std
Dev
% Far
Exceeds
Expctn.
%
Above
Expctn.
% Met
Expctn.
% Below
Expctn.
%
Unaccept-
able
% Not
Applicable
% Left
Blank Total
Responsiveness to / consideration of customer concerns 2.87 3 2 1.14 10% 18% 25% 35% 8% 0% 5% 100%
Ease of accessing project manager to discuss project 2.86 3 2 1.17 10% 15% 28% 28% 10% 5% 5% 100%
Clarity of codes and policies 2.82 3 3 1.06 8% 15% 33% 33% 8% 0% 5% 100%
Ability to solve problems as opposed to create problems 2.79 3 2 1.21 10% 18% 23% 33% 13% 0% 5% 100%
Communication on project status 2.78 3 3 1.20 10% 10% 35% 20% 15% 3% 8% 100%
Returning phone calls in a timely manner 2.69 3 3 1.12 8% 10% 33% 28% 13% 5% 5% 100%
Complexity of regulations 2.59 3 3 1.12 5% 13% 33% 25% 18% 0% 8% 100%
Process for final/parcel map approval 2.58 2 2 1.22 3% 10% 10% 15% 10% 43% 10% 100%
Timeliness/number of re-checks 2.53 3 3 1.21 5% 15% 25% 23% 23% 5% 5% 100%
Understanding of private business 2.47 2 1 1.19 3% 18% 20% 23% 23% 8% 8% 100%
Coordinated review between divisions and departments of the City 2.44 2 1 1.28 5% 15% 20% 18% 28% 10% 5% 100%
Processing / turnaround times of construction plan review 2.27 2 1 1.22 5% 10% 23% 23% 33% 3% 5% 100%
Cost of processing application (fees) 2.22 2 1 1.17 5% 3% 35% 13% 35% 5% 5% 100%
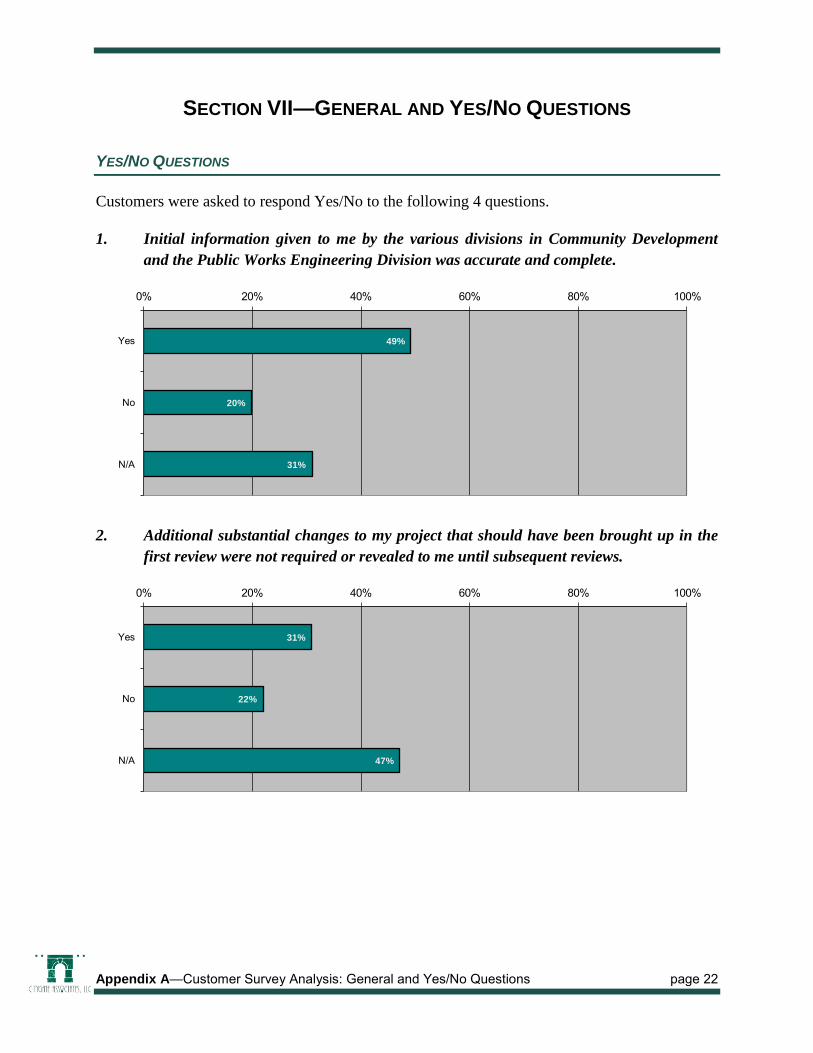
Appendix A—Customer Survey Analysis: General and Yes/No Questions page 22
SECTION VII—GENERAL AND YES/NO QUESTIONS
YES/NO QUESTIONS
Customers were asked to respond Yes/No to the following 4 questions.
1. Initial information given to me by the various divisions in Community Development
and the Public Works Engineering Division was accurate and complete.
2. Additional substantial changes to my project that should have been brought up in the
first review were not required or revealed to me until subsequent reviews.
49%
20%
31%
0% 20% 40% 60% 80% 100%
Yes
No
N/A
31%
22%
47%
0% 20% 40% 60% 80% 100%
Yes
No
N/A

Appendix A—Customer Survey Analysis: General and Yes/No Questions page 23
3. I would consider the option to pay extra for "express" processing.
4. I would consider the option to pay increased fees if it would increase timeliness and
quality of work.
24%
54%
22%
0% 20% 40% 60% 80% 100%
Yes
No
N/A
14%
66%
20%
0% 20% 40% 60% 80% 100%
Yes
No
N/A

Appendix A—Customer Survey Analysis: General and Yes/No Questions page 24
GENERAL QUESTIONS
Customers were also asked to respond to the following 3 general questions.
1. In my experience, the cost of processing any permit or application with the City of San
Luis Obispo when compared to the same type of permit/application in other
jurisdictions in the San Luis Obispo County area is:
2. In my experience, the time to process any permit/application with the City of San Luis
Obispo when compared to the same type of permit/application in other jurisdictions in
the San Luis Obispo County area is:
37%
21%
2%
40%
0% 20% 40% 60% 80% 100%
Significantly More
About the Same
Significantly Less
N/A
25%
30%
4%
41%
0% 20% 40% 60% 80% 100%
Significantly More
About the Same
Significantly Less
N/A
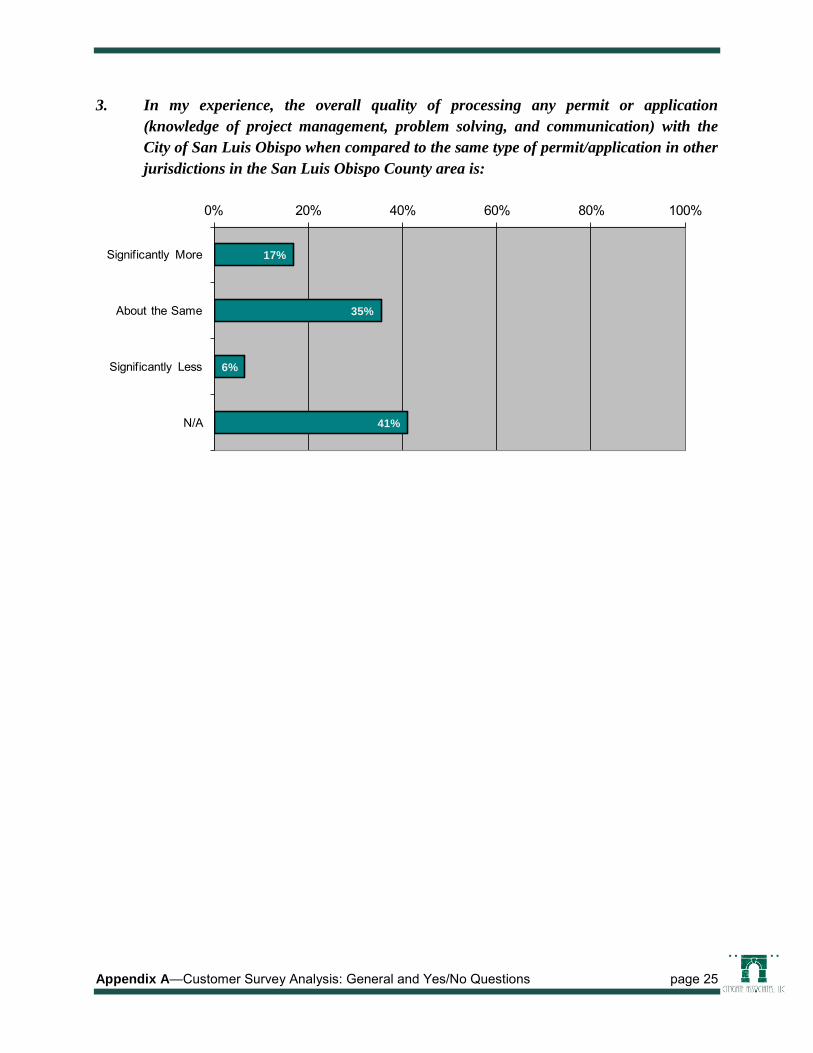
Appendix A—Customer Survey Analysis: General and Yes/No Questions page 25
3. In my experience, the overall quality of processing any permit or application
(knowledge of project management, problem solving, and communication) with the
City of San Luis Obispo when compared to the same type of permit/application in other
jurisdictions in the San Luis Obispo County area is:
17%
35%
6%
41%
0% 20% 40% 60% 80% 100%
Significantly More
About the Same
Significantly Less
N/A

Appendix A—Customer Survey Analysis: General and Yes/No Questions page 26
Please add any specific comments or suggestions you may have for improving services in the
City's Community Development Department and Public Works Engineering Division.
Count Customer OVERALL Responses (Summarized)
12 Improve timeliness of decisions and process flow; reduce time of checking process and plan reviews; approve simple construction over-the-counter, rather than require multi-week reviews.
9 Permit/development/building fees too expensive; permit fees for development are more expensive than other communities; professional and time considerations of plan check services should not require extra fees.
7 City is too restrictive/has too many regulations; apply regulations in a reasonable, goal-oriented fashion; distinguish between "regulations" and "guidelines."
5 Letters to customers should encourage cooperation and not be threatening / intimidating; better communication to customers regarding expected timeframe, costs, and procedures in the Planning process; make review process more "applicant friendly."
4 Better communication and organization between all departments; permitting process breaks down at Public Works.
3 Increase counter hours and leave door unlocked during business hours.
2 Learn from other cities' example including Pismo Beach, Grover Beach, Los Angeles.
2 Use one computerized process between all departments to improve consistency.
2 Staff improvement needed (customer service, project management, familiarity with state regulations).
2 Assign each project a "project review manager" who stays with the project until the end and is not substituted by another staff member.
1 Reduce number of committees and boards and delegate authority to make decisions to staff who can appeal to a board or commission.
1 One part-time contract map checker is inadequate.
1 Community Development policies conflict each other.
1 City should uphold themselves to the high standards they require from their customers.
1 City should perform a review of Neighborhood Services and Code Enforcement.
1 Lack of thoroughness in plan check process.
1 Planning Department seems subjective when reviewing properties with historical significance.
APPENDIX B
SAN LUIS OBISPO EMPLOYEE SURVEY ANALYSIS

This page was intentionally left blank

Appendix B—Employee Survey Analysis: Overview and Methodology page 1
SECTION I—EMPLOYEE SURVEY ANALYSIS: OVERVIEW AND
METHODOLOGY
Citygate conducted an Internet-based Employee Survey for staff in the divisions of Development
Review, Long-Range Planning, Building and Safety, Administration, Public Works Engineering,
Utilities, and Fire Prevention involved in the Community Development
Department/Development Permit Review Process of San Luis Obispo. This survey consisted of
the same closed-ended questions asked about the divisions of Development Review, Long-Range
Planning, Building and Safety, and Public Works Engineering in the Customer Survey that
Citygate conducted prior to the Employee Survey. The purpose of the survey was to understand
how similar or dissimilar the staff opinions were of how they were performing compared to the
customers’ perception. A summary of this comparison is provided in Section 3.6 of the main
report.
The survey was “open” to accept input between January 31 and February 21, 2013. The
availability of the survey was announced via direct email invitations to staff. In total, there were
28 completed surveys.
Details of the deployment are shown below.
Employee Survey
Launch Date 1/31/2013
Close Date 2/21/2013
Partials1 11
Completes2 28
Of the 28 total completed surveys, 10 employees responded from Development Review; 4
responded from Long-Range Planning; 6 responded from Building and Safety; 6 responded from
Administration; 4 responded from Public Works Engineering; 0 responded from Utilities; and 1
responded from Fire Prevention.3
For each of the seven divisions addressed in the survey, employees were asked to rate their
perception of how they were performing regarding a number specific aspects. In the
Development Review section of the survey, there were 27 of these aspects; in the Long-Range
Planning section, there were 18; in the Building and Safety section, there were 27; in the
1 “Partial” – the number of surveys that were begun but not completed. These surveys cannot be added to the database. 2 “Completes” – the number of surveys that were completed and successfully added to the database. 3 The response totals of 10, 4, 6, 6, 4 and 1 for Development Review, Long-Range Planning, Building and Safety,
Administration, Public Works Engineering, and Fire Prevention, respectively, do not add up to 28 since several employees
completed the survey for more than one division.

Appendix B—Employee Survey Analysis: Overview and Methodology page 2
Administration section, there were 24; in the Public Works Engineering section, there were 26;
in the Utilities section, there were 26; and in the Fire Prevention section, there were 27.
The rating scale for each aspect was “Far Exceeds Expectations” (5) to “Unacceptable” (1).
Respondents were also asked one open-ended question about the Community Development
Department/Development Permit Review Process overall.
It should be noted in reviewing the results that employees were not required to answer any
question. Additionally, they were permitted to respond “Not Applicable” to the rating
statements, and these responses were excluded from the mean response calculations. Therefore,
the response totals do not always add to the totals of 10, 4, 6, 6, 4 or 1 completed surveys for
Development Review, Long-Range Planning, Building and Safety, Administration, Public Works
Engineering, and Fire Prevention, respectively.
ORGANIZATION OF ANALYSIS
Detailed Results for each Division Surveyed
Detailed survey results for each division are presented in the following order: Development
Review, Long-Range Planning, Building and Safety, Administration, Public Works Engineering,
and Fire Prevention. Results are not provided for Utilities since there were no survey responses.
The results for each division are presented in the following format:
Summary of Findings – The statements receiving the overall highest and lowest
mean score.
Statistical Analysis for Each Statement – All the survey statements are
presented with the calculation of the Mean, Median, Mode and Standard
Deviation along with the percentage of each type of response. These are sorted
from highest to lowest mean score.
DEFINITION OF TERMS
The terms defined below are encountered in the information that follows:
Mean: An arithmetic mean that is the sum of the responses for each statement divided by the
number of responses for each statement.
Median: "Middle value" of a list. That is, half the numbers in the list are greater than the
median response and half are less.
Mode: The most frequently occurring number in a list. In the case of the Employee Survey, it
was the response (from “Far Exceeds Expectations” to “Unacceptable”) that was the most often
chosen for any one statement.

Appendix B—Employee Survey Analysis: Overview and Methodology page 3
Standard Deviation: Standard deviation tells how spread out the responses are from the
arithmetic mean. A standard deviation close to zero indicates that most responses are close to
the mean response and that a greater degree of agreement exists among survey takers with regard
to the statement. A greater standard deviation indicates that there was a wider spread of
variation in the responses and that a greater degree of disagreement exists among employees with
regard to the statement.

Appendix B—Employee Survey Analysis: Development Review page 4
SECTION II—DEVELOPMENT REVIEW RESULTS
SUMMARY OF FINDINGS
The results for the Development Review section of the Employee Survey are summarized below.
Of the 28 total completed surveys, 10 employees responded from Development Review. As part
of the survey, employees were asked to rate 27 specific aspects of Development Review on a
scale from “Far Exceeds Expectations” (5) to “Unacceptable” (1). This summary includes the 5
highest ranking aspects and the 5 lowest ranking aspects.
5 Highest Ratings
(Presented in descending order. 5 is the highest score)
Subject Mean Median Mode Std Dev
Customer service when compared with cities within San Luis Obispo County 4.70 5 5 0.48
Knowledge of development review 4.50 4.5 4 0.53
Helpfulness of front counter assistance 4.50 5 5 0.71
Ease of accessing project manager to discuss project 4.50 4.5 5 0.53
Courtesy 4.40 4 4 0.52
Providing complete process information at public counter 4.40 4 4 0.52
Responsiveness to / consideration of customer concerns 4.40 4 4 0.52

Appendix B—Employee Survey Analysis: Development Review page 5
The mean of each response is presented graphically below.
4.70
4.50
4.50
4.50
4.40
4.40
4.40
1.00 2.00 3.00 4.00 5.00
Customer service when compared with cities within San Luis Obispo
County
Knowledge of development review
Helpfulness of front counter assistance
Ease of accessing project manager to discuss project
Courtesy
Providing complete process information at public counter
Responsiveness to / consideration of customer concerns
5 Highest Ratings(presented in descending order)
5 Lowest Ratings
(Presented in ascending order. 1 is the lowest score)
Subject Mean Median Mode Std Dev
Helpfulness of informative handouts on processes 3.60 3 3 0.84
Cost of processing application (fees) 3.60 3 3 0.84
Clarity of codes and policies 3.60 3.5 3 0.97
Coordinated review between divisions and departments of the City 3.60 4 4 1.07
Timeliness/number of re-checks 3.70 3.5 3 0.82
Complexity of regulations 3.70 3.5 3 1.06
Use of technology (web site, plan check, document submittal) 3.70 4 4 0.95

Appendix B—Employee Survey Analysis: Development Review page 6
The mean of each response is presented graphically below.
3.60
3.60
3.60
3.60
3.70
3.70
3.70
1.00 2.00 3.00 4.00 5.00
Helpfulness of informative handouts on processes
Cost of processing application (fees)
Clarity of codes and policies
Coordinated review between divisions and departments of the City
Timeliness/number of re-checks
Complexity of regulations
Use of technology (web site, plan check, document submittal)
5 Lowest Ratings(presented in ascending order)

Appendix B—Employee Survey Analysis: Development Review page 7
STATISTICAL ANALYSIS FOR EACH STATEMENT (SORTED HIGHEST TO LOWEST)
Below, each of the 27 aspects are presented with the calculation of the Mean, Median, Mode and Standard Deviation along with the
percentage of each type of response, including “Not Applicable” and those left blank. They are presented from highest to lowest.
Statistical Analysis for Each Statement - Development Review
Mean Median Mode
Std
Dev
% Far
Exceeds
Expctn.
%
Above
Expctn.
% Met
Expctn.
% Below
Expctn.
%
Unaccept-
able
% Not
Applicable
% Left
Blank Total
Customer service when compared with cities within San Luis Obispo County 4.70 5 5 0.48 70% 30% 0% 0% 0% 0% 0% 100%
Knowledge of development review 4.50 4.5 4 0.53 50% 50% 0% 0% 0% 0% 0% 100%
Helpfulness of front counter assistance 4.50 5 5 0.71 60% 30% 10% 0% 0% 0% 0% 100%
Ease of accessing project manager to discuss project 4.50 4.5 5 0.53 50% 50% 0% 0% 0% 0% 0% 100%
Courtesy 4.40 4 4 0.52 40% 60% 0% 0% 0% 0% 0% 100%
Providing complete process information at public counter 4.40 4 4 0.52 40% 60% 0% 0% 0% 0% 0% 100%
Responsiveness to / consideration of customer concerns 4.40 4 4 0.52 40% 60% 0% 0% 0% 0% 0% 100%
Ability to solve problems as opposed to create problems 4.30 4 4 0.48 30% 70% 0% 0% 0% 0% 0% 100%
Process of "minor" changes to plans 4.30 4 4 0.48 30% 70% 0% 0% 0% 0% 0% 100%
Positive attitude 4.20 4 5 0.79 40% 40% 20% 0% 0% 0% 0% 100%
Returning phone calls in a timely manner 4.10 4 4 0.74 30% 50% 20% 0% 0% 0% 0% 100%
Providing consistent and dependable process information at public counter 4.10 4 4 0.57 20% 70% 10% 0% 0% 0% 0% 100%
Overall process 4.10 4 4 0.57 20% 70% 10% 0% 0% 0% 0% 100%
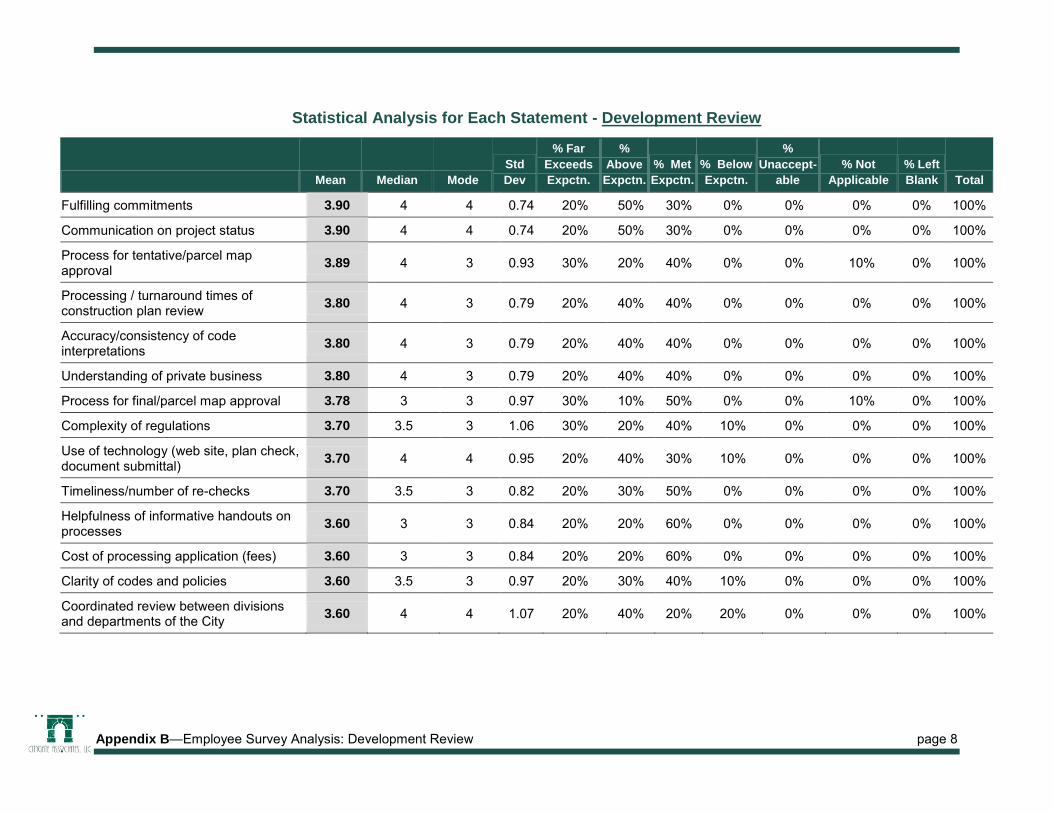
Appendix B—Employee Survey Analysis: Development Review page 8
Statistical Analysis for Each Statement - Development Review
Mean Median Mode
Std
Dev
% Far
Exceeds
Expctn.
%
Above
Expctn.
% Met
Expctn.
% Below
Expctn.
%
Unaccept-
able
% Not
Applicable
% Left
Blank Total
Fulfilling commitments 3.90 4 4 0.74 20% 50% 30% 0% 0% 0% 0% 100%
Communication on project status 3.90 4 4 0.74 20% 50% 30% 0% 0% 0% 0% 100%
Process for tentative/parcel map approval 3.89 4 3 0.93 30% 20% 40% 0% 0% 10% 0% 100%
Processing / turnaround times of construction plan review 3.80 4 3 0.79 20% 40% 40% 0% 0% 0% 0% 100%
Accuracy/consistency of code interpretations 3.80 4 3 0.79 20% 40% 40% 0% 0% 0% 0% 100%
Understanding of private business 3.80 4 3 0.79 20% 40% 40% 0% 0% 0% 0% 100%
Process for final/parcel map approval 3.78 3 3 0.97 30% 10% 50% 0% 0% 10% 0% 100%
Complexity of regulations 3.70 3.5 3 1.06 30% 20% 40% 10% 0% 0% 0% 100%
Use of technology (web site, plan check, document submittal) 3.70 4 4 0.95 20% 40% 30% 10% 0% 0% 0% 100%
Timeliness/number of re-checks 3.70 3.5 3 0.82 20% 30% 50% 0% 0% 0% 0% 100%
Helpfulness of informative handouts on processes 3.60 3 3 0.84 20% 20% 60% 0% 0% 0% 0% 100%
Cost of processing application (fees) 3.60 3 3 0.84 20% 20% 60% 0% 0% 0% 0% 100%
Clarity of codes and policies 3.60 3.5 3 0.97 20% 30% 40% 10% 0% 0% 0% 100%
Coordinated review between divisions and departments of the City 3.60 4 4 1.07 20% 40% 20% 20% 0% 0% 0% 100%

Appendix B—Employee Survey Analysis: Long-Range Planning page 9
SECTION III—LONG-RANGE PLANNING RESULTS
SUMMARY OF FINDINGS
The results for the Long-Range Planning section of the Employee Survey are summarized below.
Of the 28 total completed surveys, 4 employees responded from Long-Range Planning. As part
of the survey, employees were asked to rate 18 specific aspects of Long-Range Planning on a
scale from “Far Exceeds Expectations” (5) to “Unacceptable” (1). This summary includes the 5
highest ranking aspects and the 5 lowest ranking aspects.
5 Highest Ratings
(Presented in descending order. 5 is the highest score)
Subject Mean Median Mode Std Dev
Customer service when compared with cities within San Luis Obispo County 4.50 5 5 1.00
Helpfulness and inclusiveness 4.50 5 5 1.00
Courtesy 4.25 4 4 0.50
Returning phone calls in a timely manner 4.25 4.5 5 0.96
Providing complete information 4.25 4.5 5 0.96
Providing consistent and dependable information 4.25 4.5 5 0.96
The mean of each response is presented graphically below.
4.50
4.50
4.25
4.25
4.25
4.25
1.00 2.00 3.00 4.00 5.00
Customer service when compared with cities within San
Luis Obispo County
Helpfulness and inclusiveness
Courtesy
Returning phone calls in a timely manner
Providing complete information
Providing consistent and dependable information
5 Highest Ratings(presented in descending order)

Appendix B—Employee Survey Analysis: Long-Range Planning page 10
5 Lowest Ratings
(Presented in ascending order. 1 is the lowest score)
Subject Mean Median Mode Std Dev
Cost of processing application (fees) 3.00 3 3 0.00
Coordinated review between divisions and departments of the City 3.00 3 3 0.82
Use of technology (web site, plan check, document submittal) 3.25 3.5 4 0.96
Communication on project status 3.50 4 4 1.00
Understanding of private business 3.50 3.5 3 0.58
The mean of each response is presented graphically below.
3.00
3.00
3.25
3.50
3.50
1.00 2.00 3.00 4.00 5.00
Cost of processing application (fees)
Coordinated review between divisions and departments of the City
Use of technology (web site, plan check, document submittal)
Communication on project status
Understanding of private business
5 Lowest Ratings(presented in ascending order)

Appendix B—Employee Survey Analysis: Long-Range Planning page 11
STATISTICAL ANALYSIS FOR EACH STATEMENT (SORTED HIGHEST TO LOWEST)
Below, each of the 18 aspects are presented with the calculation of the Mean, Median, Mode and Standard Deviation along with the
percentage of each type of response, including “Not Applicable” and those left blank. They are presented from highest to lowest.
Statistical Analysis for Each Statement - Long-Range Planning
Mean Median Mode
Std
Dev
% Far
Exceeds
Expctn.
%
Above
Expctn.
% Met
Expctn.
% Below
Expctn.
%
Unaccept-
able
% Not
Applicable
% Left
Blank Total
Customer service when compared with cities within San Luis Obispo County 4.50 5 5 1.00 75% 0% 25% 0% 0% 0% 0% 100%
Helpfulness and inclusiveness 4.50 5 5 1.00 75% 0% 25% 0% 0% 0% 0% 100%
Courtesy 4.25 4 4 0.50 25% 75% 0% 0% 0% 0% 0% 100%
Returning phone calls in a timely manner 4.25 4.5 5 0.96 50% 25% 25% 0% 0% 0% 0% 100%
Providing complete information 4.25 4.5 5 0.96 50% 25% 25% 0% 0% 0% 0% 100%
Providing consistent and dependable information 4.25 4.5 5 0.96 50% 25% 25% 0% 0% 0% 0% 100%
Positive attitude 4.00 4 4 0.82 25% 50% 25% 0% 0% 0% 0% 100%
Knowledge of long-range planning 4.00 4 4 0.82 25% 50% 25% 0% 0% 0% 0% 100%
Fulfilling commitments 4.00 4 4 0.82 25% 50% 25% 0% 0% 0% 0% 100%
Ability to solve problems as opposed to create problems 4.00 4 4 0.82 25% 50% 25% 0% 0% 0% 0% 100%
Responsiveness to / consideration of customer concerns 3.75 3.5 3 0.96 25% 25% 50% 0% 0% 0% 0% 100%
Ease of accessing project manager to discuss project 3.75 4 4 0.50 0% 75% 25% 0% 0% 0% 0% 100%
Overall process 3.75 4 4 0.50 0% 75% 25% 0% 0% 0% 0% 100%
Communication on project status 3.50 4 4 1.00 0% 75% 0% 25% 0% 0% 0% 100%

Appendix B—Employee Survey Analysis: Long-Range Planning page 12
Statistical Analysis for Each Statement - Long-Range Planning
Mean Median Mode
Std
Dev
% Far
Exceeds
Expctn.
%
Above
Expctn.
% Met
Expctn.
% Below
Expctn.
%
Unaccept-
able
% Not
Applicable
% Left
Blank Total
Understanding of private business 3.50 3.5 3 0.58 0% 50% 50% 0% 0% 0% 0% 100%
Use of technology (web site, plan check, document submittal) 3.25 3.5 4 0.96 0% 50% 25% 25% 0% 0% 0% 100%
Cost of processing application (fees) 3.00 3 3 0.00 0% 0% 75% 0% 0% 25% 0% 100%
Coordinated review between divisions and departments of the City 3.00 3 3 0.82 0% 25% 50% 25% 0% 0% 0% 100%

Appendix B—Employee Survey Analysis: Building and Safety page 13
SECTION IV—BUILDING AND SAFETY RESULTS
SUMMARY OF FINDINGS
The results for the Building and Safety section of the Employee Survey are summarized below.
Of the 28 total completed surveys, 6 employees responded from Building and Safety. As part of
the survey, employees were asked to rate 27 specific aspects of Building and Safety on a scale
from “Far Exceeds Expectations” (5) to “Unacceptable” (1). This summary includes the 5
highest ranking aspects and the 5 lowest ranking aspects.
5 Highest Ratings
(Presented in descending order. 5 is the highest score)
Subject Mean Median Mode Std Dev
Customer service when compared with cities within San Luis Obispo County 5.00 5 5 0.00
Helpfulness of front counter assistance 4.67 5 5 0.82
Timeliness of inspections 4.67 5 5 0.52
Thoroughness of inspections 4.67 5 5 0.82
Communication on project status 4.60 5 5 0.89
The mean of each response is presented graphically below.
5.00
4.67
4.67
4.67
4.60
1.00 2.00 3.00 4.00 5.00
Customer service when compared with cities within San
Luis Obispo County
Helpfulness of front counter assistance
Timeliness of inspections
Thoroughness of inspections
Communication on project status
5 Highest Ratings(presented in descending order)

Appendix B—Employee Survey Analysis: Building and Safety page 14
5 Lowest Ratings
(Presented in ascending order. 1 is the lowest score)
Subject Mean Median Mode Std Dev
Cost of processing applications (fees) 2.67 2 2 1.21
Complexity of regulations 3.00 3 3 0.63
Coordinated review between divisions and departments of the City 3.00 3 4 0.89
Use of technology (web site, plan check, document submittal) 3.17 3 2 1.17
Understanding of private business 3.67 4 4 0.52
The mean of each response is presented graphically below.
2.67
3.00
3.00
3.17
3.67
1.00 2.00 3.00 4.00 5.00
Cost of processing applications (fees)
Complexity of regulations
Coordinated review between divisions and departments of the City
Use of technology (web site, plan check, document submittal)
Understanding of private business
5 Lowest Ratings(presented in ascending order)

Appendix B—Employee Survey Analysis: Building and Safety page 15
STATISTICAL ANALYSIS FOR EACH STATEMENT (SORTED HIGHEST TO LOWEST)
Below, each of the 27 aspects are presented with the calculation of the Mean, Median, Mode and Standard Deviation along with the
percentage of each type of response, including “Not Applicable” and those left blank. They are presented from highest to lowest.
Statistical Analysis for Each Statement - Building and Safety
Mean Median Mode
Std
Dev
% Far
Exceeds
Expctn.
%
Above
Expctn.
% Met
Expctn.
% Below
Expctn.
%
Unaccept-
able
% Not
Applicable
% Left
Blank Total
Customer service when compared with cities within San Luis Obispo County 5.00 5 5 0.00 83% 0% 0% 0% 0% 17% 0% 100%
Helpfulness of front counter assistance 4.67 5 5 0.82 83% 0% 17% 0% 0% 0% 0% 100%
Timeliness of inspections 4.67 5 5 0.52 67% 33% 0% 0% 0% 0% 0% 100%
Thoroughness of inspections 4.67 5 5 0.82 83% 0% 17% 0% 0% 0% 0% 100%
Communication on project status 4.60 5 5 0.89 67% 0% 17% 0% 0% 0% 17% 100%
Courtesy 4.50 5 5 0.84 67% 17% 17% 0% 0% 0% 0% 100%
Responsiveness to / consideration of customer concerns 4.50 5 5 0.84 67% 17% 17% 0% 0% 0% 0% 100%
Providing complete upfront information regarding inspections 4.50 5 5 0.84 67% 17% 17% 0% 0% 0% 0% 100%
Knowledge of building and safety 4.33 4 4 0.52 33% 67% 0% 0% 0% 0% 0% 100%
Providing complete process information at public counter 4.33 4.5 5 0.82 50% 33% 17% 0% 0% 0% 0% 100%
Ability to solve problems as opposed to create problems 4.33 4.5 5 0.82 50% 33% 17% 0% 0% 0% 0% 100%
Ease of accessing project manager to discuss project 4.33 4.5 5 0.82 50% 33% 17% 0% 0% 0% 0% 100%
Returning phone calls in a timely manner 4.17 4 4 0.75 33% 50% 17% 0% 0% 0% 0% 100%

Appendix B—Employee Survey Analysis: Building and Safety page 16
Statistical Analysis for Each Statement - Building and Safety
Mean Median Mode
Std
Dev
% Far
Exceeds
Expctn.
%
Above
Expctn.
% Met
Expctn.
% Below
Expctn.
%
Unaccept-
able
% Not
Applicable
% Left
Blank Total
Providing consistent and dependable process information at public counter 4.17 4 4 0.75 33% 50% 17% 0% 0% 0% 0% 100%
Thoroughness of plan review 4.17 4 4 0.75 33% 50% 17% 0% 0% 0% 0% 100%
Positive attitude 4.00 4 4 0.63 17% 67% 17% 0% 0% 0% 0% 100%
Accuracy/consistency of code interpretations 4.00 4 5 0.89 33% 33% 33% 0% 0% 0% 0% 100%
Overall process 4.00 4 4 0.63 17% 67% 17% 0% 0% 0% 0% 100%
Fulfilling commitments 3.83 4 4 0.75 17% 50% 33% 0% 0% 0% 0% 100%
Helpfulness of informative handouts on processes 3.83 4 4 0.75 17% 50% 33% 0% 0% 0% 0% 100%
Processing / turnaround times of application review 3.67 3.5 5 1.21 33% 17% 33% 17% 0% 0% 0% 100%
Clarity of regulations 3.67 3.5 3 0.82 17% 33% 50% 0% 0% 0% 0% 100%
Understanding of private business 3.67 4 4 0.52 0% 67% 33% 0% 0% 0% 0% 100%
Use of technology (web site, plan check, document submittal) 3.17 3 2 1.17 17% 17% 33% 33% 0% 0% 0% 100%
Complexity of regulations 3.00 3 3 0.63 0% 17% 67% 17% 0% 0% 0% 100%
Coordinated review between divisions and departments of the City 3.00 3 4 0.89 0% 33% 33% 33% 0% 0% 0% 100%
Cost of processing applications (fees) 2.67 2 2 1.21 17% 0% 17% 67% 0% 0% 0% 100%

Appendix B—Employee Survey Analysis: Administration page 17
SECTION V—ADMINISTRATION RESULTS
SUMMARY OF FINDINGS
The results for the Administration section of the Employee Survey are summarized below. Of
the 28 total completed surveys, 6 employees responded from Administration. As part of the
survey, employees were asked to rate 24 specific aspects of Administration on a scale from “Far
Exceeds Expectations” (5) to “Unacceptable” (1). This summary includes the 5 highest ranking
aspects and the 5 lowest ranking aspects.
5 Highest Ratings
(Presented in descending order. 5 is the highest score)
Subject Mean Median Mode Std Dev
Communication on project status 4.25 4.5 5 0.96
Knowledge of Urban Planning issues and best practices 4.00 4 4 0.82
Knowledge of Building Code issues and best practices 4.00 4 - 1.00
Ability to creatively garner technical resources to assist department employees 4.00 4 4 0.82
Customer service when compared with cities within San Luis Obispo County 4.00 4 4 0.82
Accuracy/consistency of interpreting policies and procedures 4.00 4 4 0.82

Appendix B—Employee Survey Analysis: Administration page 18
The mean of each response is presented graphically below.
4.25
4.00
4.00
4.00
4.00
4.00
1.00 2.00 3.00 4.00 5.00
Communication on project status
Knowledge of Urban Planning issues and best practices
Knowledge of Building Code issues and best practices
Ability to creatively garner technical resources to assist
department employees
Customer service when compared with cities within San
Luis Obispo County
Accuracy/consistency of interpreting policies and
procedures
5 Highest Ratings(presented in descending order)
5 Lowest Ratings
(Presented in ascending order. 1 is the lowest score)
Subject Mean Median Mode Std Dev
Understanding of private business 2.75 2.5 2 0.96
Ability to anticipate organizational problems 2.80 3 3 1.10
Ability to articulate a vision for the Department 3.00 3 - 1.00
Ability to build consensus on important issues 3.00 3 2 1.00
Responsiveness to / consideration of customer concerns 3.00 3 2 1.00

Appendix B—Employee Survey Analysis: Administration page 19
The mean of each response is presented graphically below.
2.75
2.80
3.00
3.00
3.00
1.00 2.00 3.00 4.00 5.00
Understanding of private business
Ability to anticipate organizational problems
Ability to articulate a vision for the Department
Ability to build consensus on important issues
Responsiveness to / consideration of customer concerns
5 Lowest Ratings(presented in ascending order)

Appendix B—Employee Survey Analysis: Administration page 20
STATISTICAL ANALYSIS FOR EACH STATEMENT (SORTED HIGHEST TO LOWEST)
Below, each of the 24 aspects are presented with the calculation of the Mean, Median, Mode and Standard Deviation along with the
percentage of each type of response, including “Not Applicable” and those left blank. They are presented from highest to lowest.
Statistical Analysis for Each Statement - Administration
Mean Median Mode
Std
Dev
% Far
Exceeds
Expctn.
%
Above
Expctn.
% Met
Expctn.
% Below
Expctn.
%
Unaccept-
able
% Not
Applicable
% Left
Blank Total
Communication on project status 4.25 4.5 5 0.96 33% 17% 17% 0% 0% 0% 33% 100%
Knowledge of Urban Planning issues and best practices 4.00 4 4 0.82 17% 33% 17% 0% 0% 17% 17% 100%
Knowledge of Building Code issues and best practices 4.00 4 - 1.00 17% 17% 17% 0% 0% 17% 33% 100%
Ability to creatively garner technical resources to assist department employees
4.00 4 4 0.82 17% 33% 17% 0% 0% 17% 17% 100%
Customer service when compared with cities within San Luis Obispo County 4.00 4 4 0.82 17% 33% 17% 0% 0% 17% 17% 100%
Accuracy/consistency of interpreting policies and procedures 4.00 4 4 0.82 17% 33% 17% 0% 0% 17% 17% 100%
Courtesy 3.83 4 4 0.98 17% 67% 0% 17% 0% 0% 0% 100%
Fulfilling commitments 3.80 4 3 0.84 17% 33% 33% 0% 0% 0% 17% 100%
Coordinated review between divisions and departments of the City 3.80 4 3 0.84 17% 33% 33% 0% 0% 0% 17% 100%
Overall leadership 3.60 4 4 1.14 17% 33% 17% 17% 0% 0% 17% 100%
Use of technology (web site, plan check, document submittals) 3.50 3.5 3 0.58 0% 33% 33% 0% 0% 17% 17% 100%
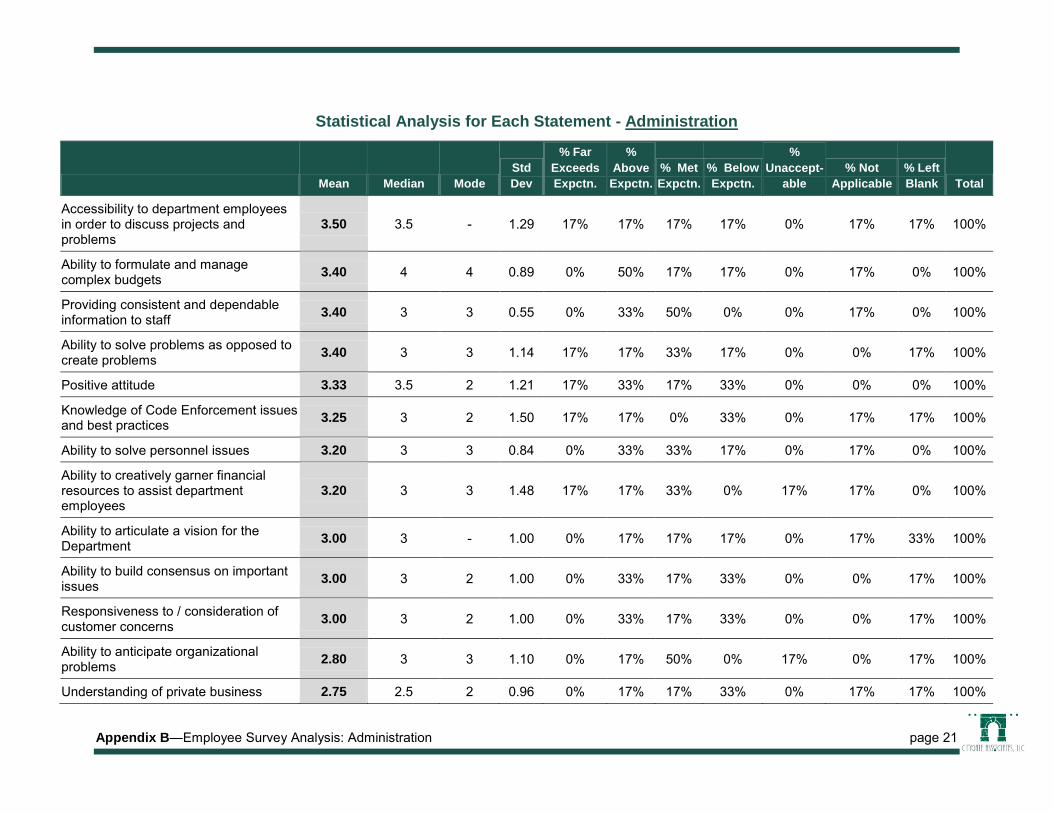
Appendix B—Employee Survey Analysis: Administration page 21
Statistical Analysis for Each Statement - Administration
Mean Median Mode
Std
Dev
% Far
Exceeds
Expctn.
%
Above
Expctn.
% Met
Expctn.
% Below
Expctn.
%
Unaccept-
able
% Not
Applicable
% Left
Blank Total
Accessibility to department employees in order to discuss projects and problems
3.50 3.5 - 1.29 17% 17% 17% 17% 0% 17% 17% 100%
Ability to formulate and manage complex budgets 3.40 4 4 0.89 0% 50% 17% 17% 0% 17% 0% 100%
Providing consistent and dependable information to staff 3.40 3 3 0.55 0% 33% 50% 0% 0% 17% 0% 100%
Ability to solve problems as opposed to create problems 3.40 3 3 1.14 17% 17% 33% 17% 0% 0% 17% 100%
Positive attitude 3.33 3.5 2 1.21 17% 33% 17% 33% 0% 0% 0% 100%
Knowledge of Code Enforcement issues and best practices 3.25 3 2 1.50 17% 17% 0% 33% 0% 17% 17% 100%
Ability to solve personnel issues 3.20 3 3 0.84 0% 33% 33% 17% 0% 17% 0% 100%
Ability to creatively garner financial resources to assist department employees
3.20 3 3 1.48 17% 17% 33% 0% 17% 17% 0% 100%
Ability to articulate a vision for the Department 3.00 3 - 1.00 0% 17% 17% 17% 0% 17% 33% 100%
Ability to build consensus on important issues 3.00 3 2 1.00 0% 33% 17% 33% 0% 0% 17% 100%
Responsiveness to / consideration of customer concerns 3.00 3 2 1.00 0% 33% 17% 33% 0% 0% 17% 100%
Ability to anticipate organizational problems 2.80 3 3 1.10 0% 17% 50% 0% 17% 0% 17% 100%
Understanding of private business 2.75 2.5 2 0.96 0% 17% 17% 33% 0% 17% 17% 100%

Appendix B—Employee Survey Analysis: Public Works Engineering page 22
SECTION VI—PUBLIC WORKS ENGINEERING RESULTS
SUMMARY OF FINDINGS
The results for the Public Works Engineering section of the Employee Survey are summarized
below. Of the 28 total completed surveys, 4 employees responded from Public Works
Engineering. As part of the survey, employees were asked to rate 26 specific aspects of Public
Works Engineering on a scale from “Far Exceeds Expectations” (5) to “Unacceptable” (1). This
summary includes the highest and the lowest ratings.
5 Highest Ratings
(Presented in descending order. 5 is the highest score)
Subject Mean Median Mode Std Dev
Providing complete process information at public counter 4.50 4.5 4 0.58
Ability to solve problems as opposed to create problems 4.50 4.5 4 0.58
Customer service when compared with cities within San Luis Obispo County 4.50 5 5 1.00
Courtesy 4.25 4.5 5 0.96
Knowledge of public works engineering 4.25 4.5 5 0.96
Helpfulness of front counter assistance 4.25 4.5 5 0.96
Providing consistent and dependable process information at public counter 4.25 4.5 5 0.96
Helpfulness of informative handouts on processes 4.25 4.5 5 0.96

Appendix B—Employee Survey Analysis: Public Works Engineering page 23
The mean of each response is presented graphically below.
4.50
4.50
4.50
4.25
4.25
4.25
4.25
4.25
1.00 2.00 3.00 4.00 5.00
Providing complete process information at public counter
Ability to solve problems as opposed to create problems
Customer service when compared with cities within San Luis Obispo County
Courtesy
Knowledge of public works engineering
Helpfulness of front counter assistance
Providing consistent and dependable process information at public counter
Helpfulness of informative handouts on processes
5 Highest Ratings(presented in descending order)
5 Lowest Ratings
(Presented in ascending order. 1 is the lowest score)
Subject Mean Median Mode Std Dev
Timeliness/number of re-checks 3.50 3.5 2 1.73
Positive attitude 3.75 4 5 1.50
Fulfilling commitments 3.75 4 5 1.50
Returning phone calls in a timely manner 3.75 4 5 1.50
Cost of processing application (fees) 3.75 4 5 1.50
Processing / turnaround times of construction plan review 3.75 4 5 1.50
Clarity of codes and policies 3.75 4 5 1.50
Communication on project status 3.75 4 5 1.50
Use of technology (web site, plan check, document submittal) 3.75 4 5 1.50
Ease of accessing project manager to discuss project 3.75 4 5 1.50
Understanding of private business 3.75 4 5 1.50
Coordinated review between divisions and departments of the City 3.75 4 5 1.50
Overall process 3.75 4 5 1.50

Appendix B—Employee Survey Analysis: Public Works Engineering page 24
The mean of each response is presented graphically below.
3.50
3.75
3.75
3.75
3.75
3.75
3.75
3.75
3.75
3.75
3.75
3.75
3.75
1.00 2.00 3.00 4.00 5.00
Timeliness/number of re-checks
Positive attitude
Fulfilling commitments
Returning phone calls in a timely manner
Cost of processing application (fees)
Processing / turnaround times of construction plan review
Clarity of codes and policies
Communication on project status
Use of technology (web site, plan check, document submittal)
Ease of accessing project manager to discuss project
Understanding of private business
Coordinated review between divisions and departments of the City
Overall process
5 Lowest Ratings(presented in ascending order)

Appendix B—Employee Survey Analysis: Public Works Engineering page 25
STATISTICAL ANALYSIS FOR EACH STATEMENT (SORTED HIGHEST TO LOWEST)
Below, each of the 26 aspects are presented with the calculation of the Mean, Median, Mode and Standard Deviation along with the
percentage of each type of response, including “Not Applicable” and those left blank. They are presented from highest to lowest.
Statistical Analysis for Each Statement - Public Works Engineering
Mean Median Mode
Std
Dev
% Far
Exceeds
Expctn.
%
Above
Expctn.
% Met
Expctn.
% Below
Expctn.
%
Unaccept-
able
% Not
Applicable
% Left
Blank Total
Providing complete process information at public counter 4.50 4.5 4 0.58 50% 50% 0% 0% 0% 0% 0% 100%
Ability to solve problems as opposed to create problems 4.50 4.5 4 0.58 50% 50% 0% 0% 0% 0% 0% 100%
Customer service when compared with cities within San Luis Obispo County 4.50 5 5 1.00 75% 0% 25% 0% 0% 0% 0% 100%
Courtesy 4.25 4.5 5 0.96 50% 25% 25% 0% 0% 0% 0% 100%
Knowledge of public works engineering 4.25 4.5 5 0.96 50% 25% 25% 0% 0% 0% 0% 100%
Helpfulness of front counter assistance 4.25 4.5 5 0.96 50% 25% 25% 0% 0% 0% 0% 100%
Providing consistent and dependable process information at public counter 4.25 4.5 5 0.96 50% 25% 25% 0% 0% 0% 0% 100%
Helpfulness of informative handouts on processes 4.25 4.5 5 0.96 50% 25% 25% 0% 0% 0% 0% 100%
Complexity of regulations 4.00 4.5 5 1.41 50% 25% 0% 25% 0% 0% 0% 100%
Accuracy/consistency of code interpretations 4.00 4 3 1.15 50% 0% 50% 0% 0% 0% 0% 100%
Responsiveness to / consideration of customer concerns 4.00 4 3 1.15 50% 0% 50% 0% 0% 0% 0% 100%
Process of "minor" changes to plans 4.00 4 3 1.15 50% 0% 50% 0% 0% 0% 0% 100%
Process for final/parcel map approval 4.00 4 3 1.15 50% 0% 50% 0% 0% 0% 0% 100%

Appendix B—Employee Survey Analysis: Public Works Engineering page 26
Statistical Analysis for Each Statement - Public Works Engineering
Mean Median Mode
Std
Dev
% Far
Exceeds
Expctn.
%
Above
Expctn.
% Met
Expctn.
% Below
Expctn.
%
Unaccept-
able
% Not
Applicable
% Left
Blank Total
Positive attitude 3.75 4 5 1.50 50% 0% 25% 25% 0% 0% 0% 100%
Fulfilling commitments 3.75 4 5 1.50 50% 0% 25% 25% 0% 0% 0% 100%
Returning phone calls in a timely manner 3.75 4 5 1.50 50% 0% 25% 25% 0% 0% 0% 100%
Cost of processing application (fees) 3.75 4 5 1.50 50% 0% 25% 25% 0% 0% 0% 100%
Processing / turnaround times of construction plan review 3.75 4 5 1.50 50% 0% 25% 25% 0% 0% 0% 100%
Clarity of codes and policies 3.75 4 5 1.50 50% 0% 25% 25% 0% 0% 0% 100%
Communication on project status 3.75 4 5 1.50 50% 0% 25% 25% 0% 0% 0% 100%
Use of technology (web site, plan check, document submittal) 3.75 4 5 1.50 50% 0% 25% 25% 0% 0% 0% 100%
Ease of accessing project manager to discuss project 3.75 4 5 1.50 50% 0% 25% 25% 0% 0% 0% 100%
Understanding of private business 3.75 4 5 1.50 50% 0% 25% 25% 0% 0% 0% 100%
Coordinated review between divisions and departments of the City 3.75 4 5 1.50 50% 0% 25% 25% 0% 0% 0% 100%
Overall process 3.75 4 5 1.50 50% 0% 25% 25% 0% 0% 0% 100%
Timeliness/number of re-checks 3.50 3.5 2 1.73 50% 0% 0% 50% 0% 0% 0% 100%

Appendix B—Employee Survey Analysis: Fire Prevention page 27
SECTION VII—FIRE PREVENTION RESULTS
SUMMARY OF FINDINGS
The results for the Fire Prevention section of the Employee Survey are summarized below. Of
the 28 total completed surveys, 1 employee responded from Fire Prevention. As part of the
survey, employees were asked to rate 27 specific aspects of Fire Prevention on a scale from “Far
Exceeds Expectations” (5) to “Unacceptable” (1). This summary includes the 5 highest ranking
aspects and the 5 lowest ranking aspects.
5 Highest Ratings
(Presented in descending order. 5 is the highest score)
Subject Response Median Mode Std Dev
Courtesy 5.00 - - -
Positive attitude 5.00 - - -
Knowledge of Best Management Practices in applying fire code as part of one-stop development permit review process
5.00 - - -
Customer service when compared with cities within San Luis Obispo County 5.00 - - -
Ease of accessing project manager to discuss project 5.00 - - -
Understanding of private business 5.00 - - -
Coordinated review between divisions and departments of the City 5.00 - - -
Providing complete upfront information regarding inspections 5.00 - - -
Thoroughness of plan review 5.00 - - -
Timeliness of inspections 5.00 - - -
Thoroughness of inspections 5.00 - - -

Appendix B—Employee Survey Analysis: Fire Prevention page 28
The mean of each response is presented graphically below.
5.00
5.00
5.00
5.00
5.00
5.00
5.00
5.00
5.00
5.00
5.00
1.00 2.00 3.00 4.00 5.00
Courtesy
Positive attitude
Knowledge of Best Management Practices in applying fire code as part of one-stop development permit review process
Customer service when compared with cities within San Luis Obispo County
Ease of accessing project manager to discuss project
Understanding of private business
Coordinated review between divisions and departments of the City
Providing complete upfront information regarding inspections
Thoroughness of plan review
Timeliness of inspections
Thoroughness of inspections
5 Highest Ratings(presented in descending order)
5 Lowest Ratings
(Presented in ascending order. 1 is the lowest score)
Subject Response Median Mode Std Dev
Helpfulness of front counter assistance 2.00 - - -
Providing complete process information at public counter 2.00 - - -
Providing consistent and dependable process information at public counter 2.00 - - -
Use of technology (web site, plan check, document submittal) 2.00 - - -
Returning phone calls in a timely manner 3.00 - - -
Helpfulness of informative handouts on processes 3.00 - - -
Cost of processing applications (fees) 3.00 - - -
Communication on project status 3.00 - - -

Appendix B—Employee Survey Analysis: Fire Prevention page 29
The mean of each response is presented graphically below.
2.00
2.00
2.00
2.00
3.00
3.00
3.00
3.00
1.00 2.00 3.00 4.00 5.00
Helpfulness of front counter assistance
Providing complete process information at public counter
Providing consistent and dependable process information at public counter
Use of technology (web site, plan check, document submittal)
Returning phone calls in a timely manner
Helpfulness of informative handouts on processes
Cost of processing applications (fees)
Communication on project status
5 Lowest Ratings(presented in ascending order)

Appendix B—Employee Survey Analysis: Fire Prevention page 30
RESPONSE TO EACH STATEMENT (SORTED HIGHEST TO LOWEST)
Below, the single employee response for each of the 27 aspects is presented (note: the calculation of the Mean, Median, Mode and
Standard Deviation is not possible for a survey with one respondent). The responses are presented from highest to lowest.
Response to Each Statement - Fire Prevention
Response Median Mode Std Dev
Courtesy 5.00 - - -
Positive attitude 5.00 - - -
Knowledge of Best Management Practices in applying fire code as part of one-stop development permit review process
5.00 - - -
Customer service when compared with cities within San Luis Obispo County 5.00 - - -
Ease of accessing project manager to discuss project 5.00 - - -
Understanding of private business 5.00 - - -
Coordinated review between divisions and departments of the City 5.00 - - -
Providing complete upfront information regarding inspections 5.00 - - -
Thoroughness of plan review 5.00 - - -
Timeliness of inspections 5.00 - - -
Thoroughness of inspections 5.00 - - -
Fulfilling commitments 4.00 - - -
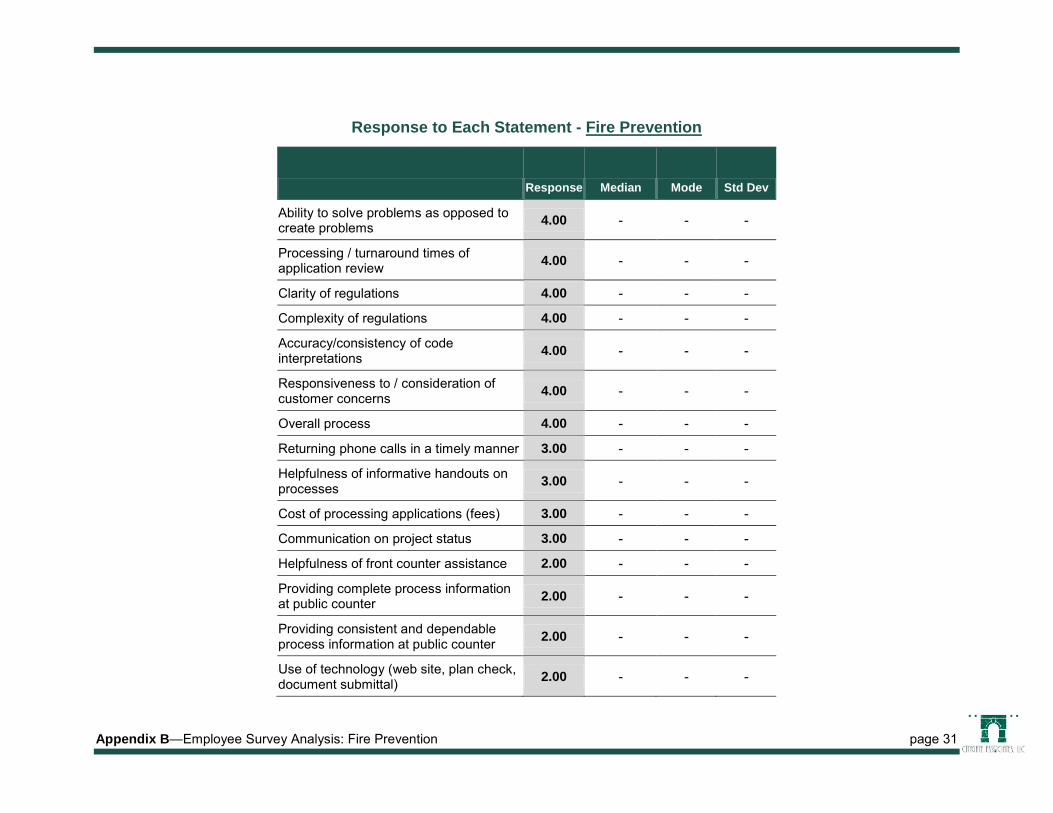
Appendix B—Employee Survey Analysis: Fire Prevention page 31
Response to Each Statement - Fire Prevention
Response Median Mode Std Dev
Ability to solve problems as opposed to create problems 4.00 - - -
Processing / turnaround times of application review 4.00 - - -
Clarity of regulations 4.00 - - -
Complexity of regulations 4.00 - - -
Accuracy/consistency of code interpretations 4.00 - - -
Responsiveness to / consideration of customer concerns 4.00 - - -
Overall process 4.00 - - -
Returning phone calls in a timely manner 3.00 - - -
Helpfulness of informative handouts on processes 3.00 - - -
Cost of processing applications (fees) 3.00 - - -
Communication on project status 3.00 - - -
Helpfulness of front counter assistance 2.00 - - -
Providing complete process information at public counter 2.00 - - -
Providing consistent and dependable process information at public counter 2.00 - - -
Use of technology (web site, plan check, document submittal) 2.00 - - -

Appendix B—Employee Survey Analysis: General page 32
OPEN-ENDED RESPONSES
Employees were asked to respond to the following open-ended question:
Please add any specific comments or suggestions you may have for improving services in your
division or the Community Development Department/Development Permit Review Process
overall.
Count Employee OVERALL Responses (Summarized)
Suggestions
5
Need additional staff to reduce processing times with current and anticipated increase of workload; Permit Technician for Building and Public Works need to be full-time and permanent as they are essential to the entire flow of the Development Review process; due to an increased development workload, the Fire Department counter Administrative Assistant and 1 1/4 Fire Inspector positions should be restored.
2
Need better entitlement routing system with more user-friendly documents; upgraded website with handouts for common counter questions. Re-design website to be more user-friendly with drop down menus to links such as "living here" or "doing business here" to minimize time spent on phone helping customers navigate the website. The homepage should include links to zoning and regulations checklists, and the GIS parcel viewer should be easily accessible for customers' own research.
1 Cross train the staff between Building, Planning and Public Works.
1 Development Review should be considered as a function rather than cross departmental lines.
1 Development Review needs to be a primary responsibility and priority to staff so that it doesn't take a back seat.
1 Delegate certain ongoing/required tasks to support staff.
1 Need increased teamwork and communication within department.
1 Need improved succession planning and incentives for staff to avoid burn-out and boost morale. Offer compensation incentives for achieving certifications from ICC.
1 Request an applicant proposal for critical timing, project scope, and intentions so expectations can be met and critical concerns can be addressed early in the process.
1 Review areas other than the front counter.
Positive Comments
1 Electronic routing of plans reduced turn-arounds on plan checks from Public Works and Utilities.
1 Front counter and permit process is seamless and communication occurs with customers.

APPENDIX C
SAN LUIS OBISPO RESIDENT SURVEY ANALYSIS

This page was intentionally left blank

Appendix C—Resident Survey Analysis: Overview and Methodology page 1
SECTION I—RESIDENT SURVEY ANALYSIS: OVERVIEW AND
METHODOLOGY
Citygate conducted an Internet-based Resident Survey for residents of San Luis Obispo. The
purpose of the survey was to understand resident opinions of how the Community Development
Department is meeting or not meeting the needs of the residents. The survey was “open” to
accept input between March 7 and March 18, 2013. The availability of the survey was
announced via direct email invitations to 2,000 randomly selected residents. In addition,
approximately ten (10) interested stakeholders asked to be sent invitations to the survey. In total,
there were 220 completed surveys.
Details of the deployment are shown below.
Resident Survey
Launch Date 3/7/13
Close Date 3/18/13
Partials1 96
Completes2 220
Residents were asked to rate 15 different aspects of the Community Development Department.
The rating scale for each aspect was “Strongly Agree” (5) to “Strongly Disagree” (1).
Respondents were also asked one open-ended question about the Community Development
Department overall, which is included at the end of this Appendix.
It should be noted in reviewing the results that residents were not required to answer any
question. Additionally, they were permitted to respond “Not Applicable” to the rating
statements, and these responses were excluded from the mean response calculations.
ORGANIZATION OF ANALYSIS
Resident Responses
The results for resident responses are presented in the following format:
Summary of Findings – The statements receiving the overall highest and lowest
mean score.
Statistical Analysis for Each Statement – All the survey statements are
presented with the calculation of the Mean, Median, Mode and Standard
1 “Partial” – the number of surveys that were begun but not completed. These surveys cannot be added to the database. 2 “Completes” – the number of surveys that were completed and successfully added to the database.

Appendix C—Resident Survey Analysis: Overview and Methodology page 2
Deviation along with the percentage of each type of response. These are sorted
from highest to lowest mean score.
DEFINITION OF TERMS
The terms defined below are encountered in the information that follows:
Mean: An arithmetic mean that is the sum of the responses for each statement divided by the
number of responses for each statement.
Median: "Middle value" of a list. That is, half the numbers in the list are greater than the median
response and half are less.
Mode: The most frequently occurring number in a list. In the case of the Resident Survey, it was
the response (from “Strongly Agree” to “Strongly Disagree”) that was the most often chosen for
any one statement.
Standard Deviation: Standard deviation tells how spread out the responses are from the
arithmetic mean. A standard deviation close to zero indicates that most responses are close to the
mean response and that a greater degree of agreement exists among survey takers with regard to
the statement. A greater standard deviation indicates that there was a wider spread of variation in
the responses and that a greater degree of disagreement exists among residents with regard to the
statement.

Appendix C—Resident Survey Analysis: Classification Statements page 3
22.2%
41.8%
68.9%
77.8%
58.2%
31.1%
0% 10% 20% 30% 40% 50% 60% 70% 80% 90% 100%
I own a home in San Luis Obispo
I rent my residence in San Luis Obispo
I own a business in San Luis Obispo
Please tell us a little about yourself. This information will help us to better understand your responses and respond to your concerns.
Yes
No
SECTION II—CLASSIFICATION STATEMENTS
The survey began with the following classification statements. They are included here to
demonstrate the type of residents who responded to the survey.
0.50%
14.20%
20.20%
65.10%
0% 10% 20% 30% 40% 50% 60% 70% 80% 90% 100%
Less than 1 year
1 to 5 years
5 to 10 years
More than 10 years
I have been living in San Luis Obispo for:

Appendix C—Resident Survey Analysis: Resident Results page 4
SECTION III—RESIDENT RESULTS
SUMMARY OF FINDINGS
The results for the Resident Survey are summarized below. As part of the survey, residents were
asked to rate 15 specific aspects of the Community Development Department on a scale from
“Strongly Agree” (5) to “Strongly Disagree” (1). This summary includes the 5 highest ranking
aspects and the 5 lowest ranking aspects.
5 Highest Ratings
(Presented in descending order. 5 is the highest score)
Subject Mean Median Mode Std Dev
The Community Development Department does a good job protecting the City's cultural heritage resources (e.g., historic preservation).
3.50 4 4 1.07
The ability to safely move around the City by car is generally efficient. 3.50 4 4 1.11
The Community Development Department contributes to the overall quality of life in San Luis Obispo.
3.43 3 3 0.98
The Community Development Department does a good job protecting the unique architectural character of the City's various neighborhoods (e.g., infill development, code enforcement, etc.).
3.38 3 4 1.08
The Community Development Department does a good job planning for the City's growth and development.
3.29 3 3 1.01
The mean of each response is presented graphically below.

Appendix C—Resident Survey Analysis: Resident Results page 5
5 Lowest Ratings
(Presented in ascending order. 1 is the lowest score)
Subject Mean Median Mode Std Dev
The Community Development Department favors the City's residents over the City's businesses. 2.64 3 3 0.91
Information is generally available and I feel informed about planning and development projects.
3.04 3 4 1.18
The quality of life has improved since the City began proactive code enforcement. 3.04 3 3 1.08
The Community Development Department favors the City's businesses over the City's residents. 3.09 3 3 0.98
The Community Development Department's staff reports presented at public meetings are informative and balanced.
3.14 3 3 0.95
The mean of each response is presented graphically below.
3.50
3.50
3.43
3.38
3.29
1.00 2.00 3.00 4.00 5.00
The Community Development Department does a good job protecting the City's cultural heritage resources (e.g., historic
preservation).
The ability to safely move around the City by car is generally efficient.
The Community Development Department contributes to the overall quality of life in San Luis Obispo.
The Community Development Department does a good job protecting the unique architectural character of the City's
various neighborhoods (e.g., infill development, code enforcement, etc.).
The Community Development Department does a good job planning for the City's growth and development.
5 Highest Ratings(presented in descending order)
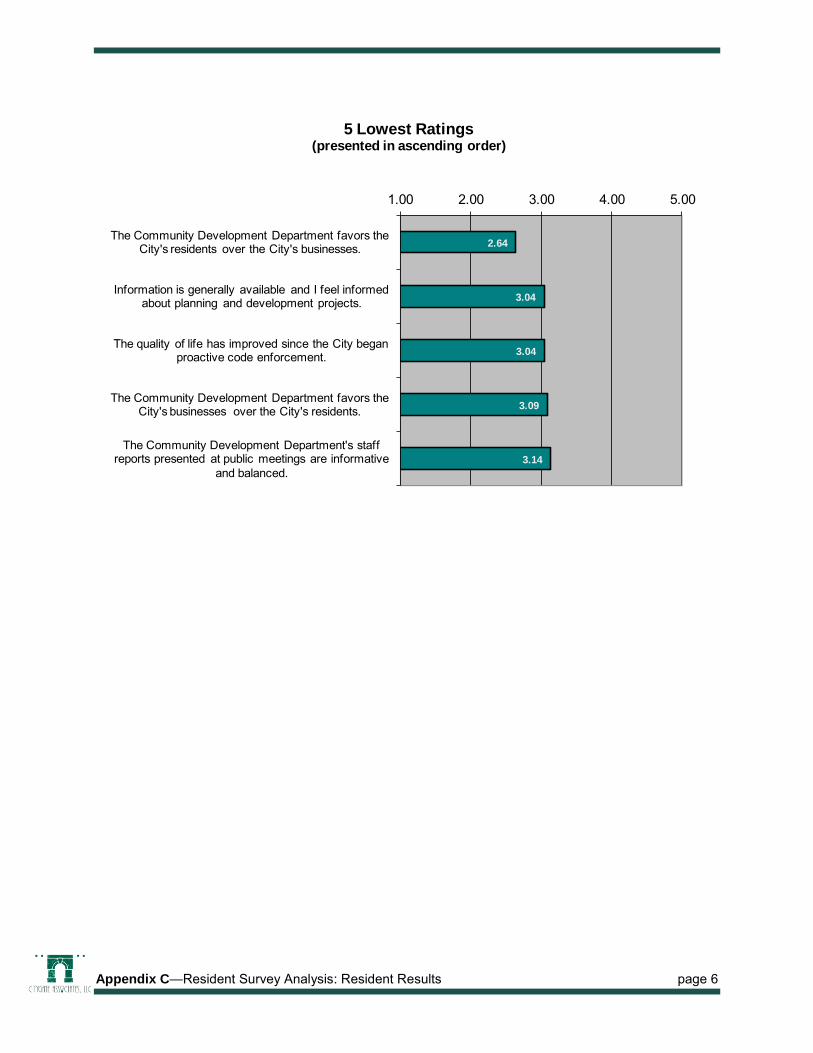
Appendix C—Resident Survey Analysis: Resident Results page 6
2.64
3.04
3.04
3.09
3.14
1.00 2.00 3.00 4.00 5.00
The Community Development Department favors the City's residents over the City's businesses.
Information is generally available and I feel informed about planning and development projects.
The quality of life has improved since the City began proactive code enforcement.
The Community Development Department favors the City's businesses over the City's residents.
The Community Development Department's staff reports presented at public meetings are informative
and balanced.
5 Lowest Ratings(presented in ascending order)

Appendix C—Resident Survey Analysis: Resident Results page 7
STATISTICAL ANALYSIS FOR EACH STATEMENT (SORTED HIGHEST TO LOWEST)
Below, each of the 15 aspects are presented with the calculation of the Mean, Median, Mode and Standard Deviation along with the
percentage of each type of response, including “Not Applicable” and those left blank. They are presented from highest to lowest.
Statistical Analysis for Each Statement – Resident Survey
Mean Median Mode Std Dev
% Strongly
Agree %
Agree % No
Opinion %
Disagree
% Strongly Disagree % N/A
% Left Blank Total
The Community Development Department does a good job protecting the City's cultural heritage resources (e.g., historic preservation).
3.50 4 4 1.07 13% 44% 22% 9% 7% 3% 3% 100%
The ability to safely move around the City by car is generally efficient. 3.50 4 4 1.11 15% 49% 12% 17% 5% 0% 2% 100%
The Community Development Department contributes to the overall quality of life in San Luis Obispo.
3.43 3 3 0.98 11% 35% 36% 7% 5% 3% 1% 100%
The Community Development Department does a good job protecting the unique architectural character of the City's various neighborhoods (e.g., infill development, code enforcement, etc.).
3.38 3 4 1.08 13% 34% 30% 10% 7% 2% 3% 100%
The Community Development Department does a good job planning for the City's growth and development.
3.29 3 3 1.01 8% 34% 38% 7% 8% 3% 3% 100%
Walking and biking around the City is safe and convenient. 3.28 4 4 1.26 16% 35% 13% 23% 9% 2% 2% 100%
The City should establish Neighborhood Advisory committees and associations for all areas of San Luis Obispo.
3.21 3 4 1.30 16% 27% 26% 9% 15% 4% 1% 100%

Appendix C—Resident Survey Analysis: Resident Results page 8
Statistical Analysis for Each Statement – Resident Survey
Mean Median Mode Std Dev
% Strongly
Agree %
Agree % No
Opinion %
Disagree
% Strongly Disagree % N/A
% Left Blank Total
The Community Development Department provides reliable and useful information regarding issues and actions that will affect residents.
3.20 3 3 1.02 7% 30% 38% 10% 8% 5% 2% 100%
The Community Development Department provides accurate and timely information on the City's website.
3.20 3 3 0.85 5% 22% 47% 5% 5% 14% 2% 100%
The Community Development Department has provided accurate and timely information at workshops.
3.15 3 3 0.89 5% 19% 44% 6% 5% 19% 3% 100%
The Community Development Department's staff reports presented at public meetings are informative and balanced.
3.14 3 3 0.95 7% 17% 47% 6% 6% 14% 2% 100%
The Community Development Department favors the City's businesses over the City's residents.
3.09 3 3 0.98 9% 16% 49% 15% 6% 4% 1% 100%
The quality of life has improved since the City began proactive code enforcement. 3.04 3 3 1.08 5% 29% 33% 14% 11% 6% 1% 100%
Information is generally available and I feel informed about planning and development projects.
3.04 3 4 1.18 8% 31% 24% 18% 13% 4% 3% 100%
The Community Development Department favors the City's residents over the City's businesses.
2.64 3 3 0.91 2% 10% 47% 22% 12% 4% 3% 100%

Appendix C—Resident Survey Analysis: Department Operations Information Results page 9
SECTION III—DEPARTMENT OPERATIONS INFORMATION RESULTS
The survey asked the following statements regarding how residents would like to receive
information from the Department. The results are shown below.
70.51%
8.76%
36.41%
11.06%
19.35%
7.83%
9.68%
37.79%
30.88%
40.09%
23.96%
58.99%
28.57%
0% 10% 20% 30% 40% 50% 60% 70% 80%
Local newspaper
Other newspapers
City of San Luis Obispo website
Attending City Council meetings
Public meetings
Talking to City Council members
City staf f members
Flyers and pamphlets
Friends and neighbors
Television news
Radio news
Social media* (e.g., Facebook posts, Twitter updates, Google+, etc.)
For me, I would most likely receive information regarding operations of the San Luis Obispo Community Development Department in the
following way(s): (check all that apply)
*See following question.

Appendix C—Resident Survey Analysis: Department Operations Information Results page 10
95.00%
15.00%
13.33%
3.33%
0% 10% 20% 30% 40% 50% 60% 70% 80% 90% 100%
Facebook posts
Twitter updates
Google+
Other, please list*
Please check the form(s) of social media that you would most likely use to receive information regarding operations of San Luis Obispo Community
Development Department. (check all that apply)
*Other responses include (1) Bob Banner and (1) Tumblr.

Appendix C—Resident Survey Analysis: Open-Ended Responses page 11
OPEN-ENDED RESPONSES
Residents were asked to respond to the following open-ended question:
Please add any specific comments or suggestions you may have for improving services in the
City's Community Development Department.
Count Resident OVERALL Responses (Summarized)
9
Listen to long-term residents instead of the political flow; Community Development staff have consistently avoided involving residents in issues that affect them; Residents are being bullied and over-run by staff; Our input is constantly neglected, avoided even!; Decisions have already been made prior to public meetings; City seems intent on a top-down approach to planning and only involving people when what they have decided is already finalized, i.e., Hillside ordinance, historical ordinance, wildland/urban fire boundaries; CDD is out of control and out of line. They have their own agenda and throw tried and true policies "under the bus" and deny residents ability to know implications of what is being considered and changed; Essential information is withheld from the public, making any presentation by staff, suspect. This results in a lot of bad feelings.
8
Need to place more emphasis on planning that reduces and mitigates the "homeless problem;" promote development goals that address the problem of the homeless and residents sharing the same space in a thoughtful way that discourages negative interactions; approach the city-wide "aggressive pan handling" problem with other agencies/departments; need better services for at-risk populations, specifically homeless outreach.
8
Continue to maintain a vision of SLO being a safe place to bicycle and a pedestrian-friendly town. Improving this infrastructure on current and future streets should be a continual consideration. Connect bike trails. Need safer walking paths on South Higuera; more walking trails and bike right-of-ways established.
6
SLO Community Development Department needs more visibility and outreach to help residents know this department exists, use fliers or ads, not just social media, or put inserts in utility bills by snail mail; perhaps branding to give the Department and its projects more recognizability; the Department should spend money on letting the public know what they do and how.
4
More resident involvement; There is no staff commitment to reach out to residents and try and solve problems; We hear about things after they are a done deal, or right before council approval; City staff does not notify residents when items are being proposed that will affect them
4
Develop a more user-friendly code enforcement system. People aren't sure who to call, someone should be willing to talk to the complainer and work out a plan of action; provide information on the number of infractions and what types are being handled, and if they are being resolved in a timely manner; complaints are not being heard.
3 Quality of life is rapidly disintegrating; issues fall on deaf ears at the City. SLO is losing its charm, quiet and safety.
3 We need affordable housing in SLO. Young professionals should be able to live and work in the City; need more less-expensive apartments.
3 Community Development Department hours should be reviewed for adequacy; the hours are absurd and staff inaccessible; Department needs to return phone calls.
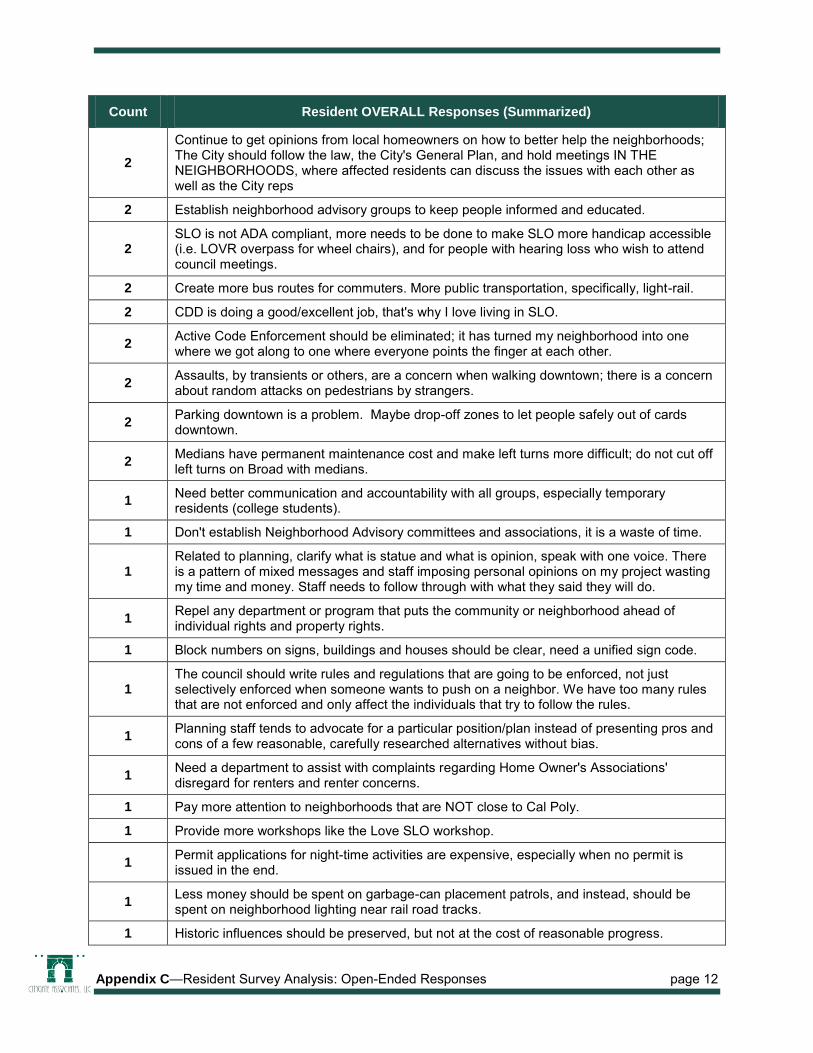
Appendix C—Resident Survey Analysis: Open-Ended Responses page 12
Count Resident OVERALL Responses (Summarized)
2
Continue to get opinions from local homeowners on how to better help the neighborhoods; The City should follow the law, the City's General Plan, and hold meetings IN THE NEIGHBORHOODS, where affected residents can discuss the issues with each other as well as the City reps
2 Establish neighborhood advisory groups to keep people informed and educated.
2 SLO is not ADA compliant, more needs to be done to make SLO more handicap accessible (i.e. LOVR overpass for wheel chairs), and for people with hearing loss who wish to attend council meetings.
2 Create more bus routes for commuters. More public transportation, specifically, light-rail.
2 CDD is doing a good/excellent job, that's why I love living in SLO.
2 Active Code Enforcement should be eliminated; it has turned my neighborhood into one where we got along to one where everyone points the finger at each other.
2 Assaults, by transients or others, are a concern when walking downtown; there is a concern about random attacks on pedestrians by strangers.
2 Parking downtown is a problem. Maybe drop-off zones to let people safely out of cards downtown.
2 Medians have permanent maintenance cost and make left turns more difficult; do not cut off left turns on Broad with medians.
1 Need better communication and accountability with all groups, especially temporary residents (college students).
1 Don't establish Neighborhood Advisory committees and associations, it is a waste of time.
1 Related to planning, clarify what is statue and what is opinion, speak with one voice. There is a pattern of mixed messages and staff imposing personal opinions on my project wasting my time and money. Staff needs to follow through with what they said they will do.
1 Repel any department or program that puts the community or neighborhood ahead of individual rights and property rights.
1 Block numbers on signs, buildings and houses should be clear, need a unified sign code.
1 The council should write rules and regulations that are going to be enforced, not just selectively enforced when someone wants to push on a neighbor. We have too many rules that are not enforced and only affect the individuals that try to follow the rules.
1 Planning staff tends to advocate for a particular position/plan instead of presenting pros and cons of a few reasonable, carefully researched alternatives without bias.
1 Need a department to assist with complaints regarding Home Owner's Associations' disregard for renters and renter concerns.
1 Pay more attention to neighborhoods that are NOT close to Cal Poly.
1 Provide more workshops like the Love SLO workshop.
1 Permit applications for night-time activities are expensive, especially when no permit is issued in the end.
1 Less money should be spent on garbage-can placement patrols, and instead, should be spent on neighborhood lighting near rail road tracks.
1 Historic influences should be preserved, but not at the cost of reasonable progress.

Appendix C—Resident Survey Analysis: Open-Ended Responses page 13
Count Resident OVERALL Responses (Summarized)
1 Slow and responsible growth should be a common goal to ensure quality of life in and around SLO.
1 Need an increased awareness of drivers to pedestrians at crosswalks, and more citations issued.
1 Put yourself in the shoes of people who want to establish, move, or change a place of business; imagine the real costs that business owners are incurring as they wait for answers from the CDD.
1 How cost effective are the services offered by the City? Can they be offered in a more cost-effective way?
1 The City needs to stop looking out for the interests of their PET developers. If a project is worthwhile to develop they should do so without multimillion dollar loans from City and free land.
Miscellaneous
1 Bikers over 18 years should have to be licensed and taught the rules.
1 Why is there a crosswalk in front of the Marsh Street theatre? It stops traffic back to Chorro Street.
1 Trying to make it too much like a fake Santa Barbara.
1 The City looks like there is no zoning. We have single-family and multi-family next to each other.
1 We need another east-west road connecting S. Higurera and S. Broad Street
1 Do something about special events; there are not special accommodations made by police in respect to traffic. (Graduation traffic is a good example.)
1 Dredge Laguna Lake and complete the Bob Jones trail.
1 City staff seems to be in its own little world and completely ignores the impacts on businesses and residents. Where is all this "outreach" the City keeps saying it is doing?