Oracle Disclosure Management, Fusion Edition User 猀 䜀...
118
ORACLE® HYPERION DISCLOSURE MANAGEMENT RELEASE 11.1.2 USER'S GUIDE
Transcript of Oracle Disclosure Management, Fusion Edition User 猀 䜀...
O R A C L E ® H Y P E R I O N D I S C L O S U R E M A N A G E M E N T
R E L E A S E 1 1 . 1 . 2
U S E R ' S G U I D E
Disclosure Management User's Guide, 11.1.2
Copyright © 2007–2010, Oracle and/or its affiliates. All rights reserved.
Authors: EPM Information Development Team
This software and related documentation are provided under a license agreement containing restrictions on use anddisclosure and are protected by intellectual property laws. Except as expressly permitted in your license agreement orallowed by law, you may not use, copy, reproduce, translate, broadcast, modify, license, transmit, distribute, exhibit,perform, publish, or display any part, in any form, or by any means. Reverse engineering, disassembly, or decompilationof this software, unless required by law for interoperability, is prohibited. The information contained herein is subject tochange without notice and is not warranted to be error-free. If you find any errors, please report them to us in writing.
If this software or related documentation is delivered to the U.S. Government or anyone licensing it on behalf of the U.S.Government, the following notice is applicable:
U.S. GOVERNMENT RIGHTS:Programs, software, databases, and related documentation and technical data delivered to U.S. Government customersare "commercial computer software" or "commercial technical data" pursuant to the applicable Federal AcquisitionRegulation and agency-specific supplemental regulations. As such, the use, duplication, disclosure, modification, andadaptation shall be subject to the restrictions and license terms set forth in the applicable Government contract, and, tothe extent applicable by the terms of the Government contract, the additional rights set forth in FAR 52.227-19, CommercialComputer Software License (December 2007). Oracle USA, Inc., 500 Oracle Parkway, Redwood City, CA 94065.
This software is developed for general use in a variety of information management applications. It is not developed orintended for use in any inherently dangerous applications, including applications which may create a risk of personalinjury. If you use this software in dangerous applications, then you shall be responsible to take all appropriate fail-safe,backup, redundancy, and other measures to ensure the safe use of this software. Oracle Corporation and its affiliatesdisclaim any liability for any damages caused by use of this software in dangerous applications.
Oracle is a registered trademark of Oracle Corporation and/or its affiliates. Other names may be trademarks of theirrespective owners.
This software and documentation may provide access to or information on content, products, and services from thirdparties. Oracle Corporation and its affiliates are not responsible for and expressly disclaim all warranties of any kind withrespect to third-party content, products, and services. Oracle Corporation and its affiliates will not be responsible for anyloss, costs, or damages incurred due to your access to or use of third-party content, products, or services.
Contents
Chapter 1. Oracle Hyperion Disclosure Management Overview . . . . . . . . . . . . . . . . . . . . . . . . . . . . . . . . . . . . 7
Introduction to Disclosure Management . . . . . . . . . . . . . . . . . . . . . . . . . . . . . . . . . . . . . 7
Understanding XBRL . . . . . . . . . . . . . . . . . . . . . . . . . . . . . . . . . . . . . . . . . . . . . . . . . . . 7
Using Taxonomies . . . . . . . . . . . . . . . . . . . . . . . . . . . . . . . . . . . . . . . . . . . . . . . . . . 8
Chapter 2. Deploying and Configuring Disclosure Management . . . . . . . . . . . . . . . . . . . . . . . . . . . . . . . . . . . 9
System Requirements . . . . . . . . . . . . . . . . . . . . . . . . . . . . . . . . . . . . . . . . . . . . . . . . . . . 9
Disclosure Management Components . . . . . . . . . . . . . . . . . . . . . . . . . . . . . . . . . . . . . . . 9
Client Components Options . . . . . . . . . . . . . . . . . . . . . . . . . . . . . . . . . . . . . . . . . . . 9
Middle Tier Services . . . . . . . . . . . . . . . . . . . . . . . . . . . . . . . . . . . . . . . . . . . . . . . . 11
Databases . . . . . . . . . . . . . . . . . . . . . . . . . . . . . . . . . . . . . . . . . . . . . . . . . . . . . . . . 12
Other Components . . . . . . . . . . . . . . . . . . . . . . . . . . . . . . . . . . . . . . . . . . . . . . . . . 12
Process Workflow Chart . . . . . . . . . . . . . . . . . . . . . . . . . . . . . . . . . . . . . . . . . . . . . 13
Server Configuration Options . . . . . . . . . . . . . . . . . . . . . . . . . . . . . . . . . . . . . . . . . . . . 14
Registering XBRL Taxonomies . . . . . . . . . . . . . . . . . . . . . . . . . . . . . . . . . . . . . . . . . 14
Taxonomy Caching . . . . . . . . . . . . . . . . . . . . . . . . . . . . . . . . . . . . . . . . . . . . . . . . . 22
Client Configuration Options . . . . . . . . . . . . . . . . . . . . . . . . . . . . . . . . . . . . . . . . . . . . 30
Setting Disclosure Management Options . . . . . . . . . . . . . . . . . . . . . . . . . . . . . . . . . 30
Chapter 3. XBRL Planning Considerations . . . . . . . . . . . . . . . . . . . . . . . . . . . . . . . . . . . . . . . . . . . . . . . . . 35
Integrating Disclosure Management . . . . . . . . . . . . . . . . . . . . . . . . . . . . . . . . . . . . . . . . 35
XBRL and Regulatory Resources . . . . . . . . . . . . . . . . . . . . . . . . . . . . . . . . . . . . . . . . . . 36
Chapter 4. Retrieving Data from Financial Services . . . . . . . . . . . . . . . . . . . . . . . . . . . . . . . . . . . . . . . . . . 37
Report Level versus Data Source Mapping . . . . . . . . . . . . . . . . . . . . . . . . . . . . . . . . . . . 37
Mapping Data Sources in Smart View . . . . . . . . . . . . . . . . . . . . . . . . . . . . . . . . . . . . . . 38
Inserting a Smart Slice Function Grid . . . . . . . . . . . . . . . . . . . . . . . . . . . . . . . . . . . . 38
Inserting a Financial Reporting Function Grid . . . . . . . . . . . . . . . . . . . . . . . . . . . . . 40
Mapping Financial Reporting Data Sources . . . . . . . . . . . . . . . . . . . . . . . . . . . . . . . . . . 42
Displaying the Disclosure Management Mapping Tool . . . . . . . . . . . . . . . . . . . . . . . 42
Mapping Concepts in Financial Reporting . . . . . . . . . . . . . . . . . . . . . . . . . . . . . . . . 43
Contents iii
Chapter 5. Generating XBRL Instance Documents . . . . . . . . . . . . . . . . . . . . . . . . . . . . . . . . . . . . . . . . . . . 45
Creating XBRL Instance Documents . . . . . . . . . . . . . . . . . . . . . . . . . . . . . . . . . . . . . . . 45
Connecting to the Disclosure Management Server . . . . . . . . . . . . . . . . . . . . . . . . . . . . . . 46
Viewing Data in Financial Statements . . . . . . . . . . . . . . . . . . . . . . . . . . . . . . . . . . . . . . . 46
Mapping Financial Statements to Taxonomies . . . . . . . . . . . . . . . . . . . . . . . . . . . . . . . . 47
Disclosure Management Interface . . . . . . . . . . . . . . . . . . . . . . . . . . . . . . . . . . . . . . 48
Working with XBRL Taxonomy Concepts . . . . . . . . . . . . . . . . . . . . . . . . . . . . . . . . . . . 50
Selecting a Taxonomy . . . . . . . . . . . . . . . . . . . . . . . . . . . . . . . . . . . . . . . . . . . . . . . 50
Changing Taxonomy Views . . . . . . . . . . . . . . . . . . . . . . . . . . . . . . . . . . . . . . . . . . . 51
Mapping a Concept to a Taxonomy . . . . . . . . . . . . . . . . . . . . . . . . . . . . . . . . . . . . . 56
Removing a Mapped Concept . . . . . . . . . . . . . . . . . . . . . . . . . . . . . . . . . . . . . . . . . 57
Refreshing a Taxonomy . . . . . . . . . . . . . . . . . . . . . . . . . . . . . . . . . . . . . . . . . . . . . . 58
Viewing Taxonomies . . . . . . . . . . . . . . . . . . . . . . . . . . . . . . . . . . . . . . . . . . . . . . . . 58
Viewing Concept Detail . . . . . . . . . . . . . . . . . . . . . . . . . . . . . . . . . . . . . . . . . . . . . . 59
Changing a Taxonomy . . . . . . . . . . . . . . . . . . . . . . . . . . . . . . . . . . . . . . . . . . . . . . 60
Searching Taxonomy Concepts . . . . . . . . . . . . . . . . . . . . . . . . . . . . . . . . . . . . . . . . 62
Working with XBRL Contexts . . . . . . . . . . . . . . . . . . . . . . . . . . . . . . . . . . . . . . . . . . . . 63
Adding a XBRL Context . . . . . . . . . . . . . . . . . . . . . . . . . . . . . . . . . . . . . . . . . . . . . 63
Mapping to a Context . . . . . . . . . . . . . . . . . . . . . . . . . . . . . . . . . . . . . . . . . . . . . . . 64
Removing a Mapped Context . . . . . . . . . . . . . . . . . . . . . . . . . . . . . . . . . . . . . . . . . 64
Updating a Context . . . . . . . . . . . . . . . . . . . . . . . . . . . . . . . . . . . . . . . . . . . . . . . . . 65
Deleting a Context . . . . . . . . . . . . . . . . . . . . . . . . . . . . . . . . . . . . . . . . . . . . . . . . . 65
Viewing Contexts . . . . . . . . . . . . . . . . . . . . . . . . . . . . . . . . . . . . . . . . . . . . . . . . . . 66
Looking Up Contexts . . . . . . . . . . . . . . . . . . . . . . . . . . . . . . . . . . . . . . . . . . . . . . . 66
Viewing Context Detail . . . . . . . . . . . . . . . . . . . . . . . . . . . . . . . . . . . . . . . . . . . . . . 67
Working with XBRL Units . . . . . . . . . . . . . . . . . . . . . . . . . . . . . . . . . . . . . . . . . . . . . . . 68
Adding XBRL Units . . . . . . . . . . . . . . . . . . . . . . . . . . . . . . . . . . . . . . . . . . . . . . . . 68
Mapping to a Unit . . . . . . . . . . . . . . . . . . . . . . . . . . . . . . . . . . . . . . . . . . . . . . . . . 68
Removing a Mapped Unit . . . . . . . . . . . . . . . . . . . . . . . . . . . . . . . . . . . . . . . . . . . . 69
Updating a Unit . . . . . . . . . . . . . . . . . . . . . . . . . . . . . . . . . . . . . . . . . . . . . . . . . . . 69
Deleting a Unit . . . . . . . . . . . . . . . . . . . . . . . . . . . . . . . . . . . . . . . . . . . . . . . . . . . . 69
Viewing Units . . . . . . . . . . . . . . . . . . . . . . . . . . . . . . . . . . . . . . . . . . . . . . . . . . . . . 70
Looking Up Units . . . . . . . . . . . . . . . . . . . . . . . . . . . . . . . . . . . . . . . . . . . . . . . . . . 70
Viewing Unit Detail . . . . . . . . . . . . . . . . . . . . . . . . . . . . . . . . . . . . . . . . . . . . . . . . 70
Working with Footnotes . . . . . . . . . . . . . . . . . . . . . . . . . . . . . . . . . . . . . . . . . . . . . . . . 71
Adding Footnotes . . . . . . . . . . . . . . . . . . . . . . . . . . . . . . . . . . . . . . . . . . . . . . . . . . 71
Mapping to a Footnote . . . . . . . . . . . . . . . . . . . . . . . . . . . . . . . . . . . . . . . . . . . . . . 72
Removing a Mapped Footnote . . . . . . . . . . . . . . . . . . . . . . . . . . . . . . . . . . . . . . . . . 72
Updating a Footnote . . . . . . . . . . . . . . . . . . . . . . . . . . . . . . . . . . . . . . . . . . . . . . . . 73
iv Contents
Deleting a Footnote . . . . . . . . . . . . . . . . . . . . . . . . . . . . . . . . . . . . . . . . . . . . . . . . . 73
Formatting a Footnote . . . . . . . . . . . . . . . . . . . . . . . . . . . . . . . . . . . . . . . . . . . . . . 73
Reviewing Footnotes . . . . . . . . . . . . . . . . . . . . . . . . . . . . . . . . . . . . . . . . . . . . . . . . 75
Looking Up a Footnote . . . . . . . . . . . . . . . . . . . . . . . . . . . . . . . . . . . . . . . . . . . . . . 75
Viewing Footnote Detail . . . . . . . . . . . . . . . . . . . . . . . . . . . . . . . . . . . . . . . . . . . . . 76
Working with Dimensions . . . . . . . . . . . . . . . . . . . . . . . . . . . . . . . . . . . . . . . . . . . . . . . 76
Using the Dimension View . . . . . . . . . . . . . . . . . . . . . . . . . . . . . . . . . . . . . . . . . . . 76
Mapping Primary Items . . . . . . . . . . . . . . . . . . . . . . . . . . . . . . . . . . . . . . . . . . . . . 78
Mapping Domain and Domain Members . . . . . . . . . . . . . . . . . . . . . . . . . . . . . . . . . 78
Validating a Dimension Mapping . . . . . . . . . . . . . . . . . . . . . . . . . . . . . . . . . . . . . . 78
Dimension Map Storage . . . . . . . . . . . . . . . . . . . . . . . . . . . . . . . . . . . . . . . . . . . . . 79
Instance Generation . . . . . . . . . . . . . . . . . . . . . . . . . . . . . . . . . . . . . . . . . . . . . . . . 80
Working with Tuples . . . . . . . . . . . . . . . . . . . . . . . . . . . . . . . . . . . . . . . . . . . . . . . . . . 80
Using the Tuple View . . . . . . . . . . . . . . . . . . . . . . . . . . . . . . . . . . . . . . . . . . . . . . . 81
Removing Mapped Data and Deleting XBRL Objects . . . . . . . . . . . . . . . . . . . . . . . . . . . . 83
Remove XBRL Map . . . . . . . . . . . . . . . . . . . . . . . . . . . . . . . . . . . . . . . . . . . . . . . . 83
XBRL Object Deletions . . . . . . . . . . . . . . . . . . . . . . . . . . . . . . . . . . . . . . . . . . . . . . 85
Working with Suppressed Mappings . . . . . . . . . . . . . . . . . . . . . . . . . . . . . . . . . . . . . . . 85
Reviewing Taxonomies . . . . . . . . . . . . . . . . . . . . . . . . . . . . . . . . . . . . . . . . . . . . . . . . . 87
Changing Display Views . . . . . . . . . . . . . . . . . . . . . . . . . . . . . . . . . . . . . . . . . . . . . 87
Detaching a Table . . . . . . . . . . . . . . . . . . . . . . . . . . . . . . . . . . . . . . . . . . . . . . . . . . 88
Showing a Calculation Trace . . . . . . . . . . . . . . . . . . . . . . . . . . . . . . . . . . . . . . . . . . 88
Showing a Formula Trace . . . . . . . . . . . . . . . . . . . . . . . . . . . . . . . . . . . . . . . . . . . . 89
Changing Decimal/Precision Values in Review Mode . . . . . . . . . . . . . . . . . . . . . . . . 89
Overriding Fact Values . . . . . . . . . . . . . . . . . . . . . . . . . . . . . . . . . . . . . . . . . . . . . . 91
Validating in Review Mode . . . . . . . . . . . . . . . . . . . . . . . . . . . . . . . . . . . . . . . . . . . 91
Working with Validation Error Messages . . . . . . . . . . . . . . . . . . . . . . . . . . . . . . . . . 91
Review Mode Navigation Options . . . . . . . . . . . . . . . . . . . . . . . . . . . . . . . . . . . . . . 92
Generating Instance Documents . . . . . . . . . . . . . . . . . . . . . . . . . . . . . . . . . . . . . . . . . . 92
Validating Mapped Data . . . . . . . . . . . . . . . . . . . . . . . . . . . . . . . . . . . . . . . . . . . . . 93
Exporting the Instance document . . . . . . . . . . . . . . . . . . . . . . . . . . . . . . . . . . . . . . 94
Previewing XBRL Output . . . . . . . . . . . . . . . . . . . . . . . . . . . . . . . . . . . . . . . . . . . . 95
Displaying the Instance Document in the Instance Viewer (SEC or Other) . . . . . . . . . . . . 97
Instance Generation and Validation Architecture . . . . . . . . . . . . . . . . . . . . . . . . . . . . . . 98
Chapter 6. Mapping Manager . . . . . . . . . . . . . . . . . . . . . . . . . . . . . . . . . . . . . . . . . . . . . . . . . . . . . . . . 101
Launching the Mapping Manager . . . . . . . . . . . . . . . . . . . . . . . . . . . . . . . . . . . . . . . . 101
Searching the Mapping Manager . . . . . . . . . . . . . . . . . . . . . . . . . . . . . . . . . . . . . . . . . 102
Deleting a Mapping . . . . . . . . . . . . . . . . . . . . . . . . . . . . . . . . . . . . . . . . . . . . . . . . . . . 104
Contents v
Changing a Data Source . . . . . . . . . . . . . . . . . . . . . . . . . . . . . . . . . . . . . . . . . . . . . . . 105
Changing an Element . . . . . . . . . . . . . . . . . . . . . . . . . . . . . . . . . . . . . . . . . . . . . . . . . 105
Chapter 7. Working with Master Documents and Doclets . . . . . . . . . . . . . . . . . . . . . . . . . . . . . . . . . . . . . 107
Adding a Master Document . . . . . . . . . . . . . . . . . . . . . . . . . . . . . . . . . . . . . . . . . . . . . 107
Adding a Doclet . . . . . . . . . . . . . . . . . . . . . . . . . . . . . . . . . . . . . . . . . . . . . . . . . . . . . 108
Appendix A. Glossary of XBRL and Disclosure Management Terms . . . . . . . . . . . . . . . . . . . . . . . . . . . . . . . 111
Index . . . . . . . . . . . . . . . . . . . . . . . . . . . . . . . . . . . . . . . . . . . . . . . . . . . . . . . . . . . . . . . . . . . . . . . . . 115
vi Contents
1Oracle Hyperion Disclosure
Management Overview
In This Chapter
Introduction to Disclosure Management .. . . . . . . . . . . . . . . . . . . . . . . . . . . . . . . . . . . . . . . . . . . . . . . . . . . . . . . . . . . . . . . . . 7
Understanding XBRL ... . . . . . . . . . . . . . . . . . . . . . . . . . . . . . . . . . . . . . . . . . . . . . . . . . . . . . . . . . . . . . . . . . . . . . . . . . . . . . . . . . . . . . 7
Introduction to Disclosure ManagementOracle Hyperion Disclosure Management is a toolset designed to help you create, edit and submitinstance documents for submission to a regulatory agency (for example a 10K or 10Q submittedto the SEC). You can assemble a financial statement, supporting schedules and commentary,which may exist in Excel, Word or an Oracle Hyperion Financial Reporting, Fusion Editionreport, and map to and deliver the content in a XBRL® (Extensible Business Reporting Language)format. The key purpose of the product is to centralize and manage the critical documents neededin the close cycle to significantly reduce the risk of an inaccurate disclosure.
Disclosure Management offers a complete XBRL creation and management solution with thefollowing functionality:
l Enterprise level XBRL mapping that consists of: report level mapping within MicrosoftOffice, Oracle Hyperion Smart View for Office, Fusion Edition and Financial Reporting;reusable data source metadata mapping within Oracle Hyperion Financial Management,Fusion Edition, Oracle Hyperion Planning, Fusion Edition and Oracle Essbase.
l XBRL Taxonomy management, editing and viewing. Taxonomy management includesextensions to taxonomies which allows companies to easily adapt to the evolving XBRLstandards. Updated taxonomies can be used against existing maps.
l Instance document validation, generation and viewing
Understanding XBRLXBRL is a freely available electronic language for financial reporting that is based on ExtensibleMarkup Language (XML), and is produced and consumed by XBRL enabled software. Oncedata has been mapped, software—rather than human labor—is used to select, analyze, store,and exchange information, thereby reducing the chances of error. Moreover, because it is astandardized language, XBRL enables efficient apples-to-apples comparison of financial dataacross multiple companies and industries. To this end, XBRL applies identifying mappings toitems of data, allowing them to be processed and analyzed in an interactive way. The use of XBRL
Introduction to Disclosure Management 7
mappings provide financial communities with a digital standards-based method to prepare,publish, reliably extract, and automatically exchange financial statements of publicly heldcompanies. XBRL does not establish new accounting standards. Instead, it enhances the usabilityof existing standards.
XBRL taxonomies specify an arrangement of data so that the value of a concept is defined withina context. For example, company ACME, Inc. reports Gross Profit of $152,623 in Quarter 1.This information can be represented in XBRL as it indicates the company identity (ACME, Inc.,) ,a reporting concept (Gross Profit), the reported currency (dollars), time period , and decimal/precision rounding setting.
Using TaxonomiesXBRL taxonomies are central to the creation of XBRL documents. Whereas the XBRL documentscontain a snapshot of business and financial facts; the XBRL taxonomies provide the definitionsand relationships about these facts. Taxonomies are the “dictionaries” of XBRL. They define theindividual reporting concepts (such as "net profit") and the relationships between them.Different taxonomies are required for different financial reporting purposes. Regionalgovernments may need their own financial reporting taxonomies to reflect their local accountingregulations. Organizations, such as non-profits and corporations require taxonomies to handletheir own business reporting requirements.
XBRL taxonomies may represent hundreds of individual business reporting concepts(elements). Each element has specific attributes that helps to define it, such as the labels, datatypes, expected balance type, and other data attributes.
The published taxonomies are “standard” taxonomies that represent most of what a typicalcompany needs to report. XBRL also allows company extensions – or modifications to apublished taxonomy - for reporting specifications that are specific to the company.
Companies need to use the corresponding to taxonomy for their country or jurisdiction andindustry, for example US GAAP taxonomies which have been officially recognized by XBRLInternational are listed at: http://www.xbrl.org/FRTaxonomies/
8 Oracle Hyperion Disclosure Management Overview
2Deploying and Configuring
Disclosure Management
In This Chapter
System Requirements ... . . . . . . . . . . . . . . . . . . . . . . . . . . . . . . . . . . . . . . . . . . . . . . . . . . . . . . . . . . . . . . . . . . . . . . . . . . . . . . . . . . . 9
Disclosure Management Components ... . . . . . . . . . . . . . . . . . . . . . . . . . . . . . . . . . . . . . . . . . . . . . . . . . . . . . . . . . . . . . . . . . 9
Server Configuration Options ... . . . . . . . . . . . . . . . . . . . . . . . . . . . . . . . . . . . . . . . . . . . . . . . . . . . . . . . . . . . . . . . . . . . . . . . . . .14
Client Configuration Options ... . . . . . . . . . . . . . . . . . . . . . . . . . . . . . . . . . . . . . . . . . . . . . . . . . . . . . . . . . . . . . . . . . . . . . . . . . . .30
System RequirementsThe following components must be installed to use Disclosure Management:
l Installed and configured 11.1.2 or later version of Disclosure Management
l Installed and configured Smart View and Disclosure Management Microsoft Office clientcomponents (Office 2003 or 2007)
l Microsoft Internet Explorer version 7 or higher
Disclosure Management ComponentsThis section includes information on the following Disclosure Management client and servercomponents:
l “Client Components Options” on page 9
l “Middle Tier Services” on page 11
l “Databases” on page 12
l “Other Components” on page 12
It also includes a “Process Workflow Chart” on page 13.
Client Components OptionsThis section includes information on the following client components of DisclosureManagement:
l “Disclosure Management XBRL Add-in for Microsoft Office” on page 10
l “Financial Reporting HTML Preview” on page 10
System Requirements 9

l “Smart View (APS) and Data Source Access” on page 10
l “Disclosure Management Mapping Tool ” on page 10
l “Mapping Manager” on page 11
Disclosure Management XBRL Add-in for Microsoft OfficeThe Disclosure Management add-in for MS Office provides an interface to all of its featureswithin the MS Office framework (specifically, Excel and Word). The add-in integrates with theDisclosure Management web application service. It is an extension of the Smart View panel.
Financial Reporting HTML PreviewThe Disclosure Management Mapping Tool is integrated in the Financial Reporting HTMLPreview. It is possible to map XBRL concepts to report data in a grid. This includes data fromdata sources (such as Financial Management, Planning, and Essbase) as well as formula and textcells. Data with XBRL maps from a Financial Reporting grid can be reused and imported intoone or more Word or Excel document(s) by way of Smart View. Once the data is imported intoan Office document, the Disclosure Management add-in determines and consume all relevantXBRL maps from the Financial Reporting function grid.
Smart View (APS) and Data Source AccessData from Oracle Hyperion data sources such as Financial Management, Planning and Essbasecan be imported into a Word or Excel document by way of the Smart View Analytic ProviderServices (APS). After the data is in the Office document, the data source members can beassociated with XBRL concepts via the Disclosure Management Mapping Tool. When thisassociation occurs, the XBRL concepts are recognized from the data source member when it ispart of a Financial Reporting grid or another Office document. Therefore a "data source XBRLmap" can be associated once and reused in multiple Office documents and/or FinancialReporting grids.
Disclosure Management Mapping Tool The Disclosure Management Mapping Tool is used to map information between the items of ataxonomy and to the selected data value or values in an Office document or Financial Reporting.The Disclosure Management Mapping Tool is the central piece for most of the client-side userinteractions. The Disclosure Management Mapping Tool is an add-in component for Officeapplications (Microsoft Word or Excel), and also bundled with Financial Reporting. Users caneasily select taxonomies, manage mappings, and validate XBRL instance documents using theDisclosure Management Mapping Tool.
The Disclosure Management Mapping Tool:
l Renders XBRL taxonomies and provides mapping functionality.
l Exposes most of the client-side user interactions.
l Used by the Office Add-in and Financial Reporting.
10 Deploying and Configuring Disclosure Management
l Provides a uniform user interface across all client customers.
l Includes taxonomy search capability and view customization.
l Allows for reviewing and validation of all mappings.
The add in for Word and Excel provides the following mapping features:
l XBRL Taxonomy Concepts
l XBRL Contexts
l XBRL Units
l XBRL Footnotes
Additionally, instance documents cannot be generated from the Disclosure ManagementMapping Tool in Financial Reporting HTML Preview.
Mapping ManagerThe Mapping Manager provides an interface to select, change and disassociate concept mappingsassociated with a given taxonomy which are stored in the Mapping Repository. It is shared withFinancial Reporting, Smart View, and the Disclosure Management add-ins (MS Word andExcel). The Mapping Manager is exposed in the Oracle Enterprise Performance ManagementWorkspace, Fusion Edition and launched from the MS Office Add-In in Word.
Note: Non-taxonomy mappings such as XBRL contexts, units and footnotes are stored locallywithin an Office document.
Middle Tier ServicesThe Disclosure Management web application interacts with several middle tier componentswhich can exist on a distributed environment. This section highlights the most important middletier components:
l “Disclosure Management Web Application Service” on page 11
l “Financial Reporting Web Application Service” on page 12
Disclosure Management Web Application ServiceA J2EE-based web application that provides services to most of the components in the DisclosureManagement. This service interacts with the client-layer components, other middle-tier services,and the data storage components.
l “Disclosure Management Web Application Service” on page 11
l “Financial Reporting Web Application Service” on page 12
Disclosure Management Components 11

Financial Reporting Web Application ServiceThe Financial Reporting web application runs, stores and schedules reports and batches. Formore information, see the Oracle Hyperion Financial Reporting Fusion Edition, Administrator'sGuide.
DatabasesDisclosure Management database sources includes the Mapping Reporting and Oracle Hyperiondata sources:
l “Mapping Repository” on page 12
l “Oracle Hyperion Data Sources” on page 12
Mapping RepositoryThe Mapping Repository is a server-side application responsible for storing and retrieving allthe XBRL taxonomy mappings created by the Disclosure Management Mapping Tool. When auser creates, modifies or deletes a mapping, the mappings are centrally stored in the MappingRepository. Users cannot load and view mappings directly from the Map Repository. Instead,users must use the Mapping Manager (launched from the Enterprise Performance ManagementWorkspace to select and modify mappings.
Oracle Hyperion Data SourcesDisclosure Management supports Enterprise Performance Management (EPM) data sourcessuch as Financial Management, Planning, and Essbase. Data sources can be reused and importedinto one or more Word or Excel document(s) by way of Smart View.
Data from non-EPM sources, such as Enterprise Resource Planning (ERP) systems can also beused when they are imported into Word or Excel.
Other ComponentsOther Disclosure Management components include:
l “Disclosure Management XBRL Taxonomy Designer” on page 12
l “Instance Document Viewer” on page 13
l “Disclosure Management Report Manager” on page 13
Disclosure Management XBRL Taxonomy DesignerDisclosure Management XBRL Taxonomy Designer is a desktop application designed forbuilding, extending, and maintaining XBRL taxonomies. As a complete integrated developmentenvironment it also offers features like an instance document editor, a built-in XBRL 2.1compliant processor, a business rules editor, and input document mapping tools. The Disclosure
12 Deploying and Configuring Disclosure Management
Management Taxonomy Designer user interface offers multiple views, including conceptrelationships, calculations, languages, and properties that stay synchronized as the taxonomy isbrowsed. Disclosure Management Taxonomy Designer offers support for the most currentXBRL 2.1 specification including dimensions and tuples, and has a built-in interface for sever-based multiple user version tracking.
The Disclosure Management XBRL Taxonomy Designer is installed with the DisclosureManagement application. For more information, see the Disclosure Management XBRLTaxonomy Designer Help.
Instance Document ViewerYou can view instance documents in a human readable format (that is, not the raw XMLversions). Disclosure Management support three instance document viewers:
l Raw XML Viewer
l Generic Viewer
l SEC Viewer
Disclosure Management Report ManagerThe Disclosure Management Report Manager report writers can use this interface to managertheir master documents and doclets.
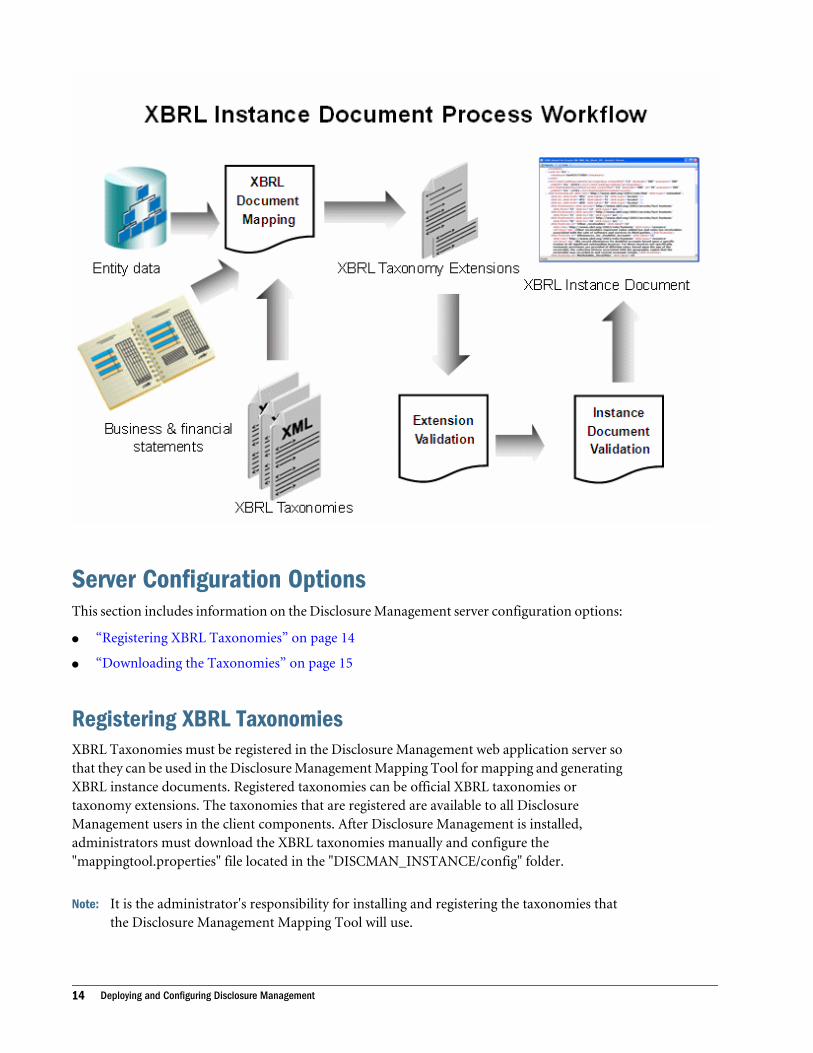
Process Workflow ChartThe workflow chart below shows the tasks involved in mapping your reporting data to a XBRLtaxonomy and creating an instance document.
Disclosure Management Components 13
Server Configuration OptionsThis section includes information on the Disclosure Management server configuration options:
l “Registering XBRL Taxonomies” on page 14
l “Downloading the Taxonomies” on page 15
Registering XBRL TaxonomiesXBRL Taxonomies must be registered in the Disclosure Management web application server sothat they can be used in the Disclosure Management Mapping Tool for mapping and generatingXBRL instance documents. Registered taxonomies can be official XBRL taxonomies ortaxonomy extensions. The taxonomies that are registered are available to all DisclosureManagement users in the client components. After Disclosure Management is installed,administrators must download the XBRL taxonomies manually and configure the"mappingtool.properties" file located in the "DISCMAN_INSTANCE/config" folder.
Note: It is the administrator's responsibility for installing and registering the taxonomies thatthe Disclosure Management Mapping Tool will use.
14 Deploying and Configuring Disclosure Management

Downloading the TaxonomiesOfficial XBRL taxonomies are normally downloaded from official taxonomy sites, such as:www.xbrl.org.
Popular taxonomies are available at:
l http://www.xbrl.us—US taxonomies, such as US-GAAP 2009
l http://www.iasb.org/XBRL/IFRS+Taxonomy/IFRS+Taxonomy.htm—Current IFRStaxonomy, such as IFRS for 2010
Extracting the TaxonomiesTaxonomies must be stored and registered at the computer hosting the web application.Typically, taxonomies are downloaded in a compressed file format. When extracting ataxonomy, it is important to maintain the folder structure of all the taxonomy files when theyare obtained from a compressed format. In the example below, the IFRS and US_GAAPtaxonomies have been downloaded, and extracted to the sub directories shown.
ä To extract a taxonomy:
1 If it does not already exist on the Disclosure Management folder, locate the DISCMAN_NSTANCE/XbrlFiles.
2 Uncompress the taxonomy files to: DISCMAN_NSTANCE/XbrlFiles.
Ensure that the folder structure is maintained.
3 Make sure that the Disclosure Management web application has read access to the "XbrlFiles" folderand its files.
Registering and Viewing the XBRL Taxonomy StructureWhen Disclosure Management web application is installed, a properties file named“mappingtool.properties” is placed in the DISCMAN_INSTANCE/config folder. The
Server Configuration Options 15
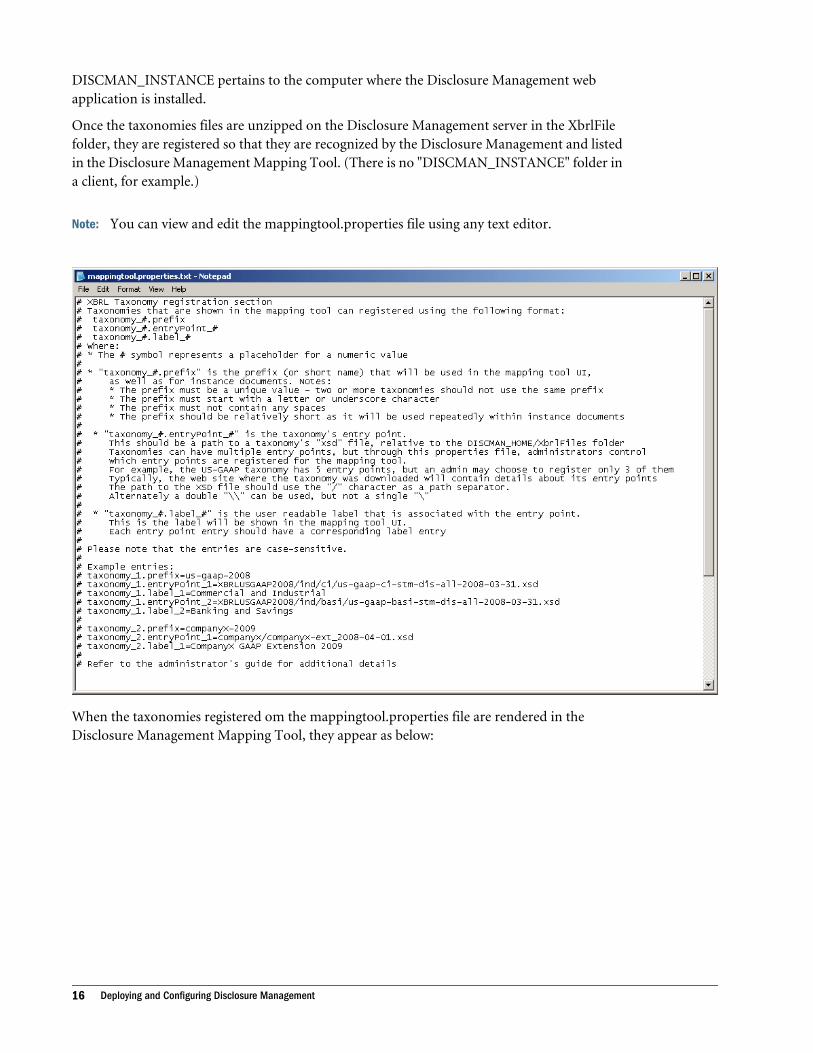
DISCMAN_INSTANCE pertains to the computer where the Disclosure Management webapplication is installed.
Once the taxonomies files are unzipped on the Disclosure Management server in the XbrlFilefolder, they are registered so that they are recognized by the Disclosure Management and listedin the Disclosure Management Mapping Tool. (There is no "DISCMAN_INSTANCE" folder ina client, for example.)
Note: You can view and edit the mappingtool.properties file using any text editor.
When the taxonomies registered om the mappingtool.properties file are rendered in theDisclosure Management Mapping Tool, they appear as below:
16 Deploying and Configuring Disclosure Management
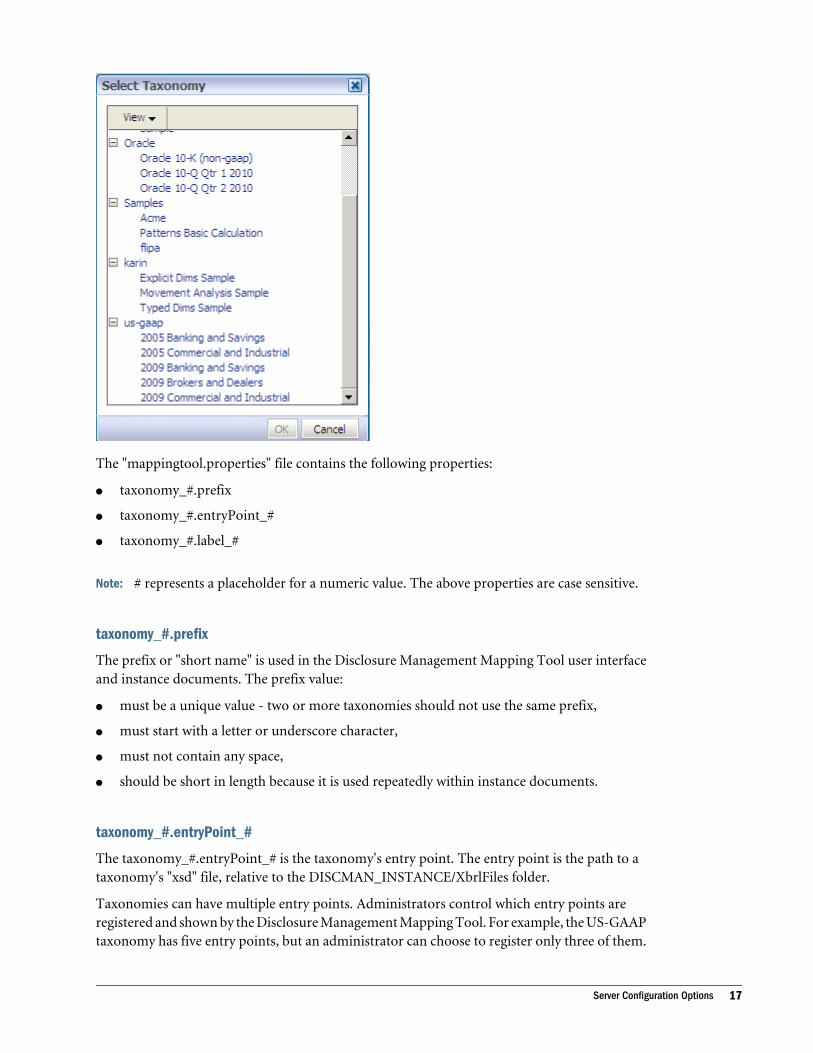
The "mappingtool.properties" file contains the following properties:
l taxonomy_#.prefix
l taxonomy_#.entryPoint_#
l taxonomy_#.label_#
Note: # represents a placeholder for a numeric value. The above properties are case sensitive.
taxonomy_#.prefix
The prefix or "short name" is used in the Disclosure Management Mapping Tool user interfaceand instance documents. The prefix value:
l must be a unique value - two or more taxonomies should not use the same prefix,
l must start with a letter or underscore character,
l must not contain any space,
l should be short in length because it is used repeatedly within instance documents.
taxonomy_#.entryPoint_#
The taxonomy_#.entryPoint_# is the taxonomy's entry point. The entry point is the path to ataxonomy's "xsd" file, relative to the DISCMAN_INSTANCE/XbrlFiles folder.
Taxonomies can have multiple entry points. Administrators control which entry points areregistered and shown by the Disclosure Management Mapping Tool. For example, the US-GAAPtaxonomy has five entry points, but an administrator can choose to register only three of them.
Server Configuration Options 17

The web site from which the taxonomy was downloaded usually contains details about its entrypoints.
The path to the XSD file should use the "/" character as a path separator. Alternately a double "\\" can be used, but not a single "\", for example,
Table 1 Taxonomy_#entryPoint_#
Entry Result
us-gaap/ci/us-gaap-ci-all.xsd Valid
us-gaap\\ci\\us-gaap-ci-all.xsd Valid
us-gaap\ci\us-gaap-ci-all.xsd Invalid
taxonomy_#.label_#
taxonomy_#.label_# is the user readable label that is associated with the entry point.
The label is shown in theDisclosure Management Mapping Tool user interface.
Each entry point value should have a corresponding label entry.
Taxonomy Properties Example
The following is an example of how a "mappingtool.properties" file might be specified: Fourtaxonomies are registered:
l US-GAPP 2009
l US-GAPP 2008
l Oracle Extension (i.e. a custom taxonomy) to the US-GAAP 2008 taxonomy
l IFRS 2009
The US-GAAP 2009 taxonomy defines five entry points, but based on the schema below theDisclosure Management Mapping Tool only shows two of them ("Banking and Savings" and"Commercial and Industrial"). The US-GAAP 2008 taxonomy shows three entry points("Banking and Savings", "Commercial and Industrial" and "Real Estate"):
taxonomy_1.prefix=us-gaap-2009taxonomy_1.entryPoint_1=XBRLUSGAAP/2009-01-31/ind/basi/us-gaap-basi-stm-dis-all-2009-01-31.xsdtaxonomy_1.label_1=Banking and Savingstaxonomy_1.entryPoint_2=XBRLUSGAAP/2009-01-31/ind/ci/us-gaap-ci-stm-dis-all-2009-01-31.xsdtaxonomy_1.label_2=Commercial and Industrial
taxonomy_2.prefix=us-gaap-2008taxonomy_2.entryPoint_1=XBRLUSGAAP/2008-03-31/ind/ci/us-gaap-ci-stm-dis-all-2008-03-31.xsdtaxonomy_2.label_1=Commercial and Industrialtaxonomy_2.entryPoint_2=XBRLUSGAAP/2008-03-31/ind/basi/us-gaap-basi-stm-dis-
18 Deploying and Configuring Disclosure Management
all-2008-03-31.xsdtaxonomy_2.label_2=Banking and Savingstaxonomy_2.entryPoint_3=XBRLUSGAAP/2008-03-31/ind/re/us-gaap-re-stm-dis-all-2008-03-31.xsdtaxonomy_2.label_3=Real Estate
taxonomy_3.prefix=orcl-2008taxonomy_3.entryPoint_1=oracle/2008-04-01/oracle-ext_2008-04-01.xsdtaxonomy_3.label_1=Oracle GAAP Extension
taxonomy_4.prefix=ifrs-2009taxonomy_4.entryPoint_1=ifrs-2009-04-01/ifrs-cor_2009-04-01.xsdtaxonomy_4.label_1=IFRS Core
Configuring the Unit Type List The units or currency list that is displayed when creating a unit in the Disclosure ManagementMapping Tool is derived and configured in the mappingtool.properties file. Units types areavailable in the from the Measure field (see “Adding XBRL Units” on page 68). The unit typecode corresponds to the ISO (International Organization for Standardization) 4217 standard.In the mappingtool.properties file, the current unit values are:
l unit_type1=share
l unit_type2=pure
l unit_type3=iso4217:AED
l unit_type4=iso4217:AUD
l unit_type5=iso4217:CAD
l unit_type6=iso4217:CAF
l nit_type7=iso4217:SGD
l unit_type8=iso4217:USD
l unit_type9=iso4217:DEM
l unit_type11=iso4217:NZD
l unit_type12=iso4217:PLN
l unit_type13=iso4217:PLN
When you create a new unit type, the default unit type code is: unit_type8=iso4217:USD.
ä To add or change a unit type:
1 Navigate to the "mappingtool.properties" file located in the "DISCMAN_INSTANCE/config" folder.
2 Using any text editor, open the mappingtool.properties file.
The mappingtool.properties file is displayed.
Server Configuration Options 19
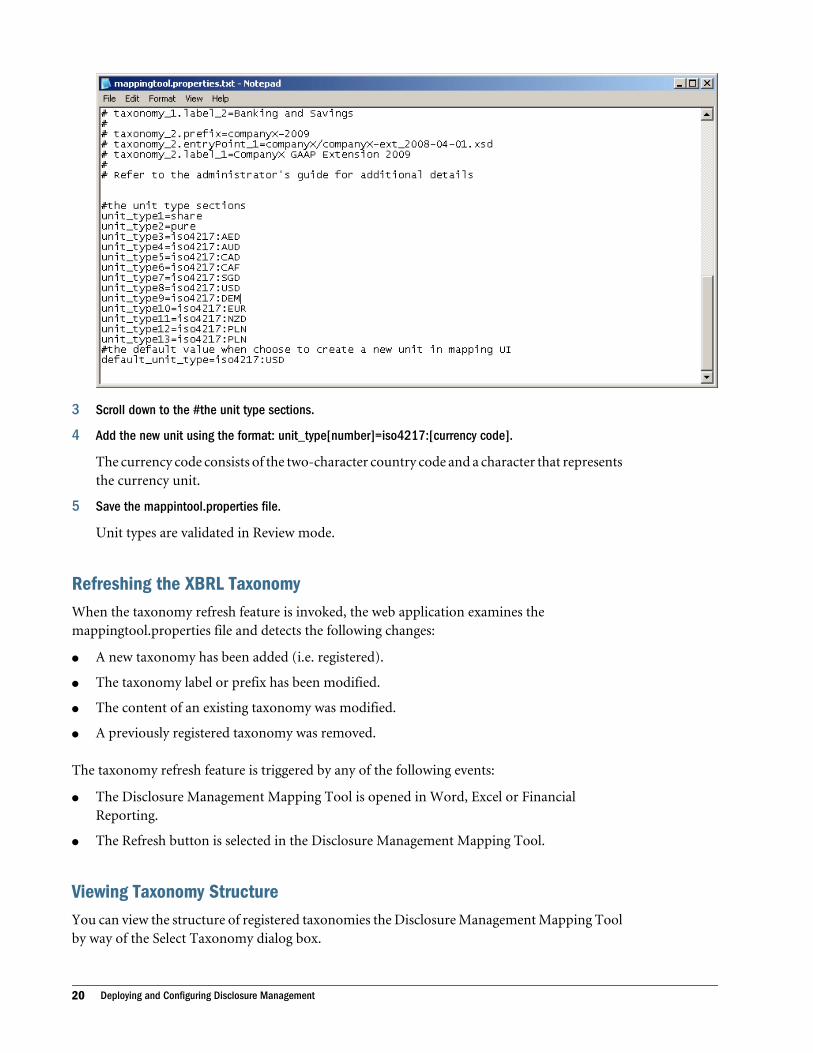
3 Scroll down to the #the unit type sections.
4 Add the new unit using the format: unit_type[number]=iso4217:[currency code].
The currency code consists of the two-character country code and a character that representsthe currency unit.
5 Save the mappintool.properties file.
Unit types are validated in Review mode.
Refreshing the XBRL TaxonomyWhen the taxonomy refresh feature is invoked, the web application examines themappingtool.properties file and detects the following changes:
l A new taxonomy has been added (i.e. registered).
l The taxonomy label or prefix has been modified.
l The content of an existing taxonomy was modified.
l A previously registered taxonomy was removed.
The taxonomy refresh feature is triggered by any of the following events:
l The Disclosure Management Mapping Tool is opened in Word, Excel or FinancialReporting.
l The Refresh button is selected in the Disclosure Management Mapping Tool.
Viewing Taxonomy StructureYou can view the structure of registered taxonomies the Disclosure Management Mapping Toolby way of the Select Taxonomy dialog box.
20 Deploying and Configuring Disclosure Management
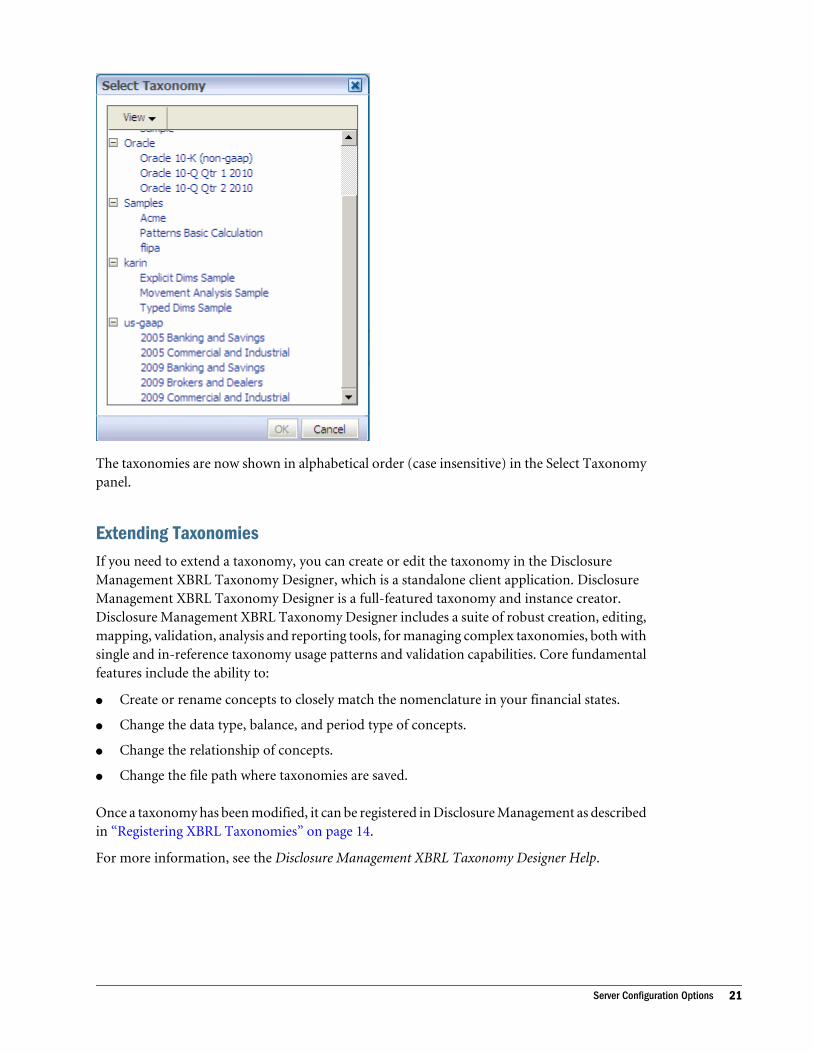
The taxonomies are now shown in alphabetical order (case insensitive) in the Select Taxonomypanel.
Extending TaxonomiesIf you need to extend a taxonomy, you can create or edit the taxonomy in the DisclosureManagement XBRL Taxonomy Designer, which is a standalone client application. DisclosureManagement XBRL Taxonomy Designer is a full-featured taxonomy and instance creator.Disclosure Management XBRL Taxonomy Designer includes a suite of robust creation, editing,mapping, validation, analysis and reporting tools, for managing complex taxonomies, both withsingle and in-reference taxonomy usage patterns and validation capabilities. Core fundamentalfeatures include the ability to:
l Create or rename concepts to closely match the nomenclature in your financial states.
l Change the data type, balance, and period type of concepts.
l Change the relationship of concepts.
l Change the file path where taxonomies are saved.
Once a taxonomy has been modified, it can be registered in Disclosure Management as describedin “Registering XBRL Taxonomies” on page 14.
For more information, see the Disclosure Management XBRL Taxonomy Designer Help.
Server Configuration Options 21

Taxonomy CachingDisclosure Management provides a taxonomy caching system that manages the lifecycle of ataxonomy that is loaded into memory. The taxonomy caching system can be tuned via variousproperties.
OverviewThe Disclosure Management web application manages the loading and unloading of the XBRLtaxonomies that are registered in the Disclosure Management system. Since XBRL taxonomiescan be quite large, they tend to take up a lot of memory resources available to the Java process.Additionally, every time a taxonomy is loaded (into memory), there is a performance impact.Disclosure Management has a taxonomy caching system that keeps loaded taxonomies inmemory so that subsequent requests for taxonomy resources can be derived from the cache -rather than re-loading the taxonomy. The taxonomy system works as follows:
l At start-up, the taxonomy broker reads the list of registered taxonomies from themappingtool.properties file.
l A taxonomy cache object is created for each registered taxonomy (note that this does notmean that the taxonomy is loaded at this time - taxonomy loading is done on demand).
l When a user requests a particular taxonomy, the taxonomy broker checks the correspondingtaxonomy cache object:
m If the taxonomy is already loaded, the request is fulfilled by providing the cachedtaxonomy.
m If the taxonomy is not already loaded, the taxonomy is loaded into memory. (Note thatthis requires the additional overhead of loading the taxonomy before the user requestis fulfilled.)
l After the user request is fulfilled, the loaded taxonomy will remain in memory. Anysubsequent requests on the loaded taxonomy will be fulfilled from the cache.
l Every time a request is made on a cache taxonomy, a time-stamp is registered in order todetermine the "last accessed time" of the taxonomy.
l The time-stamp of the taxonomy subsequently helps to determine when it is safe to unloadthe taxonomy.
l When certain criteria is met, a taxonomy is unloaded from memory. This release theassociated resources from the web application.
The criteria used to determine if a given taxonomy should be unloaded is:
1. Available Memory—When the amount of memory available to the Java Virtual Machine(JVM) reaches a certain threshold, the least used taxonomies are unloaded until a certainamount of memory is recovered.
2. Unused Taxonomy—When a certain amount of time has elapsed since a loaded taxonomywas last used or accessed, the taxonomy is unloaded.
22 Deploying and Configuring Disclosure Management
3. Maximum Taxonomies Loaded—When the number of taxonomies that have been loadedmeets or exceeds a specified threshold, the least used taxonomies will automatically beunloaded.
Taxonomy Cache Polling FeatureAfter a taxonomy has been loaded into memory, a polling feature is provided to determine whena taxonomy can be unloaded. The polling system works in the following manner:
l Every time a request is made on a taxonomy cache object, a time-stamp is registered in orderto determine the "last accessed time" of the taxonomy.
l The time-stamp will subsequently help determine when a taxonomy cache object is acandidate for unloading - i.e. Disclosure Management applies the "least recently used" orthe LRU cache algorithm.
l Disclosure Management spins two threads that are responsible for polling the taxonomycache objects which have loaded taxonomies (in memory):
m The first thread automatically runs every 60 seconds. It tests the amount of free memorythat is available to the JVM (via the Runtime.freeMemory() Java API). If the amount offree memory is less than 1 megabyte (1mb), Disclosure Management automaticallyunload the least recently used taxonomy cache objects - until Disclosure Managementhas freed more than 1mb of memory.
m The second thread runs at a user-defined interval (via the taxonomy_cache_poll"property). When this thread is enabled, the thread will poll the taxonomy cache objects(with loaded taxonomies) and perform three tests to determine if a taxonomy shouldbe unloaded:
o Available Memory—When the amount of memory available to the JVM reaches acertain threshold, the least recently used taxonomies are unloaded - until a certainamount of memory is recovered. This is the same test as the one performed by thefirst thread as discussed above. This test is covered detail under the JVM MemoryThreshold section.
o Unused Taxonomy—When a certain amount of time has elapsed since a loadedtaxonomy was last used or accessed, the taxonomy will be unloaded. This is coveredin detail under the Unused Taxonomy Threshold section.
o Maximum Taxonomies Loaded—When the number of taxonomies that have beenloaded meets or exceeds a user specified threshold, the least used taxonomies willautomatically be unloaded.
This is covered in the “Maximum Taxonomies Loaded Threshold ” on page 24.
Cache Poll IntervalThe cache poll interval property indicates the frequency or interval which the system will inspectthe cached taxonomies and determine if a taxonomy is unloaded. In the property file thisproperty is named: taxonomy_cache_poll.
Settings for this property include:
Server Configuration Options 23
l Value—The value for this property is specified in minutes.
l Default—The default value is 5 minutes. For example, setting the value to '5' means that alltaxonomies currently loaded in memory are polled every 5 minutes.
l Disable—Setting the value to zero disables the polling feature. It is not recommended thatthis feature be disabled. Other caching properties depend on the polling feature to beenabled. If this property is disabled, some of the taxonomy unloading mechanisms are alsodisabled. The only way to unload a taxonomy is when the JVM Memory Threshold isexceeded or by restarting the Disclosure Management web application.
JVM Memory Threshold The JVM (Java Virtual Machine) memory threshold is not user configurable. When either thecache poll routines run, the first test is to check the amount of free memory that is available tothe JVM of theDisclosure Management web application. If the amount of free memory is lessthan 1 megabyte, the least used taxonomies are automatically unloaded until the amount ofavailable memory exceeds the threshold (1mb). The "least recently used taxonomies" aredetermined by examining the time-stamp of when a taxonomy was last used or accessed. Themore amount of time that has elapsed since a taxonomy was last used, more chances it has thatit has to be unloaded. The most recently used taxonomies will have the best chance to remainin memory.
Least Recently Used Taxonomy Threshold The least recently used unused taxonomy threshold property indicates the maximum amountof time that can elapse since a taxonomy was last accessed before it is unloaded. In the propertyfile this property is named: taxonomy_cache_threshold.
Settings for this property include:
l Value—The value for this property is specified in minutes.
l Default—The default value is 30 minutes. For example, setting the value to '30' means thata loaded taxonomy will remain in the cache (memory) for up to 30 minutes of inactivitybefore it is unloaded. Keep in mind that when a new user request occurs which accesses ataxonomy, its time-stamp is reset. In this example, 30 minutes of no user requests mustoccur before the taxonomy is unloaded.
l Disable—Setting the value to zero disables this feature.
Maximum Taxonomies Loaded Threshold The maximum taxonomies loaded threshold property indicates the maximum number oftaxonomies that can be loaded in the cache (memory) before the least recently used taxonomiesare unloaded. In the property file this property is named: max_taxonomy_cached
Settings for this property include:
l Value—The value for this property is specified as a positive integer.
24 Deploying and Configuring Disclosure Management

l Default—The default value is 10 taxonomies. For example, setting the value to '10' meansthat the number of loaded taxonomies that can remain in the cache (memory) cannot exceed10. If 10 taxonomies are currently loaded in the cache and a new request is made to load an11th taxonomy, the least used taxonomy will be unloaded.
l Disable—Setting the value to zero disables this feature.
The "least recently used taxonomy" is determined by examining the time-stamp of when ataxonomy was last used or accessed. The more amount of time that has elapsed since a taxonomywas last used, more chances it has that it will be unloaded. The most recently used taxonomieswill have the best chance to remain in memory.
UBMatrix XBRL Processing Engine SettingsDisclosure Management uses UBMatrix's XBRL Processing Engine© (XPE) as the backendengine for the majority of the XBRL processing. XPE provides a rich set of APIs that allowDisclosure Management to process and create XBRL documents. Disclosure Management usesXPE within the web application. The following section describes the various settings are exposedby XPE for performance and caching of XBRL documents.
The majority of the performance and caching settings for XPE can be found on-line at the XPEon-line documentation home page: http://docs.ubmatrix.com/webhelp/XPE/3_5/default
Note that the docs.ubmatrix.com site should be viewed with Microsoft Internet Explorer. Thereare some known issues when viewing the documentation with FireFox.
While the XPE on-line documentation provides all the details for XPE performance tuning, notethe following settings:
l XPE Administrator's Guide home page—http://docs.ubmatrix.com/webhelp/XPE/3_5/Administrator_Guide.htm
l XPE Caching options—http://docs.ubmatrix.com/webhelp/XPE/3_5/Caching/caching.htm
l Configuring the Web Cache—http://docs.ubmatrix.com/webhelp/XPE/3_5/Configuration/configuring_the_web_cache.htm
l Configuring the JVM—http://docs.ubmatrix.com/webhelp/XPE/3_5/Configuration/configuring_the_jvm.htm
XPE Taxonomy Caching Options XPE provides three types of caching options:
l Preload—A commonly used taxonomy can be "preloaded" every time XPE is initiated. Thisis useful when a particular taxonomy is frequently used. After XPE is initiated, the preloadedtaxonomies are already loaded in memory and available for processing. For moreinformation see: http://docs.ubmatrix.com/webhelp/XPE/3_5/default.htm#Caching/Preload.htm
l Web Caching—Some taxonomies have external references to other taxonomies or XBRLdocuments that must be fetched though the Internet when they are not locally available. In
Server Configuration Options 25

this scenario, after XPE retrieves these external resources, they are saved locally within aspecific folder so that it will not be required to fetch them from the Internet the next timethey are required. The use of the web cache feature in Disclosure Management is describedbelow. For more information, see: http://docs.ubmatrix.com/webhelp/XPE/3_5/default.htm#Caching/web_caching.htm
l Redirection:—XPE provides a mechanism to redirect external taxonomy references to localresources. This feature prevents XPE from fetching the external taxonomy resources fromthe Internet - instead the local resources are used. For more information, see: http://docs.ubmatrix.com/webhelp/XPE/3_5/default.htm#Caching/Redirection.htm
The following are the usage points with Disclosure Management:
l Preload—While preloading taxonomies might be useful for some users, it is probably betterto let the Disclosure Management caching system manage the loading and unloading oftaxonomies. It is quite possible that a preloaded taxonomy is eventually unloaded byDisclosure Management (per the caching feature described above). As such the use of thisfeature is not recommended.
l Web Caching—Web caching is the recommended caching mechanism. Users areencouraged to take advantage of this feature. Details are described in “XPE TaxonomyCaching Overview ” on page 26.
l Redirection—Disclosure Management does not encourage the user of redirection. Thisfeature is somewhat difficult to configure and unreliable. In fact, UBMatrix recommendsthat the web caching feature be used instead of redirection.
XPE Taxonomy Caching Overview This section provides a brief overview of the taxonomy caching framework. It is important tounderstand the process that XPE employs when attempting to load a taxonomy:
l When XPE is initialized, it loads preloads into the document cache.
l When a request is made to load a new taxonomy (which is not already in the documentcache).
m XPE checks the web cache first.
m If the requested documents cannot be found in the web cache, XPE uses the built-inresolver settings:
o The documents are searched in the file system (i.e. File Resolver).
o The documents are searched in the Web (i.e. HTTP resolver).
o The documents are searched using a other resolvers (none of which really apply toDisclosure Management).
l If the documents cannot be found in the built-in resolver locations (i.e. Preload andRedirection), then the document fails to load and XPE generates an error about the load.
Additional details about the XPE caching framework are available at: http://docs.ubmatrix.com/webhelp/XPE/3_5/default.htm#Caching/How_does_document_caching_work.htm
26 Deploying and Configuring Disclosure Management
XPE Web CachingOut of all of XPE's taxonomy caching mechanisms, web caching is the only one that isrecommended to be used within Disclosure Management.
Under the Disclosure Management system, XPE normally loads a registered taxonomy from thefile system. Disclosure Management registered taxonomies are installed by the Administratorunder the "XbrlFiles" folder. Most taxonomies are self-contained when downloaded from anofficial taxonomy repository (such as "xbrl.org"), some have external references to othertaxonomies or XBRL documents. When this condition exists, XPE must resolve the externalreferences in order to obtain the external documents. The first place XPE will search for theseexternal documents is within its local "web cache". If the documents are not found in the webcache, it will search the file system and ultimately the Internet - if access is provided to XPE.
Web Cache Folder
The web cache is actually a folder in the machine hosting the XPE process. In the case ofDisclosure Management, it is on the server hosting the Disclosure Management web application.Particularly, the web cache is located in the following folder: %DISCMAN_HOME%\resources\System\cache
As detailed above, when XPE needs to fetch any XBRL resources (external documents and/ortaxonomies) from the Internet, the download files are automatically stored in the Web Cachefolder. In this manner, the next time these documents are required, XPE will look for them inthe web cache folder before attempting to obtain them from any other location. Additionaldetails about the XPE cache folder are available at: http://docs.ubmatrix.com/webhelp/XPE/3_5/default.htm#Caching/How_does_web_caching_work.htm
Configuring the Web Cache
It may be necessary (but not required) to provide XPE the ability to fetch requested XBRLdocuments from the Internet - which will subsequently be saved to web cache folder. In orderto do so, it may be necessary to modify the xbrlData.properties file. This file is normally locatedin the following folder: %DISCMAN_HOME%\lib\xbrlData.properties
Within the xbrlData.properties file, the following properties control the web cache feature:
l WorkOffline—This property controls if XPE will have access to the Internet. Setting it to'false' will prevent XPE from attempting to fetch requested XBRL documents from theInternet. This property is set to 'true' by default. While it is recommended that this propertyis set to true, it is understandable that some clients will not allow internet access to processes- especially in a server environment. When this property is set to false, it is the administrator'sresponsibility to ensure that the web cache folder contains all the XBRL documents that areused by their registered taxonomies (for details see below).
Note: If a requested document is not available to XPE and this property is set to false, theloading of the requesting taxonomy may fail. For more information, see: http://docs.ubmatrix.com/webhelp/XPE/3_5/default.htm#Work_Offline.htm
Server Configuration Options 27

l useCache—This property is used to enable or disable the use of the web cache folder. Settingit to 'false' will completely disable the use of the web cache folder. This property is set to'true' by default (highly recommended). For more information see: http://docs.ubmatrix.com/webhelp/XPE/3_5/Configuration/configuring_the_web_cache.htm
l proxyHost—This property specifies the proxy to for XPE to use if Internet access isprovided to it. Setting this property is important if a proxy must be used in order for XPEto get Internet access. By default, this property does not exist. For example on the Oraclenetwork, the following proxy setting can be specified: proxyHost=www-proxy.us.oracle.com:80
For more information, see: http://docs.ubmatrix.com/webhelp/XPE/3_5/default.htm#Configuration/Configuring_a_proxy_server.htm
Note: Changing any of these properties will require that XPE is re-initialized - this meansthat the Disclosure Management web application must be restarted.
Recommended Usage in Disclosure Management
This section provides the several usage scenarios for taking advantage of XPE's web cache feature.Note that all of these scenarios assume that the useCache property (in the xbrlData.propertiesfile) is set to true. Turning off the web cache feature is not recommended.
Allow Internet Access
Perhaps the easiest solution is to allow XPE to have Internet access so that any externallyreferenced XBRL documents are automatically downloaded and available in the web cachefolder. In order to implement this solution, make sure that:
l The workOffline property (in the xbrlData.properties file) is set to false.
l The useCache property is set to true.
l The proxyHost property contains a proxy server if necessary.
Work Offline
It is possible to disallow XPE from having access to the Internet. This might be preferable on asecured server environment. In order to implement this solution, make sure that:
l The workOffline property (in the xbrlData.properties file) is set to true. However, whenworking offline, it is the administrator's responsibility to ensure that all the externallyreferenced XBRL documents within the registered taxonomies is available in the web cachefolder.
l The useCache property is set to true. This ensures that the necessary files in the web cachefolder are used.
When using this solution, administrators can manually fill the web cache folder using any typeof file transfer technique preferred (ftp, copy & paste, etc). However, it is vital that the folderstructure is representative of the XBRL document's "URI". Sometimes a file's URI is not very
28 Deploying and Configuring Disclosure Management
apparent. Administrators may need to open the XBRL document in a text editor in order tofigure out the appropriate folder structure.
For additional details on the Web Cache folder structure, see: http://docs.ubmatrix.com/webhelp/XPE/3_5/default.htm#Caching/How_does_web_caching_work.htm
Provide Temporary Internet Access
Another solution is to allow XPE temporary access to the Internet so that the required externalXBRL files are automatically downloaded to the web cache folder (with the appropriate folderstructure). In order to implement this solution:
1. Give XPE Internet access as described in the Allow Internet Access section above.
2. Restart the Disclosure Management web application if necessary.
3. In the Disclosure Management add-in or in Financial Reporting, load the taxonomycontaining links to external XBRL resources. When the taxonomy is fully rendered, anyexternally referenced XBRL documents should have been downloaded to the web cachefolder.
4. Disable the Internet access for XPE by setting the workOffline property (in thexbrlData.properties file) to true.
5. Restart the Disclosure Management web application.
Note: The steps documented above may be required when a new taxonomy is registered in theDisclosure Management system.
Copy Folder Structure
Another solution is to allow Internet access (as described above) on a development environment.Within this environment, the administrator can access and use all the taxonomies that they wishto cache in the web cache folder. Once the appropriate XBRL files been downloaded and installedon the development environment, the administrator can copy the entire web cache folder fromthe development and put it into the web cache folder of the production server. The productionserver can have the workOffline property permanently turned off.
Using Registered Taxonomies in the Web Cache
It is possible to take advantage of XPE's web cache feature and register the taxonomies that existin the web cache. This might be useful when a "base taxonomy" is commonly used. For example,suppose you work with taxonomy extensions that are based on the US-GAAP taxonomy. Whilemost of the time, you work with the US-GAAP taxonomy extensions, you occasionally workwith the base US-GAAP taxonomy itself.
In this scenario, it would make sense to have the US-GAAP base files exist in the web cachefolder. But rather than having two copies of the US-GAAP taxonomy (one in the web cachefolder and the other in the XbrlFiles folder), you can simply keep the US-GAAP taxonomy inthe web cache folder and put a reference to the entry point in the mappingtool.properties file(for details on registering a taxonomy, see “Registering XBRL Taxonomies” on page 14).
Server Configuration Options 29

In order to accomplish this:
l Download or copy the base taxonomy files to the web cache folder. It is vital that theappropriate folder structure be maintained. For example, if the 2009 US-GAAP taxonomywas being installed in the web cache it would exist in the following folder:%DISCMAN_HOME%\resources\System\cache\http\taxonomies.xbrl.us\us-gaap\2009
l Modify the mappingtool.properties file so that a relative path is used to the new entry pointof the base taxonomy. For example, to register the 2009 US-GAAP Commercial & Industrialtaxonomy after completing the prior step, you would indicate the following:
taxonomy_X.label_Y=Commercial and Industrial 2009
taxonomy_X.entryPoint_Y=../resources/System/cache/http/
taxonomies.xbrl.us/us-gaap/2009/ind/ci/us-gaap-ci-stm-dis-
all-2009-01-31.xsd
Note: Note the use of the relative path ('../') at the beginning of thetaxonomy_X.entryPoint_Y property.
Client Configuration OptionsThis section includes information on setting Disclosure Management options, which include:
l “Services Options” on page 30
l “Default Setting for Decimals and Precision” on page 31
l “Configuring the SEC Viewer” on page 34
Setting Disclosure Management OptionsUse Disclosure Management Options to set and manage services information and XBRL specificoptions.
Services OptionsDisclosure Management server information is stored in the Oracle's Hyperion Shared ServicesRegistry. Initially, the server (host) name and server (host) port fields are empty. To set up theserver information, the user must manually specify the server name and port in the DisclosureManagement Options dialog box. The server name and port should be the same names used todownload the extension. If you need to set up or point to another Disclosure Management server,use the Services Option to specify the servername and port, and server access URLs.
ä To specify Server information:
1 On the Disclosure Management ribbon, select Options.
The Oracle Hyperion Disclosure Management Options dialog box is displayed.
2 In the Server Name field, enter the server name.
30 Deploying and Configuring Disclosure Management
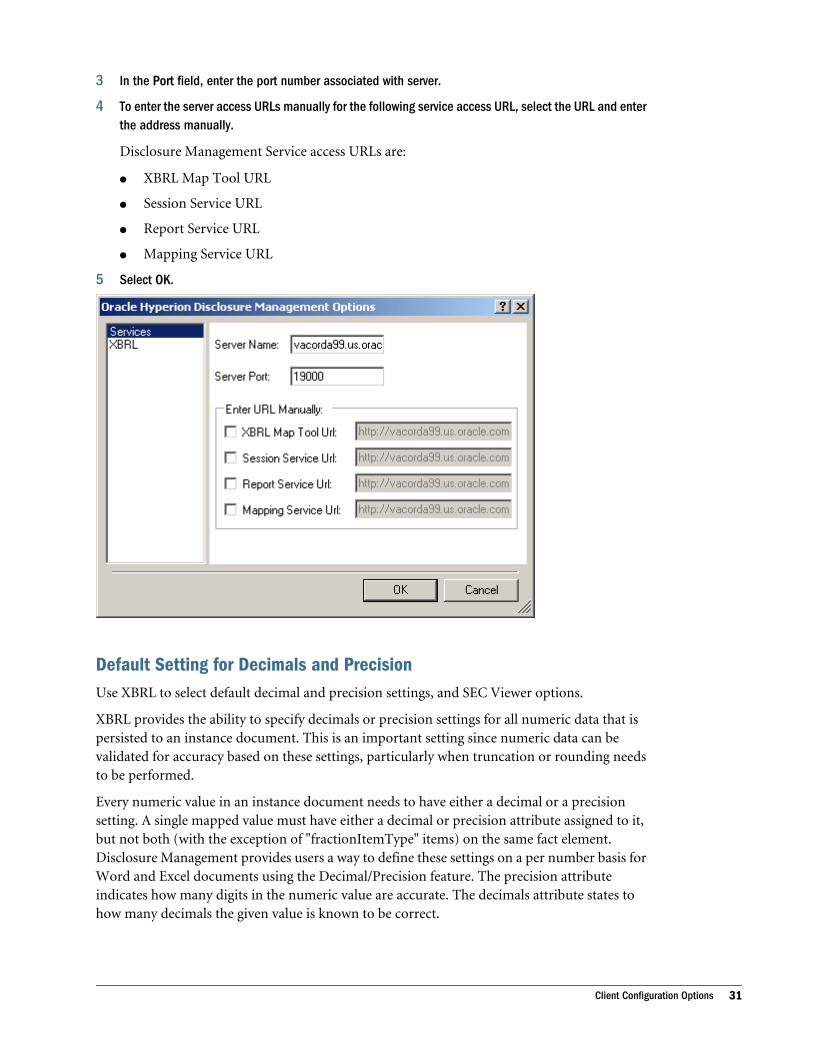
3 In the Port field, enter the port number associated with server.
4 To enter the server access URLs manually for the following service access URL, select the URL and enterthe address manually.
Disclosure Management Service access URLs are:
l XBRL Map Tool URL
l Session Service URL
l Report Service URL
l Mapping Service URL
5 Select OK.
Default Setting for Decimals and PrecisionUse XBRL to select default decimal and precision settings, and SEC Viewer options.
XBRL provides the ability to specify decimals or precision settings for all numeric data that ispersisted to an instance document. This is an important setting since numeric data can bevalidated for accuracy based on these settings, particularly when truncation or rounding needsto be performed.
Every numeric value in an instance document needs to have either a decimal or a precisionsetting. A single mapped value must have either a decimal or precision attribute assigned to it,but not both (with the exception of "fractionItemType" items) on the same fact element.Disclosure Management provides users a way to define these settings on a per number basis forWord and Excel documents using the Decimal/Precision feature. The precision attributeindicates how many digits in the numeric value are accurate. The decimals attribute states tohow many decimals the given value is known to be correct.
Client Configuration Options 31
When instance documents are generated, numeric values mapped to XBRL line items are savedwith their "raw" data values. Any formatting or rounding is removed from numeric values. Bydefault Disclosure Management uses the precision setting. This option is set to “INF.” This meansthat the number mapped to the line item is the exact value shown in the instance document (norounding). If values stored in a data source are already rounded (for example, the stored valueof 250 may actually be 250,000), it may be necessary to manually adjust the precision attributein the resulting XML file after an instance document is created. For more information regardingthe precision attribute please refer to the XBRL 2.1 specification.
You can also indicate the number of decimal place to which a numeric value is consideredaccurate, which may result when numbers are rounded or dropped after the decimal point.
When a user maps a unit to data in an Office document, Disclosure Management automaticallyapplies the default decimal/precision setting derived from the decimal/precision preferenceselected on the XBRL tab of the Oracle Hyperion Disclosure Management Options dialog box.If a decimal/precision setting change is needed for an individual mapping, the user can modifythe decimal/precision in Review mode in List View. Non-modified mappings continue to usethe default precision/decimal setting from the preference set on the XBRL tab of the OracleHyperion Disclosure Management Options dialog box.
When instance documents are generated or validated, fact values (i.e. mappings) with a unitassignment that do not have an explicit decimal/precision setting (as set in the Review Mode),automatically receive the default precision/decimal setting from the user's preference on theXBRL tab of the Oracle Hyperion Disclosure Management Options dialog box.
If there is no unit assignment associated with the fact value, Disclosure Management assumesthat it is a non-numeric item which does not receive a precision/decimal attribute.
If a user creates some unit mappings (thereby creating the default decimal/precision setting) andsubsequently changes the default (via the XBRL tab of the Oracle Hyperion DisclosureManagement Options dialog box), all the existing numeric mappings (i.e. with unit assignments)will continue to use the previous default setting. However, any new unit mappings will use thenew default setting.
32 Deploying and Configuring Disclosure Management

ä To select a decimal attribute:
1 Select Options, and then XBRL.
2 Select the Decimal field.
3 Enter the number of decimals the given value is known to be correct.
For example, enter “2” to specify that the numeric fact is accurate to two decimal values.You can also indicate a negative decimal (for example, -2) to show that all digits to the lefthundred of the digit is recognized as correct. That is, when a value of 8 is stated, then thevalue can range between 7.998 and 9.002. It is recommended that you set decimals to thefollowing values based on the numeric value being evaluated:
l thousand decimals = 3
l million decimals = 6
l accurate value = 2
l percent decimals = 2
4 Click OK.
ä To select a precision attribute:
1 Select Options, and then XBRL.
2 Click the Precision field.
3 Enter the number of digits of a numeric value that are accurate.
For example, if you enter “7”, the first 7 digits counting from the left, starting at the firstnon-zero digit is the exact value of the numeric fact.
4 Click OK.
Client Configuration Options 33
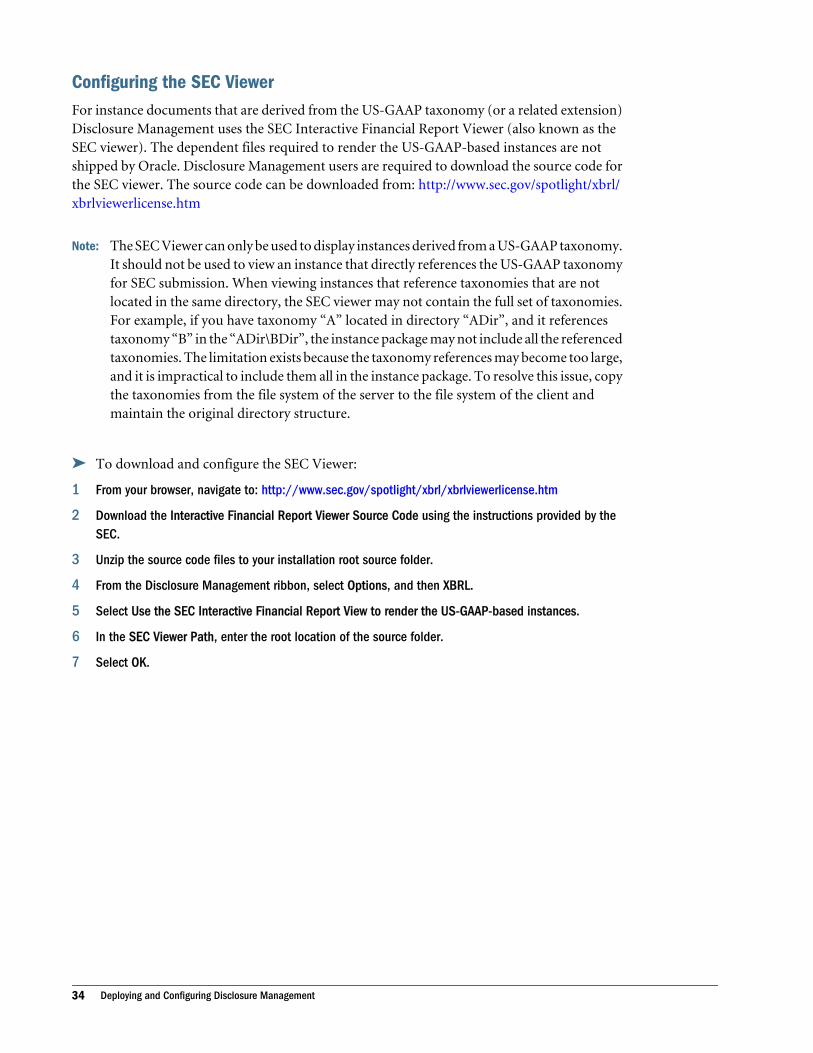
Configuring the SEC ViewerFor instance documents that are derived from the US-GAAP taxonomy (or a related extension)Disclosure Management uses the SEC Interactive Financial Report Viewer (also known as theSEC viewer). The dependent files required to render the US-GAAP-based instances are notshipped by Oracle. Disclosure Management users are required to download the source code forthe SEC viewer. The source code can be downloaded from: http://www.sec.gov/spotlight/xbrl/xbrlviewerlicense.htm
Note: The SEC Viewer can only be used to display instances derived from a US-GAAP taxonomy.It should not be used to view an instance that directly references the US-GAAP taxonomyfor SEC submission. When viewing instances that reference taxonomies that are notlocated in the same directory, the SEC viewer may not contain the full set of taxonomies.For example, if you have taxonomy “A” located in directory “ADir”, and it referencestaxonomy “B” in the “ADir\BDir”, the instance package may not include all the referencedtaxonomies. The limitation exists because the taxonomy references may become too large,and it is impractical to include them all in the instance package. To resolve this issue, copythe taxonomies from the file system of the server to the file system of the client andmaintain the original directory structure.
ä To download and configure the SEC Viewer:
1 From your browser, navigate to: http://www.sec.gov/spotlight/xbrl/xbrlviewerlicense.htm
2 Download the Interactive Financial Report Viewer Source Code using the instructions provided by theSEC.
3 Unzip the source code files to your installation root source folder.
4 From the Disclosure Management ribbon, select Options, and then XBRL.
5 Select Use the SEC Interactive Financial Report View to render the US-GAAP-based instances.
6 In the SEC Viewer Path, enter the root location of the source folder.
7 Select OK.
34 Deploying and Configuring Disclosure Management
3XBRL Planning Considerations
In This Chapter
Integrating Disclosure Management.. . . . . . . . . . . . . . . . . . . . . . . . . . . . . . . . . . . . . . . . . . . . . . . . . . . . . . . . . . . . . . . . . . . . .35
XBRL and Regulatory Resources... . . . . . . . . . . . . . . . . . . . . . . . . . . . . . . . . . . . . . . . . . . . . . . . . . . . . . . . . . . . . . . . . . . . . . . .36
Integrating Disclosure ManagementThe process of integrating Disclosure Management with your financial reporting system toproduce XBRL instance documents requires some initial planning and organization. Todetermine the necessary steps to take once you have installed Disclosure Management, considerthe following:
l Taxonomy Assessment—Assess which taxonomy is most appropriate for your XBRL filingrequirements.
l Training—Implement a plan to train key personnel on XBRL filing requirements, taxonomyconcepts and how to use Disclosure Management.
l XBRL Project Team—Assemble a team who can:
m manage the XBRL project,
m provide expertise in regional regulatory rules and the organization's reportingrequirements,
m demonstrate expertise in XBRL.
l Mapping—Identify the personnel who are tasked to map your financial statements.
l Data Collection—Determine a process to consolidate and produce the financial data whichwill be persisted to XBRL instance documents.
l Extensions—Designate the personnel responsible for extending taxonomies based onorganizational reporting requirements.
l Review—Implement a process for reviewing and validating instance documents. Theinstance document should adhere to any additional submission requirements which theregulatory body imposes on XBRL submissions. For example, the SEC has additionalsubmission criteria for filers. This submission criterion is added in addition to the technicalvalidation as indicated by the XBRL specification. While Disclosure Management providesthe validation to ensure XBRL validity (per the XBRL specification), it does not enforce anyadditional submission criteria that may be required by a regulatory agency.
Integrating Disclosure Management 35
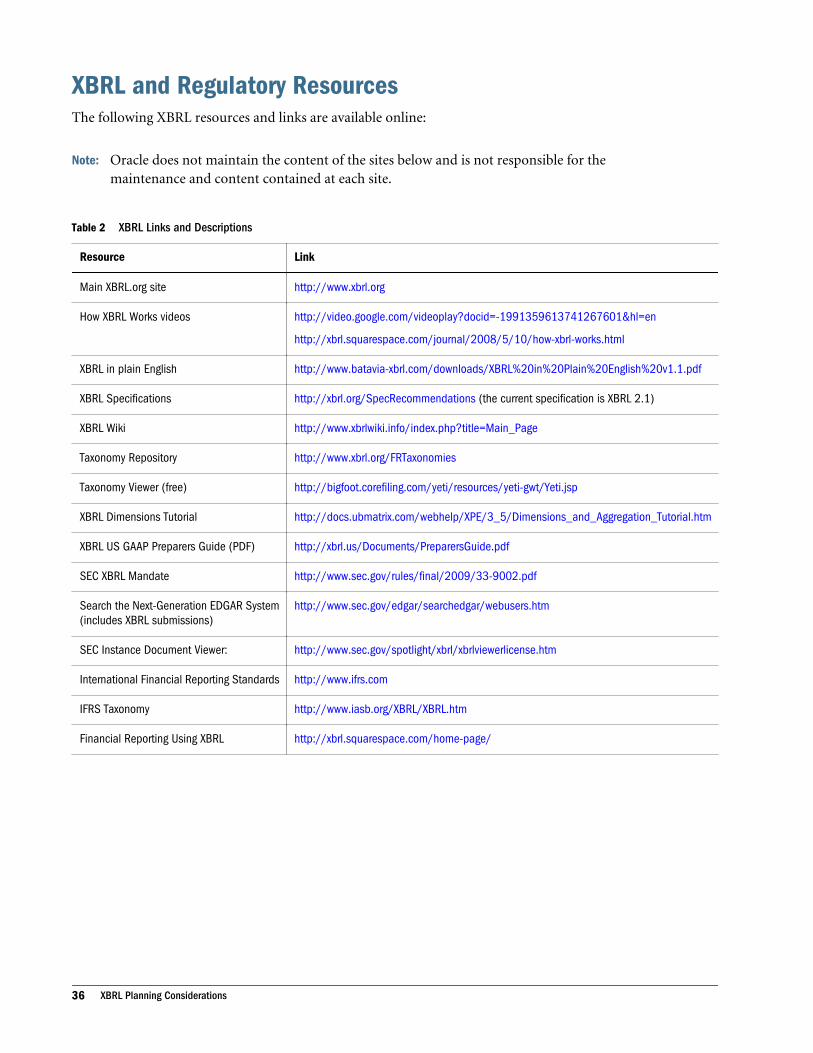
XBRL and Regulatory ResourcesThe following XBRL resources and links are available online:
Note: Oracle does not maintain the content of the sites below and is not responsible for themaintenance and content contained at each site.
Table 2 XBRL Links and Descriptions
Resource Link
Main XBRL.org site http://www.xbrl.org
How XBRL Works videos http://video.google.com/videoplay?docid=-1991359613741267601&hl=en
http://xbrl.squarespace.com/journal/2008/5/10/how-xbrl-works.html
XBRL in plain English http://www.batavia-xbrl.com/downloads/XBRL%20in%20Plain%20English%20v1.1.pdf
XBRL Specifications http://xbrl.org/SpecRecommendations (the current specification is XBRL 2.1)
XBRL Wiki http://www.xbrlwiki.info/index.php?title=Main_Page
Taxonomy Repository http://www.xbrl.org/FRTaxonomies
Taxonomy Viewer (free) http://bigfoot.corefiling.com/yeti/resources/yeti-gwt/Yeti.jsp
XBRL Dimensions Tutorial http://docs.ubmatrix.com/webhelp/XPE/3_5/Dimensions_and_Aggregation_Tutorial.htm
XBRL US GAAP Preparers Guide (PDF) http://xbrl.us/Documents/PreparersGuide.pdf
SEC XBRL Mandate http://www.sec.gov/rules/final/2009/33-9002.pdf
Search the Next-Generation EDGAR System(includes XBRL submissions)
http://www.sec.gov/edgar/searchedgar/webusers.htm
SEC Instance Document Viewer: http://www.sec.gov/spotlight/xbrl/xbrlviewerlicense.htm
International Financial Reporting Standards http://www.ifrs.com
IFRS Taxonomy http://www.iasb.org/XBRL/XBRL.htm
Financial Reporting Using XBRL http://xbrl.squarespace.com/home-page/
36 XBRL Planning Considerations

4Retrieving Data from Financial
Services
In This Chapter
Report Level versus Data Source Mapping ... . . . . . . . . . . . . . . . . . . . . . . . . . . . . . . . . . . . . . . . . . . . . . . . . . . . . . . . . . . .37
Mapping Data Sources in Smart View ... . . . . . . . . . . . . . . . . . . . . . . . . . . . . . . . . . . . . . . . . . . . . . . . . . . . . . . . . . . . . . . . .38
Mapping Financial Reporting Data Sources ... . . . . . . . . . . . . . . . . . . . . . . . . . . . . . . . . . . . . . . . . . . . . . . . . . . . . . . . . . .42
Report Level versus Data Source MappingWhen working with documents that contain data from an Oracle Hyperion data source, youcan create XBRL maps that are associated with the data in the report or with the underlying datasource. If you map data within an Office document which is derived from a Smart View reportor query, it is possible to create two types of maps:
l Data Source Map—A data source map is achieved when metadata labels are mapped toXBRL taxonomy concepts. Data source level maps can be performed in:
m Microsoft Office using Smart View, which includes dimensions of imported functiongrids from existing Financial Reporting reports, or metadata inserted a function gridfrom a Smart Slice
m Financial Reporting HTML client
Note: Smart View makes the determination if the document data pertains to a datasource member.
l Report Level Map—When you select actual data (i.e. a numeric value) from the Smart Viewreport, manual data entry, or another system with Microsoft Office integration, a documentlevel map is created. In this case, the mapped taxonomy concept is associated only with theOffice document.
For example, assume the following table is derived from a function grid in a Smart Viewreport:
m If you select cell A2 which contains the data source member "Gross Profit", and thenmap it to the taxonomy concept "GrossProfit"; it becomes a data source map. In thiscase, all the data values in cells B2, C2, D2 and E2 become associated with the taxonomy
Report Level versus Data Source Mapping 37
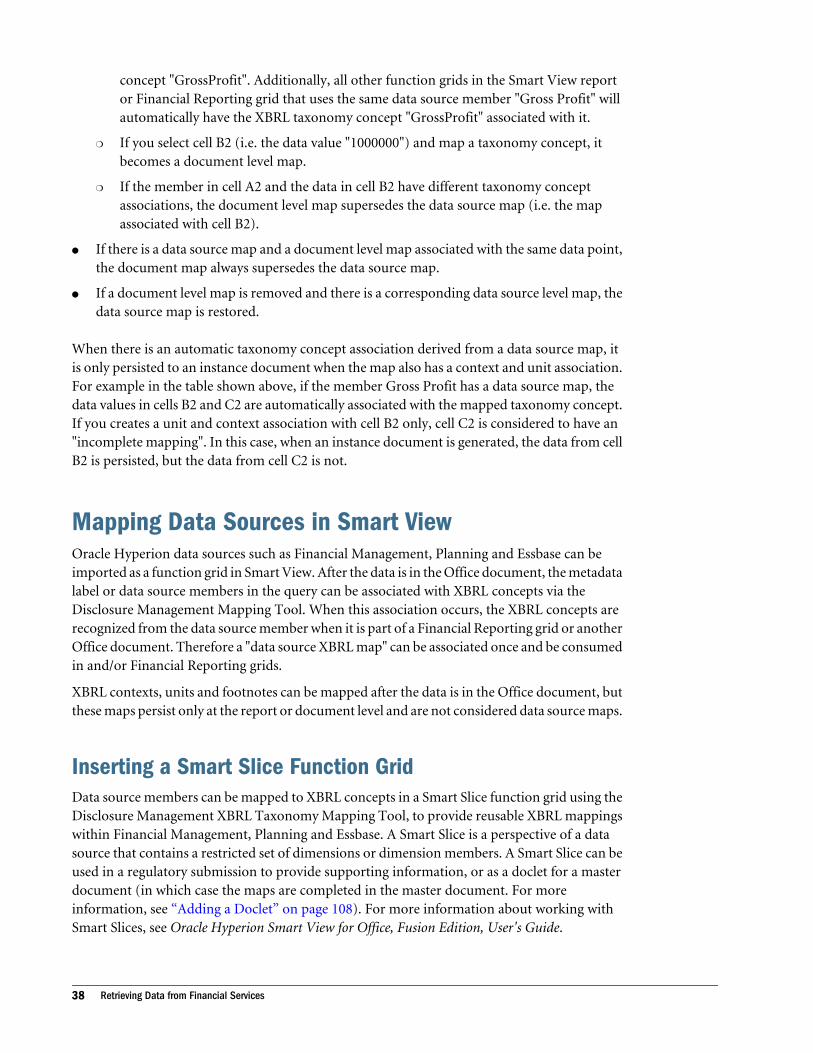
concept "GrossProfit". Additionally, all other function grids in the Smart View reportor Financial Reporting grid that uses the same data source member "Gross Profit" willautomatically have the XBRL taxonomy concept "GrossProfit" associated with it.
m If you select cell B2 (i.e. the data value "1000000") and map a taxonomy concept, itbecomes a document level map.
m If the member in cell A2 and the data in cell B2 have different taxonomy conceptassociations, the document level map supersedes the data source map (i.e. the mapassociated with cell B2).
l If there is a data source map and a document level map associated with the same data point,the document map always supersedes the data source map.
l If a document level map is removed and there is a corresponding data source level map, thedata source map is restored.
When there is an automatic taxonomy concept association derived from a data source map, itis only persisted to an instance document when the map also has a context and unit association.For example in the table shown above, if the member Gross Profit has a data source map, thedata values in cells B2 and C2 are automatically associated with the mapped taxonomy concept.If you creates a unit and context association with cell B2 only, cell C2 is considered to have an"incomplete mapping". In this case, when an instance document is generated, the data from cellB2 is persisted, but the data from cell C2 is not.
Mapping Data Sources in Smart ViewOracle Hyperion data sources such as Financial Management, Planning and Essbase can beimported as a function grid in Smart View. After the data is in the Office document, the metadatalabel or data source members in the query can be associated with XBRL concepts via theDisclosure Management Mapping Tool. When this association occurs, the XBRL concepts arerecognized from the data source member when it is part of a Financial Reporting grid or anotherOffice document. Therefore a "data source XBRL map" can be associated once and be consumedin and/or Financial Reporting grids.
XBRL contexts, units and footnotes can be mapped after the data is in the Office document, butthese maps persist only at the report or document level and are not considered data source maps.
Inserting a Smart Slice Function GridData source members can be mapped to XBRL concepts in a Smart Slice function grid using theDisclosure Management XBRL Taxonomy Mapping Tool, to provide reusable XBRL mappingswithin Financial Management, Planning and Essbase. A Smart Slice is a perspective of a datasource that contains a restricted set of dimensions or dimension members. A Smart Slice can beused in a regulatory submission to provide supporting information, or as a doclet for a masterdocument (in which case the maps are completed in the master document. For moreinformation, see “Adding a Doclet” on page 108). For more information about working withSmart Slices, see Oracle Hyperion Smart View for Office, Fusion Edition, User's Guide.
38 Retrieving Data from Financial Services

ä To create a data source map to a Smart Slice function grid:
1 From the Smart View Panel, select a Smart Slice.
2 In the Action panel, select Insert Smart Slice.
The Smart Slice is displayed in the Report Designer.
3 From , select Function Grid.
The Smart Slice function grid is displayed in the report.
4 On the Smart View ribbon, select Refresh.
5 Select the Disclosure Management tab.
6 Select Connect to connect to the Disclosure Management server.
7 Enter the user name and password in the Name and Password fields, and click OK.
8 On the Disclosure Management ribbon, select Map.
The Disclosure Management Mapping Tool is displayed.
9 Map the data source member using the Disclosure Management Mapping Tool.
For more information about the Disclosure Management Mapping Tool, see Chapter 5,“Generating XBRL Instance Documents ”.
The graphic below shows a Smart Slice function grid integrated with the DisclosureManagement Mapping Tool.
Mapping Data Sources in Smart View 39
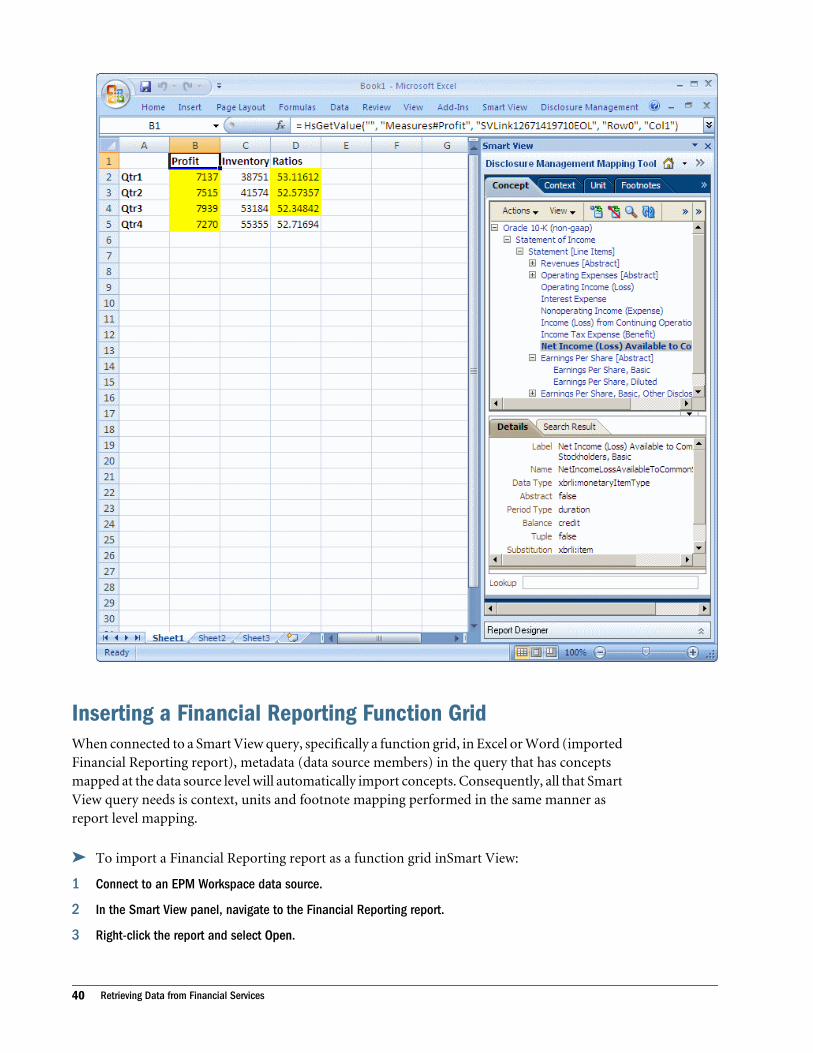
Inserting a Financial Reporting Function GridWhen connected to a Smart View query, specifically a function grid, in Excel or Word (importedFinancial Reporting report), metadata (data source members) in the query that has conceptsmapped at the data source level will automatically import concepts. Consequently, all that SmartView query needs is context, units and footnote mapping performed in the same manner asreport level mapping.
ä To import a Financial Reporting report as a function grid inSmart View:
1 Connect to an EPM Workspace data source.
2 In the Smart View panel, navigate to the Financial Reporting report.
3 Right-click the report and select Open.
40 Retrieving Data from Financial Services
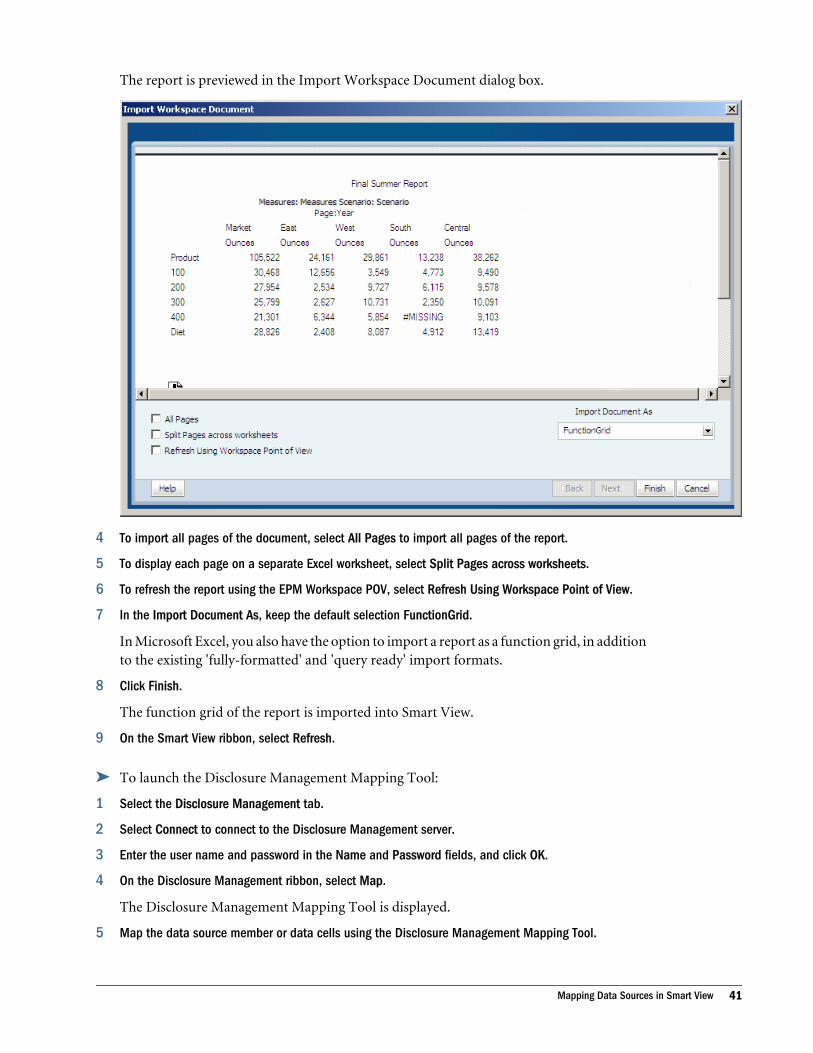
The report is previewed in the Import Workspace Document dialog box.
4 To import all pages of the document, select All Pages to import all pages of the report.
5 To display each page on a separate Excel worksheet, select Split Pages across worksheets.
6 To refresh the report using the EPM Workspace POV, select Refresh Using Workspace Point of View.
7 In the Import Document As, keep the default selection FunctionGrid.
In Microsoft Excel, you also have the option to import a report as a function grid, in additionto the existing 'fully-formatted' and 'query ready' import formats.
8 Click Finish.
The function grid of the report is imported into Smart View.
9 On the Smart View ribbon, select Refresh.
ä To launch the Disclosure Management Mapping Tool:
1 Select the Disclosure Management tab.
2 Select Connect to connect to the Disclosure Management server.
3 Enter the user name and password in the Name and Password fields, and click OK.
4 On the Disclosure Management ribbon, select Map.
The Disclosure Management Mapping Tool is displayed.
5 Map the data source member or data cells using the Disclosure Management Mapping Tool.
Mapping Data Sources in Smart View 41
For more information about the Disclosure Management Mapping Tool, see Chapter 5,“Generating XBRL Instance Documents ”.
Mapping Financial Reporting Data SourcesThe Disclosure Management Mapping Tool is integrated in the Financial Reporting HTMLreport viewer in the EPM Workspace. Using the Disclosure Management Mapping Tool, youcan map XBRL concepts to metadata labels (data source members) in the report. This includesdata from data sources (such as Financial Management, Oracle Hyperion Planning, FusionEdition, and Essbase) as well as formula and text cells. Data with XBRL maps from a FinancialReporting grid can be reused and imported into one or more Word or Excel document(s) byway of Smart View. Once the data is imported into an Office document, the DisclosureManagement add-in determines and consume all relevant XBRL maps from the FinancialReporting grid.
The following items cannot be mapped within Financial Reporting, but can be mapped in anOffice document by way of Smart View:
l XBRL Contexts
l XBRL Units
l XBRL Footnotes
l tuples
Displaying the Disclosure Management Mapping ToolThe Disclosure Management Mapping Tool can be shown or hidden from the EPM Workspace.
42 Retrieving Data from Financial Services
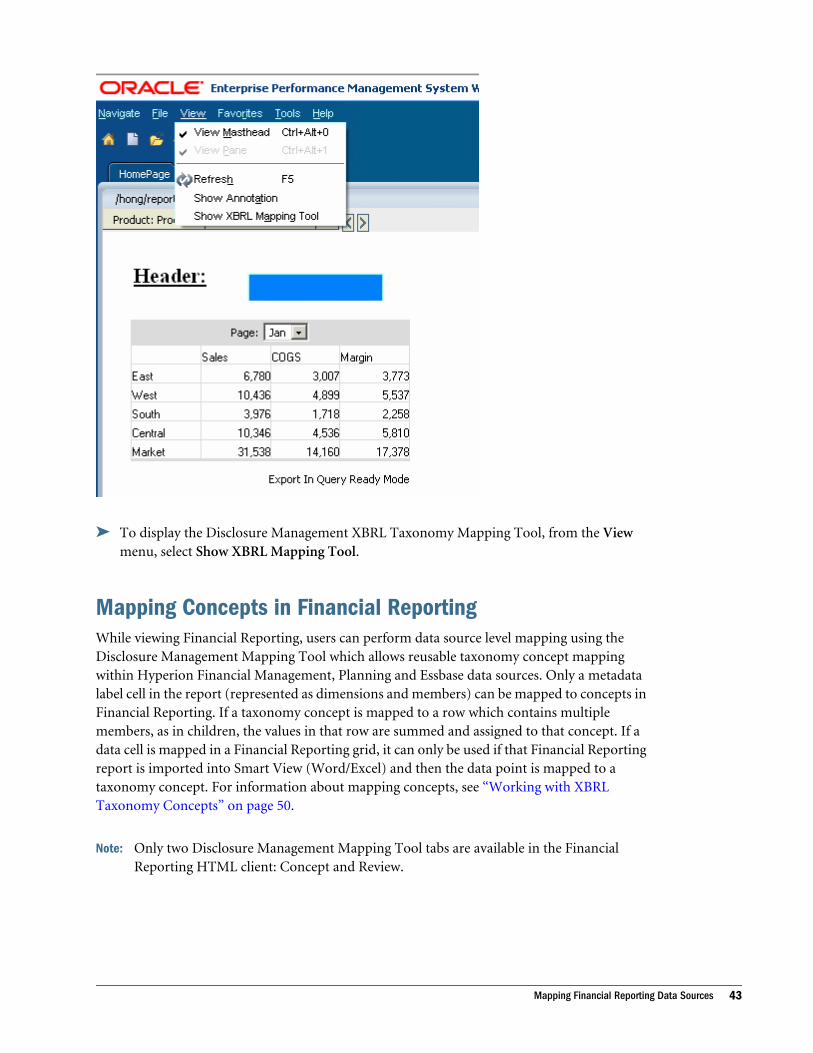
ä To display the Disclosure Management XBRL Taxonomy Mapping Tool, from the Viewmenu, select Show XBRL Mapping Tool.
Mapping Concepts in Financial ReportingWhile viewing Financial Reporting, users can perform data source level mapping using theDisclosure Management Mapping Tool which allows reusable taxonomy concept mappingwithin Hyperion Financial Management, Planning and Essbase data sources. Only a metadatalabel cell in the report (represented as dimensions and members) can be mapped to concepts inFinancial Reporting. If a taxonomy concept is mapped to a row which contains multiplemembers, as in children, the values in that row are summed and assigned to that concept. If adata cell is mapped in a Financial Reporting grid, it can only be used if that Financial Reportingreport is imported into Smart View (Word/Excel) and then the data point is mapped to ataxonomy concept. For information about mapping concepts, see “Working with XBRLTaxonomy Concepts” on page 50.
Note: Only two Disclosure Management Mapping Tool tabs are available in the FinancialReporting HTML client: Concept and Review.
Mapping Financial Reporting Data Sources 43

Note: Color cues indicate the type of mapping you have performed in Financial Reporting grids.If the cell is shaded blue, a data source mapping is indicated. Report level mappings aredistinguished by a teal background color.
44 Retrieving Data from Financial Services
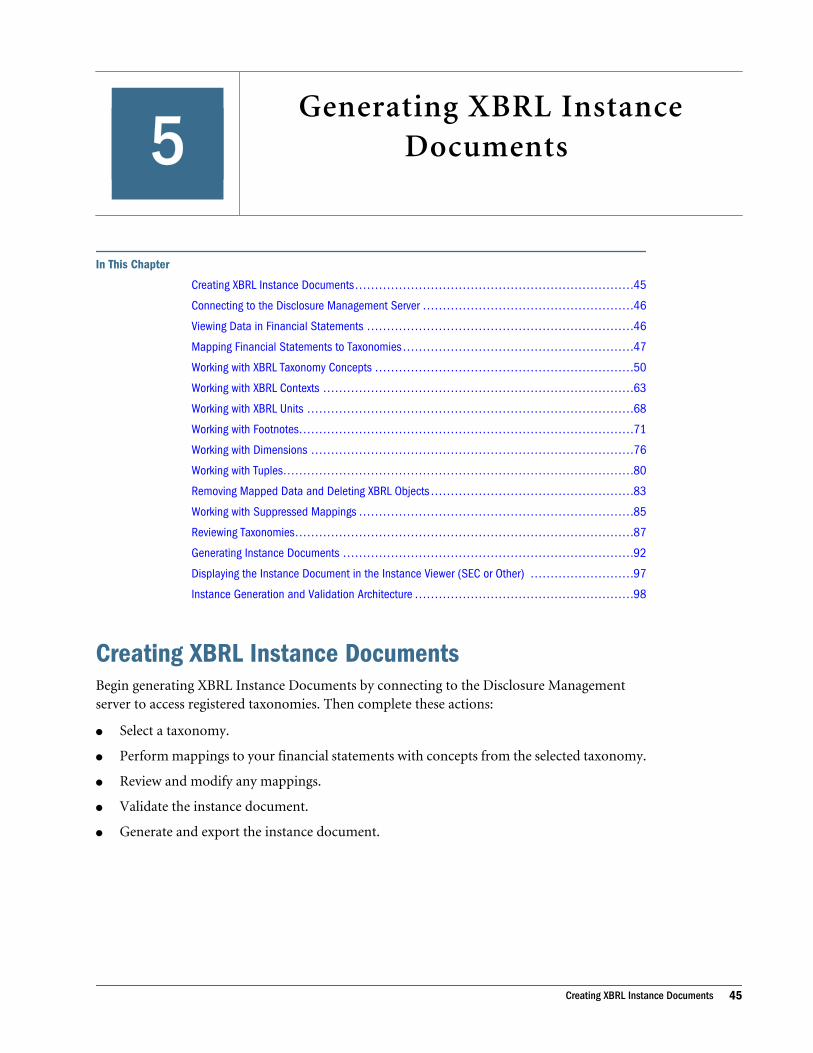
5Generating XBRL Instance
Documents
In This Chapter
Creating XBRL Instance Documents... . . . . . . . . . . . . . . . . . . . . . . . . . . . . . . . . . . . . . . . . . . . . . . . . . . . . . . . . . . . . . . . . . . .45
Connecting to the Disclosure Management Server .. . . . . . . . . . . . . . . . . . . . . . . . . . . . . . . . . . . . . . . . . . . . . . . . . . . .46
Viewing Data in Financial Statements ... . . . . . . . . . . . . . . . . . . . . . . . . . . . . . . . . . . . . . . . . . . . . . . . . . . . . . . . . . . . . . . . .46
Mapping Financial Statements to Taxonomies ... . . . . . . . . . . . . . . . . . . . . . . . . . . . . . . . . . . . . . . . . . . . . . . . . . . . . . . .47
Working with XBRL Taxonomy Concepts .. . . . . . . . . . . . . . . . . . . . . . . . . . . . . . . . . . . . . . . . . . . . . . . . . . . . . . . . . . . . . . . .50
Working with XBRL Contexts .. . . . . . . . . . . . . . . . . . . . . . . . . . . . . . . . . . . . . . . . . . . . . . . . . . . . . . . . . . . . . . . . . . . . . . . . . . . . .63
Working with XBRL Units .. . . . . . . . . . . . . . . . . . . . . . . . . . . . . . . . . . . . . . . . . . . . . . . . . . . . . . . . . . . . . . . . . . . . . . . . . . . . . . . . .68
Working with Footnotes... . . . . . . . . . . . . . . . . . . . . . . . . . . . . . . . . . . . . . . . . . . . . . . . . . . . . . . . . . . . . . . . . . . . . . . . . . . . . . . . . .71
Working with Dimensions ... . . . . . . . . . . . . . . . . . . . . . . . . . . . . . . . . . . . . . . . . . . . . . . . . . . . . . . . . . . . . . . . . . . . . . . . . . . . . . .76
Working with Tuples... . . . . . . . . . . . . . . . . . . . . . . . . . . . . . . . . . . . . . . . . . . . . . . . . . . . . . . . . . . . . . . . . . . . . . . . . . . . . . . . . . . . . .80
Removing Mapped Data and Deleting XBRL Objects .. . . . . . . . . . . . . . . . . . . . . . . . . . . . . . . . . . . . . . . . . . . . . . . . . .83
Working with Suppressed Mappings ... . . . . . . . . . . . . . . . . . . . . . . . . . . . . . . . . . . . . . . . . . . . . . . . . . . . . . . . . . . . . . . . . . .85
Reviewing Taxonomies... . . . . . . . . . . . . . . . . . . . . . . . . . . . . . . . . . . . . . . . . . . . . . . . . . . . . . . . . . . . . . . . . . . . . . . . . . . . . . . . . . .87
Generating Instance Documents ... . . . . . . . . . . . . . . . . . . . . . . . . . . . . . . . . . . . . . . . . . . . . . . . . . . . . . . . . . . . . . . . . . . . . . .92
Displaying the Instance Document in the Instance Viewer (SEC or Other) . . . . . . . . . . . . . . . . . . . . . . . . . .97
Instance Generation and Validation Architecture ... . . . . . . . . . . . . . . . . . . . . . . . . . . . . . . . . . . . . . . . . . . . . . . . . . . . .98
Creating XBRL Instance DocumentsBegin generating XBRL Instance Documents by connecting to the Disclosure Managementserver to access registered taxonomies. Then complete these actions:
l Select a taxonomy.
l Perform mappings to your financial statements with concepts from the selected taxonomy.
l Review and modify any mappings.
l Validate the instance document.
l Generate and export the instance document.
Creating XBRL Instance Documents 45
Connecting to the Disclosure Management ServerIn Microsoft Word or Microsoft Excel, set the Disclosure Management server options using theOptions menu (Word 2003) or Options button (Word 2007 ribbon). Once the server optionshave been defined, use the Connect button to logon into the Disclosure Management.
Note: Disclosure Management server details are provided by the administrator.
Note: When the Disclosure Management Mapping Tool is opened, the Disclosure Managementclients waits until the user interface is fully loaded. If the Disclosure Management MappingTool is not loaded with the connection time-out period, Disclosure Managementconsiders the attempt as unsuccessful. By default, the time-out period is two minutes (120seconds). The time-out period can be changed by setting the following value in theWindows registry (create a new string value if it’s not already been created): HKCU\SOFTWARE\Oracle\Disclosure Management\MappingToolTimeout. The valueshould be specified in seconds.
Viewing Data in Financial StatementsFinancial statement files are opened from the local file system in either Microsoft Word andExcel.
46 Generating XBRL Instance Documents
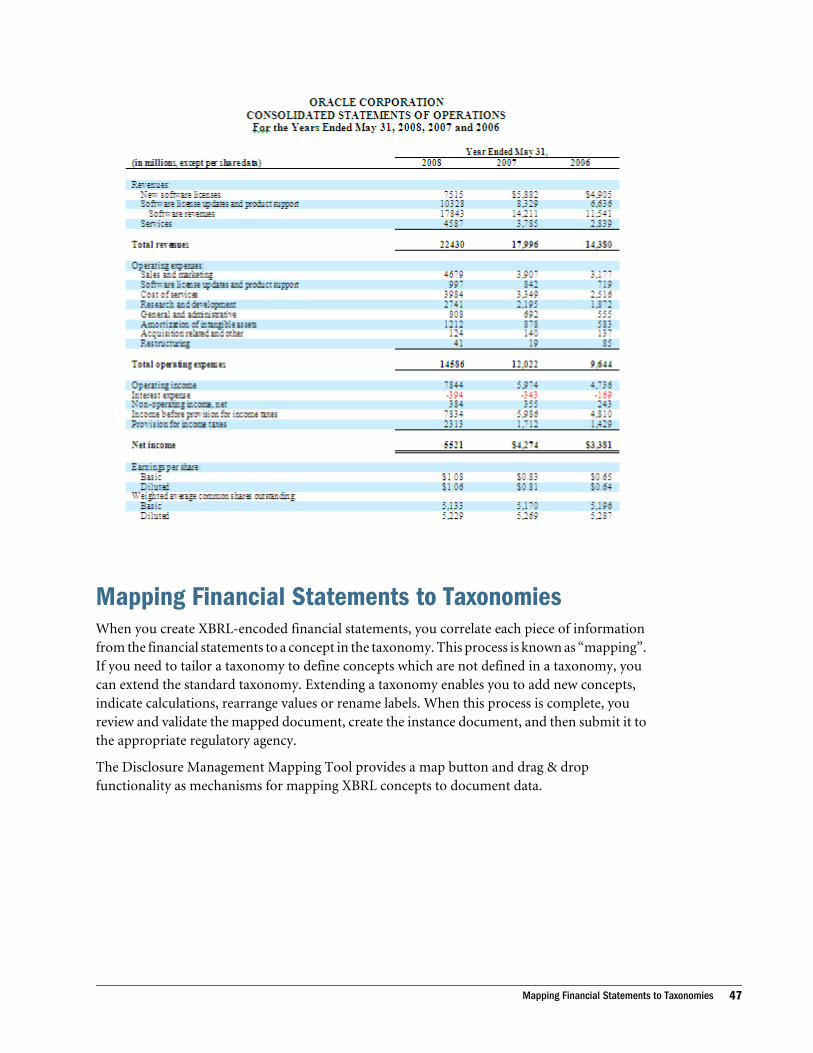
Mapping Financial Statements to TaxonomiesWhen you create XBRL-encoded financial statements, you correlate each piece of informationfrom the financial statements to a concept in the taxonomy. This process is known as “mapping”.If you need to tailor a taxonomy to define concepts which are not defined in a taxonomy, youcan extend the standard taxonomy. Extending a taxonomy enables you to add new concepts,indicate calculations, rearrange values or rename labels. When this process is complete, youreview and validate the mapped document, create the instance document, and then submit it tothe appropriate regulatory agency.
The Disclosure Management Mapping Tool provides a map button and drag & dropfunctionality as mechanisms for mapping XBRL concepts to document data.
Mapping Financial Statements to Taxonomies 47
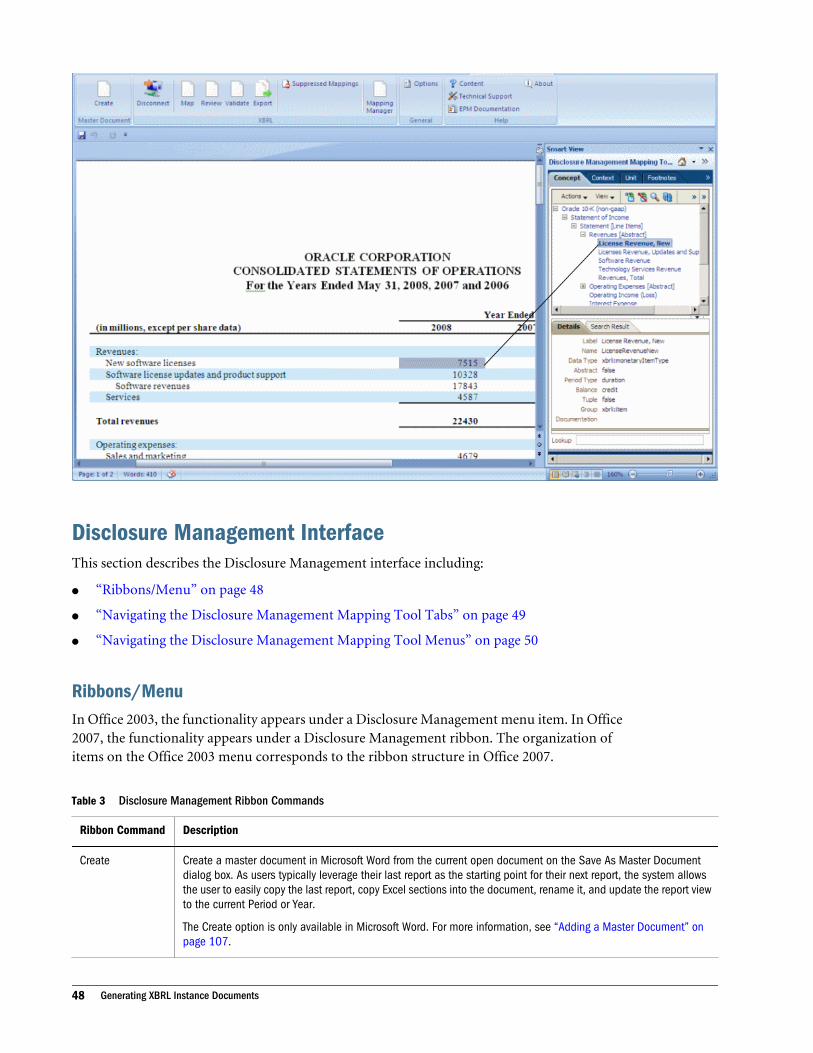
Disclosure Management InterfaceThis section describes the Disclosure Management interface including:
l “Ribbons/Menu” on page 48
l “Navigating the Disclosure Management Mapping Tool Tabs” on page 49
l “Navigating the Disclosure Management Mapping Tool Menus” on page 50
Ribbons/MenuIn Office 2003, the functionality appears under a Disclosure Management menu item. In Office2007, the functionality appears under a Disclosure Management ribbon. The organization ofitems on the Office 2003 menu corresponds to the ribbon structure in Office 2007.
Table 3 Disclosure Management Ribbon Commands
Ribbon Command Description
Create Create a master document in Microsoft Word from the current open document on the Save As Master Documentdialog box. As users typically leverage their last report as the starting point for their next report, the system allowsthe user to easily copy the last report, copy Excel sections into the document, rename it, and update the report viewto the current Period or Year.
The Create option is only available in Microsoft Word. For more information, see “Adding a Master Document” onpage 107.
48 Generating XBRL Instance Documents

Ribbon Command Description
Connect Connect to the Disclosure Management server. A user name and password are required to use this command.
Map Displays the Disclosure Management Mapping Tool.
Review Allows users to review all the existing mappings relevant to the Office document by way of a Review tab in theDisclosure Management Mapping Tool. In Review mode, users can delete, modify and/or edit existing mappingswithin an Office document. There are two "views" within the review mode:
l Tree—shows all the mapped data in a hierarchical view of a concept and the items that it contains.
l List Flat—shows all mapped data in a flat list/table.
In both views, users can navigate to the appropriate data in the Office document by selecting a mapped item in thereview list.
You can also review mappings by clicking the Review tab in the Disclosure Management Mapping Tool.
Validate Runs a validation of the mapped document and displays any errors and inconsistencies.
Export Generates a XBRL instance document on the server and downloads it to the user's computer to the specified file/path, and then opens the document in the viewer.
SuppressedMappings
Launches the Suppressed Mappings dialog box. This feature allows users to review currently suppressed individualcell-mappings belonging to corresponding data source mappings and unsuppress mapping any if necessary.
Instance Viewer Enables you to specify the local path to the Instance document and its taxonomy, and render the instance documentin a viewer.
Mapping Manager Launches the Mapping Manager in EPM Workspace. The Mapping Manager provides a common interface to select,change and delete taxonomy concept mappings associated with a selected taxonomy stored in the MappingRepository.
Navigating the Disclosure Management Mapping Tool TabsWhen shown in the Office add-in, the Disclosure Management Mapping Tool consists of fivetabs displayed at the top of the tool. They are:
l Concepts—Navigate search and select taxonomy concepts for mapping to financialstatement data.
l Context—Create, edit and select XBRL context definitions that provide information aboutthe business entity, a time-frame and other optional details for a XBRL fact. A context canthen be mapped to one or more XBRL facts.
l Unit—Create, edit and select XBRL unit definitions that define the measure that numericdata represent. Units can be mapped to one or more XBRL numeric facts. Units cannot bemapped to non-numeric data.
l Footnote—Create, edit and select explanatory textual details about specific data within thereport.
l Review—Opens a review pane that displays all of the XBRL mappings defined in thedocument.
Mapping Financial Statements to Taxonomies 49
Depending on the width of the Disclosure Management Mapping Tool, not all five tabs may bedisplayed. By default only the first four items are displayed. You can navigate between tabs thatare not displayed by clicking on the arrow in the top left or right of the Disclosure ManagementMapping Tool and selecting the desired tab. The Disclosure Management Mapping Tool canalso be resized to display all tabs.
Navigating the Disclosure Management Mapping Tool MenusEach tab contains menus and features specific to the Disclosure Management Mapping Tooltab. For example, the Concepts tab includes an Actions menu, which contains options specificto taxonomy selection, searching and refreshing.
Working with XBRL Taxonomy ConceptsUse the Concepts tab to select a taxonomy, navigate, search and select taxonomy concepts formapping to financial statement data. A taxonomy concept or element (used interchangeably)refers to a member that is defined in a taxonomy. For example, the concept "GrossProfit" isdefined in a taxonomy. The Disclosure Management Mapping Tool renders taxonomy conceptsin a tree-view structure (showing their parent-child relationships). The Disclosure ManagementMapping Tool allows taxonomy concepts to be mapped to data that exists in a Microsoft Officedocument or Financial Reporting grid.
Selecting a TaxonomyThe administrator registers the taxonomies available to the Disclosure Management MappingTool.
Disclosure Management. supports mappings from a single taxonomy per Office document. Forexample, users can map to the US-GAAP Commercial & Industrial and US-GAAP Insurance(CI) taxonomies in an Office document; however, users cannot map to the US-GAAP (CI) andthe IFRS taxonomies within the same Office document.
When a user wants to change a taxonomy, they are prompted to confirm the change. If thechange is confirmed, all the concept mappings associated with the original taxonomy within theOffice document are removed. Although the existing concept mappings in the Office documentwill be removed, the contexts, units and footnotes remain intact. For more information, see“Changing a Taxonomy” on page 60.
If a taxonomy has already been mapped for a document, the taxonomy is automatically openedwith the document when logging in.
ä To select a taxonomy:
1 Select the Concept tab.
2 In the Actions menu, choose Select Taxonomy.
The Select Taxonomy pane is displayed.
50 Generating XBRL Instance Documents
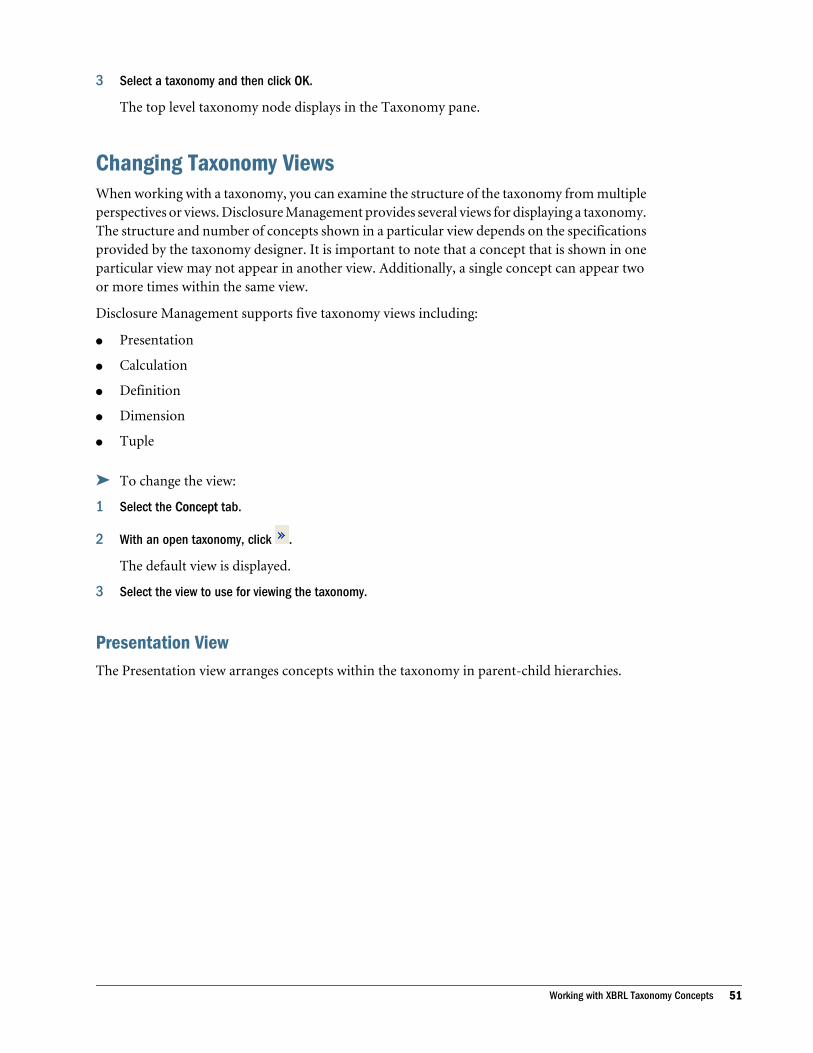
3 Select a taxonomy and then click OK.
The top level taxonomy node displays in the Taxonomy pane.
Changing Taxonomy ViewsWhen working with a taxonomy, you can examine the structure of the taxonomy from multipleperspectives or views. Disclosure Management provides several views for displaying a taxonomy.The structure and number of concepts shown in a particular view depends on the specificationsprovided by the taxonomy designer. It is important to note that a concept that is shown in oneparticular view may not appear in another view. Additionally, a single concept can appear twoor more times within the same view.
Disclosure Management supports five taxonomy views including:
l Presentation
l Calculation
l Definition
l Dimension
l Tuple
ä To change the view:
1 Select the Concept tab.
2 With an open taxonomy, click .
The default view is displayed.
3 Select the view to use for viewing the taxonomy.
Presentation ViewThe Presentation view arranges concepts within the taxonomy in parent-child hierarchies.
Working with XBRL Taxonomy Concepts 51
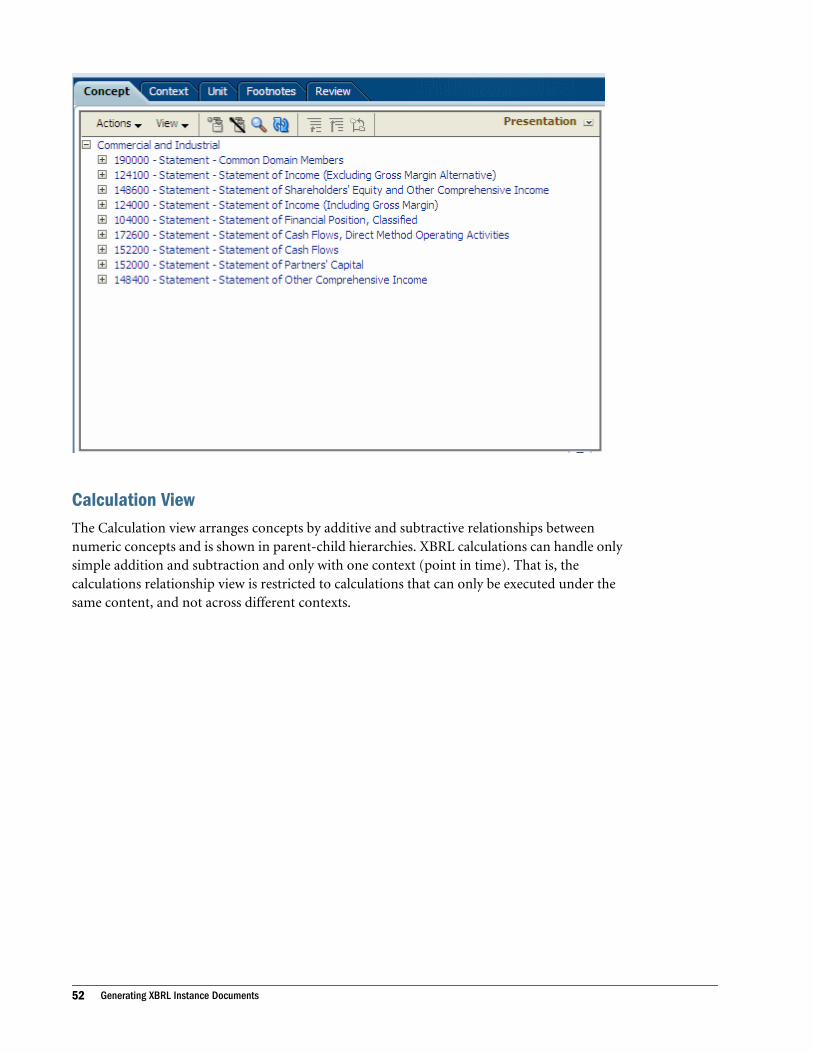
Calculation ViewThe Calculation view arranges concepts by additive and subtractive relationships betweennumeric concepts and is shown in parent-child hierarchies. XBRL calculations can handle onlysimple addition and subtraction and only with one context (point in time). That is, thecalculations relationship view is restricted to calculations that can only be executed under thesame content, and not across different contexts.
52 Generating XBRL Instance Documents
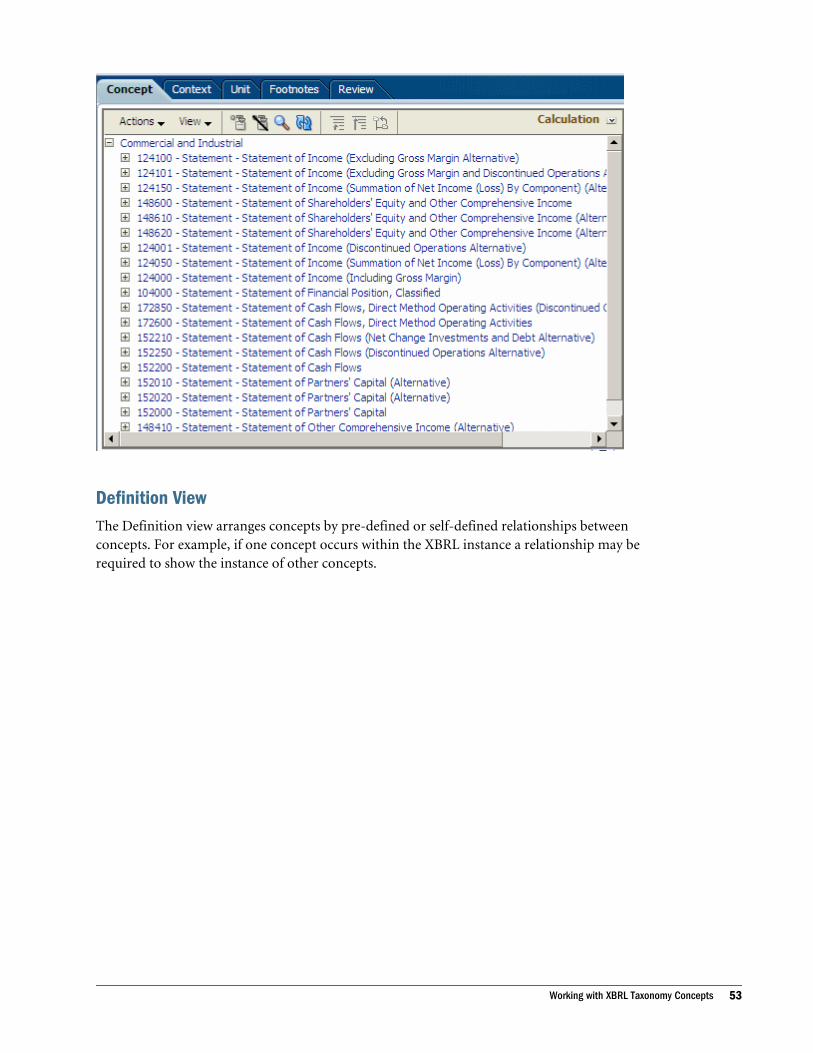
Definition ViewThe Definition view arranges concepts by pre-defined or self-defined relationships betweenconcepts. For example, if one concept occurs within the XBRL instance a relationship may berequired to show the instance of other concepts.
Working with XBRL Taxonomy Concepts 53
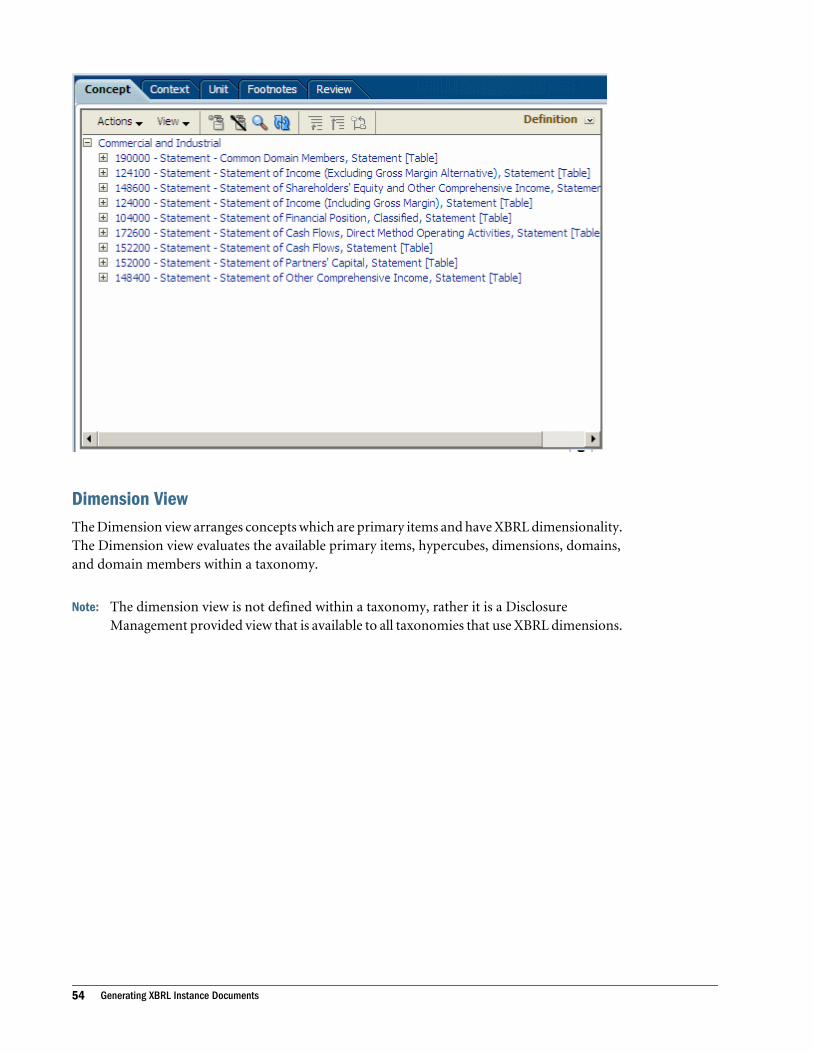
Dimension ViewThe Dimension view arranges concepts which are primary items and have XBRL dimensionality.The Dimension view evaluates the available primary items, hypercubes, dimensions, domains,and domain members within a taxonomy.
Note: The dimension view is not defined within a taxonomy, rather it is a DisclosureManagement provided view that is available to all taxonomies that use XBRL dimensions.
54 Generating XBRL Instance Documents

Tuple ViewArranges concepts by tuple relationships. Tuples are a group of related concepts containingmultiple values. An individual tuple member by itself may not provide enough relevantinformation; however, a group of tuple members provides more complete information.
Note: The tuple view is not defined within a taxonomy, rather it is a Disclosure Managementprovided view that is available to all taxonomies that use XBRL dimensions.
Working with XBRL Taxonomy Concepts 55
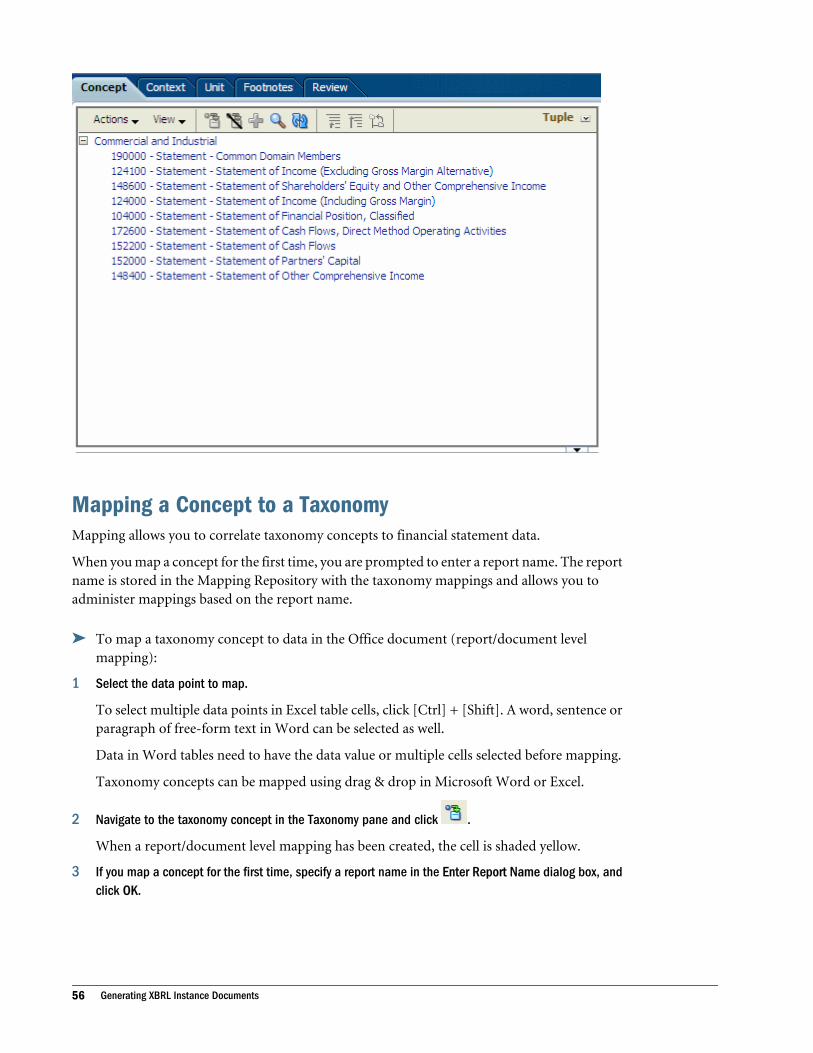
Mapping a Concept to a TaxonomyMapping allows you to correlate taxonomy concepts to financial statement data.
When you map a concept for the first time, you are prompted to enter a report name. The reportname is stored in the Mapping Repository with the taxonomy mappings and allows you toadminister mappings based on the report name.
ä To map a taxonomy concept to data in the Office document (report/document levelmapping):
1 Select the data point to map.
To select multiple data points in Excel table cells, click [Ctrl] + [Shift]. A word, sentence orparagraph of free-form text in Word can be selected as well.
Data in Word tables need to have the data value or multiple cells selected before mapping.
Taxonomy concepts can be mapped using drag & drop in Microsoft Word or Excel.
2 Navigate to the taxonomy concept in the Taxonomy pane and click .
When a report/document level mapping has been created, the cell is shaded yellow.
3 If you map a concept for the first time, specify a report name in the Enter Report Name dialog box, andclick OK.
56 Generating XBRL Instance Documents
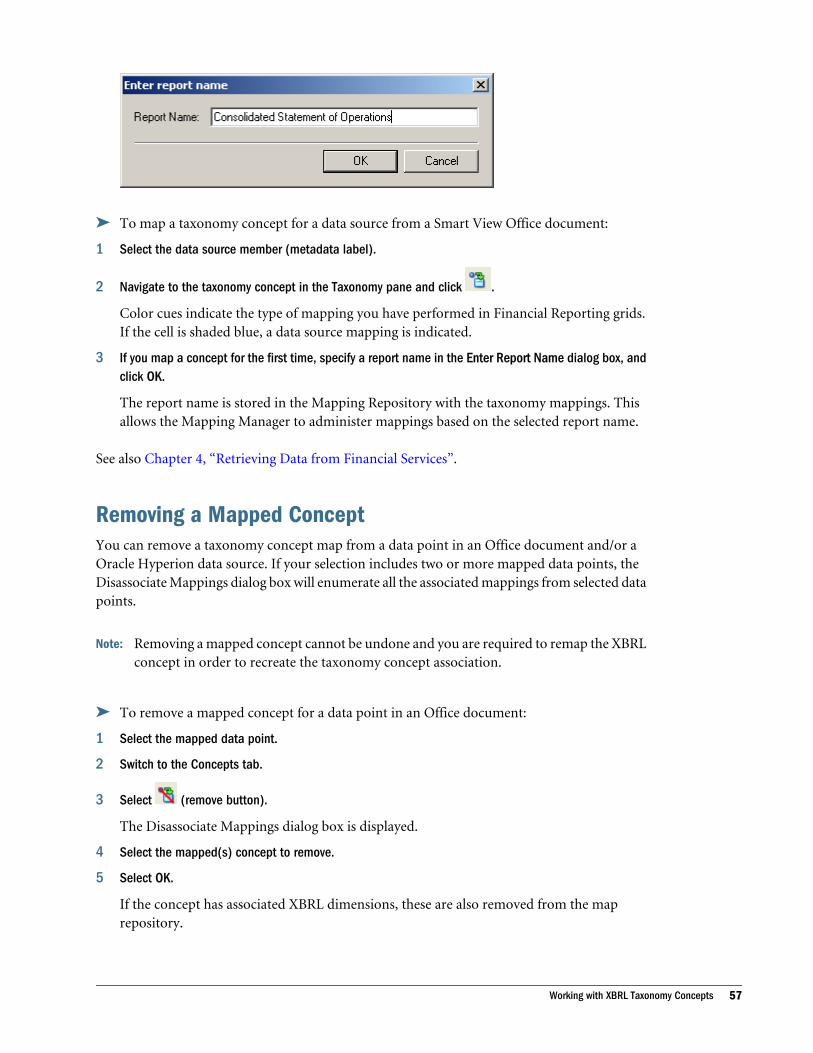
ä To map a taxonomy concept for a data source from a Smart View Office document:
1 Select the data source member (metadata label).
2 Navigate to the taxonomy concept in the Taxonomy pane and click .
Color cues indicate the type of mapping you have performed in Financial Reporting grids.If the cell is shaded blue, a data source mapping is indicated.
3 If you map a concept for the first time, specify a report name in the Enter Report Name dialog box, andclick OK.
The report name is stored in the Mapping Repository with the taxonomy mappings. Thisallows the Mapping Manager to administer mappings based on the selected report name.
See also Chapter 4, “Retrieving Data from Financial Services”.
Removing a Mapped ConceptYou can remove a taxonomy concept map from a data point in an Office document and/or aOracle Hyperion data source. If your selection includes two or more mapped data points, theDisassociate Mappings dialog box will enumerate all the associated mappings from selected datapoints.
Note: Removing a mapped concept cannot be undone and you are required to remap the XBRLconcept in order to recreate the taxonomy concept association.
ä To remove a mapped concept for a data point in an Office document:
1 Select the mapped data point.
2 Switch to the Concepts tab.
3 Select (remove button).
The Disassociate Mappings dialog box is displayed.
4 Select the mapped(s) concept to remove.
5 Select OK.
If the concept has associated XBRL dimensions, these are also removed from the maprepository.
Working with XBRL Taxonomy Concepts 57
Refreshing a TaxonomyRefreshing a taxonomy tree retrieves the latest content from the Disclosure Management server.
ä To refresh the taxonomy tree, select .
Viewing TaxonomiesThe View menu allows you to performs actions related to specific nodes in the taxonomy tree,such as navigation. Use View menu options to perform these actions on a taxonomy:
l Expand—Expands the currently selected parent node.
l Expand All Below—-Expands the currently selected parent node as well as all embeddedparent nodes.
l Collapse All Below—Collapses the currently selected parent node as well as all embeddedparent nodes.
l Expand All—Expands all parent nodes. This is not recommended for large taxonomies.
l Collapse All—Collapses all parent nodes.
l Show as Top— The selected node in the taxonomy tree is displayed as the top node in thetaxonomy hierarchy. Provides a mechanism to view a subset of the taxonomy hierarchy.
l Go to Top—Navigates to the top-most parent node.
l Scroll to First—Scrolls the hierarchy so the first node is shown.
l Scroll to Last—Scrolls the hierarchy to the last node is shown.
Caution! You may wish to avoid using the Expand All options when using a large taxonomybecause memory and cache issues might occur.
Additionally in tree view you can use the arrow located in the middle right of the view panes (asshown in the image below) to expand and collapse taxonomy views.
58 Generating XBRL Instance Documents

Viewing Concept DetailDetails about a selected taxonomy concept are available on the Concept Details pane. Thisinformation reflects properties related to the selected concept, such as Label, Name, or DataType. Note that some properties are optional.
Working with XBRL Taxonomy Concepts 59
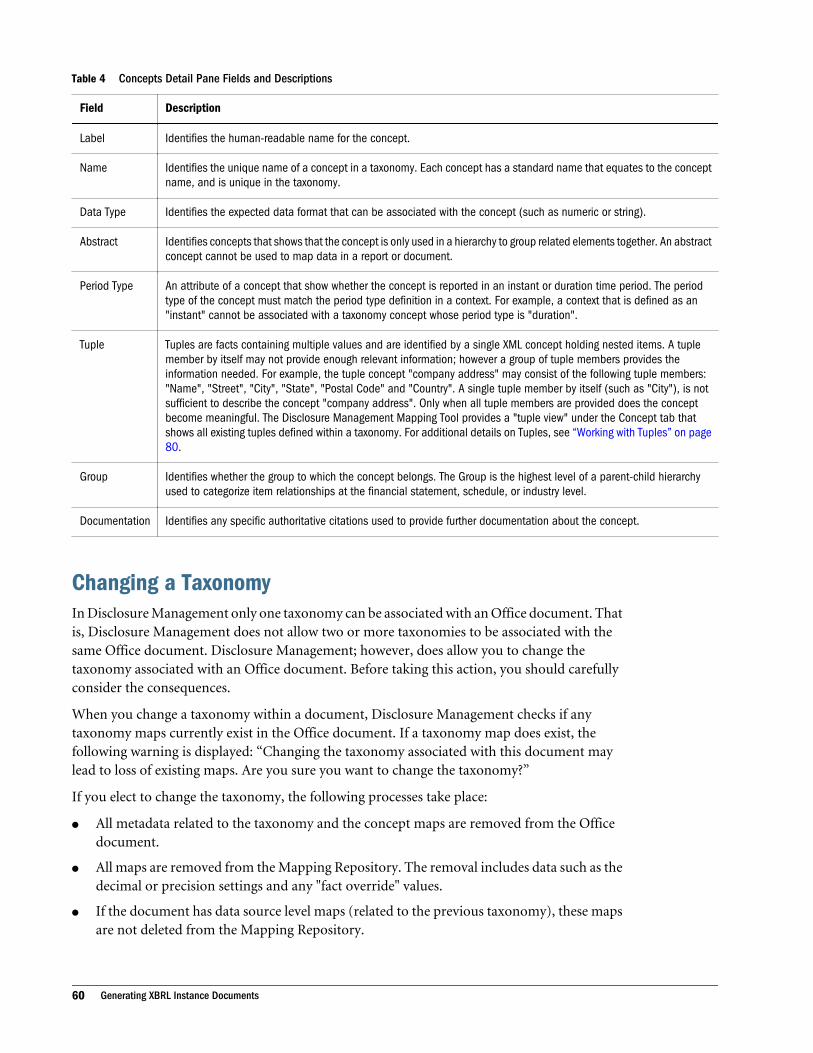
Table 4 Concepts Detail Pane Fields and Descriptions
Field Description
Label Identifies the human-readable name for the concept.
Name Identifies the unique name of a concept in a taxonomy. Each concept has a standard name that equates to the conceptname, and is unique in the taxonomy.
Data Type Identifies the expected data format that can be associated with the concept (such as numeric or string).
Abstract Identifies concepts that shows that the concept is only used in a hierarchy to group related elements together. An abstractconcept cannot be used to map data in a report or document.
Period Type An attribute of a concept that show whether the concept is reported in an instant or duration time period. The periodtype of the concept must match the period type definition in a context. For example, a context that is defined as an"instant" cannot be associated with a taxonomy concept whose period type is "duration".
Tuple Tuples are facts containing multiple values and are identified by a single XML concept holding nested items. A tuplemember by itself may not provide enough relevant information; however a group of tuple members provides theinformation needed. For example, the tuple concept "company address" may consist of the following tuple members:"Name", "Street", "City", "State", "Postal Code" and "Country". A single tuple member by itself (such as "City"), is notsufficient to describe the concept "company address". Only when all tuple members are provided does the conceptbecome meaningful. The Disclosure Management Mapping Tool provides a "tuple view" under the Concept tab thatshows all existing tuples defined within a taxonomy. For additional details on Tuples, see “Working with Tuples” on page80.
Group Identifies whether the group to which the concept belongs. The Group is the highest level of a parent-child hierarchyused to categorize item relationships at the financial statement, schedule, or industry level.
Documentation Identifies any specific authoritative citations used to provide further documentation about the concept.
Changing a TaxonomyIn Disclosure Management only one taxonomy can be associated with an Office document. Thatis, Disclosure Management does not allow two or more taxonomies to be associated with thesame Office document. Disclosure Management; however, does allow you to change thetaxonomy associated with an Office document. Before taking this action, you should carefullyconsider the consequences.
When you change a taxonomy within a document, Disclosure Management checks if anytaxonomy maps currently exist in the Office document. If a taxonomy map does exist, thefollowing warning is displayed: “Changing the taxonomy associated with this document maylead to loss of existing maps. Are you sure you want to change the taxonomy?”
If you elect to change the taxonomy, the following processes take place:
l All metadata related to the taxonomy and the concept maps are removed from the Officedocument.
l All maps are removed from the Mapping Repository. The removal includes data such as thedecimal or precision settings and any "fact override" values.
l If the document has data source level maps (related to the previous taxonomy), these mapsare not deleted from the Mapping Repository.
60 Generating XBRL Instance Documents
l The contexts, units and footnotes are retained (definitions and maps remain intact sincethey are saved with the document).
If no taxonomy map exists, then there is no user confirmation necessary and the taxonomy canbe changed. The Disclosure Management Mapping Tool will not automatically render the newtaxonomy selected by the user.
Rolling Over a TaxonomyChanging a taxonomy may be necessary when you need to “roll over” a Disclosure Managementdocument from one period or quarter to the next. For example, the SEC requires that a companyinclude their US-GAAP taxonomy extension for each instance document that is submitted (i.e.one taxonomy extension for each submission). This allows the SEC to use the company's mostrecent version of their US-GAAP taxonomy extension - which corresponds to the instancedocument being submitted. It may be necessary to "roll over" the previous SEC submission forthe new period. For the most part, rolling over a report from one period to the next simply meansthat you update the document data and update the XBRL contexts. The XBRL concept mappings;however, should remain intact.
ä To roll over a taxonomy:
1 Make a copy of the existing Disclosure Management document and rename the copy accordingly.
2 Open the copy and modify the XBRL contexts to reflect the new period or quarter.
3 Refresh their document data to reflect the new data of the period (this potentially includes changingthe POV for a Financial Reporting report or Smart View query).
4 Change the taxonomy to the one that will be submitted to the SEC.
The taxonomy may or may not be the same one as the previous period.
5 Resolve any concept mismatches.
If there are any concept mismatches (i.e. a concept that existed in the previous taxonomy,but not in the new one), they are reported in the instance validation feature.
Note: When a user changes a taxonomy within a Disclosure Management document, the existingXBRL concept mappings are retained in the Mapping Repository. If the concepts continueto exist in the new taxonomy, they continue to be associated with the document data.
Note: Users can also use the Mapping Manager to update existing mappings so that they pointto a different taxonomy. However, when this is done, the mapping from the previoustaxonomy is lost. If a user was to open the original copy of the mapped DisclosureManagement document, they would see references to the new taxonomy.
Working with XBRL Taxonomy Concepts 61
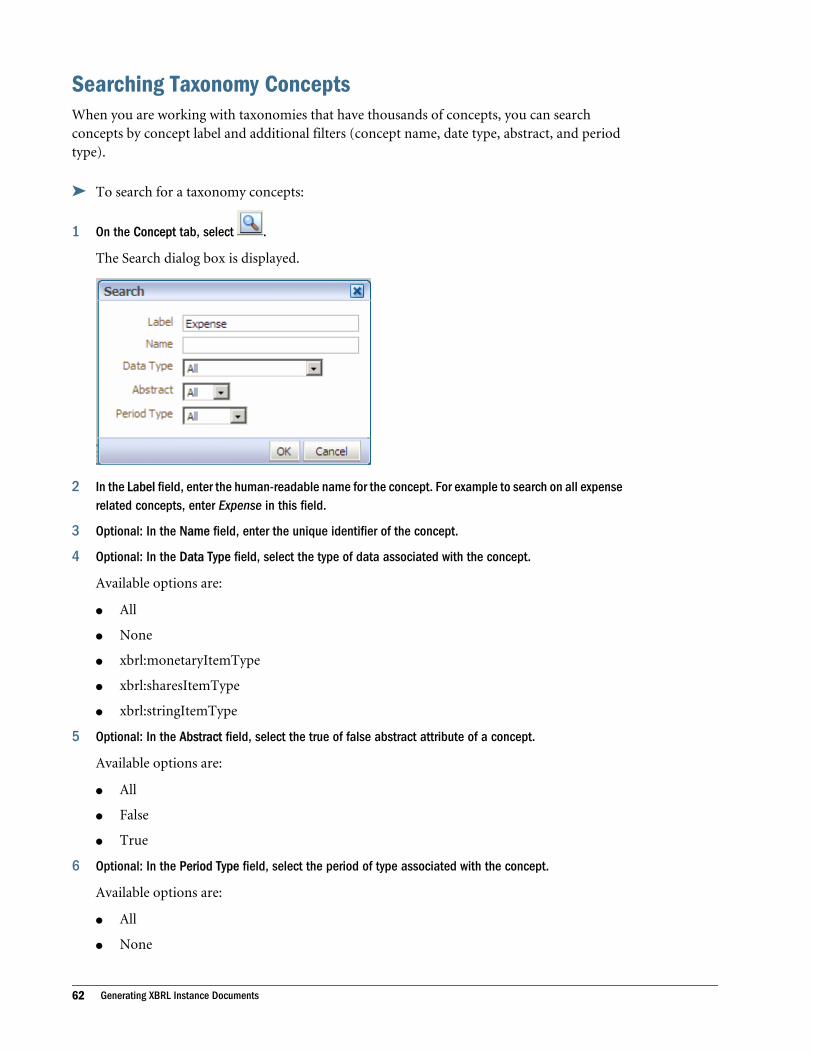
Searching Taxonomy ConceptsWhen you are working with taxonomies that have thousands of concepts, you can searchconcepts by concept label and additional filters (concept name, date type, abstract, and periodtype).
ä To search for a taxonomy concepts:
1 On the Concept tab, select .
The Search dialog box is displayed.
2 In the Label field, enter the human-readable name for the concept. For example to search on all expenserelated concepts, enter Expense in this field.
3 Optional: In the Name field, enter the unique identifier of the concept.
4 Optional: In the Data Type field, select the type of data associated with the concept.
Available options are:
l All
l None
l xbrl:monetaryItemType
l xbrl:sharesItemType
l xbrl:stringItemType
5 Optional: In the Abstract field, select the true of false abstract attribute of a concept.
Available options are:
l All
l False
l True
6 Optional: In the Period Type field, select the period of type associated with the concept.
Available options are:
l All
l None
62 Generating XBRL Instance Documents
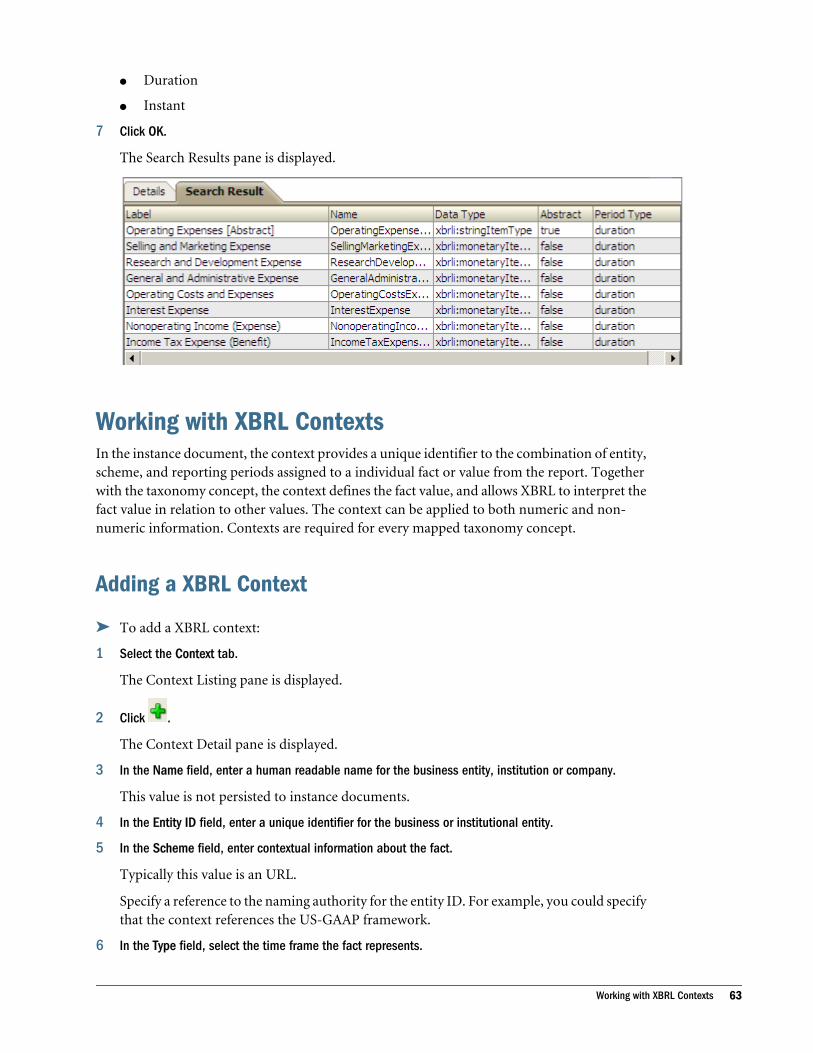
l Duration
l Instant
7 Click OK.
The Search Results pane is displayed.
Working with XBRL ContextsIn the instance document, the context provides a unique identifier to the combination of entity,scheme, and reporting periods assigned to a individual fact or value from the report. Togetherwith the taxonomy concept, the context defines the fact value, and allows XBRL to interpret thefact value in relation to other values. The context can be applied to both numeric and non-numeric information. Contexts are required for every mapped taxonomy concept.
Adding a XBRL Context
ä To add a XBRL context:
1 Select the Context tab.
The Context Listing pane is displayed.
2 Click .
The Context Detail pane is displayed.
3 In the Name field, enter a human readable name for the business entity, institution or company.
This value is not persisted to instance documents.
4 In the Entity ID field, enter a unique identifier for the business or institutional entity.
5 In the Scheme field, enter contextual information about the fact.
Typically this value is an URL.
Specify a reference to the naming authority for the entity ID. For example, you could specifythat the context references the US-GAAP framework.
6 In the Type field, select the time frame the fact represents.
Working with XBRL Contexts 63

: Every taxonomy concept has a "period type" attribute. When associating a context to ataxonomy concept the period types must match.
Valid Type options are:
l Instant—Used for “point in time” concepts such as Balance Sheet accounts.
l Duration—Represents a flow of time such as a Profit and Loss, or Cash Flow statement.
l Forever
7 In the From field, select the starting period for the reporting period.
When entering the date, use the xx/xx/xxxx format. The date format defaults to the currentlocale of the browser. For example if the browser locale is set to a European locale, the datais entered as “dd/mm/yyyy” even when it is a US GAAP taxonomy.
8 In the To field, select the ending period for the reporting period.
This field is enabled only when the context type is "Duration". When the context type is"Instant" or "Forever", this field is disabled.
When entering the date, use the xx/xx/xxxx format. The date format defaults to the currentlocale of the browser. For example if the browser locale is set to a European locale, the datais entered as “dd/mm/yyyy” even when it is a US GAAP taxonomy.
9 Click OK.
The context is added to the Context Listing pane.
Mapping to a Context
ä To map a data point to a XBRL context in the Office document (report/document level orfunction grid in Smart View):
1 Select the data point to map.
To select multiple data points in Excel table cells, click [Ctrl] + [Shift]. A word, sentence orparagraph of free-form text in Word can be selected as well.
Data values in Word tables need to have the data value or multiple cells selected beforemapping.
Contexts can be mapped using drag & drop functionality in Word or Excel.
2 Navigate to the context on the Context Listing pane and click .
The mapped data point is highlighted with the color yellow.
Removing a Mapped ContextYou can disassociate a mapped context an Office document and/or a Oracle Hyperion datasource. Deleting a context affects all existing mappings that are associated with the deletedcontext - they will have no context association.
64 Generating XBRL Instance Documents

Note: Removing a mapped context cannot be undone and you are required to remap the XBRLcontext in order to recreate the mapping.
ä To remove a mapped context for a single data point or multiple data points in an Officedocument:
1 Select the mapped data point(s).
2 Select .
The Remove Mappings dialog box is displayed.
If any XBRL dimensions were associated with the removed context map, the DisclosureManagement Mapping Tool should also refresh its internal list of "virtual contexts" in caseone or more no longer applies (for more information, see “Virtual Context” on page 79).
3 Select the mapped context to remove.
4 Select OK.
Updating a ContextChanging the context definition affects all existing mappings that are associated with themodified context.
ä To update a context:
1 On the Context Listing pane, select the context and then click .
The Context dialog box is displayed.
2 Update the context detail as needed and then select OK.
Deleting a ContextYou can remove a XBRL context or a “virtual context” from data in an Office document. Whenyou delete a virtual content, you remove any existing document maps that match the "basecontext" and dimensions associated with the virtual context (for more information, see “VirtualContext” on page 79).
ä To remove a context:
1 On the Context Listing pane, select the context to be removed.
2 Select .
The following message is displayed: “Are you sure you want to delete this context?”
3 Select OK.
Working with XBRL Contexts 65
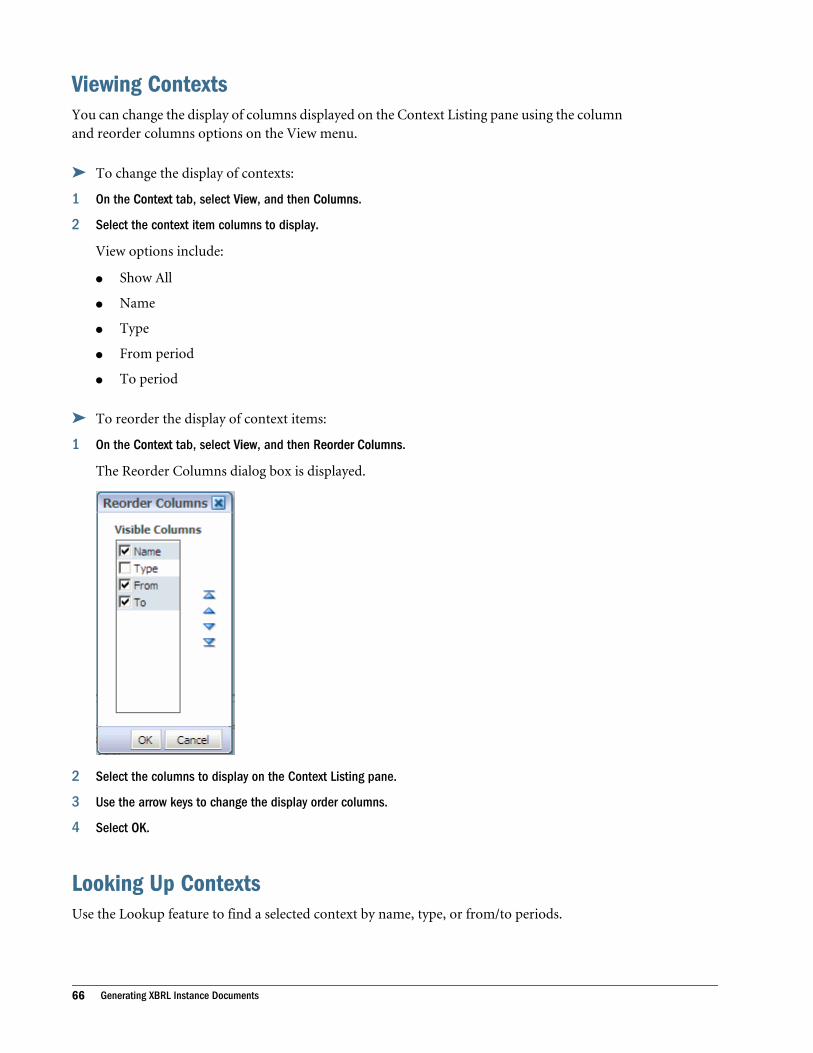
Viewing ContextsYou can change the display of columns displayed on the Context Listing pane using the columnand reorder columns options on the View menu.
ä To change the display of contexts:
1 On the Context tab, select View, and then Columns.
2 Select the context item columns to display.
View options include:
l Show All
l Name
l Type
l From period
l To period
ä To reorder the display of context items:
1 On the Context tab, select View, and then Reorder Columns.
The Reorder Columns dialog box is displayed.
2 Select the columns to display on the Context Listing pane.
3 Use the arrow keys to change the display order columns.
4 Select OK.
Looking Up ContextsUse the Lookup feature to find a selected context by name, type, or from/to periods.
66 Generating XBRL Instance Documents
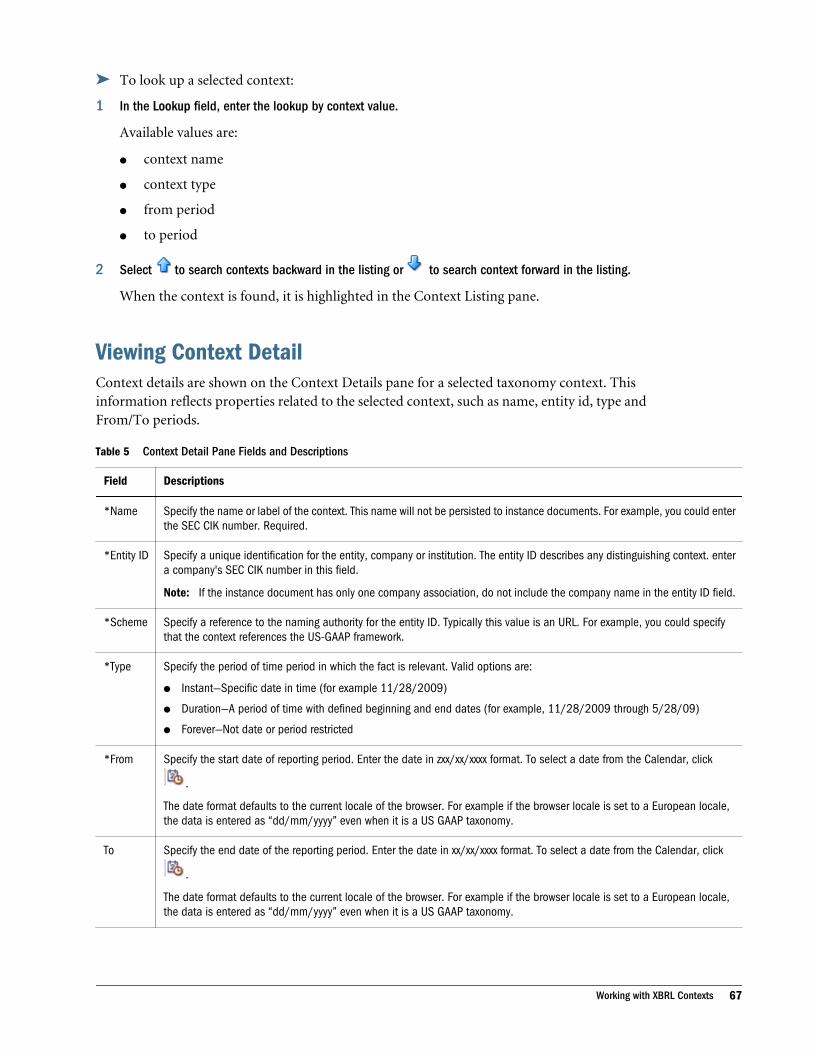
ä To look up a selected context:
1 In the Lookup field, enter the lookup by context value.
Available values are:
l context name
l context type
l from period
l to period
2 Select to search contexts backward in the listing or to search context forward in the listing.
When the context is found, it is highlighted in the Context Listing pane.
Viewing Context DetailContext details are shown on the Context Details pane for a selected taxonomy context. Thisinformation reflects properties related to the selected context, such as name, entity id, type andFrom/To periods.
Table 5 Context Detail Pane Fields and Descriptions
Field Descriptions
*Name Specify the name or label of the context. This name will not be persisted to instance documents. For example, you could enterthe SEC CIK number. Required.
*Entity ID Specify a unique identification for the entity, company or institution. The entity ID describes any distinguishing context. entera company's SEC CIK number in this field.
Note: If the instance document has only one company association, do not include the company name in the entity ID field.
*Scheme Specify a reference to the naming authority for the entity ID. Typically this value is an URL. For example, you could specifythat the context references the US-GAAP framework.
*Type Specify the period of time period in which the fact is relevant. Valid options are:
l Instant—Specific date in time (for example 11/28/2009)
l Duration—A period of time with defined beginning and end dates (for example, 11/28/2009 through 5/28/09)
l Forever—Not date or period restricted
*From Specify the start date of reporting period. Enter the date in zxx/xx/xxxx format. To select a date from the Calendar, click
.
The date format defaults to the current locale of the browser. For example if the browser locale is set to a European locale,the data is entered as “dd/mm/yyyy” even when it is a US GAAP taxonomy.
To Specify the end date of the reporting period. Enter the date in xx/xx/xxxx format. To select a date from the Calendar, click
.
The date format defaults to the current locale of the browser. For example if the browser locale is set to a European locale,the data is entered as “dd/mm/yyyy” even when it is a US GAAP taxonomy.
Working with XBRL Contexts 67
Working with XBRL UnitsIn the instance document, each numeric value must specify its unit of measurement. The unitof measurement can either be a simple unit of measure shown as a single measure value (currencyor monetary code), or a ratio of products of units of measures. The ratio is depicted with a divideelement containing a numerator and denominator. Examples of a simple unit are the USD (USdollar), CAD (Canadian dollar), kilograms, FTE (full-time equivalents), meters or share. A ratioof products, for example, could be Euros per share (numerator: EUR, denominator: shares).
Adding XBRL Units
ä To add an unit:
1 Select the Unit tab.
The Unit Listing pane is displayed.
2 Click .
The Unit Detail pane is displayed.
3 In the Name field, enter the name of the unit.
4 In the Measure field, select the unit type.
The list of unit types is derived from the mappingtool.properties file and can be edited ifdesired. For more information, see “Configuring the Unit Type List ” on page 19.
Select to browse a valid measure for the selected taxonomy.
5 If you selected a ratio of products of units of measures unit type in the Measure field, check the Divideby field and specify the denominator in the Denominator field.
6 Click OK.
The unit is added to the Unit Listing pane.
Mapping to a Unit
ä To map a data point in the Office document (report/document level or function grid inSmart View):
1 Select the data point to map.
To select multiple data points in Excel table cells, click [Ctrl] + [Shift].
A word, sentence or paragraph of free-form text in Word can be selected as well.
Data values in Word tables need to have the data value or multiple cells selected beforemapping.
Units can be mapped using drag & drop functionality in Word or Excel.
68 Generating XBRL Instance Documents

2 Navigate to the unit on the Unit Listing pane and select .
The mapped data point is highlighted with the color yellow.
Removing a Mapped UnitYou can remove a mapped unit for a single data point or multiple data points in an Officedocument or Oracle Hyperion data source.
Note: Removing a mapped unit cannot be undone and you are required to remap the XBRLcontext in order to recreate the mapping.
ä To remove a mapped unit for a single data point or multiple data points in an Officedocument:
1 Select the mapped data point(s).
2 Click .
The Disassociate Mappings dialog box is displayed.
3 Select the mapped unit to remove.
4 Click OK.
Updating a Unit
ä To update a unit:
1 On the Unit Listing pane, select the unit and then click .
The Unit dialog box is displayed.
2 Update the unit detail as needed and then select OK.
Deleting a UnitYou can remove a XBRL unit. Deleting a unit affects all existing mappings that are associatedwith the deleted unit - they will have no unit association.
ä To remove a unit:
1 On the Unit Listing pane, select the unit to be removed.
2 Click .
The following message is displayed: “Are you sure you want to delete this unit?”
3 Select OK.
Working with XBRL Units 69
Viewing UnitsYou can change the display of columns on the Unit Listing dialog box using the column andreorder columns options on the View menu.
ä To change the display of unit columns:
1 On the Unit tab, select View, and then Columns.
2 Select the unit columns to display.
View options include:
l Show All
l Unit Name
l Measure
l Divide by (attribute)
l Denominator
ä To reorder the display of context items:
1 On the Context tab, select View, and then Reorder Columns.
2 Select the columns to display on the Units Listing pane.
3 Use the arrow keys to change the display order columns.
4 Click OK.
Looking Up UnitsUse the Lookup feature to find a selected unit by unit name, measure, divide by attribute, ordenominator value.
ä To look up a selected unit:
1 In the Lookup field, enter the lookup by unit value.
Available values are unit name, measure, divide by attribute, or denominator value.
2 Select to search units backward in the listing or to search units forward in the listing.
When the unit is found, it is highlighted in the Unit listing pane.
Viewing Unit DetailUnit details are shown on the Details tab for a selected taxonomy unit. This information reflectsproperties related to the selected element, such as name, measure, divide by and denominator.
70 Generating XBRL Instance Documents
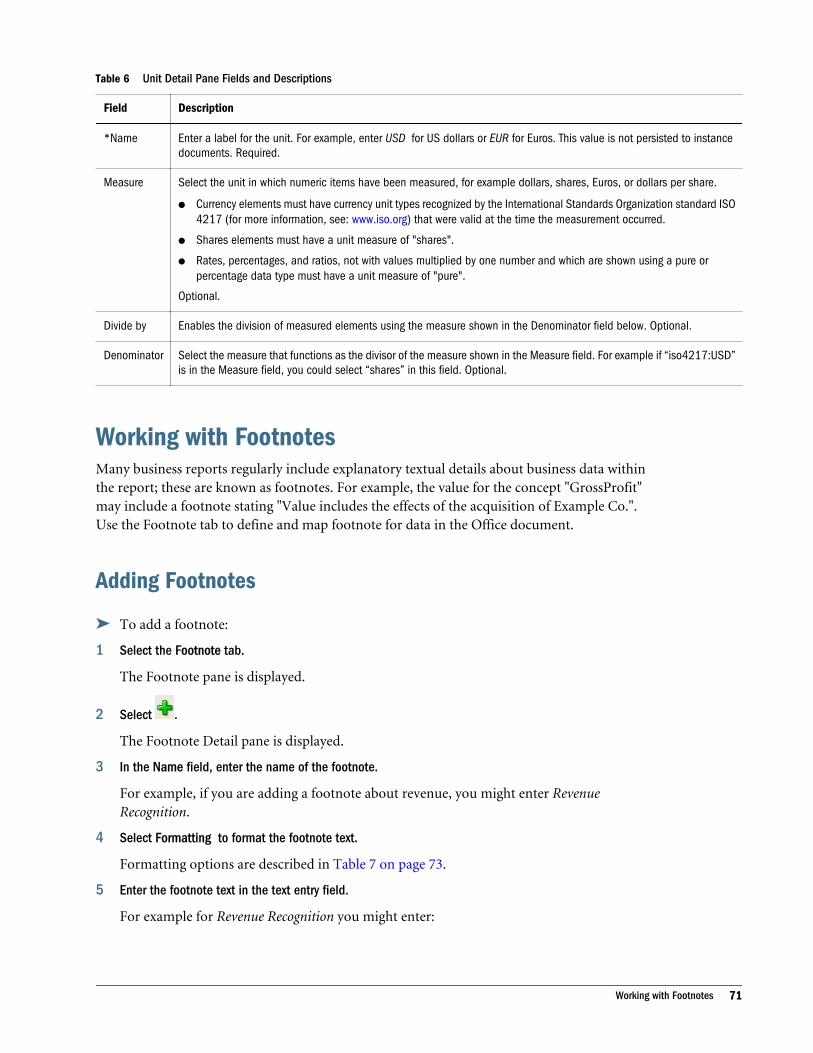
Table 6 Unit Detail Pane Fields and Descriptions
Field Description
*Name Enter a label for the unit. For example, enter USD for US dollars or EUR for Euros. This value is not persisted to instancedocuments. Required.
Measure Select the unit in which numeric items have been measured, for example dollars, shares, Euros, or dollars per share.
l Currency elements must have currency unit types recognized by the International Standards Organization standard ISO4217 (for more information, see: www.iso.org) that were valid at the time the measurement occurred.
l Shares elements must have a unit measure of "shares".
l Rates, percentages, and ratios, not with values multiplied by one number and which are shown using a pure orpercentage data type must have a unit measure of "pure".
Optional.
Divide by Enables the division of measured elements using the measure shown in the Denominator field below. Optional.
Denominator Select the measure that functions as the divisor of the measure shown in the Measure field. For example if “iso4217:USD”is in the Measure field, you could select “shares” in this field. Optional.
Working with FootnotesMany business reports regularly include explanatory textual details about business data withinthe report; these are known as footnotes. For example, the value for the concept "GrossProfit"may include a footnote stating "Value includes the effects of the acquisition of Example Co.".Use the Footnote tab to define and map footnote for data in the Office document.
Adding Footnotes
ä To add a footnote:
1 Select the Footnote tab.
The Footnote pane is displayed.
2 Select .
The Footnote Detail pane is displayed.
3 In the Name field, enter the name of the footnote.
For example, if you are adding a footnote about revenue, you might enter RevenueRecognition.
4 Select Formatting to format the footnote text.
Formatting options are described in Table 7 on page 73.
5 Enter the footnote text in the text entry field.
For example for Revenue Recognition you might enter:
Working with Footnotes 71
We derive revenues from the following sources: (1) software, which includes new softwarelicense and software license updates and product support revenues, and (2) services, whichinclude consulting, On Demand and education revenues. New software license revenuesrepresent fees earned from granting customers licenses to use our database, middleware andapplications software, and exclude revenues derived from software license updates, whichare included in software license updates and product support revenues. While the basis forsoftware license revenue recognition is substantially governed by the provisions of Statementof Position No. 97-2, Software Revenue Recognition (SOP 97-2), issued by the AmericanInstitute of Certified Public Accountants, we exercise judgment and use estimates inconnection with the determination of the amount of software and services revenues to berecognized in each accounting period.
6 Select OK.
Mapping to a Footnote
ä To map a single data point or multiple data points to a footnote in the Office document(report/document level or function grid in Smart View):
1 Select the data point to map.
To select multiple data points in Excel, click [Ctrl] + [Shift]. A word, sentence or paragraphof free-form text in Word can be selected as well.
Data values in Word tables need to have the data value or multiple cells selected beforemapping.
Footnotes can be mapped using drag & drop functionality in Word or Excel.
2 Navigate to the footnote on the Footnote Listing dialog box and select .
The mapped data point is highlighted with the color yellow.
Removing a Mapped FootnoteYou can remove a mapped footnote for a single data point or multiple data points in an Officedocument and/or an Oracle Hyperion data source.
Note: Removing a mapped footnote cannot be undone and you are required to remap the XBRLcontext in order to recreate the mapping.
ä To dissociate a mapped footnote for a single data point or multiple data points in an Officedocument:
1 Select the mapped data point(s).
2 Select .
The Remove Mapping dialog box is displayed.
72 Generating XBRL Instance Documents
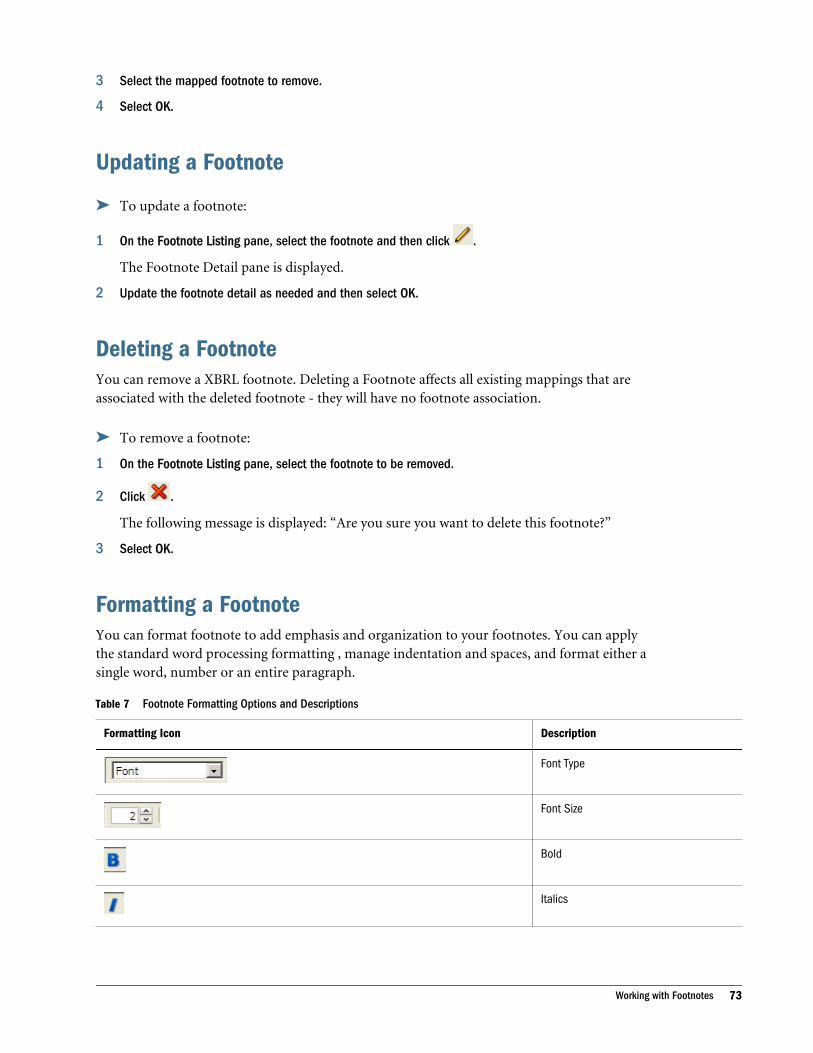
3 Select the mapped footnote to remove.
4 Select OK.
Updating a Footnote
ä To update a footnote:
1 On the Footnote Listing pane, select the footnote and then click .
The Footnote Detail pane is displayed.
2 Update the footnote detail as needed and then select OK.
Deleting a FootnoteYou can remove a XBRL footnote. Deleting a Footnote affects all existing mappings that areassociated with the deleted footnote - they will have no footnote association.
ä To remove a footnote:
1 On the Footnote Listing pane, select the footnote to be removed.
2 Click .
The following message is displayed: “Are you sure you want to delete this footnote?”
3 Select OK.
Formatting a FootnoteYou can format footnote to add emphasis and organization to your footnotes. You can applythe standard word processing formatting , manage indentation and spaces, and format either asingle word, number or an entire paragraph.
Table 7 Footnote Formatting Options and Descriptions
Formatting Icon Description
Font Type
Font Size
Bold
Italics
Working with Footnotes 73
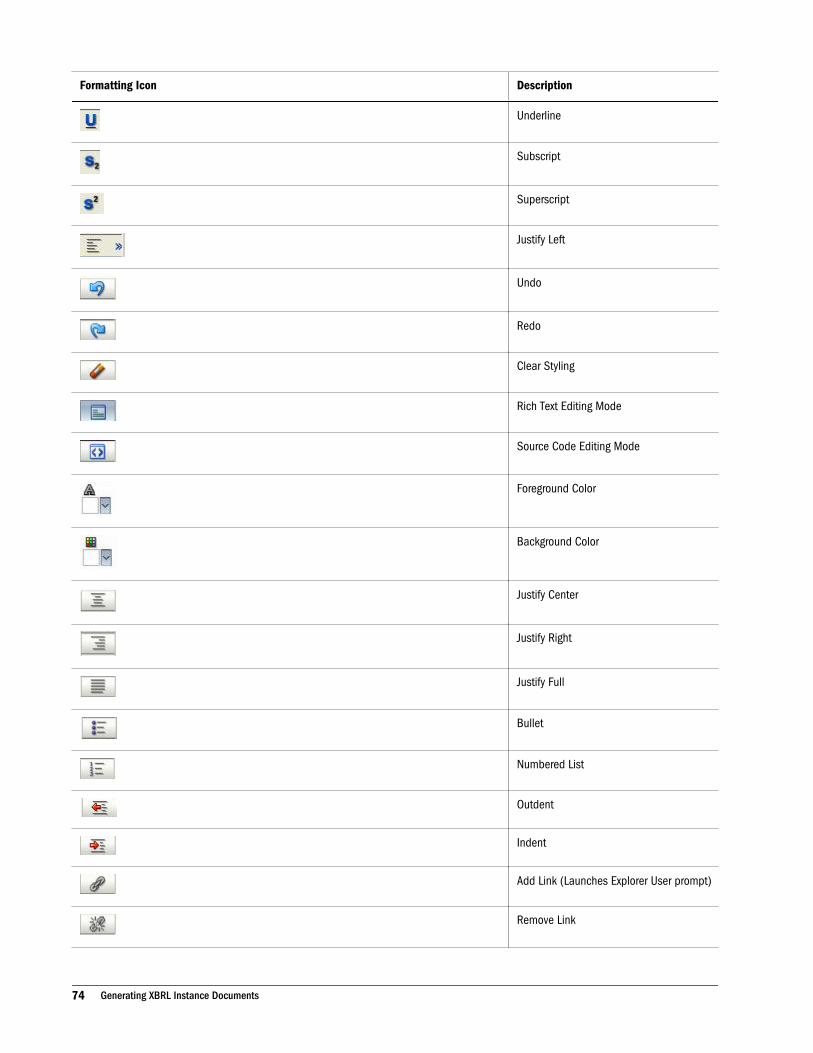
Formatting Icon Description
Underline
Subscript
Superscript
Justify Left
Undo
Redo
Clear Styling
Rich Text Editing Mode
Source Code Editing Mode
Foreground Color
Background Color
Justify Center
Justify Right
Justify Full
Bullet
Numbered List
Outdent
Indent
Add Link (Launches Explorer User prompt)
Remove Link
74 Generating XBRL Instance Documents

Reviewing FootnotesYou can change the display of columns on the Footnote Listing pane using the column andreorder columns options on the View menu.
ä To change the display of footnote columns:
1 On the Footnote tab, select View, and then Columns.
2 Select the footnote columns to display.
View options include:
l Show All
l Name
l Footnote
ä To reorder the display of footnotes:
1 On the Footnote tab, select View, and then Reorder Columns.
The Reorder Columns dialog box is displayed.
2 Select the columns to display on the Footnote Listing pane.
3 Use the arrow keys to change the display order columns.
4 Click OK.
Looking Up a FootnoteUse the Lookup feature to find a selected by name.
ä To look up a selected footnote:
1 In the Lookup field, enter the lookup by footnote name.
Working with Footnotes 75
2 Select to search footnote backward in the listing or to search footnote forward in the listing.
When the footnote is found, it is highlighted in the Footnote Listing pane.
Viewing Footnote DetailFootnote details are shown on the Footnote Details pane for a selected taxonomy footnote. Thisinformation reflects the footnote name and description.
Table 8 Footnote Detail Pane fields and descriptions
Field Description
Name Enter the name of the footnote. This value is not persisted to instance documents.
Footnote Enter the text of the footnote.
Working with DimensionsA XBRL dimension is a way of adding context to a measure value, and can be thought of as acategorization or segmentation of concepts. XBRL dimensions use categories as a way to describehow you arrived at a measured value by illustrating semantic relationships between facts andhow they have been segmented. For example, if a Revenue dimension contains a region conceptand a product line concept, you could reuse the region and product line concepts for otherconcepts including “net” or gross revenue”.
XBRL dimensions are not the same as dimensions in Oracle Hyperion data sources (such asOracle Essbase or Oracle Hyperion Financial Management, Fusion Edition). While someconceptual similarities exist, there is no systematic relationships between XBRL dimensions andOracle Hyperion data source dimensions. The two should not be confused.
The following are some basic concepts of XBRL dimensions with which you should be familiar:
l Hypercube—A construct designed to express a collection of dimensions.
l Primary Item—A primary item is a non-dimension concept within a taxonomy thatidentifies the hypercubes that can be associated with it. Not all concepts in a taxonomy areprimary items; however, concepts that are declared primary items must have one or morehypercube associations.
l Dimension—A dimension is a category by which information is analyzed.
l Domain and Domain Members—A domain is all of the domain members which are usedto express a dimension.
Using the Dimension ViewXBRL dimensions can be viewed in the Concepts tab. You display the dimension view for a activetaxonomy by way of the relationship view list (on the top right corner of the Concepts tab). Afteryou select the dimension view, the top panel shows all of the primary items which are defined
76 Generating XBRL Instance Documents
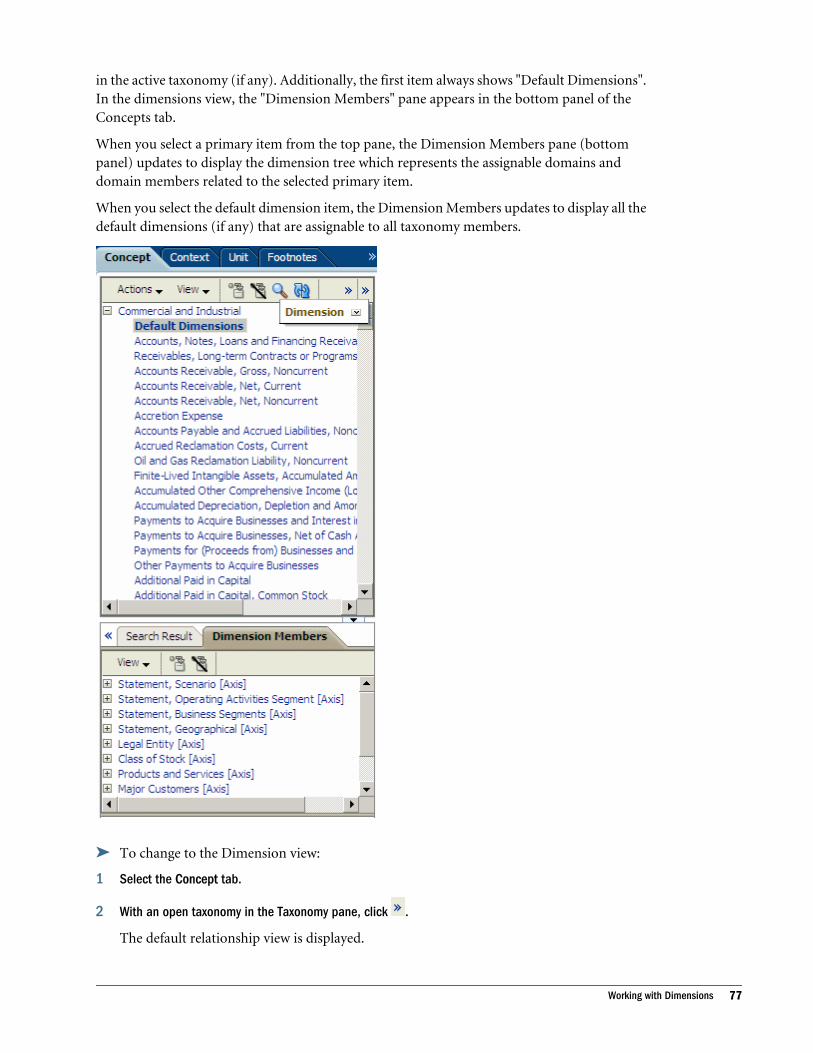
in the active taxonomy (if any). Additionally, the first item always shows "Default Dimensions".In the dimensions view, the "Dimension Members" pane appears in the bottom panel of theConcepts tab.
When you select a primary item from the top pane, the Dimension Members pane (bottompanel) updates to display the dimension tree which represents the assignable domains anddomain members related to the selected primary item.
When you select the default dimension item, the Dimension Members updates to display all thedefault dimensions (if any) that are assignable to all taxonomy members.
ä To change to the Dimension view:
1 Select the Concept tab.
2 With an open taxonomy in the Taxonomy pane, click .
The default relationship view is displayed.
Working with Dimensions 77

3 From the pull-down menu, select the Dimension view to use for viewing the taxonomy.
Mapping Primary ItemsOnce primary items are shown (in the Concepts tab), you map primary items in much the sameway that regular taxonomy concepts are mapped (from the presentation or calculation views).Note that primary items are also listed in the presentation and calculation views.
ä To map a primary item:
1 Select the primary item to map.
2 Navigate to the taxonomy concept in the Concepts tab and click .
Primary Items can also be mapped using drag & drop functionality in Word or Excel.
Mapping Domain and Domain MembersAfter you select a primary item and/or the "default dimensions" item from the top pane, youcan map domains and domain members from the dimension tree in the Dimension Memberspane. When mapping domain and domain member, note the following:
l Multiple domains and/or domain members can be mapped from different dimensions tothe same fact value. For example, users can map the domain members "Soda" and "NewYork" to the same fact value.
l Some taxonomies do not permit multiple mappings to the same fact value from the samedimension. For example, some taxonomies do not allow mapping the domains "East" and"West" from the "Regions" dimension to the same fact value.
l Hypercubes and dimensions are always abstract and cannot be mapped to Office documentdata.
ä To map a domain:
1 Select the domain or domain member to map.
2 Navigate to the taxonomy concept in the Concepts tab and click .
Validating a Dimension MappingTo create a dimension map, Disclosure Management requires that the domain/domain membercan be associated with a valid taxonomy concept. The XBRL specification for dimensions definesa binding relationship between a taxonomy concept and a domain member. The only exceptionis default dimension members; these can be associated with any taxonomy concept. Note thatnot all taxonomies define default dimensions.
The two prerequisites for creating a dimension map are:
78 Generating XBRL Instance Documents
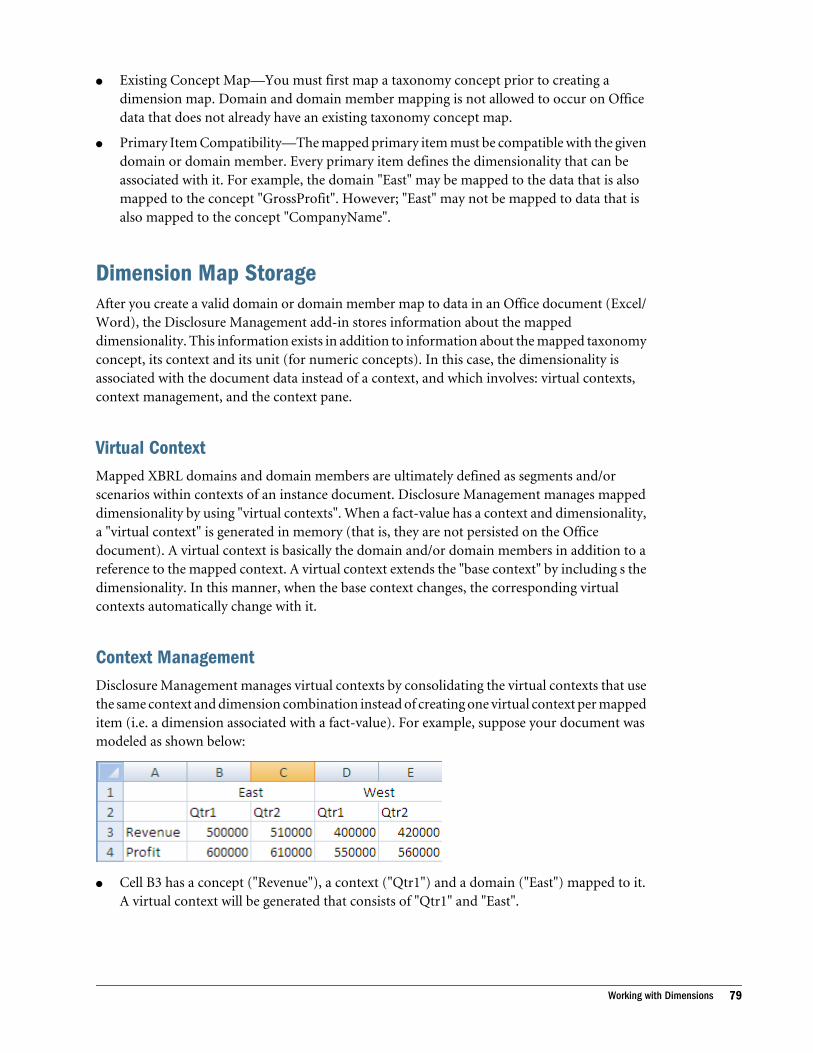
l Existing Concept Map—You must first map a taxonomy concept prior to creating adimension map. Domain and domain member mapping is not allowed to occur on Officedata that does not already have an existing taxonomy concept map.
l Primary Item Compatibility—The mapped primary item must be compatible with the givendomain or domain member. Every primary item defines the dimensionality that can beassociated with it. For example, the domain "East" may be mapped to the data that is alsomapped to the concept "GrossProfit". However; "East" may not be mapped to data that isalso mapped to the concept "CompanyName".
Dimension Map StorageAfter you create a valid domain or domain member map to data in an Office document (Excel/Word), the Disclosure Management add-in stores information about the mappeddimensionality. This information exists in addition to information about the mapped taxonomyconcept, its context and its unit (for numeric concepts). In this case, the dimensionality isassociated with the document data instead of a context, and which involves: virtual contexts,context management, and the context pane.
Virtual ContextMapped XBRL domains and domain members are ultimately defined as segments and/orscenarios within contexts of an instance document. Disclosure Management manages mappeddimensionality by using "virtual contexts". When a fact-value has a context and dimensionality,a "virtual context" is generated in memory (that is, they are not persisted on the Officedocument). A virtual context is basically the domain and/or domain members in addition to areference to the mapped context. A virtual context extends the "base context" by including s thedimensionality. In this manner, when the base context changes, the corresponding virtualcontexts automatically change with it.
Context ManagementDisclosure Management manages virtual contexts by consolidating the virtual contexts that usethe same context and dimension combination instead of creating one virtual context per mappeditem (i.e. a dimension associated with a fact-value). For example, suppose your document wasmodeled as shown below:
l Cell B3 has a concept ("Revenue"), a context ("Qtr1") and a domain ("East") mapped to it.A virtual context will be generated that consists of "Qtr1" and "East".
Working with Dimensions 79
l Cell B4 has a concept ("Profit"), a context ("Qtr1") and a domain ("East") mapped to it. Thiscell uses the same virtual context as is used by cell B3. Disclosure Management does notcreate a new virtual context for cell B4.
l The above example generates four virtual contexts ("Qtr1 - East", "Qtr2 - East", "Qtr1 - West"and "Qtr2 - West"). However, there are only two real contexts ("Qtr1" and "Qtr2").
l The Disclosure Management add-in stores the dimensional information much the same wayit stores mapped taxonomy concepts with the corresponding data (in the Office document).However, the virtual contexts are not persisted with the Office document.
Context PaneWhen a virtual context is created, the context pane is updated and shows the virtual contexts.All virtual contexts are "read-only". However, you can map virtual contexts the same way regularcontexts are mapped (i.e. via the map button or drag & drop). For version 1, users cannot renamethe auto-generated name for the virtual context that is shown in the Context panel. The nameconsists of the context name add the dimension name as shown in the dimension tree (example"Qtr1 - East").
Instance GenerationAfter the virtual contexts have been consolidated, they become actual contexts (for the instancedocuments only). The instance generation routine inserts XML comments above the contextdefinitions (within in the instance XML) documenting the context's user-friendly name. Thisallows users to identify the contexts within the instance XML if they choose to examine the XML.
Working with TuplesA XBRL tuple is a series of related concepts. It is similar to a taxonomy concept except that itrequires additional related concepts. A tuple member by itself may not provide enough relevantinformation; however a group of tuple members provide the information needed. For example,the tuple concept "company address" may consist of the following tuple members: "Name","Street", "City", "State", "Postal Code" and "Country". A single tuple member by itself (such as"City"), is not sufficient to describe the concept "company address". Only when all tuple membersare provided does the concept become meaningful. The Disclosure Management Mapping Toolprovides a "tuple view" under the Concepts tab that shows all existing tuples defined within ataxonomy.
In the instance document a tuple group is a term used to describe a collection of tuple membersthat are nested within a tuple node. Like XBRL contexts, units and footnotes, tuple groups arecreated and deleted by way of the Disclosure Management Mapping Tool. However, a majordistinction is that tuple groups are stored in the map repository. Note that tuple parents aretypically abstract (that is, cannot be mapped) and its child members (also known as tuplemembers) are non-abstract (that is, they can be mapped).
Not all taxonomies use tuples. Typically a taxonomy will use tuples or XBRL dimensions butnot both.
80 Generating XBRL Instance Documents
An embedded tuple is a parent tuple, which is defined inside another tuple. Embedded tuplesare similar to a tuple group (as defined above), except that they can only be created and deletedfrom within their corresponding tuple group. It is not possible to create a tuple group from anembedded parent tuple. Additionally, information about embedded tuple group parents is notstored in an Office document or the Mapping Manager.
Using the Tuple ViewThe XBRL tuples can be viewed in the Concepts tab. You display the dimension view for a activetaxonomy by way of the relationship view list (on the top right corner of the Concepts tab). Afteryou select the tuple view, the top panel shows all of the tuple nodes (if any).
When you select a tuple from the top pane, the Tuples Detail pane (bottom panel) updates todisplay tuple group member detail.
Additionally the bottom pane shows a Tuples Group pane, which enables you to map tuplemembers to Tuple groups.
Working with Tuples 81
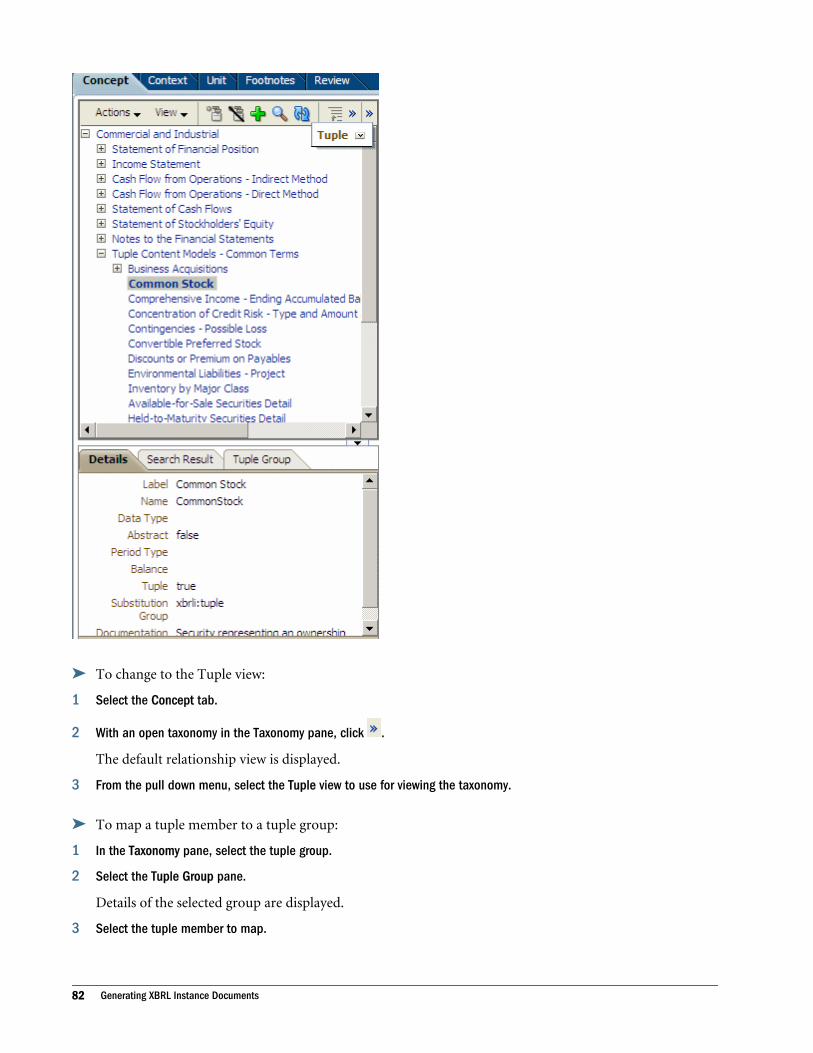
ä To change to the Tuple view:
1 Select the Concept tab.
2 With an open taxonomy in the Taxonomy pane, click .
The default relationship view is displayed.
3 From the pull down menu, select the Tuple view to use for viewing the taxonomy.
ä To map a tuple member to a tuple group:
1 In the Taxonomy pane, select the tuple group.
2 Select the Tuple Group pane.
Details of the selected group are displayed.
3 Select the tuple member to map.
82 Generating XBRL Instance Documents
4 Select .
Tuple members can be mapped using drag & drop functionality in Word or Excel.
Removing Mapped Data and Deleting XBRL ObjectsDisclosure Management makes an important distinction between removing a XBRL mapassociation and deleting a XBRL object:
l Remove Map—Refers to removing or dissociating one or more mapped XBRL elementsfrom data in an Office document, Financial Reporting grid or data source member. Forexample, you disassociate a unit map from a numeric value table cell; however the unitdefinition itself remains.
l XBRL object deletion—Refers to deleting a defined XBRL object such as a context, unit, orfootnote. For example, users can delete a defined XBRL unit from the list of units. When aXBRL object is deleted, not only is the XBRL object removed, but any XBRL mappingsassociated with the deleted object are also removed.
Note: Taxonomy concepts cannot be deleted since they are defined in taxonomies (i.e. not bythe taxonomy designer rather than an Office user).
Remove XBRL MapXBRL map removals of taxonomy concepts, contexts, units and footnotes can be applied to:
l a single data point
l multiple data points (an Office document which spans over two or more mapped datapoints)
l data source (taxonomy concepts only)
l dimensions (which could be document and/or data source level mapping associations)
l tuples
When you remove a mapped item, the Disassociate Mappings dialog box is launched. TheDisassociate dialog box lists all mapped items that can be dissociated. The number of items listedin the dialog depends on the XBRL object that is selected in the Disclosure Management MappingTool. For example when a unit object is selected, the dialog will enumerate all the documentdata points that are currently mapped to the unit object. Once a mapping is removed, it cannotbe undone and you are required to remap the data to the XBRL object to recreate the map. Fortaxonomy concepts, the mapping information is removed from the Mapping Repository anddoes not appear in the Mapping Manager or in Review mode. If the mapped concept hasassociated XBRL dimensions (these dimensions could be document and/or data source levelassociations), they are also removed from the Mapping Repository.
Removing a data source mapping is different than removing an Office document mapping.When you work with a Smart View Office document or a Financial Reporting report, you can
Removing Mapped Data and Deleting XBRL Objects 83
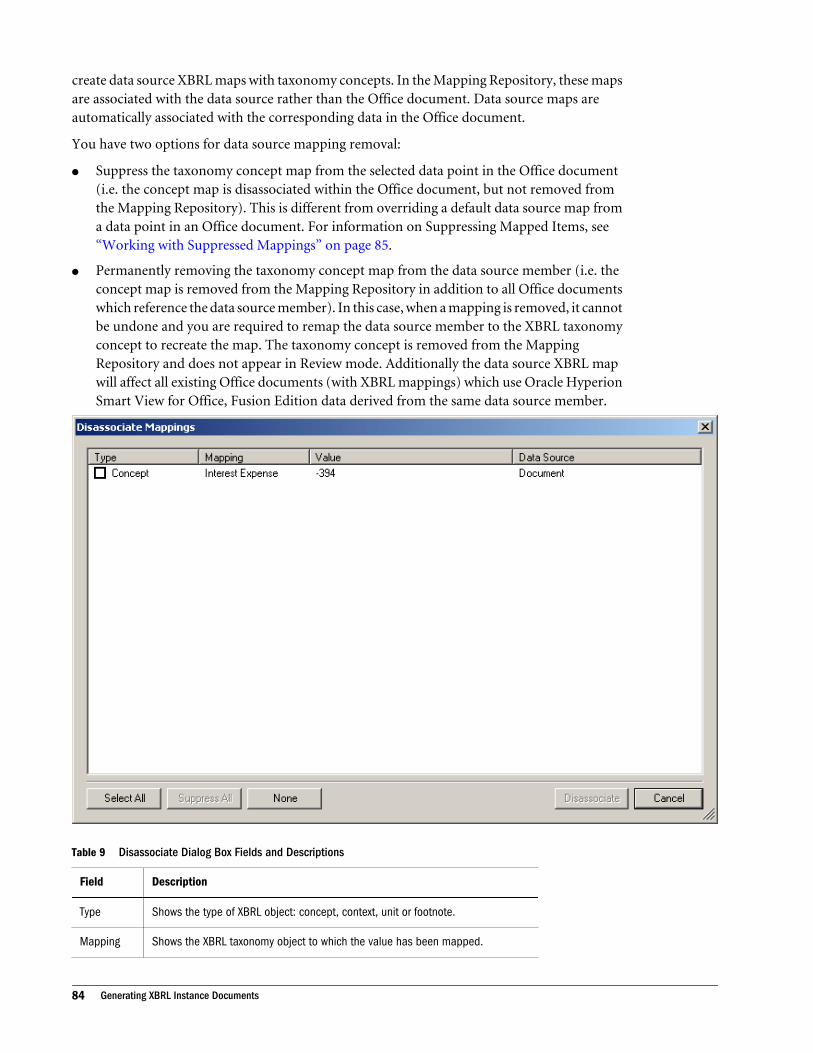
create data source XBRL maps with taxonomy concepts. In the Mapping Repository, these mapsare associated with the data source rather than the Office document. Data source maps areautomatically associated with the corresponding data in the Office document.
You have two options for data source mapping removal:
l Suppress the taxonomy concept map from the selected data point in the Office document(i.e. the concept map is disassociated within the Office document, but not removed fromthe Mapping Repository). This is different from overriding a default data source map froma data point in an Office document. For information on Suppressing Mapped Items, see“Working with Suppressed Mappings” on page 85.
l Permanently removing the taxonomy concept map from the data source member (i.e. theconcept map is removed from the Mapping Repository in addition to all Office documentswhich reference the data source member). In this case, when a mapping is removed, it cannotbe undone and you are required to remap the data source member to the XBRL taxonomyconcept to recreate the map. The taxonomy concept is removed from the MappingRepository and does not appear in Review mode. Additionally the data source XBRL mapwill affect all existing Office documents (with XBRL mappings) which use Oracle HyperionSmart View for Office, Fusion Edition data derived from the same data source member.
Table 9 Disassociate Dialog Box Fields and Descriptions
Field Description
Type Shows the type of XBRL object: concept, context, unit or footnote.
Mapping Shows the XBRL taxonomy object to which the value has been mapped.
84 Generating XBRL Instance Documents
Field Description
Value Shows the report or data source value associated with the map.
Data Source Shows if the value is a report/document level mapping or a data source mapping.
XBRL Object DeletionsA XBRL object deletion refers to deleting a defined XBRL object such as a context, unit, orfootnote. For example, users can delete a defined XBRL unit object from the list of units. In thiscase not only is the XBRL object removed, any XBRL mappings within the Office documentwhich are associated with the deleted object are also removed. Note that taxonomy conceptscannot be deleted by way of the Disclosure Management Mapping Tool since they are definedin taxonomies (i.e. by the taxonomy designer, rather than an Office user). Before a XBRL objectis deleted, you are prompted with the message: “Are you sure you want to delete this [name ofobject]?” Once you delete a XBRL object, you cannot undo the action; you need to redefine theobject and recreate the maps.
Working with Suppressed MappingsWhen working with a Smart View Office document, you can create data source XBRL maps withtaxonomy concepts. In the Mapping Repository, these mappings are associated with the datasource rather than the Office document. Data source maps are automatically associated with thecorresponding data in the Office document. If you need to remove a data source map, twooptions are available:
l Delete the taxonomy concept map association with the data source (i.e. the concept map isdeleted from the Mapping repository in addition to all Office documents using the samedata source member).
l Suppress the taxonomy concept map from the selected data point in the Office document(i.e. the concept map is disassociated with the Office document, but not removed from theMapping repository). This is different from overriding a default data source map from adata point in an Office document. Additionally, you can re-enable suppressed data sourcemaps by selecting the Suppressed Mappings option on the Disclosure Management ribbon.
ä To suppress a concept map:
1 Select a single data source dimension or member from a Smart View Office document, which has aXBRL taxonomy concept associated with it.
2 Select .
The Disassociate dialog box is displayed.
Working with Suppressed Mappings 85
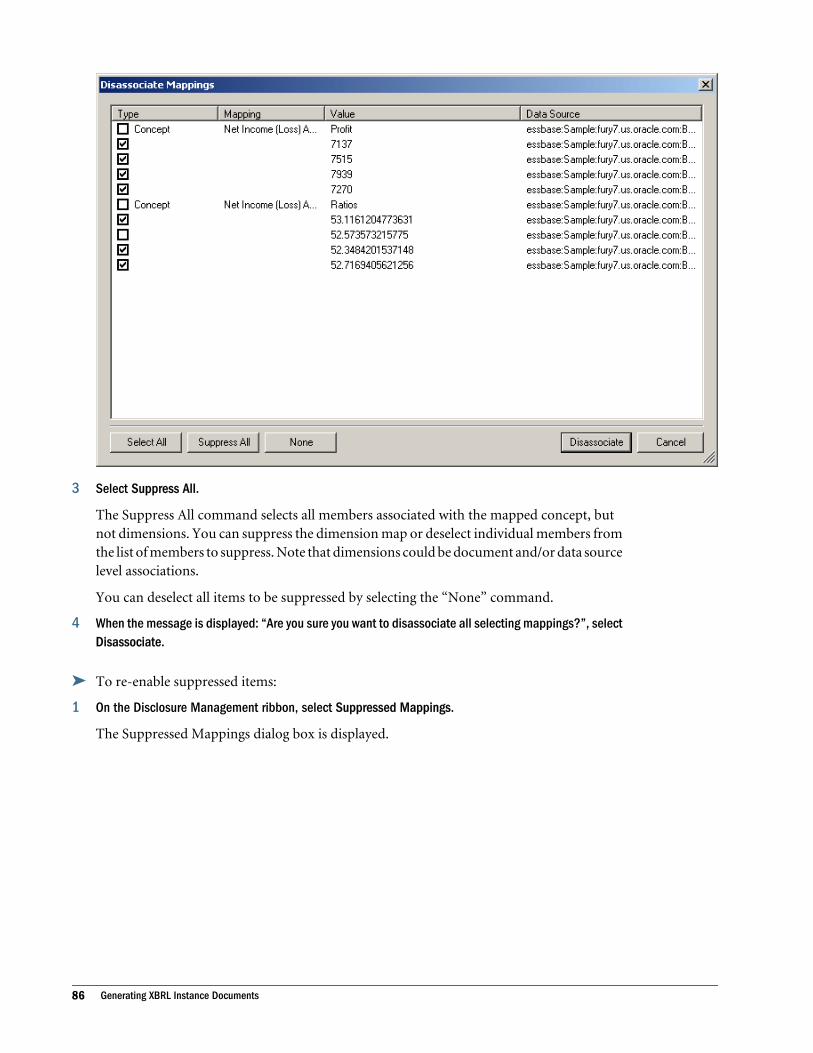
3 Select Suppress All.
The Suppress All command selects all members associated with the mapped concept, butnot dimensions. You can suppress the dimension map or deselect individual members fromthe list of members to suppress. Note that dimensions could be document and/or data sourcelevel associations.
You can deselect all items to be suppressed by selecting the “None” command.
4 When the message is displayed: “Are you sure you want to disassociate all selecting mappings?”, selectDisassociate.
ä To re-enable suppressed items:
1 On the Disclosure Management ribbon, select Suppressed Mappings.
The Suppressed Mappings dialog box is displayed.
86 Generating XBRL Instance Documents
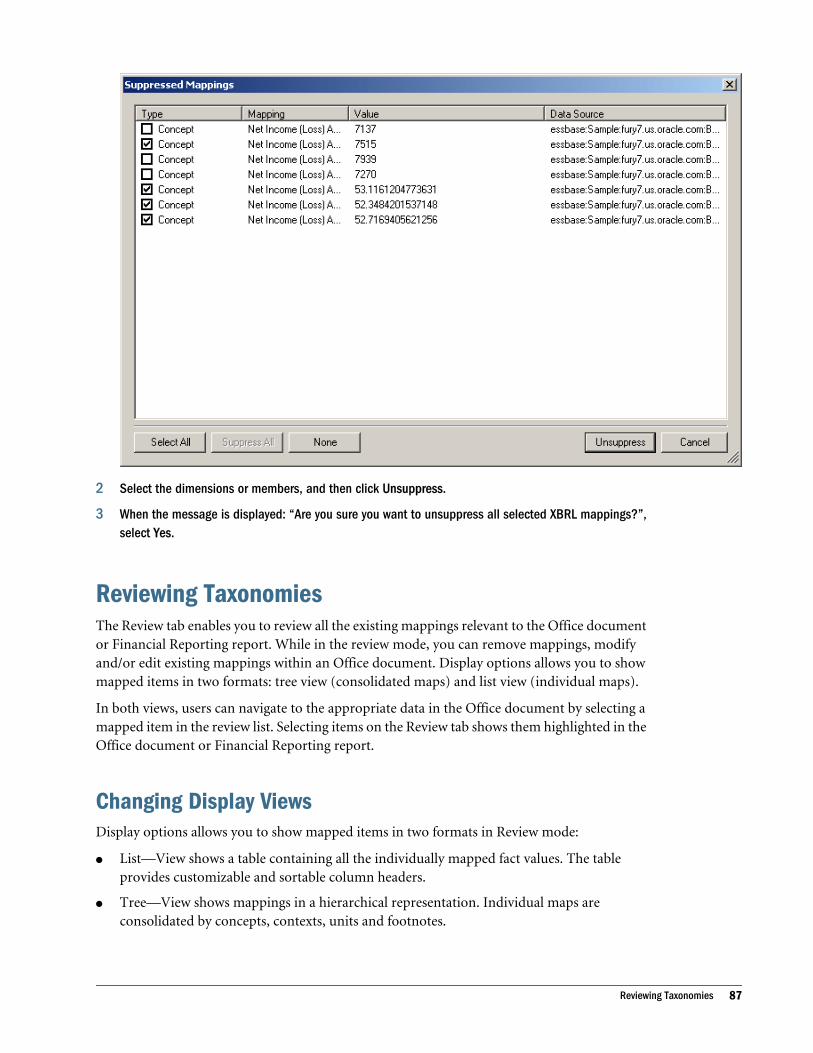
2 Select the dimensions or members, and then click Unsuppress.
3 When the message is displayed: “Are you sure you want to unsuppress all selected XBRL mappings?”,select Yes.
Reviewing TaxonomiesThe Review tab enables you to review all the existing mappings relevant to the Office documentor Financial Reporting report. While in the review mode, you can remove mappings, modifyand/or edit existing mappings within an Office document. Display options allows you to showmapped items in two formats: tree view (consolidated maps) and list view (individual maps).
In both views, users can navigate to the appropriate data in the Office document by selecting amapped item in the review list. Selecting items on the Review tab shows them highlighted in theOffice document or Financial Reporting report.
Changing Display ViewsDisplay options allows you to show mapped items in two formats in Review mode:
l List—View shows a table containing all the individually mapped fact values. The tableprovides customizable and sortable column headers.
l Tree—View shows mappings in a hierarchical representation. Individual maps areconsolidated by concepts, contexts, units and footnotes.
Reviewing Taxonomies 87
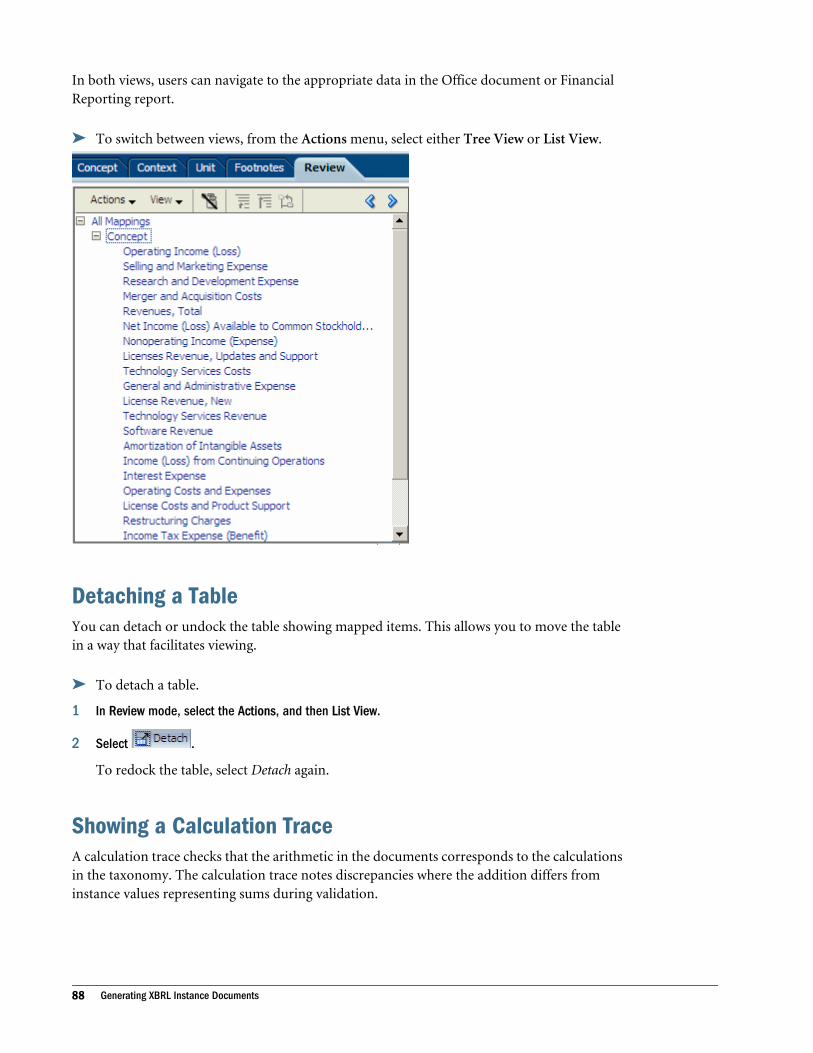
In both views, users can navigate to the appropriate data in the Office document or FinancialReporting report.
ä To switch between views, from the Actions menu, select either Tree View or List View.
Detaching a TableYou can detach or undock the table showing mapped items. This allows you to move the tablein a way that facilitates viewing.
ä To detach a table.
1 In Review mode, select the Actions, and then List View.
2 Select .
To redock the table, select Detach again.
Showing a Calculation TraceA calculation trace checks that the arithmetic in the documents corresponds to the calculationsin the taxonomy. The calculation trace notes discrepancies where the addition differs frominstance values representing sums during validation.
88 Generating XBRL Instance Documents
ä To show a calculation trace:
1 Select the Review tab.
2 From the Actions menu, select Show Calculation Trace.
Showing a Formula Trace A formula trace checks that the formulas of a XBRL document corresponds to the formulas inthe taxonomy. Formulas include business rules expressed semantically. For example a formulamight include the definition for "Assets = Liabilities + Equity". The formula trace records thefailure of a formula during validation.
ä To show a formula trace:
1 Select the Review tab.
2 From the Actions menu, select Show Formula Trace.
Changing Decimal/Precision Values in Review ModeXBRL provides the ability to specify decimals or precision settings for each numeric data that ispersisted to an instance document in Review mode in List view. This is an important settingsince numeric data can be validated for accuracy based on these settings, particularly whentruncation or rounding needs to be performed for a mapped item.
Every numeric value in an instance document needs to have either a decimal or a precisionsetting. A single mapped value must have either a decimal or precision attribute assigned to it,but not both (with the exception of "fractionItemType" items) on the same fact element.Disclosure Management provides users a way to define these settings on a per number basis forWord and Excel documents using the Decimal/Precision feature. The precision attributeindicates how many digits in the numeric value are accurate. The decimals attribute states thenumber of decimal place to which a numeric value is considered correct, which may result whennumbers are rounded or dropped after the decimal point.
When a user maps a unit to data in an Office document, Disclosure Management automaticallyapplies the default decimal/precision setting derived from the decimal/precision preferenceselected on the XBRL tab of the Oracle Hyperion Disclosure Management Options dialog box.If a decimal/precision setting change is needed for an individual mapping, the user can modifythe decimal/precision in Review mode in List View. Non-modified mappings continue to usethe default precision/decimal setting from the preference set on the XBRL tab of the OracleHyperion Disclosure Management Options dialog box.
When instance documents are generated or validated, fact values (i.e. mappings) with a unitassignment that do not have an explicit decimal/precision setting (as set in the Review Mode),automatically receive the default precision/decimal setting from the user's preference on theXBRL tab of the Oracle Hyperion Disclosure Management Options dialog box.
If there is no unit assignment associated with the fact value, Disclosure Management assumesthat it is a non-numeric item which does not receive a precision/decimal attribute.
Reviewing Taxonomies 89
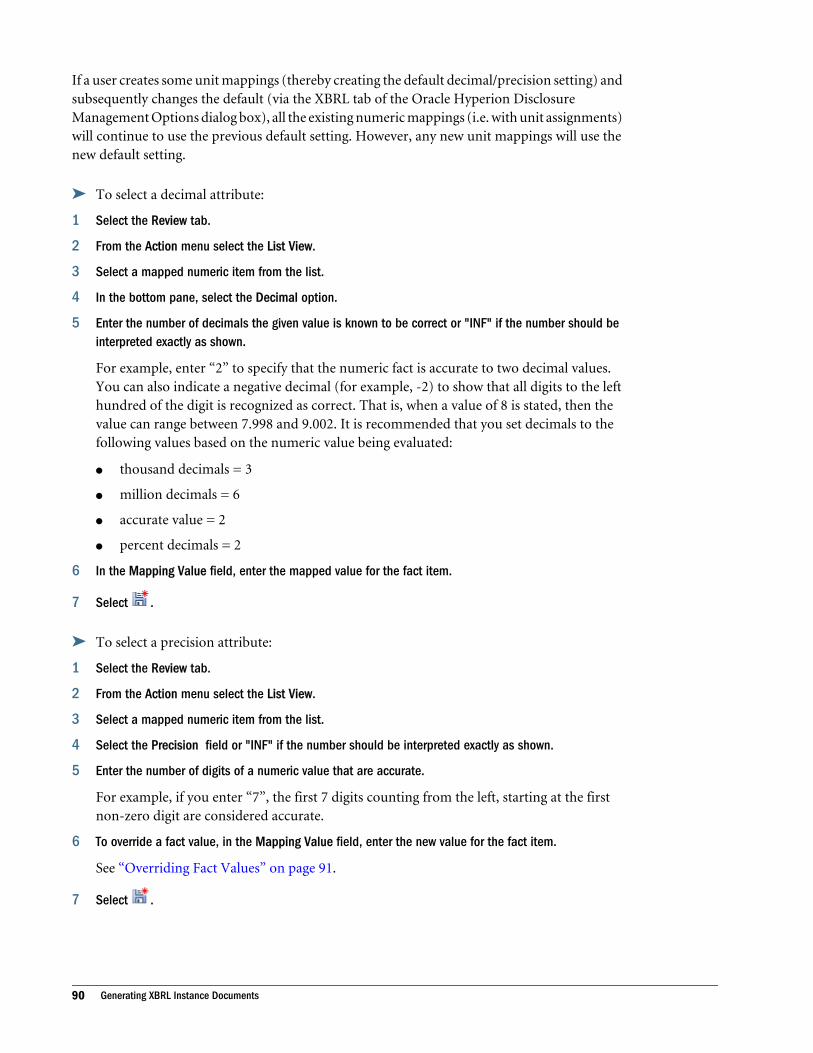
If a user creates some unit mappings (thereby creating the default decimal/precision setting) andsubsequently changes the default (via the XBRL tab of the Oracle Hyperion DisclosureManagement Options dialog box), all the existing numeric mappings (i.e. with unit assignments)will continue to use the previous default setting. However, any new unit mappings will use thenew default setting.
ä To select a decimal attribute:
1 Select the Review tab.
2 From the Action menu select the List View.
3 Select a mapped numeric item from the list.
4 In the bottom pane, select the Decimal option.
5 Enter the number of decimals the given value is known to be correct or "INF" if the number should beinterpreted exactly as shown.
For example, enter “2” to specify that the numeric fact is accurate to two decimal values.You can also indicate a negative decimal (for example, -2) to show that all digits to the lefthundred of the digit is recognized as correct. That is, when a value of 8 is stated, then thevalue can range between 7.998 and 9.002. It is recommended that you set decimals to thefollowing values based on the numeric value being evaluated:
l thousand decimals = 3
l million decimals = 6
l accurate value = 2
l percent decimals = 2
6 In the Mapping Value field, enter the mapped value for the fact item.
7 Select .
ä To select a precision attribute:
1 Select the Review tab.
2 From the Action menu select the List View.
3 Select a mapped numeric item from the list.
4 Select the Precision field or "INF" if the number should be interpreted exactly as shown.
5 Enter the number of digits of a numeric value that are accurate.
For example, if you enter “7”, the first 7 digits counting from the left, starting at the firstnon-zero digit are considered accurate.
6 To override a fact value, in the Mapping Value field, enter the new value for the fact item.
See “Overriding Fact Values” on page 91.
7 Select .
90 Generating XBRL Instance Documents
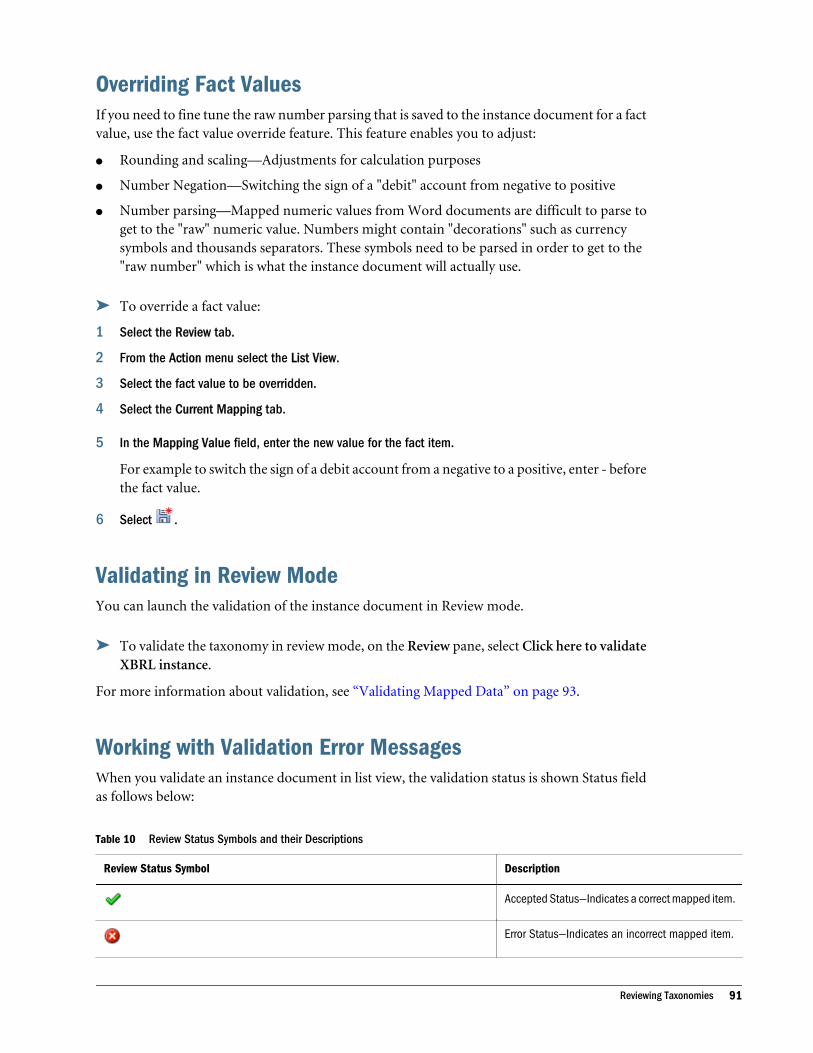
Overriding Fact ValuesIf you need to fine tune the raw number parsing that is saved to the instance document for a factvalue, use the fact value override feature. This feature enables you to adjust:
l Rounding and scaling—Adjustments for calculation purposes
l Number Negation—Switching the sign of a "debit" account from negative to positive
l Number parsing—Mapped numeric values from Word documents are difficult to parse toget to the "raw" numeric value. Numbers might contain "decorations" such as currencysymbols and thousands separators. These symbols need to be parsed in order to get to the"raw number" which is what the instance document will actually use.
ä To override a fact value:
1 Select the Review tab.
2 From the Action menu select the List View.
3 Select the fact value to be overridden.
4 Select the Current Mapping tab.
5 In the Mapping Value field, enter the new value for the fact item.
For example to switch the sign of a debit account from a negative to a positive, enter - beforethe fact value.
6 Select .
Validating in Review ModeYou can launch the validation of the instance document in Review mode.
ä To validate the taxonomy in review mode, on the Review pane, select Click here to validateXBRL instance.
For more information about validation, see “Validating Mapped Data” on page 93.
Working with Validation Error MessagesWhen you validate an instance document in list view, the validation status is shown Status fieldas follows below:
Table 10 Review Status Symbols and their Descriptions
Review Status Symbol Description
Accepted Status—Indicates a correct mapped item.
Error Status—Indicates an incorrect mapped item.
Reviewing Taxonomies 91
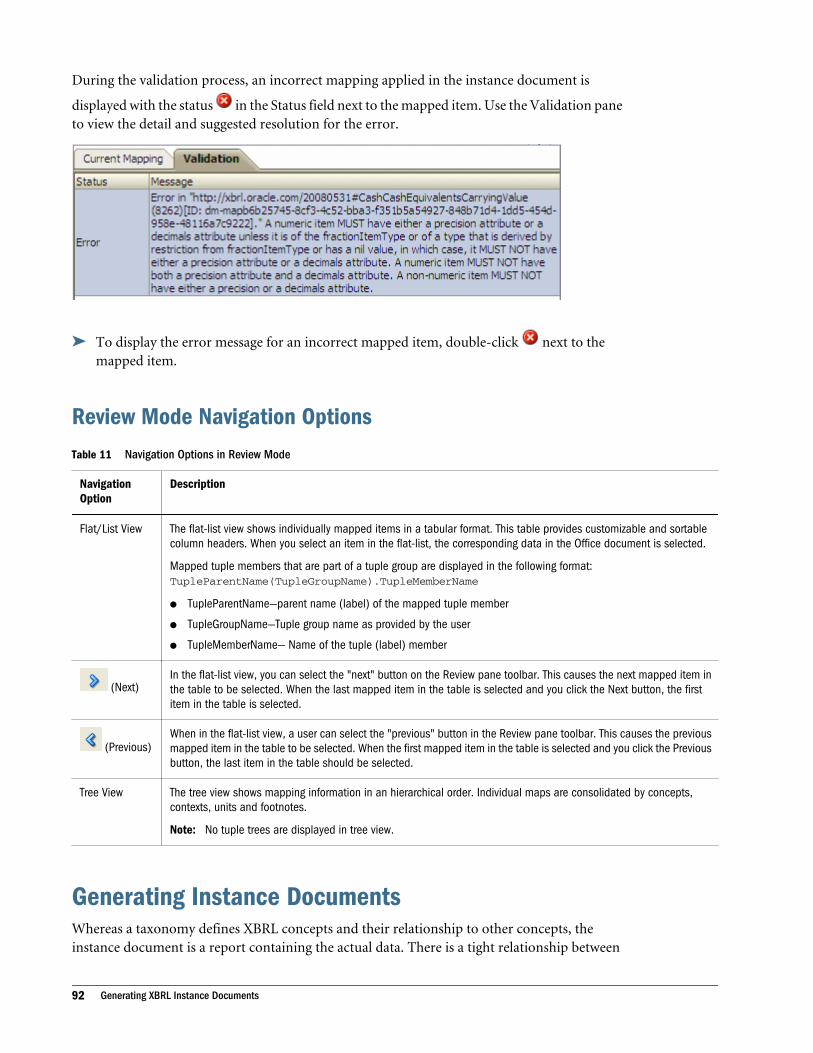
During the validation process, an incorrect mapping applied in the instance document is
displayed with the status in the Status field next to the mapped item. Use the Validation paneto view the detail and suggested resolution for the error.
ä To display the error message for an incorrect mapped item, double-click next to themapped item.
Review Mode Navigation OptionsTable 11 Navigation Options in Review Mode
NavigationOption
Description
Flat/List View The flat-list view shows individually mapped items in a tabular format. This table provides customizable and sortablecolumn headers. When you select an item in the flat-list, the corresponding data in the Office document is selected.
Mapped tuple members that are part of a tuple group are displayed in the following format:TupleParentName(TupleGroupName).TupleMemberName
l TupleParentName—parent name (label) of the mapped tuple member
l TupleGroupName—Tuple group name as provided by the user
l TupleMemberName— Name of the tuple (label) member
(Next)In the flat-list view, you can select the "next" button on the Review pane toolbar. This causes the next mapped item inthe table to be selected. When the last mapped item in the table is selected and you click the Next button, the firstitem in the table is selected.
(Previous)When in the flat-list view, a user can select the "previous" button in the Review pane toolbar. This causes the previousmapped item in the table to be selected. When the first mapped item in the table is selected and you click the Previousbutton, the last item in the table should be selected.
Tree View The tree view shows mapping information in an hierarchical order. Individual maps are consolidated by concepts,contexts, units and footnotes.
Note: No tuple trees are displayed in tree view.
Generating Instance DocumentsWhereas a taxonomy defines XBRL concepts and their relationship to other concepts, theinstance document is a report containing the actual data. There is a tight relationship between
92 Generating XBRL Instance Documents
taxonomies and instance documents. Once a taxonomy has been created, it is possible to use itsdefinitions and their relationships to produce a XBRL report. In addition to taxonomyreferences, instance documents also contain the following information:
l XBRL Context—Provides information about the reporting (business) entity, a time-frameand other optional details such as scenarios and dimensions.
l XBRL Unit—Describes what the numeric data represents. Examples of a unit are "USDollars", "Euros" and "shares".
l Data—Instance documents contain numeric and/or textual data that reside within aMicrosoft Office document, Financial Reporting grid and/or an Oracle Hyperion datasource. The generic "document data" term can mean a single cell in Excel, a single word orentire paragraph in Word or a cell in a Financial Reporting grid. This term is used throughoutto mean data that is or can be mapped by the Disclosure Management Mapping Tool.Additionally, numeric data can be scaled and have references to footnotes.
The actual instance document is approximately equivalent to an HTML web page, but insteadof the report language being HyperText Markup Language (HTML) that can be read by abrowser, the language is XML that can be read by a variety of XBRL applications that consumeand analyze instance documents.
The XBRL filing consists of the XBRL taxonomy and the instance document. The XBRLtaxonomy explains the metadata behind a company's disclosure and the instance documentshows how facts are mapped to the taxonomy. Validation verifies semantic relationships betweenconcepts. That is, validation confirms that the correct facts have been mapped to the correct factfield in the base taxonomy. For example, validation verifies that the facts filed for ”Assets” equalsthe facts filed for “Liabilities” and the “Owner's equities”. XBRL instance document generationis the last step of generating the XBRL-compliant disclosures. To ensure the accuracy of theXBRL data that will be submitted in a filing, Disclosure Management validates your taxonomyagainst XBRL taxonomy specifications before creating the instance document.
The validation process is a three step process. First you validate the taxonomy, which initiatesthe validation process. The next step is the generation of the instance document, which createsan XML file associated with the instance document. XBRL is an XML-based framework andrelies on XML syntax to declare semantic meaning such as XLink and XML Schema. The laststep is the creation of the actual instance document, which can be exchanged with other businessentities or filed with a regulatory agency.
Validating Mapped DataDisclosure Management supports three types of instance validation in the validation process:
l Presentation—Validates the instance document for conformance to the XBRLspecifications. For example, if a mapped concept is of Duration period type and instancedocument contains a single date in the corresponding Context, the presentation validationshould fail as Duration period type requires both Start and End dates to be defined.
l Calculation—Validates all computed values in the instance document per the calculationrelationships defined within the taxonomy. It uses the calculation relationship defined incalculation schema while taking care of the Weight attribute for numeric facts.
Generating Instance Documents 93
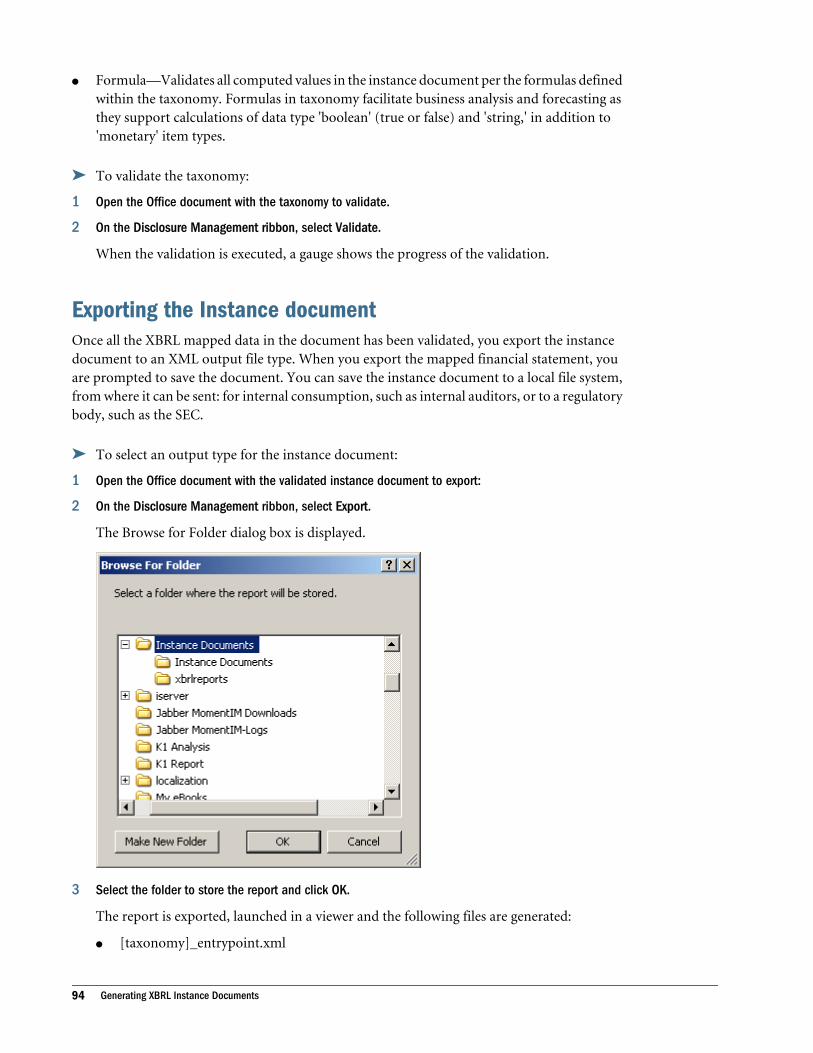
l Formula—Validates all computed values in the instance document per the formulas definedwithin the taxonomy. Formulas in taxonomy facilitate business analysis and forecasting asthey support calculations of data type 'boolean' (true or false) and 'string,' in addition to'monetary' item types.
ä To validate the taxonomy:
1 Open the Office document with the taxonomy to validate.
2 On the Disclosure Management ribbon, select Validate.
When the validation is executed, a gauge shows the progress of the validation.
Exporting the Instance documentOnce all the XBRL mapped data in the document has been validated, you export the instancedocument to an XML output file type. When you export the mapped financial statement, youare prompted to save the document. You can save the instance document to a local file system,from where it can be sent: for internal consumption, such as internal auditors, or to a regulatorybody, such as the SEC.
ä To select an output type for the instance document:
1 Open the Office document with the validated instance document to export:
2 On the Disclosure Management ribbon, select Export.
The Browse for Folder dialog box is displayed.
3 Select the folder to store the report and click OK.
The report is exported, launched in a viewer and the following files are generated:
l [taxonomy]_entrypoint.xml
94 Generating XBRL Instance Documents
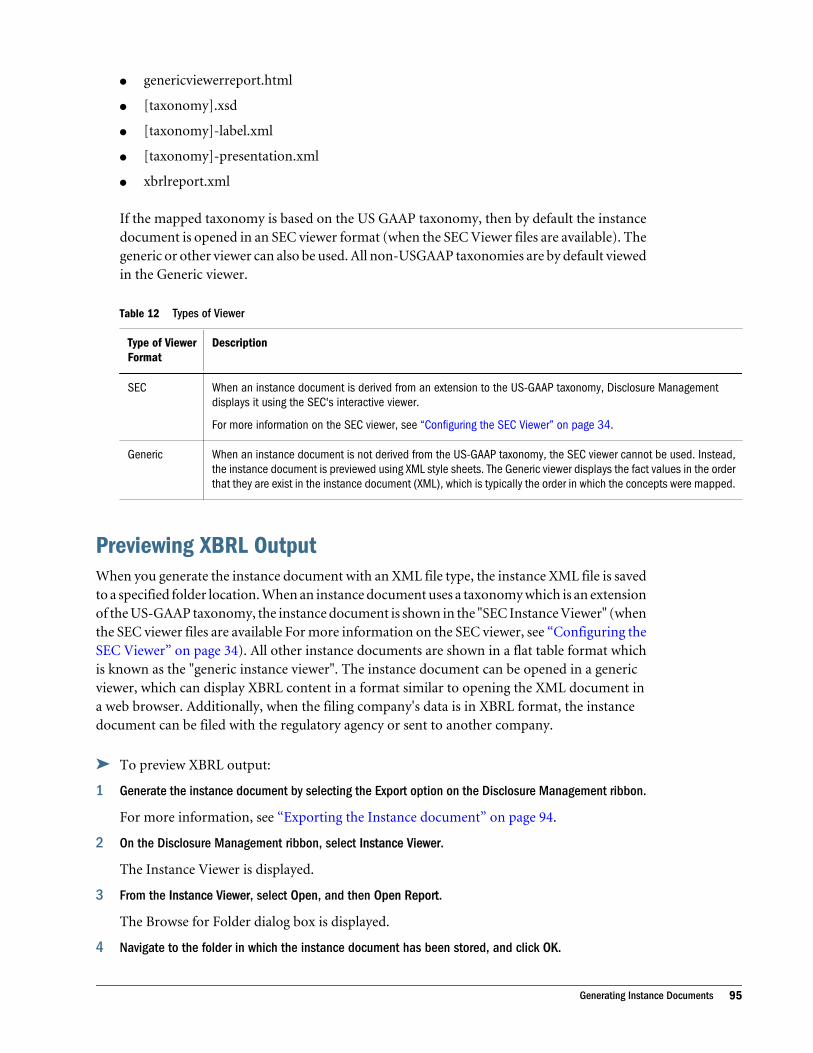
l genericviewerreport.html
l [taxonomy].xsd
l [taxonomy]-label.xml
l [taxonomy]-presentation.xml
l xbrlreport.xml
If the mapped taxonomy is based on the US GAAP taxonomy, then by default the instancedocument is opened in an SEC viewer format (when the SEC Viewer files are available). Thegeneric or other viewer can also be used. All non-USGAAP taxonomies are by default viewedin the Generic viewer.
Table 12 Types of Viewer
Type of ViewerFormat
Description
SEC When an instance document is derived from an extension to the US-GAAP taxonomy, Disclosure Managementdisplays it using the SEC's interactive viewer.
For more information on the SEC viewer, see “Configuring the SEC Viewer” on page 34.
Generic When an instance document is not derived from the US-GAAP taxonomy, the SEC viewer cannot be used. Instead,the instance document is previewed using XML style sheets. The Generic viewer displays the fact values in the orderthat they are exist in the instance document (XML), which is typically the order in which the concepts were mapped.
Previewing XBRL OutputWhen you generate the instance document with an XML file type, the instance XML file is savedto a specified folder location. When an instance document uses a taxonomy which is an extensionof the US-GAAP taxonomy, the instance document is shown in the "SEC Instance Viewer" (whenthe SEC viewer files are available For more information on the SEC viewer, see “Configuring theSEC Viewer” on page 34). All other instance documents are shown in a flat table format whichis known as the "generic instance viewer". The instance document can be opened in a genericviewer, which can display XBRL content in a format similar to opening the XML document ina web browser. Additionally, when the filing company's data is in XBRL format, the instancedocument can be filed with the regulatory agency or sent to another company.
ä To preview XBRL output:
1 Generate the instance document by selecting the Export option on the Disclosure Management ribbon.
For more information, see “Exporting the Instance document” on page 94.
2 On the Disclosure Management ribbon, select Instance Viewer.
The Instance Viewer is displayed.
3 From the Instance Viewer, select Open, and then Open Report.
The Browse for Folder dialog box is displayed.
4 Navigate to the folder in which the instance document has been stored, and click OK.
Generating Instance Documents 95
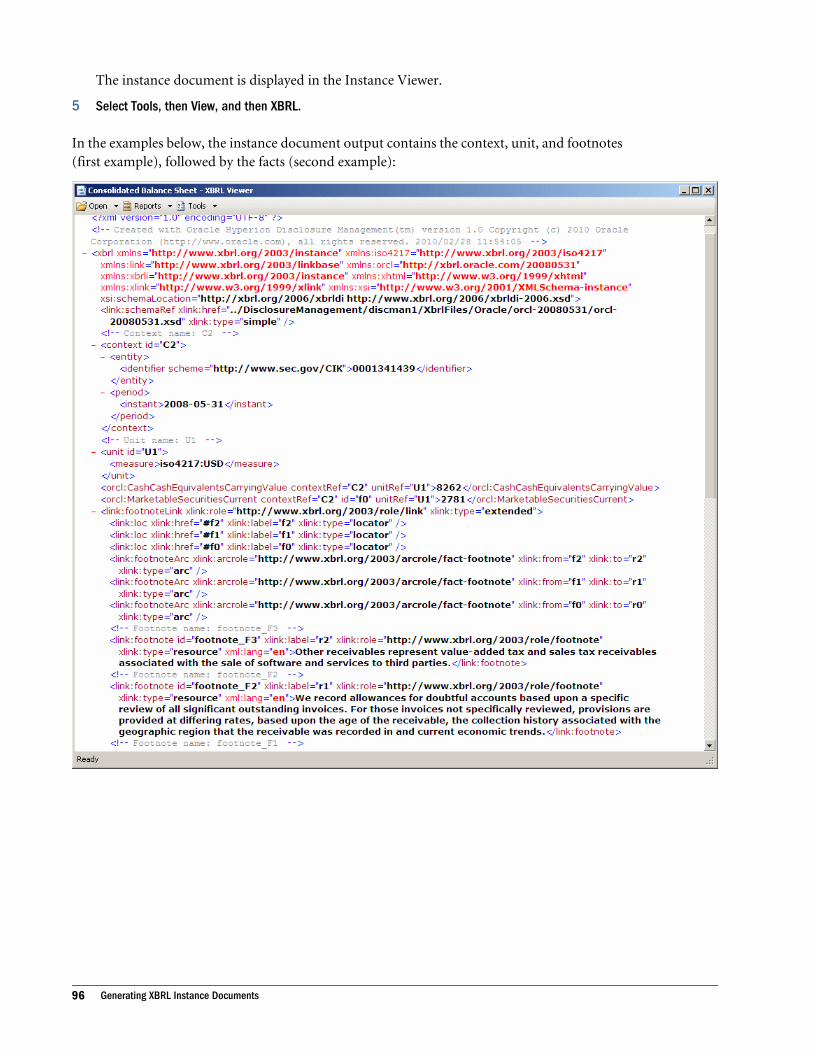
The instance document is displayed in the Instance Viewer.
5 Select Tools, then View, and then XBRL.
In the examples below, the instance document output contains the context, unit, and footnotes(first example), followed by the facts (second example):
96 Generating XBRL Instance Documents
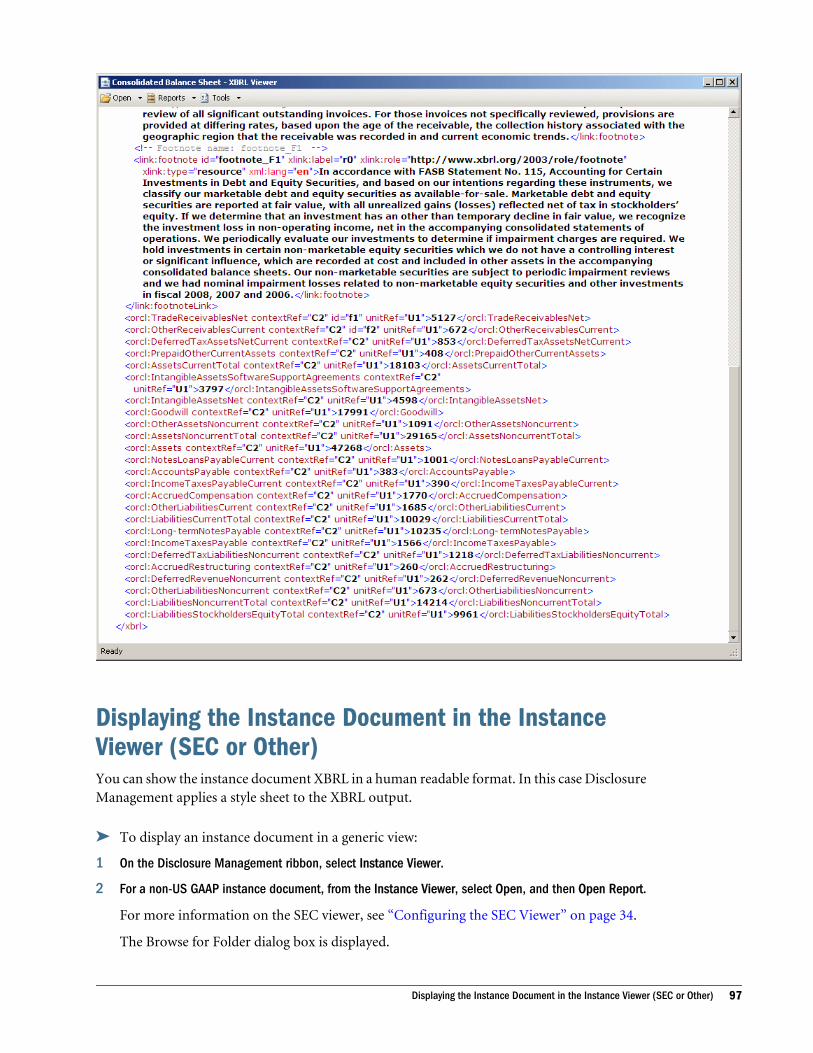
Displaying the Instance Document in the InstanceViewer (SEC or Other) You can show the instance document XBRL in a human readable format. In this case DisclosureManagement applies a style sheet to the XBRL output.
ä To display an instance document in a generic view:
1 On the Disclosure Management ribbon, select Instance Viewer.
2 For a non-US GAAP instance document, from the Instance Viewer, select Open, and then Open Report.
For more information on the SEC viewer, see “Configuring the SEC Viewer” on page 34.
The Browse for Folder dialog box is displayed.
Displaying the Instance Document in the Instance Viewer (SEC or Other) 97
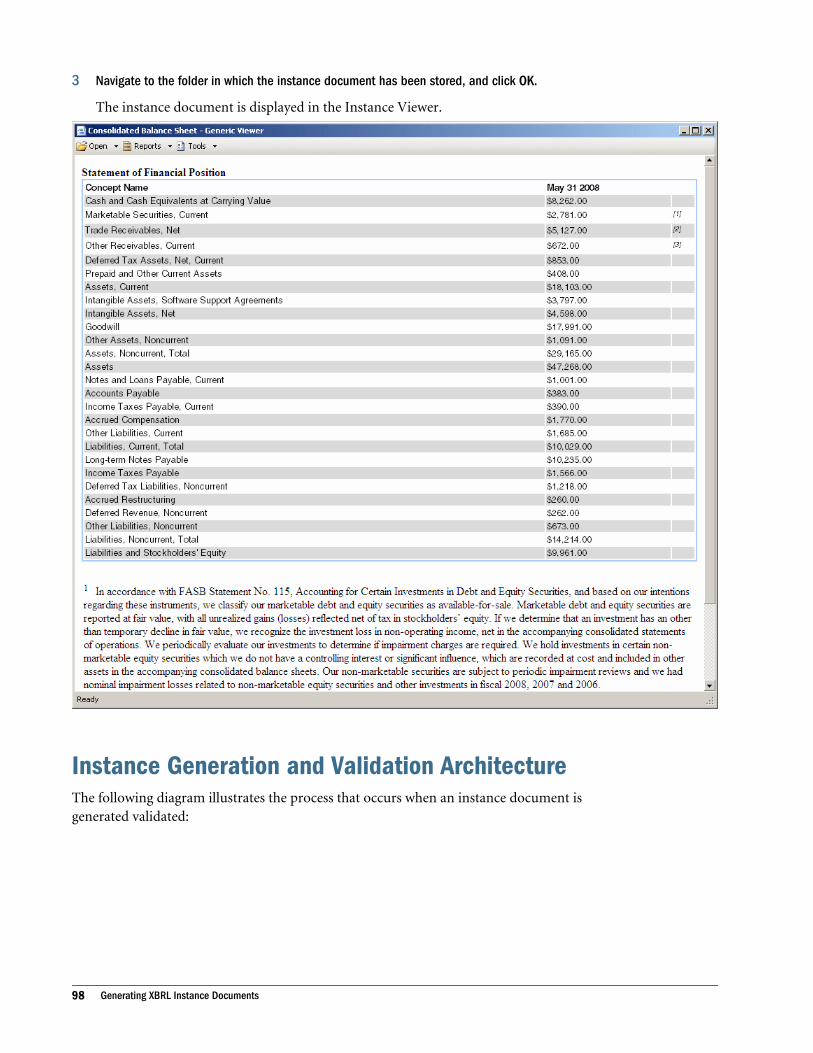
3 Navigate to the folder in which the instance document has been stored, and click OK.
The instance document is displayed in the Instance Viewer.
Instance Generation and Validation ArchitectureThe following diagram illustrates the process that occurs when an instance document isgenerated validated:
98 Generating XBRL Instance Documents
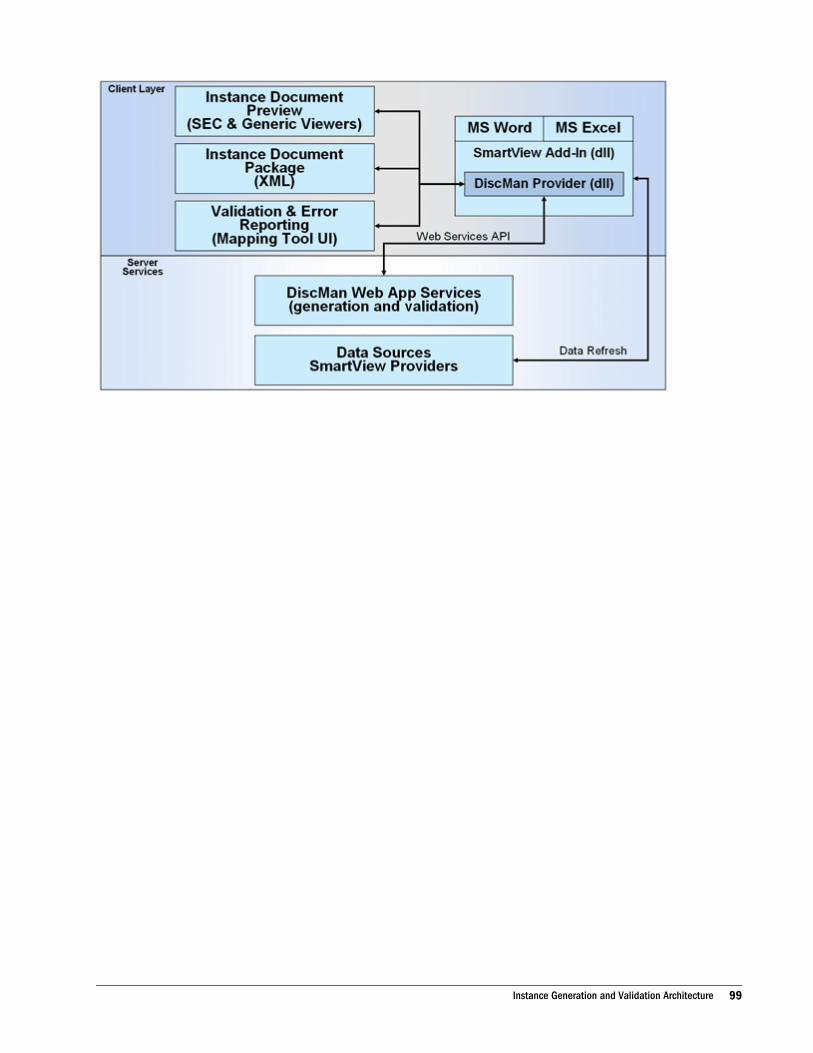
Instance Generation and Validation Architecture 99

100 Generating XBRL Instance Documents
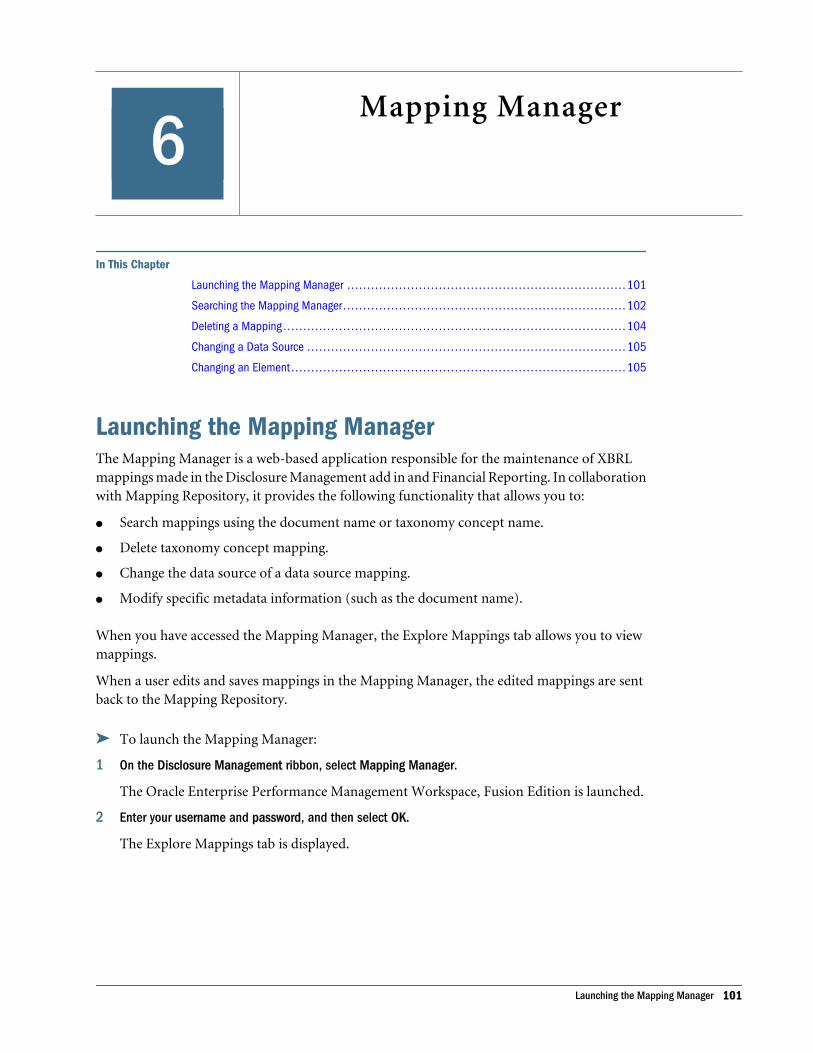
6Mapping Manager
In This Chapter
Launching the Mapping Manager .. . . . . . . . . . . . . . . . . . . . . . . . . . . . . . . . . . . . . . . . . . . . . . . . . . . . . . . . . . . . . . . . . . . . . 101
Searching the Mapping Manager .. . . . . . . . . . . . . . . . . . . . . . . . . . . . . . . . . . . . . . . . . . . . . . . . . . . . . . . . . . . . . . . . . . . . . . 102
Deleting a Mapping ... . . . . . . . . . . . . . . . . . . . . . . . . . . . . . . . . . . . . . . . . . . . . . . . . . . . . . . . . . . . . . . . . . . . . . . . . . . . . . . . . . . . 104
Changing a Data Source ... . . . . . . . . . . . . . . . . . . . . . . . . . . . . . . . . . . . . . . . . . . . . . . . . . . . . . . . . . . . . . . . . . . . . . . . . . . . . . 105
Changing an Element .. . . . . . . . . . . . . . . . . . . . . . . . . . . . . . . . . . . . . . . . . . . . . . . . . . . . . . . . . . . . . . . . . . . . . . . . . . . . . . . . . . . 105
Launching the Mapping ManagerThe Mapping Manager is a web-based application responsible for the maintenance of XBRLmappings made in the Disclosure Management add in and Financial Reporting. In collaborationwith Mapping Repository, it provides the following functionality that allows you to:
l Search mappings using the document name or taxonomy concept name.
l Delete taxonomy concept mapping.
l Change the data source of a data source mapping.
l Modify specific metadata information (such as the document name).
When you have accessed the Mapping Manager, the Explore Mappings tab allows you to viewmappings.
When a user edits and saves mappings in the Mapping Manager, the edited mappings are sentback to the Mapping Repository.
ä To launch the Mapping Manager:
1 On the Disclosure Management ribbon, select Mapping Manager.
The Oracle Enterprise Performance Management Workspace, Fusion Edition is launched.
2 Enter your username and password, and then select OK.
The Explore Mappings tab is displayed.
Launching the Mapping Manager 101
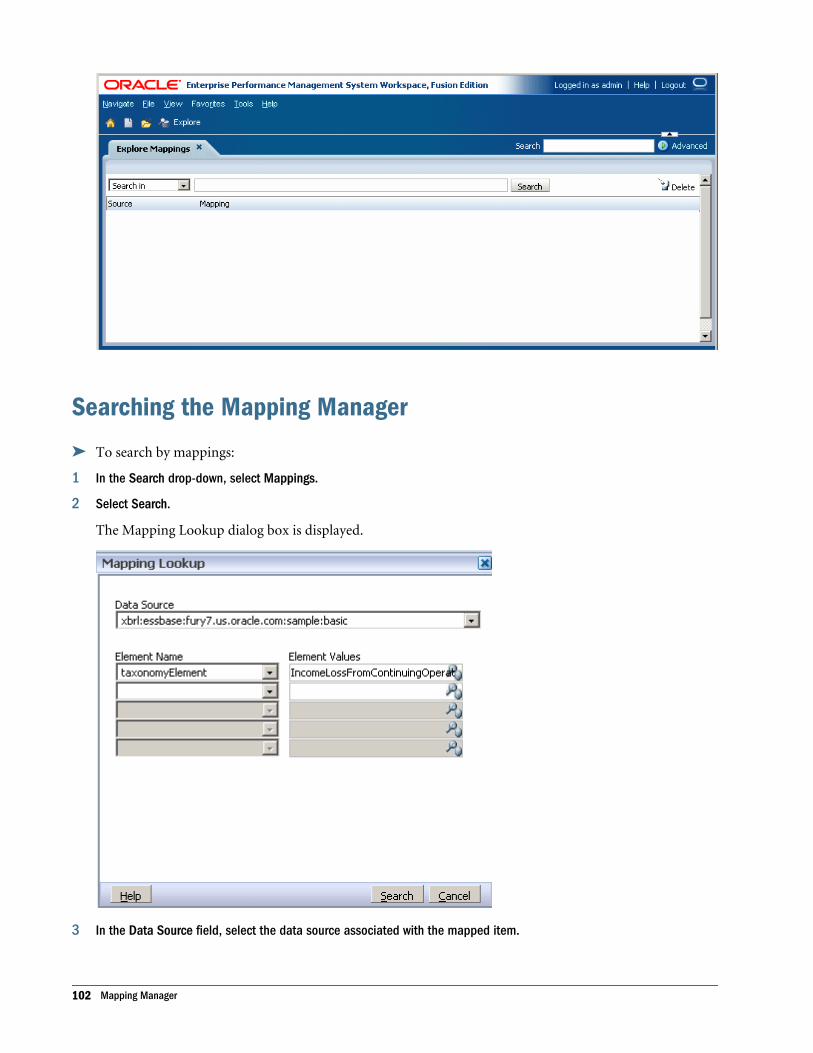
Searching the Mapping Manager
ä To search by mappings:
1 In the Search drop-down, select Mappings.
2 Select Search.
The Mapping Lookup dialog box is displayed.
3 In the Data Source field, select the data source associated with the mapped item.
102 Mapping Manager
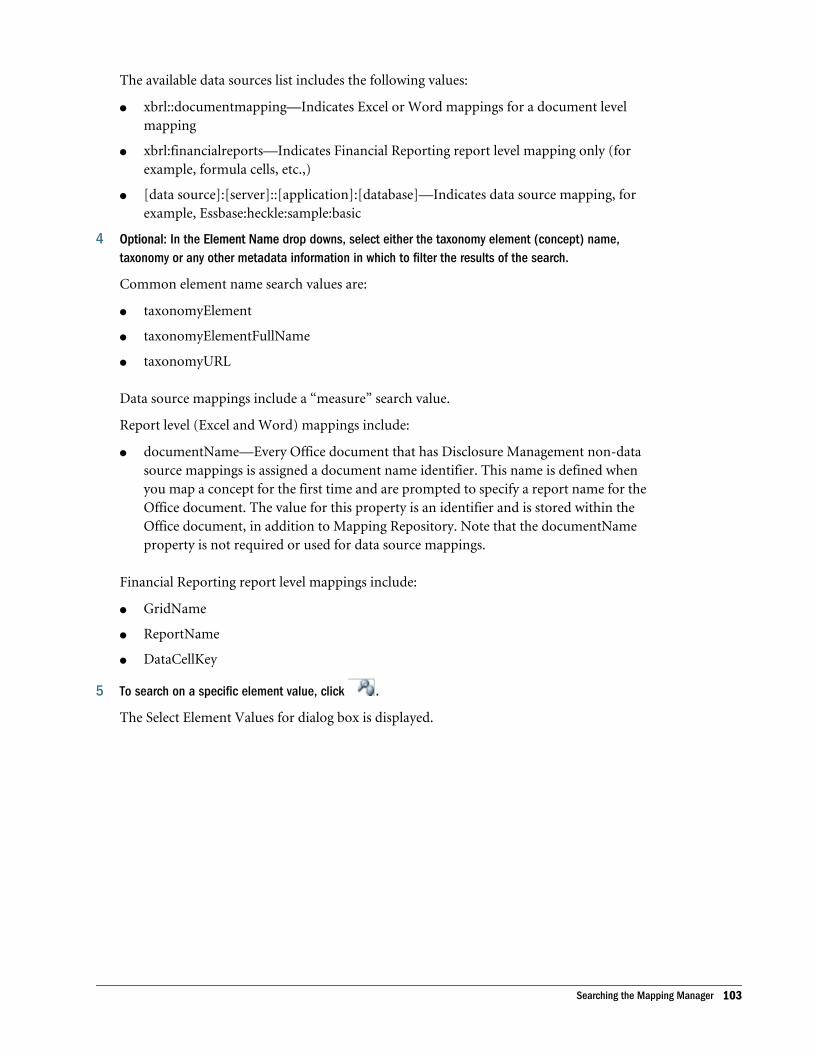
The available data sources list includes the following values:
l xbrl::documentmapping—Indicates Excel or Word mappings for a document levelmapping
l xbrl:financialreports—Indicates Financial Reporting report level mapping only (forexample, formula cells, etc.,)
l [data source]:[server]::[application]:[database]—Indicates data source mapping, forexample, Essbase:heckle:sample:basic
4 Optional: In the Element Name drop downs, select either the taxonomy element (concept) name,taxonomy or any other metadata information in which to filter the results of the search.
Common element name search values are:
l taxonomyElement
l taxonomyElementFullName
l taxonomyURL
Data source mappings include a “measure” search value.
Report level (Excel and Word) mappings include:
l documentName—Every Office document that has Disclosure Management non-datasource mappings is assigned a document name identifier. This name is defined whenyou map a concept for the first time and are prompted to specify a report name for theOffice document. The value for this property is an identifier and is stored within theOffice document, in addition to Mapping Repository. Note that the documentNameproperty is not required or used for data source mappings.
Financial Reporting report level mappings include:
l GridName
l ReportName
l DataCellKey
5 To search on a specific element value, click .
The Select Element Values for dialog box is displayed.
Searching the Mapping Manager 103
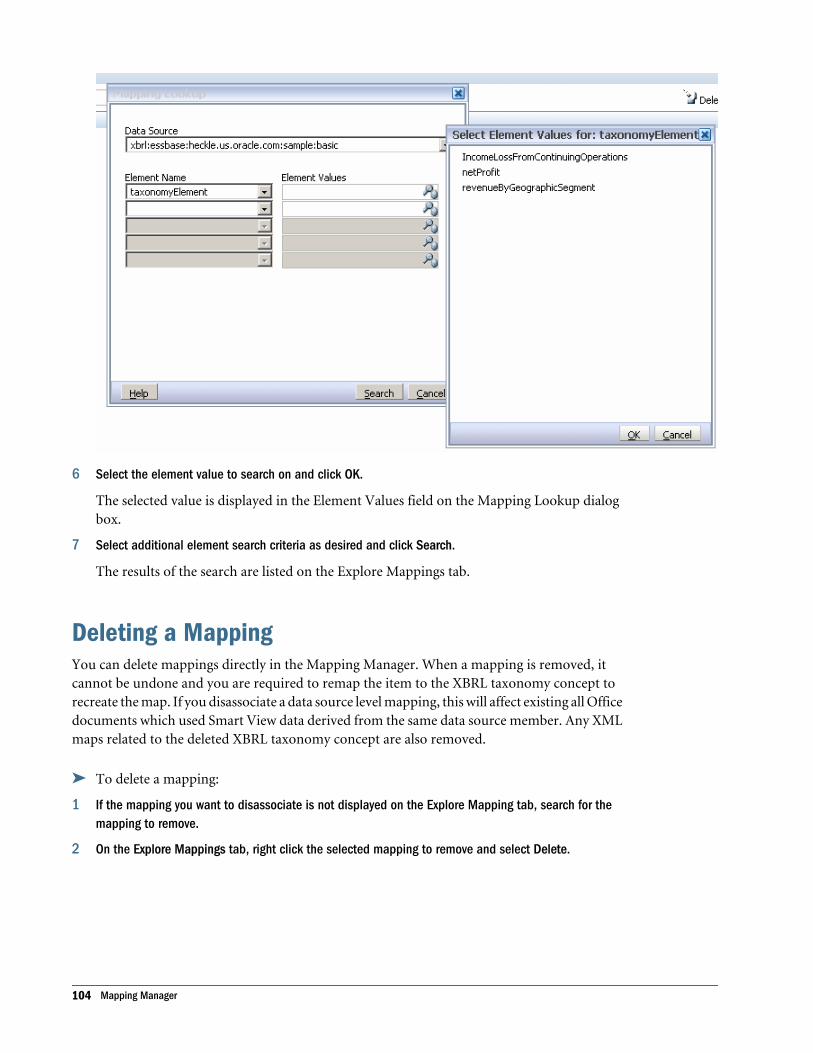
6 Select the element value to search on and click OK.
The selected value is displayed in the Element Values field on the Mapping Lookup dialogbox.
7 Select additional element search criteria as desired and click Search.
The results of the search are listed on the Explore Mappings tab.
Deleting a MappingYou can delete mappings directly in the Mapping Manager. When a mapping is removed, itcannot be undone and you are required to remap the item to the XBRL taxonomy concept torecreate the map. If you disassociate a data source level mapping, this will affect existing all Officedocuments which used Smart View data derived from the same data source member. Any XMLmaps related to the deleted XBRL taxonomy concept are also removed.
ä To delete a mapping:
1 If the mapping you want to disassociate is not displayed on the Explore Mapping tab, search for themapping to remove.
2 On the Explore Mappings tab, right click the selected mapping to remove and select Delete.
104 Mapping Manager
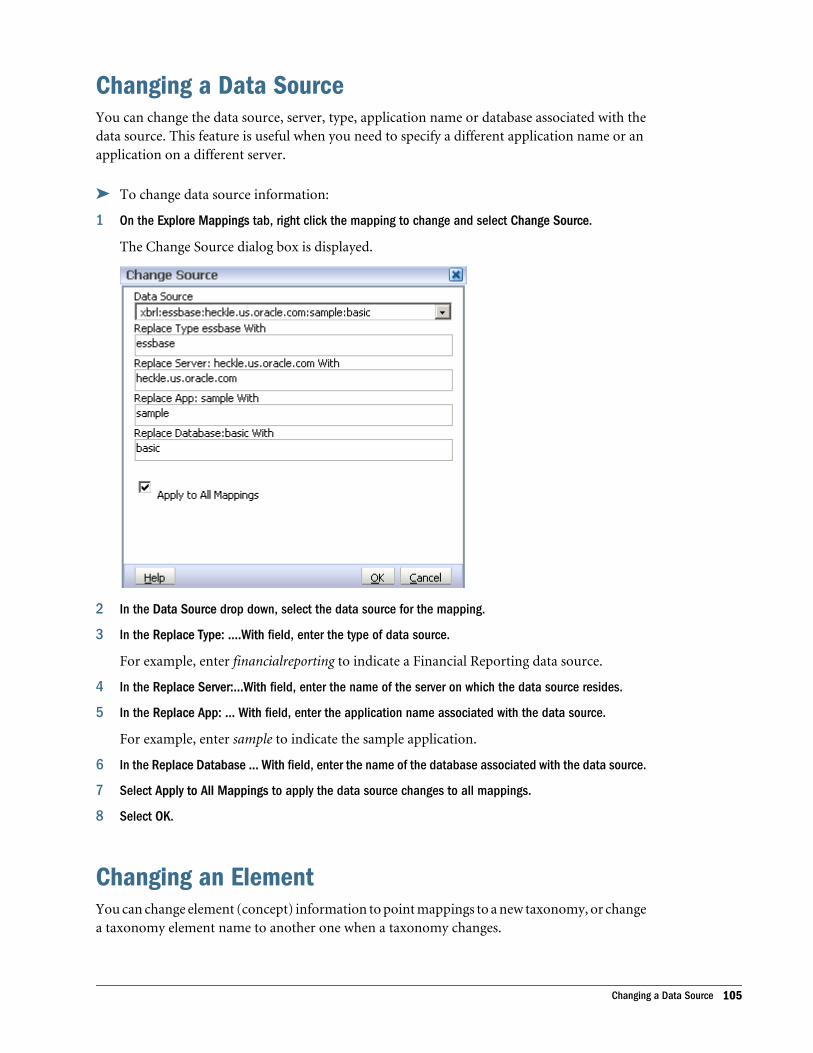
Changing a Data SourceYou can change the data source, server, type, application name or database associated with thedata source. This feature is useful when you need to specify a different application name or anapplication on a different server.
ä To change data source information:
1 On the Explore Mappings tab, right click the mapping to change and select Change Source.
The Change Source dialog box is displayed.
2 In the Data Source drop down, select the data source for the mapping.
3 In the Replace Type: ....With field, enter the type of data source.
For example, enter financialreporting to indicate a Financial Reporting data source.
4 In the Replace Server:...With field, enter the name of the server on which the data source resides.
5 In the Replace App: ... With field, enter the application name associated with the data source.
For example, enter sample to indicate the sample application.
6 In the Replace Database ... With field, enter the name of the database associated with the data source.
7 Select Apply to All Mappings to apply the data source changes to all mappings.
8 Select OK.
Changing an ElementYou can change element (concept) information to point mappings to a new taxonomy, or changea taxonomy element name to another one when a taxonomy changes.
Changing a Data Source 105

ä To change an element:
1 On the Explore Mappings tab, right click the source and select Change Element.
The Change Element dialog box is displayed.
2 In the Data Source drop down, select the data source for the element.
3 Select Change Element to modify a data source element.
4 In the Replace field, select the data source element to modify.
5 In the With field, enter the replacement data source.
6 Select Change Element Value to modify the mapped value of a data source element.
7 In the For field, select the data source to modify.
8 In the Replace field, select the data source element value to modify.
9 In the With field, enter the replacement value for the data source element.
10 Select Apply to Mappings to apply the data source changes to all elements.
106 Mapping Manager

7Working with Master
Documents and Doclets
In This Chapter
Adding a Master Document .. . . . . . . . . . . . . . . . . . . . . . . . . . . . . . . . . . . . . . . . . . . . . . . . . . . . . . . . . . . . . . . . . . . . . . . . . . . . 107
Adding a Doclet .. . . . . . . . . . . . . . . . . . . . . . . . . . . . . . . . . . . . . . . . . . . . . . . . . . . . . . . . . . . . . . . . . . . . . . . . . . . . . . . . . . . . . . . . . 108
Adding a Master DocumentDisclosure Management allows you to leverage your last report as the starting for you next reportby using the master document feature. With a master document in Microsoft Word, anadministrator can easily copy the last report, embed Excel sections into the document, renameit, and update the report view to the current Period or Year.
A master document acts as a container file for subdocuments referred to as “doclets.” A docletis a separate Word or Excel file that includes selected data that you want to include in the masterdocument.
Note: When you need to “roll over” a Disclosure Management document from one period orquarter to the next, see “Rolling Over a Taxonomy” on page 61.
When a report is saved as a master document, and a doclet can be optionally added to it,Disclosure Management creates a corresponding XML file in the folders in which the masterdocument and doclet reside. Although the master document and doclets do not have to residein the same folder, once they have been added to a master document they should not moved ordeleted. Additionally the XML files created by Disclosure Management should not be modifieddirectly.
ä To create a master document.
1 Open the main report in Microsoft Word, connect to the Disclosure Management server, and on theDisclosure Management ribbon, select Map to open the Disclosure Management Mapping Tool.
2 From the Disclosure Management ribbon, select Create.
The Save As Master Document dialog box is displayed.
Adding a Master Document 107
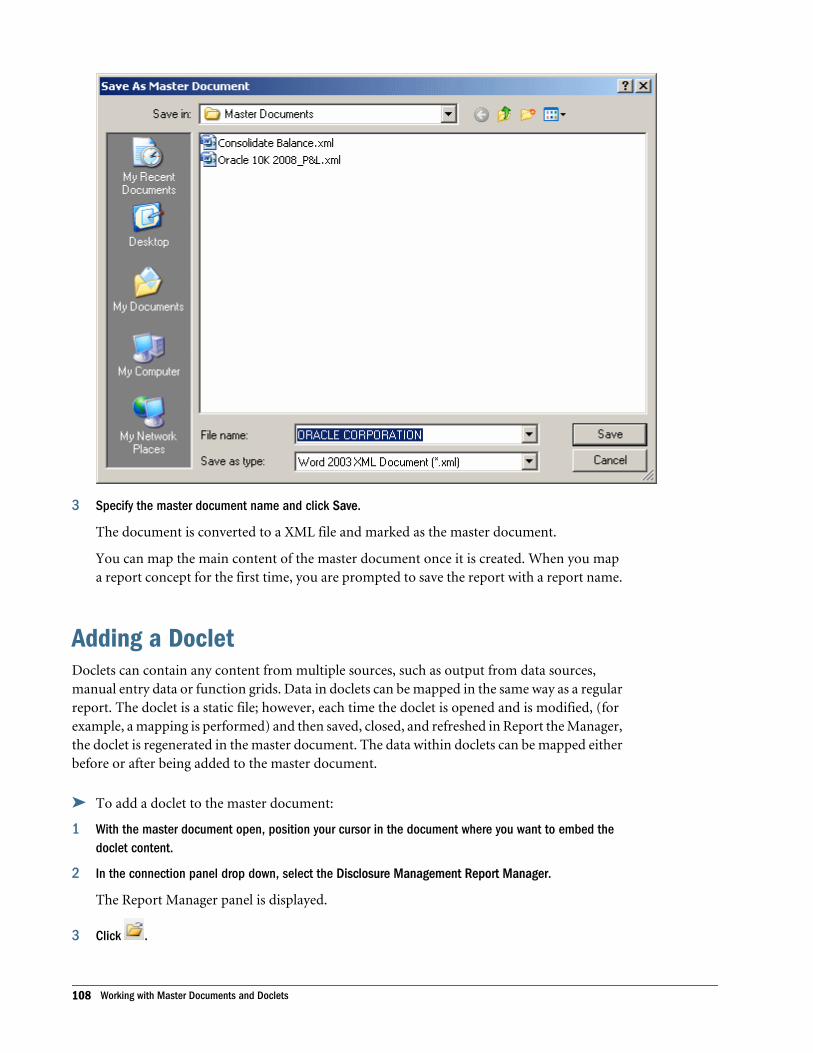
3 Specify the master document name and click Save.
The document is converted to a XML file and marked as the master document.
You can map the main content of the master document once it is created. When you mapa report concept for the first time, you are prompted to save the report with a report name.
Adding a DocletDoclets can contain any content from multiple sources, such as output from data sources,manual entry data or function grids. Data in doclets can be mapped in the same way as a regularreport. The doclet is a static file; however, each time the doclet is opened and is modified, (forexample, a mapping is performed) and then saved, closed, and refreshed in Report the Manager,the doclet is regenerated in the master document. The data within doclets can be mapped eitherbefore or after being added to the master document.
ä To add a doclet to the master document:
1 With the master document open, position your cursor in the document where you want to embed thedoclet content.
2 In the connection panel drop down, select the Disclosure Management Report Manager.
The Report Manager panel is displayed.
3 Click .
108 Working with Master Documents and Doclets
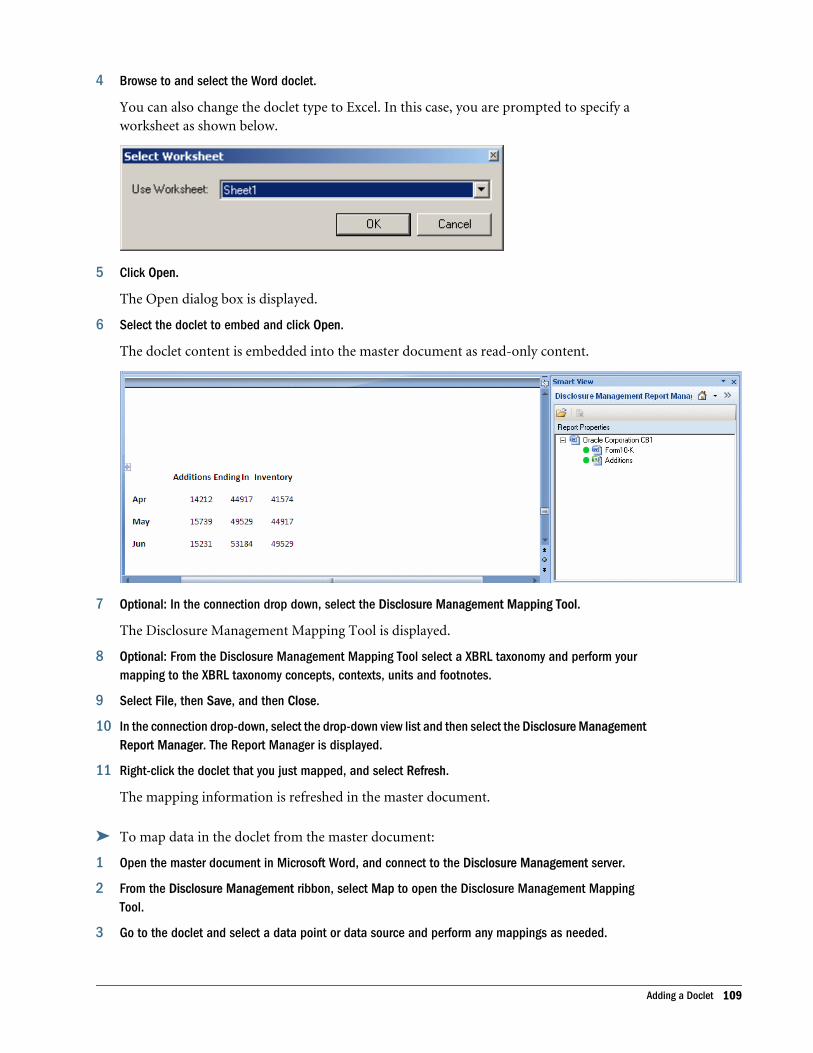
4 Browse to and select the Word doclet.
You can also change the doclet type to Excel. In this case, you are prompted to specify aworksheet as shown below.
5 Click Open.
The Open dialog box is displayed.
6 Select the doclet to embed and click Open.
The doclet content is embedded into the master document as read-only content.
7 Optional: In the connection drop down, select the Disclosure Management Mapping Tool.
The Disclosure Management Mapping Tool is displayed.
8 Optional: From the Disclosure Management Mapping Tool select a XBRL taxonomy and perform yourmapping to the XBRL taxonomy concepts, contexts, units and footnotes.
9 Select File, then Save, and then Close.
10 In the connection drop-down, select the drop-down view list and then select the Disclosure ManagementReport Manager. The Report Manager is displayed.
11 Right-click the doclet that you just mapped, and select Refresh.
The mapping information is refreshed in the master document.
ä To map data in the doclet from the master document:
1 Open the master document in Microsoft Word, and connect to the Disclosure Management server.
2 From the Disclosure Management ribbon, select Map to open the Disclosure Management MappingTool.
3 Go to the doclet and select a data point or data source and perform any mappings as needed.
Adding a Doclet 109

4 In the connection drop down, select the Disclosure Management Report Manager.
5 From the Disclosure Management Report Manager panel, select the doclet and click Refresh.
110 Working with Master Documents and Doclets

AGlossary of XBRL and
Disclosure Management Terms
Common XBRL terms are defined below:
Table 13 XBRL Terminology and Definitions
Terminology Description
Abstract Identifies the attribute of a concept that shows that the concept is only used in a hierarchy to grouprelated elements together. An abstract concept cannot be used to map data in an instance document.
Arc Arcs are referred to as “summation-item” arcs. Summation-item arcs MUST represent relationships onlybetween concepts that are in the item substitution group and whose type is numeric They representaggregation relationships between concepts. Each of these relationships is between one concept, referredto as the summation concept, and another concept, referred to as the contributing concept.
Attributes Properties of concepts/elements
Axis In the instance document, an axis classifies facts and how facts are reported. For example, in a giventime period, Gross Profit may be classified on a sales region axis or a business unit axis.
Calculation Linkbase The calculation linkbase is designed to allow basic operations to be defined for sets of items in a taxonomyschema document. These calculations can then be used to check that these operations have beencalculated correctly in a XBRL instance document. Calculation linkbases provide for basic summationsand some multiplication.
Calculation Trace Organizes the results of all of the calculations of a XBRL document into the same tree view. It sorts thedata by extended links and units hyperlinked to extended links and units (at bottom) and notingdiscrepancies where the addition differs from instance values representing sums.
Data Type (Type) Identifies the data storage format that can hold a specific type of data or range of values for the concept.Examples of data types include: decimal and string.
Document Data Document data refers to data that resides within a Microsoft Office document. For the first release,supported Office documents include Microsoft Excel or Word. The generic "document data" term canmean a single cell in Excel, a single word in Word or and entire paragraph in Word. It is used throughoutto mean data that is or can be mapped by the Disclosure Management Mapping Tool.
Document Identifier Every Office document that has Disclosure Managementn on-data source mappings is assigned adocument identifier (also known as the documentName. This property is used to identify an Officedocument within the Mapping Repository. The value for this property is stored as custom XML within theOffice document. Note that the documentName property is not required or used for data source mappings.
111
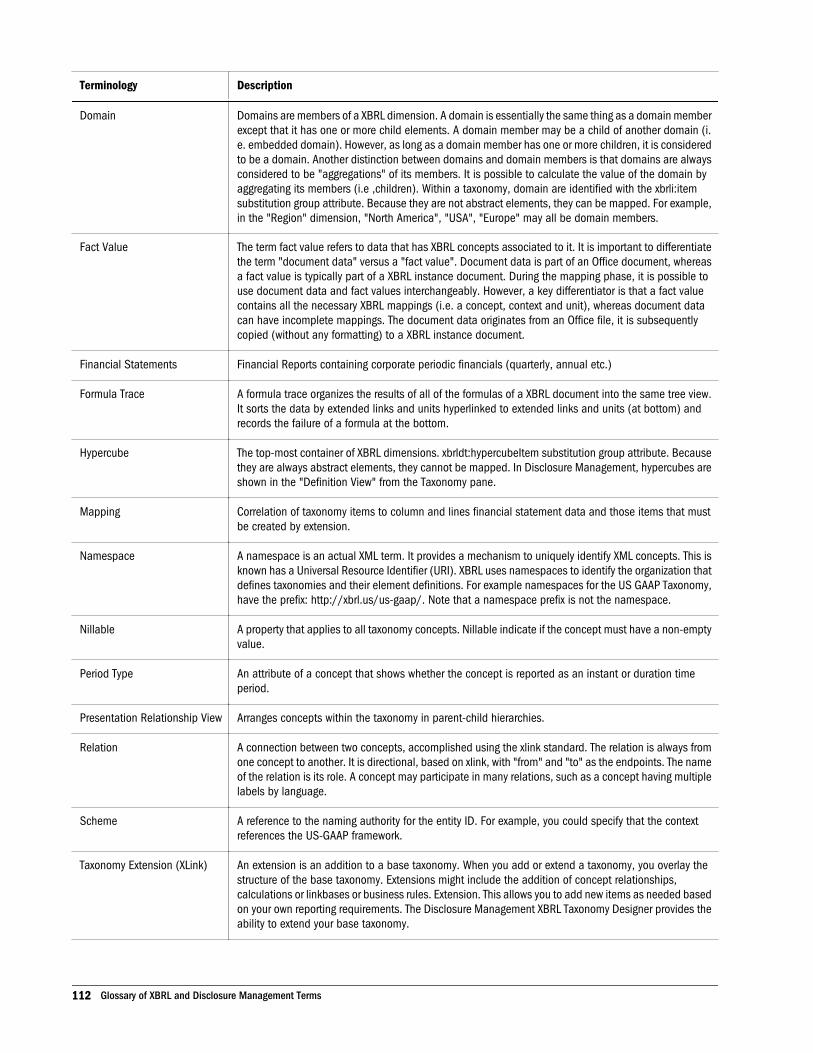
Terminology Description
Domain Domains are members of a XBRL dimension. A domain is essentially the same thing as a domain memberexcept that it has one or more child elements. A domain member may be a child of another domain (i.e. embedded domain). However, as long as a domain member has one or more children, it is consideredto be a domain. Another distinction between domains and domain members is that domains are alwaysconsidered to be "aggregations" of its members. It is possible to calculate the value of the domain byaggregating its members (i.e ,children). Within a taxonomy, domain are identified with the xbrli:itemsubstitution group attribute. Because they are not abstract elements, they can be mapped. For example,in the "Region" dimension, "North America", "USA", "Europe" may all be domain members.
Fact Value The term fact value refers to data that has XBRL concepts associated to it. It is important to differentiatethe term "document data" versus a "fact value". Document data is part of an Office document, whereasa fact value is typically part of a XBRL instance document. During the mapping phase, it is possible touse document data and fact values interchangeably. However, a key differentiator is that a fact valuecontains all the necessary XBRL mappings (i.e. a concept, context and unit), whereas document datacan have incomplete mappings. The document data originates from an Office file, it is subsequentlycopied (without any formatting) to a XBRL instance document.
Financial Statements Financial Reports containing corporate periodic financials (quarterly, annual etc.)
Formula Trace A formula trace organizes the results of all of the formulas of a XBRL document into the same tree view.It sorts the data by extended links and units hyperlinked to extended links and units (at bottom) andrecords the failure of a formula at the bottom.
Hypercube The top-most container of XBRL dimensions. xbrldt:hypercubeItem substitution group attribute. Becausethey are always abstract elements, they cannot be mapped. In Disclosure Management, hypercubes areshown in the "Definition View" from the Taxonomy pane.
Mapping Correlation of taxonomy items to column and lines financial statement data and those items that mustbe created by extension.
Namespace A namespace is an actual XML term. It provides a mechanism to uniquely identify XML concepts. This isknown has a Universal Resource Identifier (URI). XBRL uses namespaces to identify the organization thatdefines taxonomies and their element definitions. For example namespaces for the US GAAP Taxonomy,have the prefix: http://xbrl.us/us-gaap/. Note that a namespace prefix is not the namespace.
Nillable A property that applies to all taxonomy concepts. Nillable indicate if the concept must have a non-emptyvalue.
Period Type An attribute of a concept that shows whether the concept is reported as an instant or duration timeperiod.
Presentation Relationship View Arranges concepts within the taxonomy in parent-child hierarchies.
Relation A connection between two concepts, accomplished using the xlink standard. The relation is always fromone concept to another. It is directional, based on xlink, with "from" and "to" as the endpoints. The nameof the relation is its role. A concept may participate in many relations, such as a concept having multiplelabels by language.
Scheme A reference to the naming authority for the entity ID. For example, you could specify that the contextreferences the US-GAAP framework.
Taxonomy Extension (XLink) An extension is an addition to a base taxonomy. When you add or extend a taxonomy, you overlay thestructure of the base taxonomy. Extensions might include the addition of concept relationships,calculations or linkbases or business rules. Extension. This allows you to add new items as needed basedon your own reporting requirements. The Disclosure Management XBRL Taxonomy Designer provides theability to extend your base taxonomy.
112 Glossary of XBRL and Disclosure Management Terms
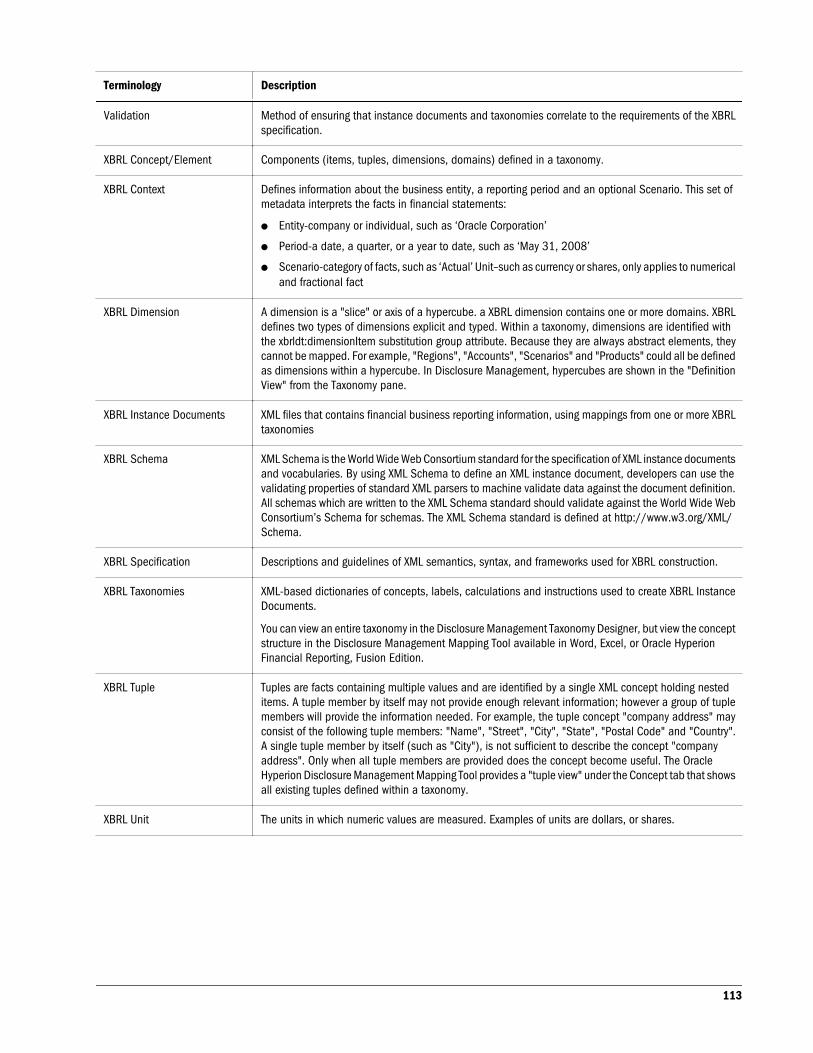
Terminology Description
Validation Method of ensuring that instance documents and taxonomies correlate to the requirements of the XBRLspecification.
XBRL Concept/Element Components (items, tuples, dimensions, domains) defined in a taxonomy.
XBRL Context Defines information about the business entity, a reporting period and an optional Scenario. This set ofmetadata interprets the facts in financial statements:
l Entity-company or individual, such as ‘Oracle Corporation’
l Period-a date, a quarter, or a year to date, such as ‘May 31, 2008’
l Scenario-category of facts, such as ‘Actual’ Unit–such as currency or shares, only applies to numericaland fractional fact
XBRL Dimension A dimension is a "slice" or axis of a hypercube. a XBRL dimension contains one or more domains. XBRLdefines two types of dimensions explicit and typed. Within a taxonomy, dimensions are identified withthe xbrldt:dimensionItem substitution group attribute. Because they are always abstract elements, theycannot be mapped. For example, "Regions", "Accounts", "Scenarios" and "Products" could all be definedas dimensions within a hypercube. In Disclosure Management, hypercubes are shown in the "DefinitionView" from the Taxonomy pane.
XBRL Instance Documents XML files that contains financial business reporting information, using mappings from one or more XBRLtaxonomies
XBRL Schema XML Schema is the World Wide Web Consortium standard for the specification of XML instance documentsand vocabularies. By using XML Schema to define an XML instance document, developers can use thevalidating properties of standard XML parsers to machine validate data against the document definition.All schemas which are written to the XML Schema standard should validate against the World Wide WebConsortium’s Schema for schemas. The XML Schema standard is defined at http://www.w3.org/XML/Schema.
XBRL Specification Descriptions and guidelines of XML semantics, syntax, and frameworks used for XBRL construction.
XBRL Taxonomies XML-based dictionaries of concepts, labels, calculations and instructions used to create XBRL InstanceDocuments.
You can view an entire taxonomy in the Disclosure Management Taxonomy Designer, but view the conceptstructure in the Disclosure Management Mapping Tool available in Word, Excel, or Oracle HyperionFinancial Reporting, Fusion Edition.
XBRL Tuple Tuples are facts containing multiple values and are identified by a single XML concept holding nesteditems. A tuple member by itself may not provide enough relevant information; however a group of tuplemembers will provide the information needed. For example, the tuple concept "company address" mayconsist of the following tuple members: "Name", "Street", "City", "State", "Postal Code" and "Country".A single tuple member by itself (such as "City"), is not sufficient to describe the concept "companyaddress". Only when all tuple members are provided does the concept become useful. The OracleHyperion Disclosure Management Mapping Tool provides a "tuple view" under the Concept tab that showsall existing tuples defined within a taxonomy.
XBRL Unit The units in which numeric values are measured. Examples of units are dollars, or shares.
113

114 Glossary of XBRL and Disclosure Management Terms
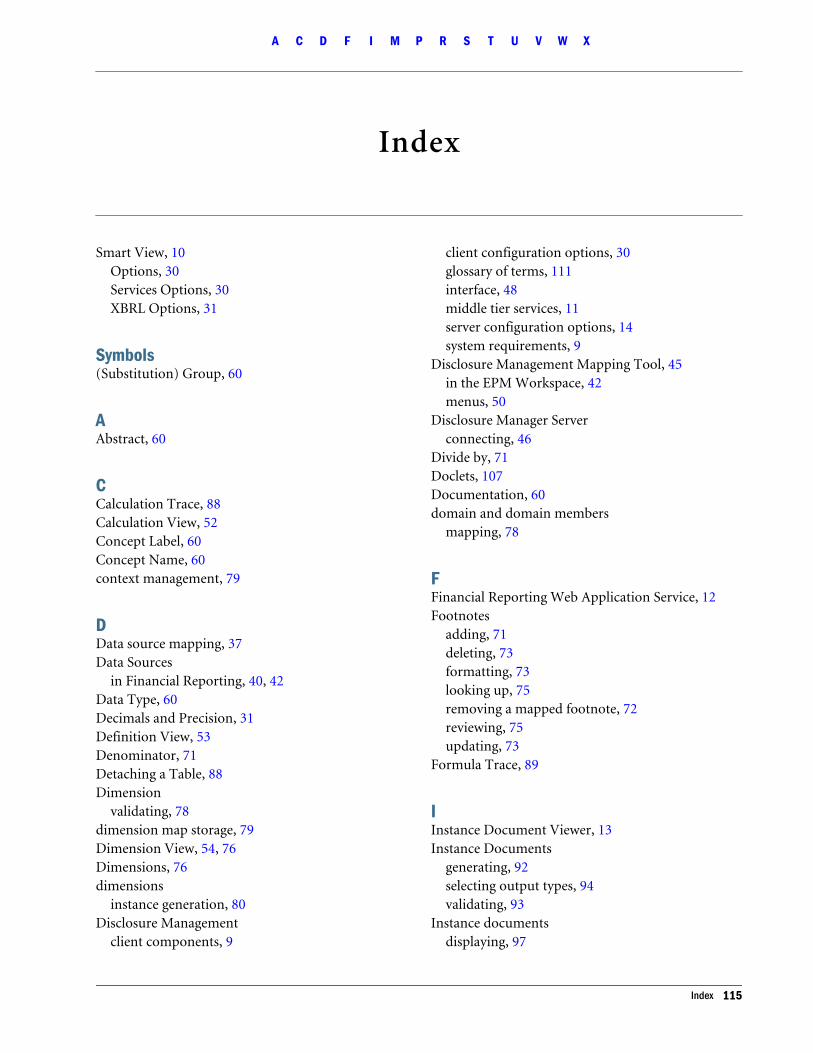
Index
Smart View, 10Options, 30Services Options, 30XBRL Options, 31
Symbols(Substitution) Group, 60
AAbstract, 60
CCalculation Trace, 88Calculation View, 52Concept Label, 60Concept Name, 60context management, 79
DData source mapping, 37Data Sources
in Financial Reporting, 40, 42Data Type, 60Decimals and Precision, 31Definition View, 53Denominator, 71Detaching a Table, 88Dimension
validating, 78dimension map storage, 79Dimension View, 54, 76Dimensions, 76dimensions
instance generation, 80Disclosure Management
client components, 9
client configuration options, 30glossary of terms, 111interface, 48middle tier services, 11server configuration options, 14system requirements, 9
Disclosure Management Mapping Tool, 45in the EPM Workspace, 42menus, 50
Disclosure Manager Serverconnecting, 46
Divide by, 71Doclets, 107Documentation, 60domain and domain members
mapping, 78
FFinancial Reporting Web Application Service, 12Footnotes
adding, 71deleting, 73formatting, 73looking up, 75removing a mapped footnote, 72reviewing, 75updating, 73
Formula Trace, 89
IInstance Document Viewer, 13Instance Documents
generating, 92selecting output types, 94validating, 93
Instance documentsdisplaying, 97
A C D F I M P R S T U V W X
Index 115
Instance Viewer, 49
MMapped Data
removing, 83Mapping
data sources in Smart View, 38report level versus data source mapping, 37
Mapping Data SourcesFinancial Reporting function grid, 40Smart Slice function grid, 38
Mapping Manager, 11, 49, 101Mapping Repository, 12Disclosure Management Mapping Tool, 10
navigating, 49mappingtool.properties, 15mappingtool.properties (illustration), 15Master documents, 107Measure, 71
PPeriod Type, 60Presentation View, 51primary item
mapping, 78
Rregulatory agency resources, 36Report level mapping, 37Review mode
navigation options, 92Rolling over a taxonomy, 61
SSEC Viewer
configuring, 34Smart View (APS) and Data Source Access, 10Status alert symbols, 91Suppressed Mappings, 49, 85
TTaxonomies
changing, 60changing views, 51refreshing, 58
selecting, 50understanding, 8viewing, 58
Taxonomy Cache Polling Feature, 23taxonomy relationship view
changing, 51Time-outs in Disclosure Management Mapping Tool,
46Tuple, 60Tuple View, 55, 81Tuples, 80
UUBMatrix XBRL Processing Engine Settings, 25Unit name, 71Unit Types
configuring unit types in themappingtool.properties file, 19
VValidation, 93
error messages, 91in Review mode, 91
virtual context, 79
WDisclosure Management Web Services, 11
XXBRL
definition, 7glossary of terms, 111
XBRL Concepts, 50removing, 57searching, 62viewing detail, 59
XBRL Contextsadding, 63deleting, 65looking up, 66mapping to, 64removing a mapped context, 64updating, 65viewing, 66viewing context detail, 67
A C D F I M P R S T U V W X
116 Index
XBRL Objectsdeleting, 83
XBRL outputpreviewing, 95
XBRL Planning Considerations, 35XBRL Taxonomies, 14
cache poll interval, 23caching, 22downloading, 15entry point, 17extending, 21extracting, 15JVM memory threshold, 24label, 18maximum taxonomies loaded threshold, 24prefix, 17refreshing, 20registering taxonomies, 15unused taxonomy threshold, 24viewing, 20
Disclosure Management XBRL Taxonomy Designer,12
XBRL Unitesadding, 68
XBRL Unitsdeleting, 69looking up, 70mapping to, 68remove mapping, 69updating, 69viewing, 70viewing unit detail, 70
XPE Taxonomy Caching Options, 25XPE Taxonomy Caching Overview, 26XPE web cache
configuring, 27XPE web cache folder, 27XPE Web Caching, 27
A C D F I M P R S T U V W X
Index 117

A C D F I M P R S T U V W X
118 Index


![Oracle Essbase Studio Readmeotndnld.oracle.co.jp/document/products/epm/111200/E-17236/epm.111… · Oracle® Essbase Studio Release 11.1.2.0.00 Readme [Skip Navigation Links] Purpose](https://static.fdocuments.in/doc/165x107/5a7a9dce7f8b9a2d788d7b07/oracle-essbase-studio-oracle-essbase-studio-release-1112000-readme-skip-navigation.jpg)


![Untitled-5 [] · 2020. 9. 15. · AMMETER EPM-4A 1 EPM-4C / EPM-4D / EPM-4P EPM-4D (Ammeter with Demand) : EPM-4D is designed to measure RMS value of AC current which flows from the](https://static.fdocuments.in/doc/165x107/60389b94586a40652f159b94/untitled-5-2020-9-15-ammeter-epm-4a-1-epm-4c-epm-4d-epm-4p-epm-4d-ammeter.jpg)