Oracle Cache fusion, private inter connects and practical ... · PDF fileOracle Cache fusion,...
25
Oracle Cache fusion, private inter connects and practical performance management considerations in Oracle RAC In the article you will have a look at the cache fusion from the perspective of the Practical Performance Management for Oracle RAC. Cache fusion is based and heavily depends on Private Interconnect. The article will emphasize on the Interconnects impact, often overlooked and underestimated, on the RAC performance. Tuning RAC is similar to tuning of a regular single instance database and in addition takes into account the overhead of the interconnects existing in Oracle RAC (10gR1/10gR2/11gR1/11gR2). Some well known cases will be addressed in RAC to improve performance. In this article you will review the Oracle fundamentals and infrastructure architecture and you will look at the Cache Fusion impact on the RAC performance. The outlined in the article guidelines has two objectives: Maximize the utilization of the software and hardware for Private Interconnect. Make sure that you fully utilize the maximum of your capacity. Increase the bandwidth, throughput and decrease latency. You will look at considerations for the Private Interconnect. o network Architecture o network configuration o network settings o TCP/UDP configuration and settings o OS settings Minimizing Cache fusion traffic across the private interconnects. Look at how to diagnose, determine and resolve problems related to Cache fusion addressing some common problems, derived from the cache fusion wait event and statistics, known to exist in Oracle RAC. RAC Fundamentals and architecture Oracle RAC is a parallel database architecture aiming at high availability and parallelism in a grid deployment. Concept of a grid is based on providing and distributing computing resources on demand. Oracle RAC is shared disk architecture. Oracle RDB database is another example of shared disk architecture. An alternative to Shared Disk Architecture is Shared nothing architecture. Shared nothing architecture is parallel database architecture (Teradata, IBM DB2, and Informix) based on MPP (Massive Parallel processing. The table below represents RAC architecture and all layered components (RDBMS, clusterware resources, Oracle clusterware etc...)depends on the private interconnect. Note 1 Node N Oracle RDBMS Oracle RDBMS Oracle Clusterware resources (VIP, Oracle Clusterware resources (VIP,
Transcript of Oracle Cache fusion, private inter connects and practical ... · PDF fileOracle Cache fusion,...

Oracle Cache fusion, private inter connects and
practical performance management considerations in
Oracle RAC
In the article you will have a look at the cache fusion from the perspective
of the Practical Performance Management for Oracle RAC. Cache fusion is based
and heavily depends on Private Interconnect. The article will emphasize on
the Interconnects impact, often overlooked and underestimated, on the RAC
performance. Tuning RAC is similar to tuning of a regular single instance
database and in addition takes into account the overhead of the interconnects
existing in Oracle RAC (10gR1/10gR2/11gR1/11gR2). Some well known cases will
be addressed in RAC to improve performance.
In this article you will review the Oracle fundamentals and infrastructure
architecture and you will look at the Cache Fusion impact on the RAC
performance. The outlined in the article guidelines has two objectives:
Maximize the utilization of the software and hardware for Private
Interconnect. Make sure that you fully utilize the maximum of your
capacity. Increase the bandwidth, throughput and decrease latency. You
will look at considerations for the Private Interconnect.
o network Architecture
o network configuration
o network settings
o TCP/UDP configuration and settings
o OS settings
Minimizing Cache fusion traffic across the private interconnects. Look
at how to diagnose, determine and resolve problems related to Cache
fusion addressing some common problems, derived from the cache fusion
wait event and statistics, known to exist in Oracle RAC.
RAC Fundamentals and architecture
Oracle RAC is a parallel database architecture aiming at high availability
and parallelism in a grid deployment. Concept of a grid is based on providing
and distributing computing resources on demand. Oracle RAC is shared disk
architecture. Oracle RDB database is another example of shared disk
architecture. An alternative to Shared Disk Architecture is Shared nothing
architecture. Shared nothing architecture is parallel database architecture
(Teradata, IBM DB2, and Informix) based on MPP (Massive Parallel processing.
The table below represents RAC architecture and all layered components
(RDBMS, clusterware resources, Oracle clusterware etc...)depends on the
private interconnect.
Note 1 Node N
Oracle RDBMS
Oracle RDBMS
Oracle Clusterware resources (VIP, Oracle Clusterware resources (VIP,
SCAN, Listeners, ASM etc…) SCAN, Listeners, ASM etc…)
Oracle clusterware/GI
Oracle clusterware/GI
Private network (same subnet, same
interface names across all nodes)
Private network (same subnet, same
interface names across all nodes)
Public network (same subnet, same
interfaces across all nodes)
Public network (same subnet, same
interfaces across all nodes)
Same OS (Oracle Supported) Same OS (Oracle Supported)
Shared or Cluster file system for the shared storage (Oracle supported) –
GPFS, Veritas, ASM, etc...
Shared disk hardware storage (Oracle supported)
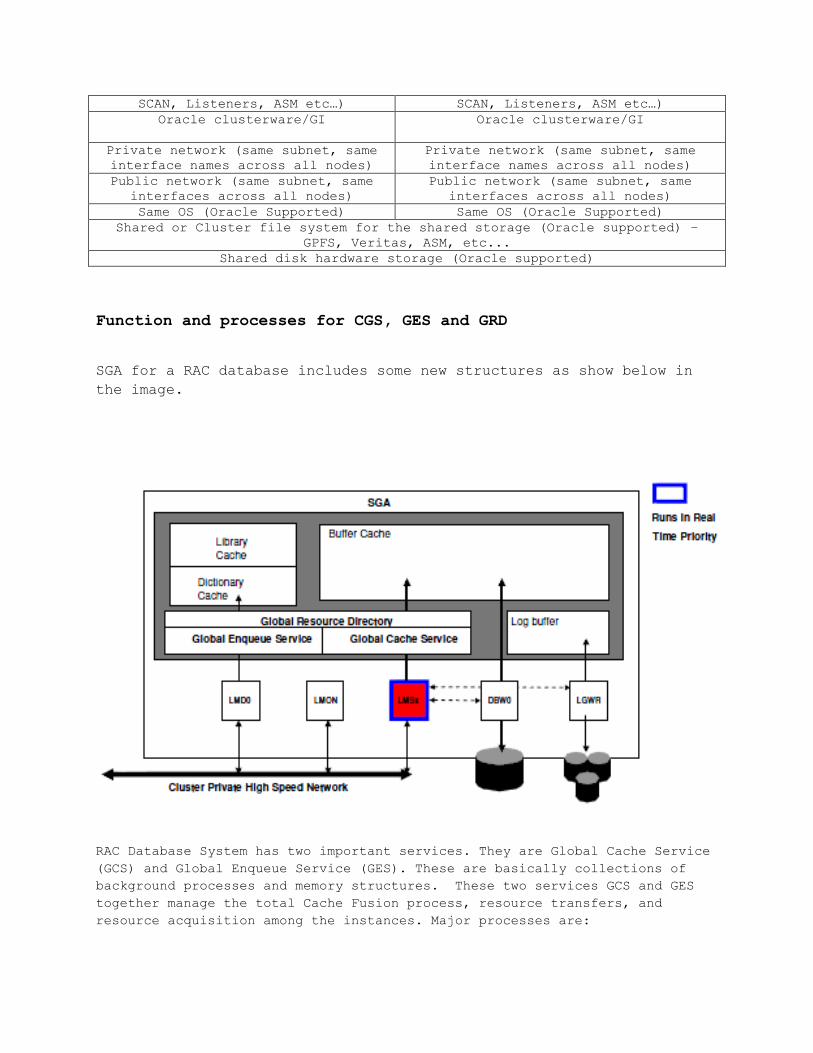
Function and processes for CGS, GES and GRD
SGA for a RAC database includes some new structures as show below in
the image.
RAC Database System has two important services. They are Global Cache Service
(GCS) and Global Enqueue Service (GES). These are basically collections of
background processes and memory structures. These two services GCS and GES
together manage the total Cache Fusion process, resource transfers, and
resource acquisition among the instances. Major processes are:
LMON: Global Enqueue Service Monitor: The LMON process monitors global
enqueues across the cluster and performs global enqueue recovery
operations. Recovers GRD.
LMD: Global Enqueue Service Daemon: The LMD process manages incoming
remote resource requests within each instance.
LMS: Global Cache Service Process: The LMS process maintains records of
the data file statuses and each cached block number by recording
information in a Global Resource Directory (GRD). The LMS process also
controls the flow of messages to remote instances and manages global
data block access and transmits block images between the buffer caches
of different instances. This processing is part of the Cache Fusion
feature.
LCK0: Instance Enqueue Process: The LCK0 process manages non-Cache
Fusion resource requests such as library and row cache requests.
Global Resource Directory (GRD) records the information about the resources
and the enqueues. GRD is maintained by GES and GCS. GRD remains in the memory
and is stored on all of the running instances. Each instance manages a
portion of the directory. This distributed nature is a key point for fault
tolerance of the RAC. Global Resource Directory (GRD) is the internal in-
memory database that records and stores the current status of the data
blocks. Whenever a block is transferred out of a local cache to another
instance’s cache the GRD is updated. The following resources information is
available in GRD.
Data Block information such as file # and block #
Location of most current version
Modes of the data blocks: (N)Null, (S)Shared, (X)Exclusive
GCS is primarily responsible for maintaining coherency of the Buffer caches
of all running RAC instances. CGS makes sure that instances acquire a
resource cluster-wide before modifying or reading a database block. The GCS
is used to synchronize global cache access, allowing only one instance to
modify a block at any single point in time. The GCS, through the RAC wide
Global Resource Directory, ensures that the status of data blocks cached in
the cluster is globally visible and maintained.
GES is primarily responsible for maintaining coherency in the dictionary and
library caches. The dictionary cache consists of the data dictionary
information for each node in its SGA for quicker lookup and access. GES
synchronizes dictionary and library caches across all running instances in
the RAC environment. LMON, LCK and LMD processes work in tandem to make the
GES operate in a smoothly.
Oracle RAC maintains multi-versioning architecture as far as blocks are
concerned distinguishing between current data blocks and one or more
consistent read (CR) versions of a block. A current block contains changes
for all committed and uncommitted transactions. A consistent read (CR)
version of a block represents a consistent snapshot of the data at a previous
point in time. In Oracle RAC, applying rollback segment information to
current blocks produces consistent read versions of a block. Both the current
and consistent read blocks are managed by the GCS. To transfer data blocks
among database caches, buffers are shipped by means of the high speed IPC
based on the private interconnect. Disk writes are only required for cache
replacement. A past image (PI) of a block is kept in memory before the block
is sent if it is a dirty block. In the event of failure, Oracle reconstructs
the current version of the block by reading the PI blocks.
Global Logical Buffer Cache
Using Cache Fusion, Oracle RAC logically combines each instance's buffer
cache to enable the users and applications to process data as if the data
resided on a logically combined single cache. The SGA size requirements for
Oracle RAC are greater than the SGA requirements for single-instance Oracle
databases due to Cache Fusion. To ensure that each Oracle RAC database
instance obtains the block that it requires to satisfy a query or
transaction, Oracle RAC instances use two components:
Global Cache Service (GCS)
Global Enqueue Service (GES)
The GCS and GES maintain records of the statuses of each data file and each
cached block using a Global Resource Directory (GRD). The GRD contents are
distributed across all of the active instances, which effectively increase
the size of the SGA for an Oracle RAC instance. After one instance caches
data, any other instance within the same cluster database can acquire a block
image from another instance in the same database faster than by reading the
block from disk. Therefore, Cache Fusion moves current blocks between
instances rather than re-reading the blocks from disk. When a consistent
block is needed or a changed block is required on another instance, Cache
Fusion transfers the block image directly between the affected instances.
Oracle RAC uses the private interconnect for inter-instance communication and
block transfers. The GCS and GES processes, and the GRD collaborate to enable
Cache Fusion. The image below is an illustration of the global buffer cache.
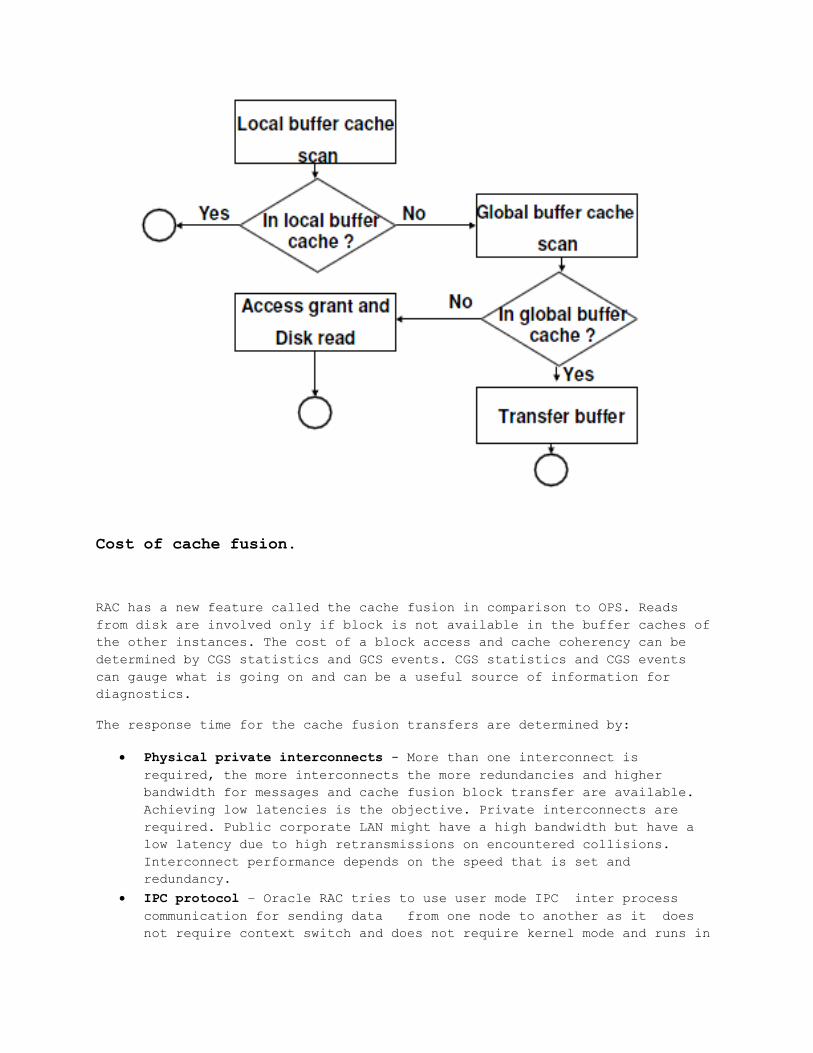
Cost of cache fusion.
RAC has a new feature called the cache fusion in comparison to OPS. Reads
from disk are involved only if block is not available in the buffer caches of
the other instances. The cost of a block access and cache coherency can be
determined by CGS statistics and GCS events. CGS statistics and CGS events
can gauge what is going on and can be a useful source of information for
diagnostics.
The response time for the cache fusion transfers are determined by:
Physical private interconnects - More than one interconnect is
required, the more interconnects the more redundancies and higher
bandwidth for messages and cache fusion block transfer are available.
Achieving low latencies is the objective. Private interconnects are
required. Public corporate LAN might have a high bandwidth but have a
low latency due to high retransmissions on encountered collisions.
Interconnect performance depends on the speed that is set and
redundancy.
IPC protocol – Oracle RAC tries to use user mode IPC inter process
communication for sending data from one node to another as it does
not require context switch and does not require kernel mode and runs in
user application program mode. IPC protocol depends on the vendor of
the hardware.
GCS protocol - GCS protocol depends on IPC protocol and private
interconnect and is not directly affected by disk I/O except of disk
I/O for the log write I/O whenever a dirty block in the buffer cache
that is send over the interconnect to another instance for cache fusion
reason either in write-read or write-write situation.
The response time is not generally affected by disk I/O factors except for
the occasional log write done when sending a dirty buffer to another instance
in a write-read or write-write situation. For example a block is updated in
transaction in buffer cache in instance A and the very same block image is
transferred via the cache fusion traffic mechanism to buffer cache in
instance C. We have to guarantee that redo log is written to the redo log
files first. Other than that there is no much disk I/O performed. For example
if there are 1000th updates they will result in doing much more redo than
doing more reads. Heavy updates transactions will incur more disk I/O for the
redo than doing more reads. The cache fusion response time is not generally
affected by disk I/O factors except for the occasional log write done when
sending a dirty buffer to another instance in write-read or write-write
situation.
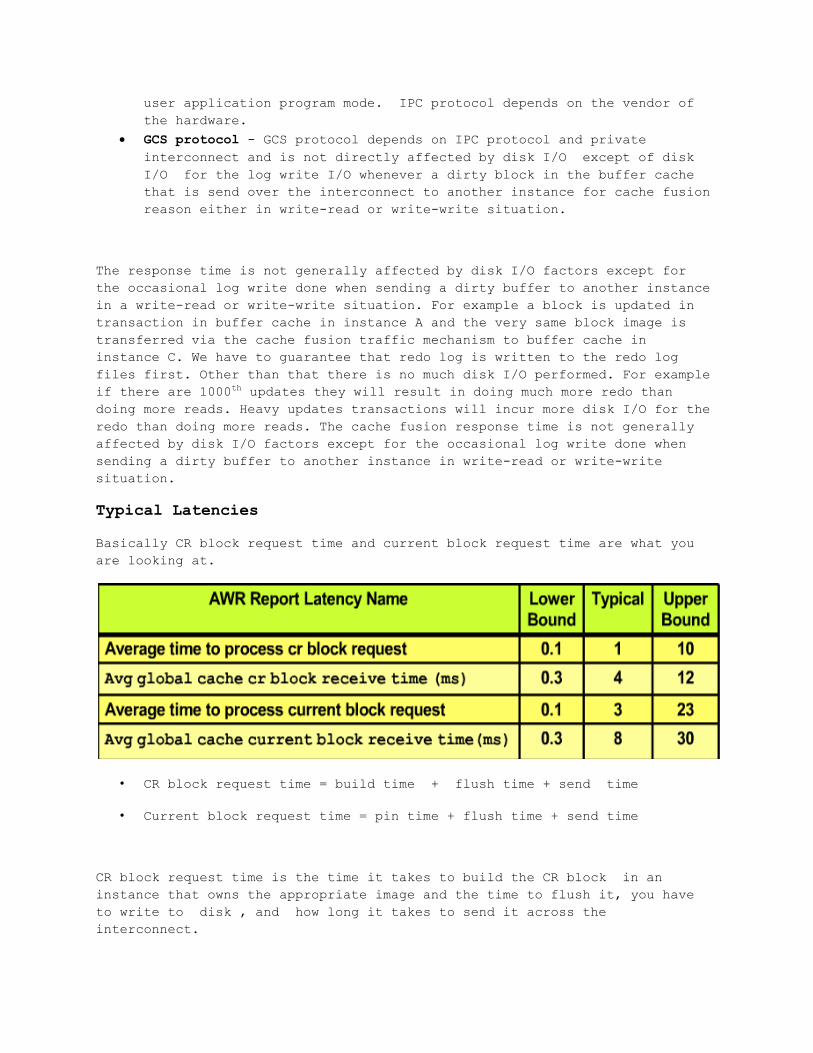
Typical Latencies
Basically CR block request time and current block request time are what you
are looking at.
• CR block request time = build time + flush time + send time
• Current block request time = pin time + flush time + send time
CR block request time is the time it takes to build the CR block in an
instance that owns the appropriate image and the time to flush it, you have
to write to disk , and how long it takes to send it across the
interconnect.
Current block request time is how long it takes to pin the image in an
instance that owns the block image and time it takes to flush it and send it
across, because you cannot send it while some is changing that block at the
same time. That is why you need to pin the block in exclusive mode then flush
it and send it over the interconnect.
The statistics come from v$sysstat. Always query v$sysstat for the statistics
or gv$sysstat.
Other latencies comes from v$ges_statistics or GV$ges_statistics view.
Latencies are dependent upon:
Utilization of the IPC protocol
Scheduling delays when the system is under high CPU or memory
utilization
Log flushes for current blocks served
What you are primarily concerned are the average time to process CR block and
the average time to process current block. Those shown values are typical. If
overtime those times start to grow it might mean that you need to explore why
it is taking longer. you might need to look at the wait events and the
possible causes for those latencies to be growing. You need to determine why
the things are changing and getting worst over time.
Waits in RAC environment
Wait events for RAC are very interesting in that like any other wait events
show you all various things a session can wait on helping you identify what
problem can be. RAC introduces an area that you do not need in a single
instance environment.
Let’s review v$session_wait view. Oracle includes some common columns in
v$session and v$session_wait views. The interesting columns are wait_time and
event containing the name of the event in both views. If a session is
waiting for something then when you query v$session_wait the event column
would contain the name of event what a session is waiting on, for example db
sequential read or log file parallel write occur in log writer (LGWR) as part
of normal activity of copying records from the redo log buffer to the current
online log or log file sync log when you commit also referred as a commit
latency. If wait_time is 0 event shows what is waiting. If wait_time is
greater than 0 event shows how long last event waited. If wait_time is -2
init parameter timed_statistics is not set. If wait_time is -1 wait_time is
less than a hundred of a second and wait event is not captured.
For single instance, situation is simple, row in v$session_wait view
represents either currently waiting 0 or something waited. RAC introduces
complexity. When cache fusion is being done server process cannot do I/O as
it wants. A single instance server process do I/O as it wants if a buffer is
not in the buffer cache issues a requests and waits, for example db
sequential read, and when I/O completes continues. In RAC server process
makes a request to LMS background process handling cache fusion and when LMS
gets involved there are several possibilities
one is that the instance requesting I/O have a valid copy of the block
image in its own buffer cache and have enough information for the
metadata global resource directory GRD and everything can be done
locally without a block transfer
another scenario is when the requesting instance A does not have the
metadata and another instance B have the GRD metadata for example block
m in file n and to get the global resource metadata will require a hop
and will get to instance B in order to obtain GRD metadata to identify
the instance that have a valid copy of the block and if the block is
either in instance A or B there are 2 hops as we already have 2 nodes
involved.
Worst possible scenarios irrelevant to how many instances we have,
assuming we have more than two instances, is when the instance that
makes the request does not have the image copy of the block neither the
global resource directory metadata for the block. In this case the LMS
talk to LMS having the metadata who talks to LMS on a third instance
that have the block image and the third instance using user mode IPC
sends the block image to the first instance A requesting the block
image. In the latter scenario you have a three hop situation. Three hop
situation is the worst possible situation regardless of the number of
nodes.
To summarize you have a requesting instance where the initial request is made
for a block image by the server process, you have the instance that serves
the image called the owning or serving instance and you have the instance
that own the metadata in GRD for the particular block number and file number
that is referred to as a mastering instance. The worst situation is when the
owning, master and requesting instances are separate instances. The best case
is when they are in the same instance. All wait events related to the global
cache are then collected in the cluster wait class in V$ or OEM DC/GC. Wait
events for RAC help you analyze what sessions are waiting for. Wait times are
attributed to events that reflects the outcome of a request. Global cache
waits are summarized in a broader category called cluster wait class. These
events are used in ADDM or (G)V$ views to enable cache fusion diagnostics.
Wait times in RAC are attributed to events that reflect the outcome of
a request in (g)v$session_wait :
o Placeholders while waiting – wait_time = 0
o Actual events after waiting – wait_time != 0
While making a request and waiting there is a placeholder event and wait_time
is 0. When a block is received the placeholder event gets replaced by the
actual event and the wait_time reflects that time waited.
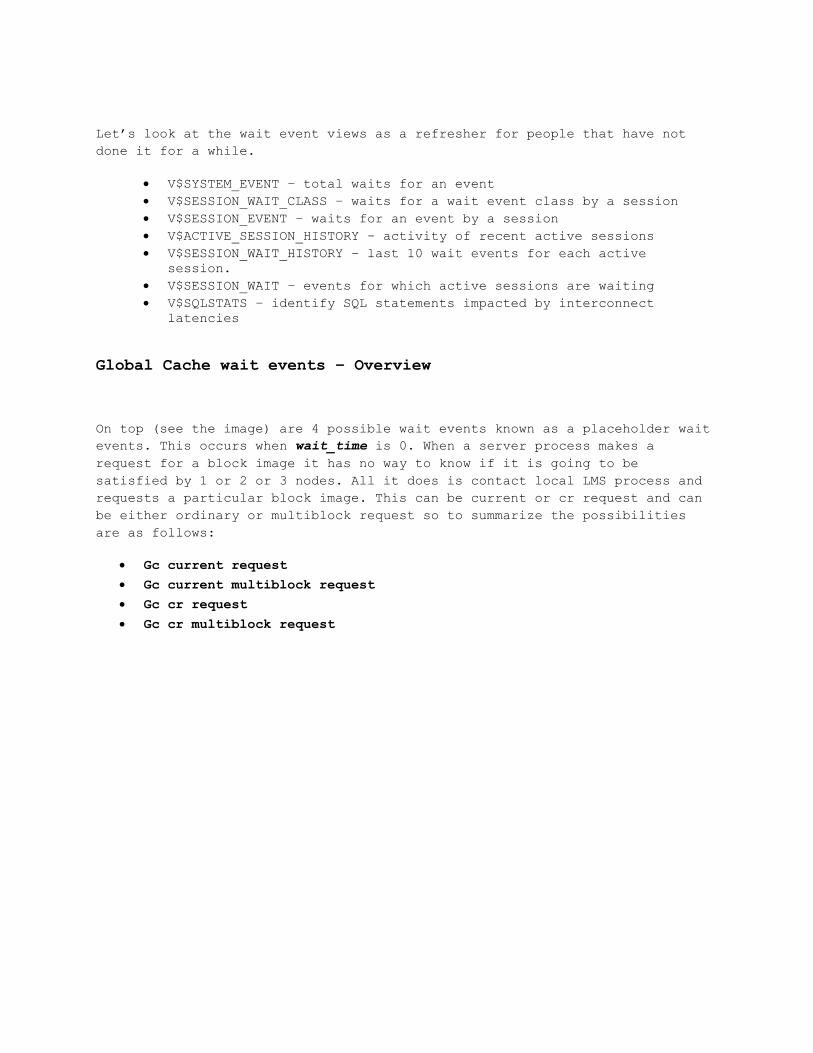
Let’s look at the wait event views as a refresher for people that have not
done it for a while.
V$SYSTEM_EVENT – total waits for an event
V$SESSION_WAIT_CLASS – waits for a wait event class by a session
V$SESSION_EVENT – waits for an event by a session
V$ACTIVE_SESSION_HISTORY – activity of recent active sessions
V$SESSION_WAIT_HISTORY – last 10 wait events for each active
session.
V$SESSION_WAIT – events for which active sessions are waiting
V$SQLSTATS – identify SQL statements impacted by interconnect
latencies
Global Cache wait events – Overview
On top (see the image) are 4 possible wait events known as a placeholder wait
events. This occurs when wait_time is 0. When a server process makes a
request for a block image it has no way to know if it is going to be
satisfied by 1 or 2 or 3 nodes. All it does is contact local LMS process and
requests a particular block image. This can be current or cr request and can
be either ordinary or multiblock request so to summarize the possibilities
are as follows:
Gc current request
Gc current multiblock request
Gc cr request
Gc cr multiblock request
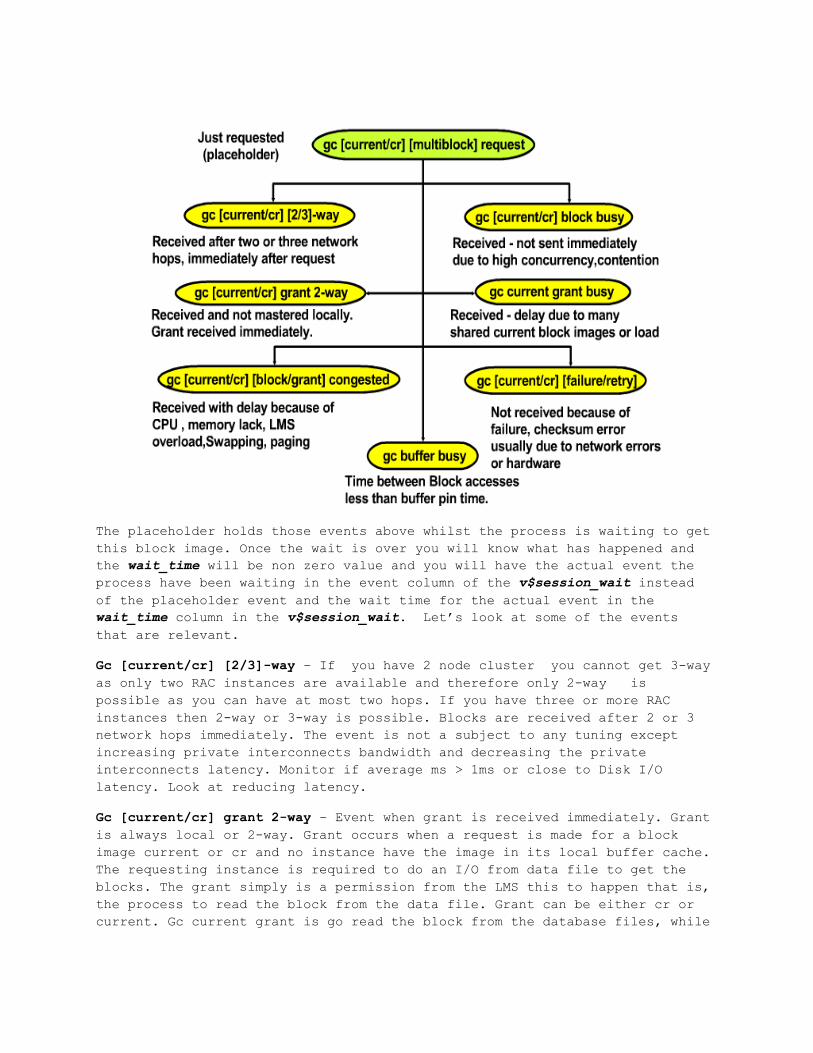
The placeholder holds those events above whilst the process is waiting to get
this block image. Once the wait is over you will know what has happened and
the wait_time will be non zero value and you will have the actual event the
process have been waiting in the event column of the v$session_wait instead
of the placeholder event and the wait time for the actual event in the
wait_time column in the v$session_wait. Let’s look at some of the events
that are relevant.
Gc [current/cr] [2/3]-way – If you have 2 node cluster you cannot get 3-way
as only two RAC instances are available and therefore only 2-way is
possible as you can have at most two hops. If you have three or more RAC
instances then 2-way or 3-way is possible. Blocks are received after 2 or 3
network hops immediately. The event is not a subject to any tuning except
increasing private interconnects bandwidth and decreasing the private
interconnects latency. Monitor if average ms > 1ms or close to Disk I/O
latency. Look at reducing latency.
Gc [current/cr] grant 2-way – Event when grant is received immediately. Grant
is always local or 2-way. Grant occurs when a request is made for a block
image current or cr and no instance have the image in its local buffer cache.
The requesting instance is required to do an I/O from data file to get the
blocks. The grant simply is a permission from the LMS this to happen that is,
the process to read the block from the data file. Grant can be either cr or
current. Gc current grant is go read the block from the database files, while

gc cr grant is read the block from disk and build a read consistent block
once is read.
Gc [current/cr][block/grant] congested – means that it has been received
eventually but with a delay because of intensive CPU consumption, memory
lack, LMS overload due to much work in the queues, paging, swapping. This is
worth investigating as it provides a room for improvement. You should look at
it as it indicates that LMS could not dequeue message fast enough.
Gc [current/cr] block busy – Received but not sent immediately due to high
concurrency or contention. This means that the block is busy for example
somebody issue block recover command from RMAN. Variety of reasons for being
busy just means cannot be sent immediately but not because of memory, LMS or
system oriented reasons but Oracle oriented reasons. It is also worth
investigating.
Gc current grant busy – Grant is received but there is a delay due to many
shared block images or load. For example you are extending the high water
mark and you are formatting the block images or blocks with block headers.
Gc [current/cr][failure/retry] - Not received because of failure, checksum
error usually in the protocol of the private interconnect due to network
errors or hardware problems. This is something worth investigating. Failure
means that cannot receive the block image while retry means that the problems
recovers and ultimately the block image can be received but it needs to
retry.
Gc buffer busy – time between block accesses less than buffer pin time. Pin
buffers can be in exclusive or shared mode depending if buffers can be
modified or read only. Obviously if there is a lot of contention for the same
block by different processes this event can manifest itself in grater
magnitude. Buffer busy are global cache events as a request is made from one
instance and the block is available in another instance and the block is busy
due to contention.
The key to understand is that there are separate wait events for the
placeholder and when the event is over this event is replaced in
v$session_wait with different event depending on how many hops there were,
what kind of request was, what happened, was there a congestion, busy,
failure or retry. Looking at (g)v$ views or AWR reports you need to see if
you observe congestion, busy, failure, retry and investigate further.
Examples:
GC Current block 2-way
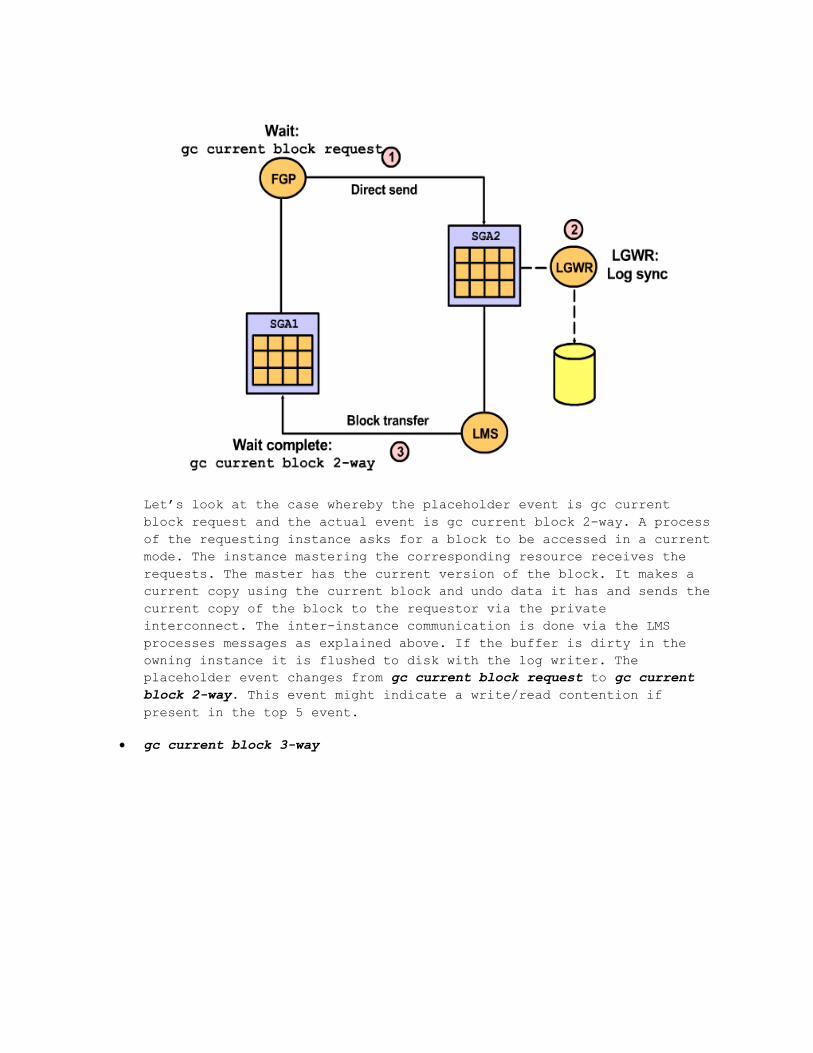
Let’s look at the case whereby the placeholder event is gc current
block request and the actual event is gc current block 2-way. A process
of the requesting instance asks for a block to be accessed in a current
mode. The instance mastering the corresponding resource receives the
requests. The master has the current version of the block. It makes a
current copy using the current block and undo data it has and sends the
current copy of the block to the requestor via the private
interconnect. The inter-instance communication is done via the LMS
processes messages as explained above. If the buffer is dirty in the
owning instance it is flushed to disk with the log writer. The
placeholder event changes from gc current block request to gc current
block 2-way. This event might indicate a write/read contention if
present in the top 5 event.
gc current block 3-way
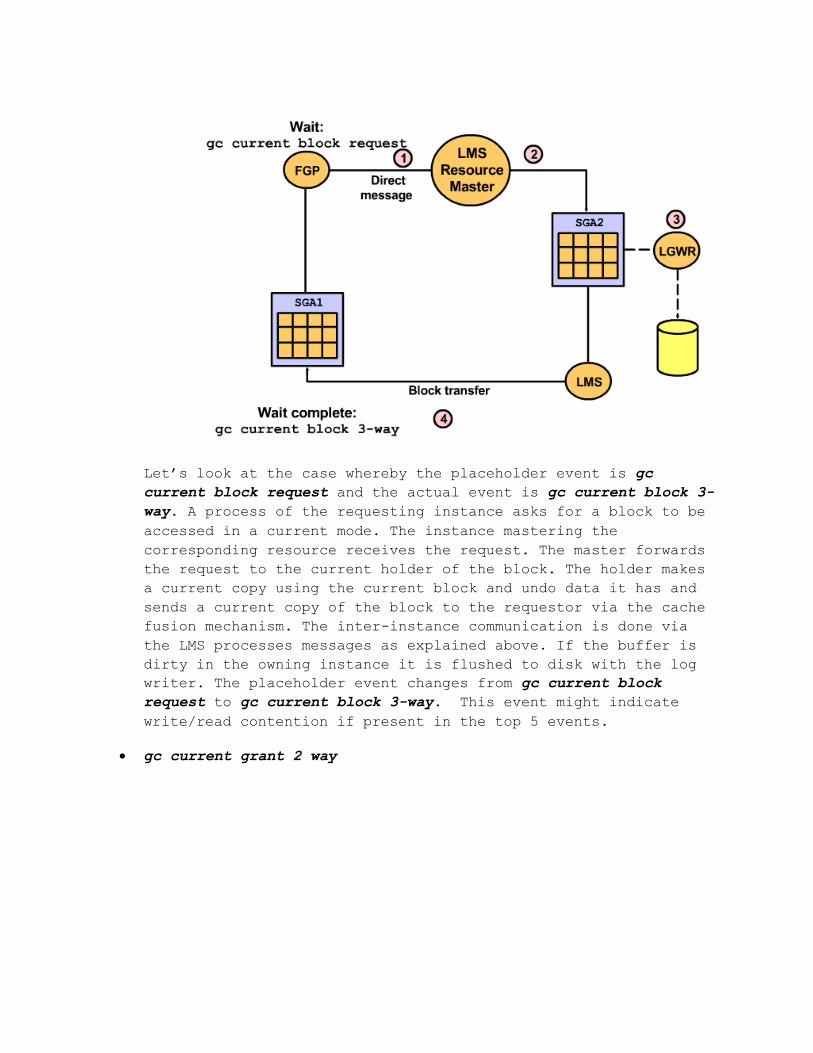
Let’s look at the case whereby the placeholder event is gc
current block request and the actual event is gc current block 3-
way. A process of the requesting instance asks for a block to be
accessed in a current mode. The instance mastering the
corresponding resource receives the request. The master forwards
the request to the current holder of the block. The holder makes
a current copy using the current block and undo data it has and
sends a current copy of the block to the requestor via the cache
fusion mechanism. The inter-instance communication is done via
the LMS processes messages as explained above. If the buffer is
dirty in the owning instance it is flushed to disk with the log
writer. The placeholder event changes from gc current block
request to gc current block 3-way. This event might indicate
write/read contention if present in the top 5 events.
gc current grant 2 way
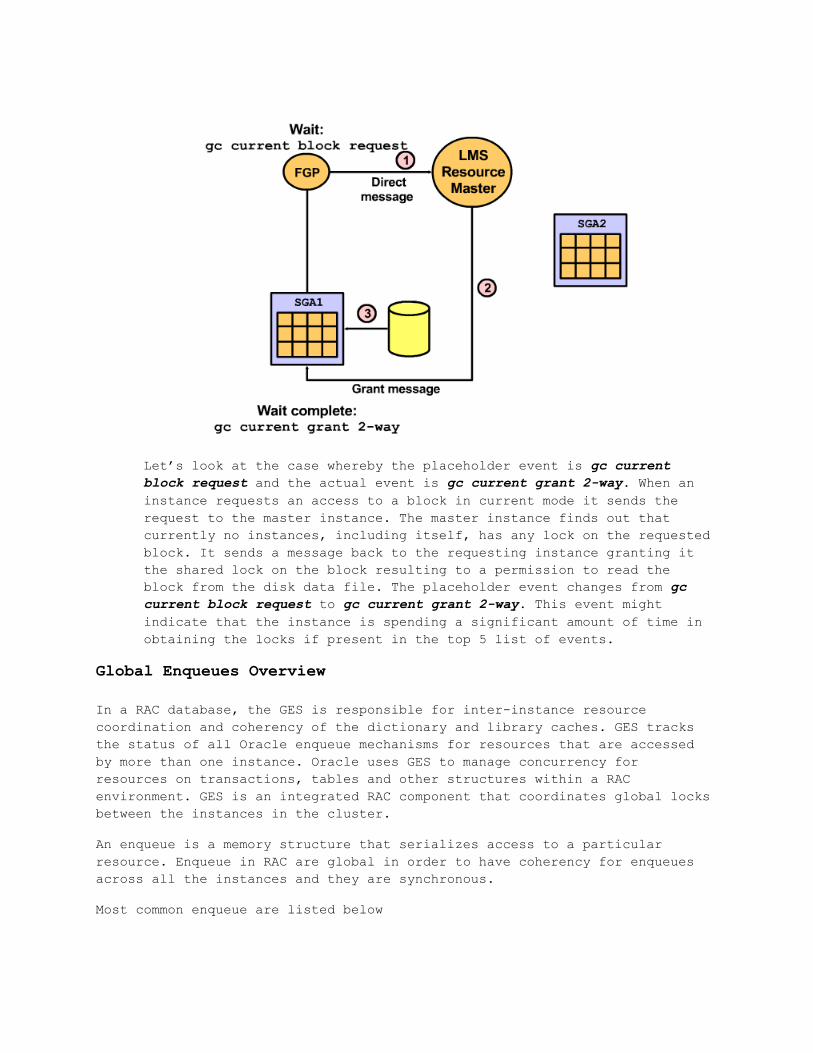
Let’s look at the case whereby the placeholder event is gc current
block request and the actual event is gc current grant 2-way. When an
instance requests an access to a block in current mode it sends the
request to the master instance. The master instance finds out that
currently no instances, including itself, has any lock on the requested
block. It sends a message back to the requesting instance granting it
the shared lock on the block resulting to a permission to read the
block from the disk data file. The placeholder event changes from gc
current block request to gc current grant 2-way. This event might
indicate that the instance is spending a significant amount of time in
obtaining the locks if present in the top 5 list of events.
Global Enqueues Overview
In a RAC database, the GES is responsible for inter-instance resource
coordination and coherency of the dictionary and library caches. GES tracks
the status of all Oracle enqueue mechanisms for resources that are accessed
by more than one instance. Oracle uses GES to manage concurrency for
resources on transactions, tables and other structures within a RAC
environment. GES is an integrated RAC component that coordinates global locks
between the instances in the cluster.
An enqueue is a memory structure that serializes access to a particular
resource. Enqueue in RAC are global in order to have coherency for enqueues
across all the instances and they are synchronous.
Most common enqueue are listed below
TX - transaction enqueue representing either row lock waits or ITL
waits
TM - table manipulation enqueue on any table with DML. For example
update block in one instance and truncate, drop or collect
statistics in another instance on the same table.
HW – high watermark enqueue when there is extending of HW on a
segment
TA – transaction recovery enqueue
SQ – sequence generation enqueue
US - undo segment enqueue for managing undo segments extension
The waits may constitute serious serialization points because enqueue are
often even in a single instance and in RAC in addition to serialization that
occurs due to enqueus they are exacerbated due to the private interconnect
latency and overhead. If something does not scale well in a single instance
it will not scale well in RAC due to contention problems and additional
overhead contributed by the private interconnect latencies.
Session and System Statistics
There are various dynamic views to look at in order to diagnose performance
problems with RAC environments.
V$SYSSTAT to characterize the workload.
V$SESSSTAT to monitor important sessions.
V$SEGMENT_STATISTICS includes RAC statistics on a per-segment basis
identifying which segments are hot in regards to GES and GCS. Helps
to identify segments that are contended over the interconnect.
V$ENQUEUE_STATISTICS determines the enqueues with the highest
impact.
V$INSTANCE_CACHE_TRANSFER breaks down GCS statistics into block
classes. What kind of blocks, data blocks or index blocks etc, are
giving the most contention.
RAC relevant statistics group are:
Global Cache Service statistics
Global Enqueue Service statistics
Statistics for messages send
IPC configuration
CGS protocol depends on the IPC protocol and private interconnect. You
can look at configuring the following for IPC
Socket buffer size: net.core.rmem_max, net.core.wmem_max.
Interface queue size: increase the size of the interface queue i.e. the
transmit queue of the network interface issue the following command
using ifconfig.
o # ifconfig eth0 txqueuelen 10000
Input queue size: netdev_max_backlog specifies the maximum length of
the input queues for the processors. The default value is 300
(packets). Linux has to wait up to scheduling time to flush buffers.
Therefore, this value can limit the network bandwidth when receiving
packets. If you want to get higher throughput, you need to condider
increasing netdev_max_backlog
GCS processing
Latency of the GCS can be contributed by
CPU starvation
Memory starvation
IPC latencies
LMS configuration
In case of LMS congestion that is, when LMS cannot dequeue messages fast
enough look at the GCS_SERVER_PROCESSES.
In 10g GCS_SERVER_PROCESSES is 2 by default. In 11g for one CPU, there is one
GCS server process. For 2 - 8 CPUs, there will be 2 GCS server processes. For
more than 8 CPUs, the number of GCS server processes will be equal to the
number of CPUs divided by 4. If the result includes a fraction, ignore the
fraction. For example, if you had 10 CPUs, then 10/4 would mean 2 GCS
processes.
Let’s put it all together.
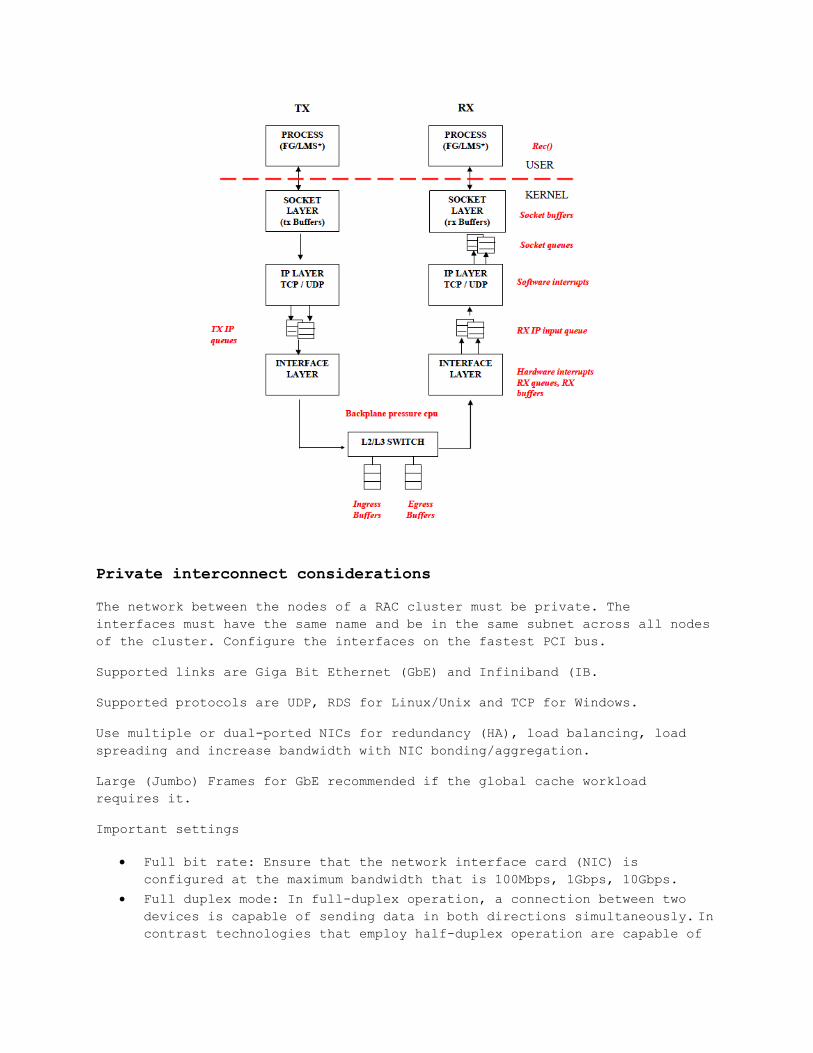
Private interconnect considerations
The network between the nodes of a RAC cluster must be private. The
interfaces must have the same name and be in the same subnet across all nodes
of the cluster. Configure the interfaces on the fastest PCI bus.
Supported links are Giga Bit Ethernet (GbE) and Infiniband (IB.
Supported protocols are UDP, RDS for Linux/Unix and TCP for Windows.
Use multiple or dual-ported NICs for redundancy (HA), load balancing, load
spreading and increase bandwidth with NIC bonding/aggregation.
Large (Jumbo) Frames for GbE recommended if the global cache workload
requires it.
Important settings
Full bit rate: Ensure that the network interface card (NIC) is
configured at the maximum bandwidth that is 100Mbps, 1Gbps, 10Gbps.
Full duplex mode: In full-duplex operation, a connection between two
devices is capable of sending data in both directions simultaneously. In contrast technologies that employ half-duplex operation are capable of
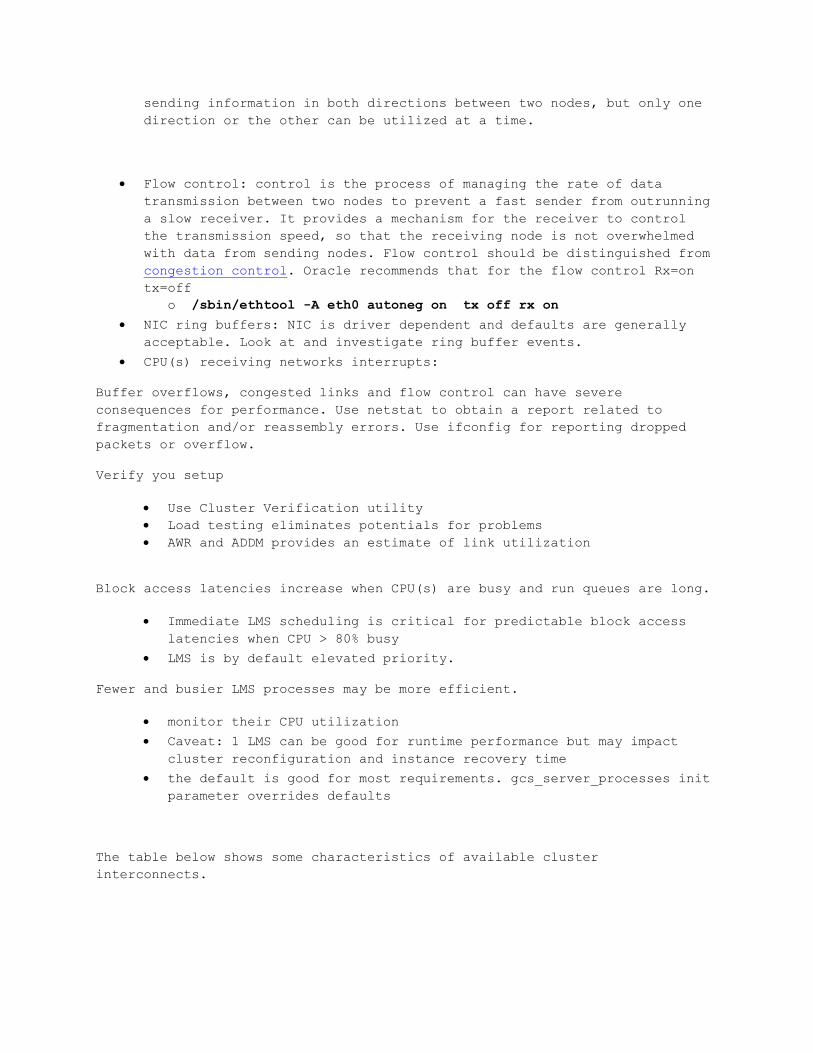
sending information in both directions between two nodes, but only one
direction or the other can be utilized at a time.
Flow control: control is the process of managing the rate of data
transmission between two nodes to prevent a fast sender from outrunning
a slow receiver. It provides a mechanism for the receiver to control
the transmission speed, so that the receiving node is not overwhelmed
with data from sending nodes. Flow control should be distinguished from
congestion control. Oracle recommends that for the flow control Rx=on
tx=off
o /sbin/ethtool -A eth0 autoneg on tx off rx on
NIC ring buffers: NIC is driver dependent and defaults are generally
acceptable. Look at and investigate ring buffer events.
CPU(s) receiving networks interrupts:
Buffer overflows, congested links and flow control can have severe
consequences for performance. Use netstat to obtain a report related to
fragmentation and/or reassembly errors. Use ifconfig for reporting dropped
packets or overflow.
Verify you setup
Use Cluster Verification utility
Load testing eliminates potentials for problems
AWR and ADDM provides an estimate of link utilization
Block access latencies increase when CPU(s) are busy and run queues are long.
Immediate LMS scheduling is critical for predictable block access
latencies when CPU > 80% busy
LMS is by default elevated priority.
Fewer and busier LMS processes may be more efficient.
monitor their CPU utilization
Caveat: 1 LMS can be good for runtime performance but may impact
cluster reconfiguration and instance recovery time
the default is good for most requirements. gcs_server_processes init
parameter overrides defaults
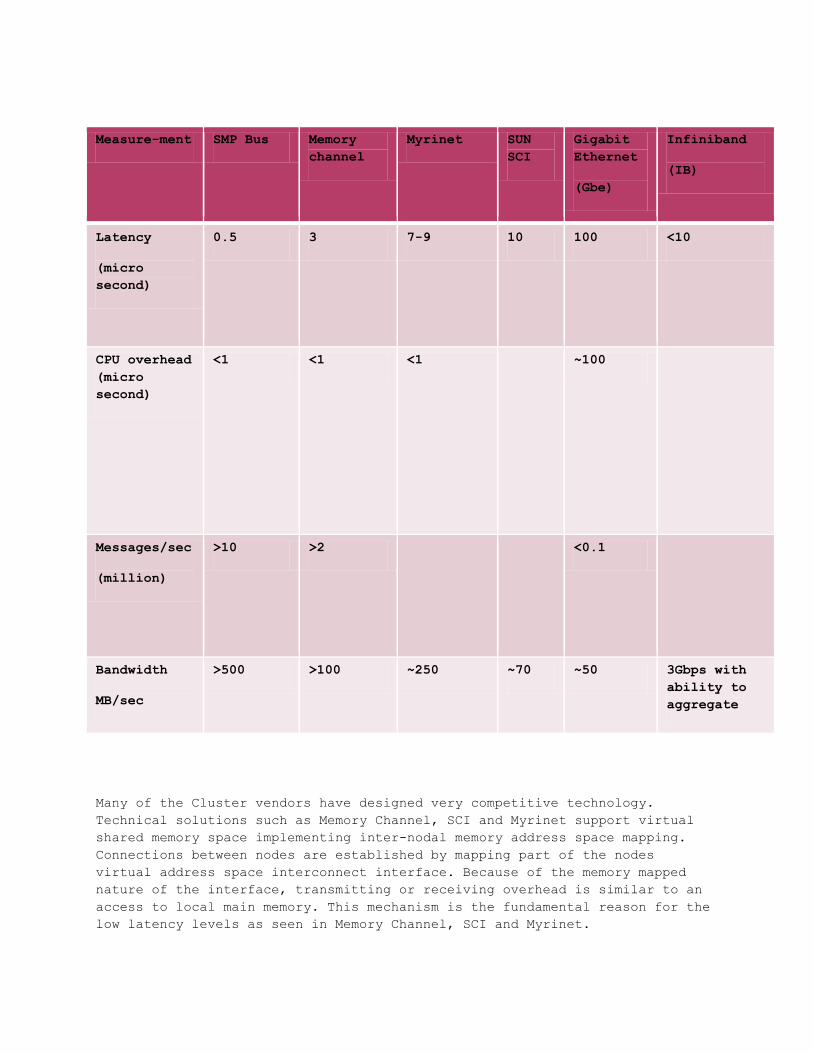
The table below shows some characteristics of available cluster
interconnects.
Measure-ment SMP Bus Memory
channel
Myrinet SUN
SCI
Gigabit
Ethernet
(Gbe)
Infiniband
(IB)
Latency
(micro
second)
0.5 3 7-9 10 100 <10
CPU overhead
(micro
second)
<1 <1 <1 ~100
Messages/sec
(million)
>10 >2 <0.1
Bandwidth
MB/sec
>500 >100 ~250 ~70 ~50 3Gbps with
ability to
aggregate
Many of the Cluster vendors have designed very competitive technology.
Technical solutions such as Memory Channel, SCI and Myrinet support virtual
shared memory space implementing inter-nodal memory address space mapping.
Connections between nodes are established by mapping part of the nodes
virtual address space interconnect interface. Because of the memory mapped
nature of the interface, transmitting or receiving overhead is similar to an
access to local main memory. This mechanism is the fundamental reason for the
low latency levels as seen in Memory Channel, SCI and Myrinet.
Aggregation
Aggregation is the ability of having separate physical NIC to operate
together as one logical interface. The aggregated logical interface can
operate in one of two modes:
Active - Standby: providing high availability and fault tolerance
Active – Active: providing high availability, fault tolerance and
increased bandwidth equal to the sum of all bandwidths of aggregated
interfaces.
Some of the Aggregation solutions are:
Cisco Etherchannel based 802.3ad
AIX Etherchannel
HPUX Auto Port Aggregation
SUN Trunking, IPMP, GLD
Linux Bonding (only certain modes)
Windows NIC teaming
Wait events worth investigation
Let’s look at some of the wait events which are worth further investigation
as they represent a potential performance problem if the wait time is
excessive or the event wait time is among the top 5 list in AWR report.
1. gc cr/current blocks lost: This event shows block losses during
transfers. This event almost always represents a severe performance
problem and can reveal network congestion involving discarded packets
and fragments, packet reassembly or timeouts, buffers overflows, flow
control. Checksum errors or corrupted headers are also often the reason
for the wait event. It is worth investigating the IPC configuration and
possible downstream network problems (NIC, switch etc). Operating
system data needs to be gathered with ifconfig, netstat and sar to name
a few. ‘cr request retry’ event is likely to be seen when ‘gc cr blocks
lost’ show up. High values indicate network problems. The use of an
unreliable IPC protocol such as UDP may result in the value for global
cache blocks lost being non-zero. Common problems and symptoms are:
Interconnect or Switch Problems
System load and scheduling
Contention
Unexpectedly high global cache latencies
Check for miss-configured or faulty interconnects that can cause:
Dropped packets/fragments
Buffer overflows
Packet reassembly failures or timeouts
Ethernet Flow control kicks in
TX/RX errors
Solution
Fix interconnect NICs and switches
Tune IPC buffer sizes
2. gc block corrupt: This event shows if any blocks were corrupted during
transfers. If high values are observed, there is probably an IPC,
network or hardware problem.
3. global cache null to s and global cache null to x: These events are
generated by inter-instance block ping across the network. Inter-
instance block ping is when two instances exchange the same block back
and forth. Processes waiting for global cache null to s events are
waiting for a block to be transferred from the instance that last
changed it. When one instance repeatedly requests cached data blocks
from the other RAC instances, these events consume a greater proportion
of the total wait time. The only method for reducing these events is to
reduce the number of rows per block to eliminate the need for block
swapping between two instances in the RAC cluster. You can also look at
implementing logical partitioning where the activity is on a selected
instance. Frequent commits can also reduce some inter-instance
transfers.
4. global cache cr request: This event is generated when an instance has
requested a consistent read data block and the block to be transferred
had not arrived at the requesting instance. Other than examining the
cluster interconnects for possible problems, there is nothing that can
be done about this event.
5. gc buffer busy: This event can be associated with buffer cache
contention. However, note than there can be a multiple symptoms for the
same cause. It can be seen together with ‘db file scattered reads’
event. Global cache access and serialization attributes to this event.
6. congested: tells that The LMS cannot dequeue messages fast enough. The
events that contain ‘congested’ suggest CPU saturation (runaway or
spinning processes), long running queues, network configuration issues.
It indicates performance problems. While investigating need to maintain
a global view and remember that symptom and cause can be on different
instances. This event can also happen if LSM cannot dequeue messages
fast enough. gcs_server_processes init parameter controls number of LMS
processes although in most of the cases the default value is
sufficient. Excessive memory consumption leading to memory swapping
can be another reason.
7. busy: The events that contain ‘busy’ indicate contention. It needs
investigation by drilling down into either SQL with highest cluster
wait time or segment statistics with highest block transfers. Also look
at objects with highest number of block transfers and global
serialization.
8. Gc [current/cr] [2/3]-way – If you have 2 node cluster you cannot get
3-way as only two RAC instances are available and therefore only 2-way
is possible as you can have at most two hops. If we have three or more
RAC instances then 2-way or 3-way is possible. Events are received
after 2 or 3 network hops immediately. The event is not a subject to
any tuning except increasing private interconnects bandwidth and
decreasing the private interconnects latency. The objective, if seen in
the top 5 events, is to lower the latency. High Latencies are addressed by:
Check network configuration
o Make sure that is private (do not share traffic)
o Make sure that is running at expected bit rate
Find cause of high CPU consumption or high memory consumption
o Runaway or spinning processes
9. Gc [current/cr] grant 2-way – Event when grant is received immediately.
Grant is always local or 2-way. Grant occurs when a request is made for
a block image current or cr and no instance have the image in its local
buffer cache. The requesting instance is required to do an I/O from
data file to get the blocks. The grant simply is a permission from the
LMS this to happen that is, the process to read the block from the data
file. Grant can be either cr or current. Gc current grant is go read
the block from the database files, while gc cr grant is read the block
from disk and build a read consistent block once is read. The event is
not a subject to any tuning except increasing private interconnects
bandwidth and decreasing the private interconnects latency.
10. Gc [current/cr][block/grant] congested – means that it has been
received eventually but with a delay because of intensive CPU
consumption, memory lack, LMS overload due to much work in the queues,
paging, swapping. This is worth investigating as it provides a room for
improvement. Look at congested.
11. Gc [current/cr] block busy – Received but not sent immediately
due to high concurrency or contention. This means that the block is
busy for example somebody issue block recover command from RMAN.
Variety of reasons for being busy just means cannot be sent immediately
but not because of memory, LMS or system oriented reasons but Oracle
oriented reasons. Look for reducing concurrency and contention.
12. Gc current grant busy – Grant is received but there is a delay
due to many shared block images or load. For example we are extending
the high water mark and we are formatting the block images or blocks
with block headers.
13. Gc [current/cr][failure/retry] - Not received because of
failure, checksum error usually in the protocol of the private
interconnect due to network errors or hardware problems. This is
something worth investigating. Failure means that cannot receive the
block image while retry means that the problem recovers and ultimately
the block image can be received but it needs to retry.
14. Gc buffer busy – time between block accesses less than buffer pin
time. Pin buffers can be in exclusive or shared mode depending if
buffers can be modified or read only. Obviously if there is a lot of
contention for the same block by different processes this event can
manifest itself in grater magnitude. Buffer busy are global cache
events as a request is made from one instance and the block is
available in another instance and the block is busy due to contention.
Identify the ‘hot’ blocks in the application. Reduce the concurrency on
the hot blocks.
15. gc current grant busy – events that can be seen in applications
with high insert rates where there is a serialization on HWM enqueue.
Perform a top down approach for performance analysis can be helpful. You can
start with ADDM analysis then continue with AWR detail statistics and
historical data and last but not least ASH will provide you with finer-
grained session specific data.
Practical performance tuning considerations for RAC
Application tuning and modifying schema design is often the most beneficial
performance solution when migrating to RAC. In case you are on RAC following
the single instance tuning methodology and avoiding serialization reduces the
private interconnect overhead.
Resize and tune the buffer cache when migrating from a single instance
database to RAC to accommodate the CGS, GES and GRD overhead.
Reduce full table scans in OLTP systems while doing updates and separate
batch from OLTP at the same time. In RAC when you do a full table scan the
instance doing them needs to build a read consistent version of the blocks
and if the modifications are done across many instances than the undo needs
to be shipped from across all the instances. The latter is a lot of
unnecessary traffic. It is recommended if possible that operationally OLTP
and DSS be scheduled so that they do not overlap in order to improve
performance.
Use Automatic Segment Space Management. ASSM helps for RAC high insert
intensive applications to avoid issues previously encountered and associated
with free lists and free list groups and older ways Oracle used to manage
space in segments. ASSM also provides an instance affinity to table blocks.
Use sequence caching in RAC. Caching Oracle sequences can reduce index
contention. If your business permits to have application logic where the
numbers generated by the sequence are not ordered across all instances than
you can use an Oracle sequence generated using cache number noorder clause.
When you cache a sequence using cache number noorder clause on every instance
you achieve a logical partitioning whereby the index keys on each instance
are non-overlapping and each instance accesses a separate portion of the
index tree. Successive index block splits can create instance affinity for
the index blocks. Thus, you can avoid interconnect overhead while using
indexes by avoiding a hot blocks being shipped back and forth across all
instances.
Undo considerations in RAC. Undo is very expensive in RAC. Maintain a global
view and understand that cause and symptoms can be on different instances and
remember that UNDO is generated and handled on each instance. Avoid frequent
reads of index blocks containing active transactions from many instances that
result into excessive undo shipment across instances and undo contention.
Undo block shipment may become a bottleneck if either
Excessive amount of index blocks are changed by multiple instances
Transaction duration is longer
This can often be seen in application that frequently read recently modified
or inserted data but commit infrequently. You can avoid it if you use
Short transactions to reduce the probability that a index block in the
cache has uncommitted data, thereby reducing the need to access undo
information for consistent read
Increased Oracle sequence cache sizes to reduce inter-instance
concurrent access to index blocks. CR versions of index blocks modified
by only one instance can be fabricated without the need of remote undo
block shipping.
In RAC shipment of undo, via the interconnect, introduces an extra overhead
as undo is obtained from the instance where the DML took place.
High water mark considerations for high volume insert applications. For
applications with high rate of inserts new blocks need to be allocated to the
segment. New blocks are made available while serializing on HWM enqueue.
Solution is to use large uniform extent sizes for the locally managed and
automatic space managed segments that are subject to high-volume inserts.
Concurrent cross-instance calls considerations in RAC. Every time a table is
truncated there is a checkpoint. In RAC there is cross-instance call to flush
dirty blocks of the table that may be spread across all RAC instances. In
some applications it is not uncommon to see a lot of truncate operations on
tables containing temporary data. In RAC truncating tables concurrently from
different instances does not scale well because it constitutes a point of
serialization due to the fact that while the first truncate command is
happening, the second has to wait until the first one completes.
Use partitioning to reduce inter-instance traffic. Partitioning using
services allow us to avoid a lot of cache fusion overhead by having
partitions accessed by users connected to some instances and other partitions
accessed by users connected to other instances. It cannot be guaranteed but
helps under certain circumstances. Table and index partitioning schemes can
also reduce the interconnect traffic by reducing the data sets.
Avoid unnecessary parsing. In a single instance excessive parsing presents a
room of concern. In addition in RAC, GES is kept busy to synchronize the
library and row caches. You do not want this overhead.
Minimize locking usage. Contention is going to be exacerbated in RAC because
apart from the contention available in a single instance database in RAC you
have also an interconnect overhead, so minimizing the locking overhead is
very important in RAC environments. Typically this occurs with third party
applications that does a lot of locking overhead due to the fact that their
code is the same so that they can work on many database platforms. This is
worth investigating further. Using tables instead of Oracle sequences to
generate a unique numbers can be a serious problem as blocks will be cashed
across all instances and will be transmitted back and forth via the private
interconnect along with the undo from all instances.
Remove unselective indexes in OLTP as they are not used by CBO for access
method but while executing DML statements they steel need to be maintained.
That is an overhead generally speaking but in RAC we might end up having
those index blocks transferred by cache fusion. Removing unselective indexes
will improve performance. Index splits are another important activity that
you must be aware and look at.
Even in a single instance database applications with heavy inserts used to
suffer a bad performance due to the few factors such as:
monotonically ordered increasing values in the index (right edge
of the tree)
frequent index block splits
In RAC a global hot index block and index block splits will be also a problem
when you account for the cluster interconnect overhead. The primary objective
should be an approach aiming at equal and gradual distribution of the
concurrency in the index tree. Such a distribution can be achieved if you:
Use a global hash partitioned indexes
Use reverse key indexes
Use cached sequences for logical partitioning
Configure interconnect properly with high bandwidth and low latency. Look at
the private interconnect consideration section.
Sources:
1. Helali Bhuiyan, Mark McGinley, Tao Li, Malathi Veeraraghavan, 2. University of Virginia: TCP Implementation in Linux: A Brief Tutorial
3. Joel Goodman: RAC tuning tips
4. Barb Lundhild: Understanding RAC Internals
5. Mike Ault, Madhu Tumma: Oracle 10g Grid & RAC, ISBN: 0-9744355-4-6
6. Michael Zoll: Oracle Clusterware and Private Network Considerations
7. Tanel Poder: What is the purpose of segment level checkpoint before
DROP/TRUNCATE of a table?