ORAC and TEAC assays comparison to measure the antioxidant capacity of food products
7
Analytical Methods ORAC and TEAC assays comparison to measure the antioxidant capacity of food products Ana Zulueta, Maria J. Esteve, Ana Frígola * Área de Nutrición y Bromatología, Facultat de Farmàcia, Universitat de València, Avenida Vicent Andrés Estellés s/n, 46100 Burjassot, Valencia, Spain article info Article history: Received 15 April 2008 Received in revised form 18 July 2008 Accepted 11 September 2008 Keywords: ORAC TEAC Antioxidant capacity Orange juice Milk Orange juice-milk beverages abstract Oxygen radical antioxidant capacity (ORAC) and trolox equivalent antioxidant capacity (TEAC) assays were compared to estimate the total antioxidant capacity (TAC) of orange juice, milk, and an orange juice-milk beverage. When the TEAC method was used with this beverage, an increase in the concentra- tion of orange juice corresponded to an increase in TAC, but increasing the percentage of milk did not increase the TAC value. When the ORAC method was applied, it was seen that increased concentrations of juice or milk corresponded to greater antioxidant capacity. An evaluation was also made of the influ- ence of certain compounds (ascorbic acid, gallic acid, b-carotene, lutein, zeaxanthin and albumin) with antioxidant capacity that were present in the samples studied. Although the TEAC method is simpler and cheaper than the ORAC method, it gives an underestimate of the antioxidant capacity of foods or beverages of a more complex nature. Ó 2008 Elsevier Ltd. All rights reserved. 1. Introduction The measurement of the antioxidant capacity of food products is a matter of growing interest because it may provide a variety of information, such as resistance to oxidation, quantitative contri- bution of antioxidant substances, or the antioxidant activity that they may present inside the organism when ingested (Huang, Ou, & Prior, 2005; Serrano, Goñi, & Saura-Calixto, 2007). Mixtures of fruit juices and milk are a type of beverage present in the market that has the advantage of offering a single product that contains vitamin C, carotenoids, and phenolic compounds (from the fruit), together with proteins and calcium (from the milk). Wu et al. (2004) reported that fruit provides the largest con- tributions of antioxidants in the diet, mainly because of its abun- dance of vitamins, phenolic compounds and carotenoids, while Pulido, Hernández-García, and Saura-Calixto (2003) calculated that fruit juices contribute (approximately 5–6%) to the total antioxi- dant capacity in the Spanish diet. On the other hand, various stud- ies have shown that milk and some fractions of milk (whey, caseins, lactoferrin, albumin) have antioxidant activity (Chen, Lind- mark-Mansson, Gorton, & Akesson, 2003; Peña-Ramos & Xiong, 2001; Rival, Boeriu, & Wichers, 2001), and recently a milk peptide has been identified (Trp-Tyr-Ser-Leu-Ala-Met-Ala-Ser-Asp-Ile) with an antioxidant capacity higher than that of butylated hydroxyanisole (BHA) (Hernández-Ledesma, Dávalos, Bartolomé, & Amigo, 2005). Numerous in vitro studies have been conducted to evaluate the total antioxidant capacity (TAC) of food products. So far, however, there is no official standardised method, and therefore it is recom- mended that each evaluation should be made with various oxida- tion conditions and different methods of measurement (Frankel & Meyer, 2000). The methods for measuring antioxidant capacity are basically classified into two groups, depending on the reaction mechanism: methods based on hydrogen atom transfer (HAT) and methods based on electron transfer (ET) (Huang et al., 2005). The majority of HAT-based assays apply a competitive scheme, in which antioxidant and substrate compete for thermally generated peroxyl radicals through the decomposition of azo-compounds. ET- based assays measure the capacity of an antioxidant in the reduc- tion of an oxidant, which changes colour when reduced. The degree of colour change is correlated with the sample’s antioxidant concentrations. Trolox equivalent antioxidant capacity (TEAC) and oxygen rad- ical antioxidant capacity (ORAC) assays are the most popularly used ET and HAT methods, respectively. The main advantages and disadvantages of each of these methods are set out in Table 1 and have been considered at length in various reviews (Frankel 0308-8146/$ - see front matter Ó 2008 Elsevier Ltd. All rights reserved. doi:10.1016/j.foodchem.2008.09.033 Abbreviations: ORAC, oxygen radical antioxidant capacity; TEAC, trolox equiv- alent antioxidant capacity; AA, ascorbic acid; TE, trolox equivalents; FRAP, ferric reducing antioxidant power; TRAP, total reactive antioxidant potential; DPPH, 2,2- diphenyl-1-picrylhydrazyl. * Corresponding author. Tel.: +34 963544955; fax: +34 963544954. E-mail address: [email protected] (A. Frígola). Food Chemistry 114 (2009) 310–316 Contents lists available at ScienceDirect Food Chemistry journal homepage: www.elsevier.com/locate/foodchem
-
Upload
ana-zulueta -
Category
Documents
-
view
214 -
download
1
Transcript of ORAC and TEAC assays comparison to measure the antioxidant capacity of food products

Food Chemistry 114 (2009) 310–316
Contents lists available at ScienceDirect
Food Chemistry
journal homepage: www.elsevier .com/locate / foodchem
Analytical Methods
ORAC and TEAC assays comparison to measure the antioxidant capacityof food products
Ana Zulueta, Maria J. Esteve, Ana Frígola *
Área de Nutrición y Bromatología, Facultat de Farmàcia, Universitat de València, Avenida Vicent Andrés Estellés s/n, 46100 Burjassot, Valencia, Spain
a r t i c l e i n f o a b s t r a c t
Article history:Received 15 April 2008Received in revised form 18 July 2008Accepted 11 September 2008
Keywords:ORACTEACAntioxidant capacityOrange juiceMilkOrange juice-milk beverages
0308-8146/$ - see front matter � 2008 Elsevier Ltd. Adoi:10.1016/j.foodchem.2008.09.033
Abbreviations: ORAC, oxygen radical antioxidantalent antioxidant capacity; AA, ascorbic acid; TE, troreducing antioxidant power; TRAP, total reactive antidiphenyl-1-picrylhydrazyl.
* Corresponding author. Tel.: +34 963544955; fax:E-mail address: [email protected] (A. Frígola).
Oxygen radical antioxidant capacity (ORAC) and trolox equivalent antioxidant capacity (TEAC) assayswere compared to estimate the total antioxidant capacity (TAC) of orange juice, milk, and an orangejuice-milk beverage. When the TEAC method was used with this beverage, an increase in the concentra-tion of orange juice corresponded to an increase in TAC, but increasing the percentage of milk did notincrease the TAC value. When the ORAC method was applied, it was seen that increased concentrationsof juice or milk corresponded to greater antioxidant capacity. An evaluation was also made of the influ-ence of certain compounds (ascorbic acid, gallic acid, b-carotene, lutein, zeaxanthin and albumin) withantioxidant capacity that were present in the samples studied.
Although the TEAC method is simpler and cheaper than the ORAC method, it gives an underestimate ofthe antioxidant capacity of foods or beverages of a more complex nature.
� 2008 Elsevier Ltd. All rights reserved.
1. Introduction
The measurement of the antioxidant capacity of food productsis a matter of growing interest because it may provide a varietyof information, such as resistance to oxidation, quantitative contri-bution of antioxidant substances, or the antioxidant activity thatthey may present inside the organism when ingested (Huang, Ou,& Prior, 2005; Serrano, Goñi, & Saura-Calixto, 2007).
Mixtures of fruit juices and milk are a type of beverage presentin the market that has the advantage of offering a single productthat contains vitamin C, carotenoids, and phenolic compounds(from the fruit), together with proteins and calcium (from themilk). Wu et al. (2004) reported that fruit provides the largest con-tributions of antioxidants in the diet, mainly because of its abun-dance of vitamins, phenolic compounds and carotenoids, whilePulido, Hernández-García, and Saura-Calixto (2003) calculated thatfruit juices contribute (approximately 5–6%) to the total antioxi-dant capacity in the Spanish diet. On the other hand, various stud-ies have shown that milk and some fractions of milk (whey,caseins, lactoferrin, albumin) have antioxidant activity (Chen, Lind-
ll rights reserved.
capacity; TEAC, trolox equiv-lox equivalents; FRAP, ferricoxidant potential; DPPH, 2,2-
+34 963544954.
mark-Mansson, Gorton, & Akesson, 2003; Peña-Ramos & Xiong,2001; Rival, Boeriu, & Wichers, 2001), and recently a milk peptidehas been identified (Trp-Tyr-Ser-Leu-Ala-Met-Ala-Ser-Asp-Ile)with an antioxidant capacity higher than that of butylatedhydroxyanisole (BHA) (Hernández-Ledesma, Dávalos, Bartolomé,& Amigo, 2005).
Numerous in vitro studies have been conducted to evaluate thetotal antioxidant capacity (TAC) of food products. So far, however,there is no official standardised method, and therefore it is recom-mended that each evaluation should be made with various oxida-tion conditions and different methods of measurement (Frankel &Meyer, 2000). The methods for measuring antioxidant capacity arebasically classified into two groups, depending on the reactionmechanism: methods based on hydrogen atom transfer (HAT)and methods based on electron transfer (ET) (Huang et al., 2005).The majority of HAT-based assays apply a competitive scheme, inwhich antioxidant and substrate compete for thermally generatedperoxyl radicals through the decomposition of azo-compounds. ET-based assays measure the capacity of an antioxidant in the reduc-tion of an oxidant, which changes colour when reduced. The degreeof colour change is correlated with the sample’s antioxidantconcentrations.
Trolox equivalent antioxidant capacity (TEAC) and oxygen rad-ical antioxidant capacity (ORAC) assays are the most popularlyused ET and HAT methods, respectively. The main advantagesand disadvantages of each of these methods are set out in Table1 and have been considered at length in various reviews (Frankel

Table 1Advantages and disadvantages of the ABTS and ORAC methods
Advantages Disadvantages
ORAC � Uses biologically relevant free radicals� Standardised: allows for data comparison across laboratories� Integrates both degree and time of antioxidant reaction
� Normally requires use of expensive equipment� Data variability can be large across equipment� pH-sensitive� Requires long times to quantify results
ABTS � Inexpensive and easy to use� Stable to pH, hence can be used to study pH effect on activity� Fast reaction
� Extra step to generate free radical from ABTS salt necessary� Generated free radical not stable for long periods of time� Not standardised, hence hard to compare values across laboratories
A. Zulueta et al. / Food Chemistry 114 (2009) 310–316 311
& Meyer, 2000; Huang et al., 2005; Prior, Wu, & Schovich, 2005;Sánchez-Moreno, 2002).
The TEAC assay or 2,20-azinobis(3-ethylbenzthiazoline-6-sul-fonic acid) (ABTS) assay is based on scavenging of the ABTS�+ radi-cal cation by the antioxidants present in a sample. The ABTS�+
radical typically has a bluish-green colour with maximum absor-bance values at 645 nm, 734 nm and 815 nm (Re et al., 1999).When there are antioxidant compounds in the reaction medium,they capture the free radical, which is translated into a loss of col-our and therefore a reduction in absorbance, corresponding quan-titatively to the concentration of antioxidants present.
The ORAC method, developed initially by Cao, Alessio, andCutler (1993) consists of measuring the decrease in the fluores-cence of a protein as a result of the loss of its conformation whenit suffers oxidative damage caused by a source of peroxyl radicals(ROO�). The method measures the ability of the antioxidants inthe sample to protect the protein from oxidative damage. The pro-tein used in the original method was b-phycoerythrin (b-PE), but ithad a series of disadvantages, such as inconsistency betweenbatches, photosensitivity and interaction with phenolic com-pounds owing to nonspecific protein binding. To solve thisproblem, Ou, Hampsch-Woodill, and Prior (2001) proposed usingfluorescein (30,60-dihydroxyspiro[isobenzofuran-1[3H], 90[9H]-xanthen]-3-one) as the target protein.
The antioxidant capacity of foods depends on many factors,including the colloidal properties of the substrates, the conditionsand stages of oxidation, and the localization of antioxidants in dif-ferent phases (Frankel & Meyer, 2000). Moreover, the measuredantioxidant capacity of a sample depends on which technologyand which free radical generator or oxidant is used in the measure-ment. Consequently, comparison of different analytical methodsfor determining TAC is a key factor in helping investigators tochoose a method and to understand the result obtained.
The aim of the present work was to study the effect of the ma-trix (orange juice, milk, and an orange juice-milk beverage) on thetotal antioxidant capacity, using two measurement methods(ORAC and TEAC), based on different reaction mechanisms.
2. Materials and methods
2.1. Chemicals and reagents
Trolox (6-hydroxy-2,5,7,8-tetramethylchroman-2-carboxylicacid), which is a hydrophilic analogue of vitamin E; 2,20-azin-obis(3-ethylbenzthiazoline-6-sulfonic acid) (ABTS), 2,20-azobis(2-amidinopropane) dihydrochloride (AAPH), fluorescein sodium salt,b-carotene, lutein and albumin (from bovine serum) were pur-chased from Sigma–Aldrich (Steinheim, Germany). Ethanol waspurchased from J.T. Baker (Deventer, The Netherlands). High meth-oxyl citrus pectin was obtained from Unipectine AYD 250 DegussaFood Ingredients (Boulogne, France). Potassium persulfate(K2S2O8), sodium di-hydrogen phosphate (anhydrous) (NaH2PO4),di-potassium hydrogen phosphate (anhydrous) (K2HPO4), sugarand citric acid were purchased from Panreac (Barcelona, Spain).
Ascorbic acid was obtained from Merck (Darmstadt, Germany),and zeaxanthin and gallic acid were from Fluka (Buchs,Switzerland).
2.2. Samples
Oranges (Citrus sinensis L.) Navel variety and UHT skimmed milk(0.1% fat) (Grupo Leche Pascual, SA, Burgos, Spain) were purchasedfrom a local supermarket. Orange juice was extracted after appro-priate washing and hygienization of the fruits. The orange juice-milk beverage was prepared by mixing 50% (v/v) of orange juicewith the pulp removed, 20% (v/v) of UHT skimmed milk, and 30%(v/v) of water. Sugar (7.5% w/v), citric acid (0.1% w/v), and highmethoxyl citrus pectin (0.3% w/v) were added as a sweetener, pre-servative and homogenizer of the samples, respectively. Solidingredients were placed in water in the weight proportions indi-cated. The beverage was prepared just before use.
2.3. TEAC assay
The method used was as described by Re et al. (1999), based onthe capacity of a sample to inhibit the ABTS radical (ABTS�+) com-pared with a reference antioxidant standard (Trolox�). The ABTS�+
radical was generated by chemical reaction with potassium persul-fate (K2S2O8). For this purpose, 25 ml of ABTS (7 mM) was spikedwith 440 ll of K2S2O8 (140 mM) and allowed to stand in darknessat room temperature for 12–16 h (the time required for formationof the radical). The working solution was prepared by taking a vol-ume of the previous solution and diluting it in ethanol until itsabsorbance at k = 734 nm was 0.70 ± 0.02. The measuring was donein a Perkin–Elmer UV/Vis Lambda 2 spectrophotometer (Perkin–El-mer, Jügesheim, Germany) connected to a Julabo UC 5B thermo-statted bath at 30 �C (Julabo, Seelbach/Black Forest, Germany).The reaction took place directly in the measuring cuvette. For thispurpose, 2 ml of the ABTS�+ radical were added; the absorbance (A0)was measured, and 100 ll of sample or standard were addedimmediately, at which point the antioxidants present in the sam-ple began to inhibit the radical, producing a reduction in absor-bance, with a quantitative relationship between the reductionand the concentration of antioxidants present in the sample.Fig. 1 is a diagram of the ABTS�+ reaction.
To obtain a correct measurement, the samples were previouslydiluted with bidistilled water until an inhibition percentage of 20–80% was reached. At the same time, a trolox calibration curve wasprepared for a concentration range of 0–250 lM, and the inhibitionpercentage obtained for the sample was interpolated to calculatethe concentration in trolox equivalents (lM TE). Each samplewas analysed in triplicate.
2.4. ORAC assay
The ORAC method used, with fluorescein (FL) as the ‘‘fluores-cent probe,” was that described by Ou et al. (2001). The automatedORAC assay was carried out on a Wallac 1420 VICTOR2 multilabel
N
SN
C2H5
N
C2H5
N
S SO3 --O3S
N
SN
C2H5
N
C2H5
N
S SO3 --O3S
+ antioxidant
- K2SO5
ABTS ·- (λmax =734 nm)
·
ABTS2- (colourless)
Fig. 1. Reaction of the ABTS radical in the presence of the antioxidant compound during the ABTS assay.
312 A. Zulueta et al. / Food Chemistry 114 (2009) 310–316
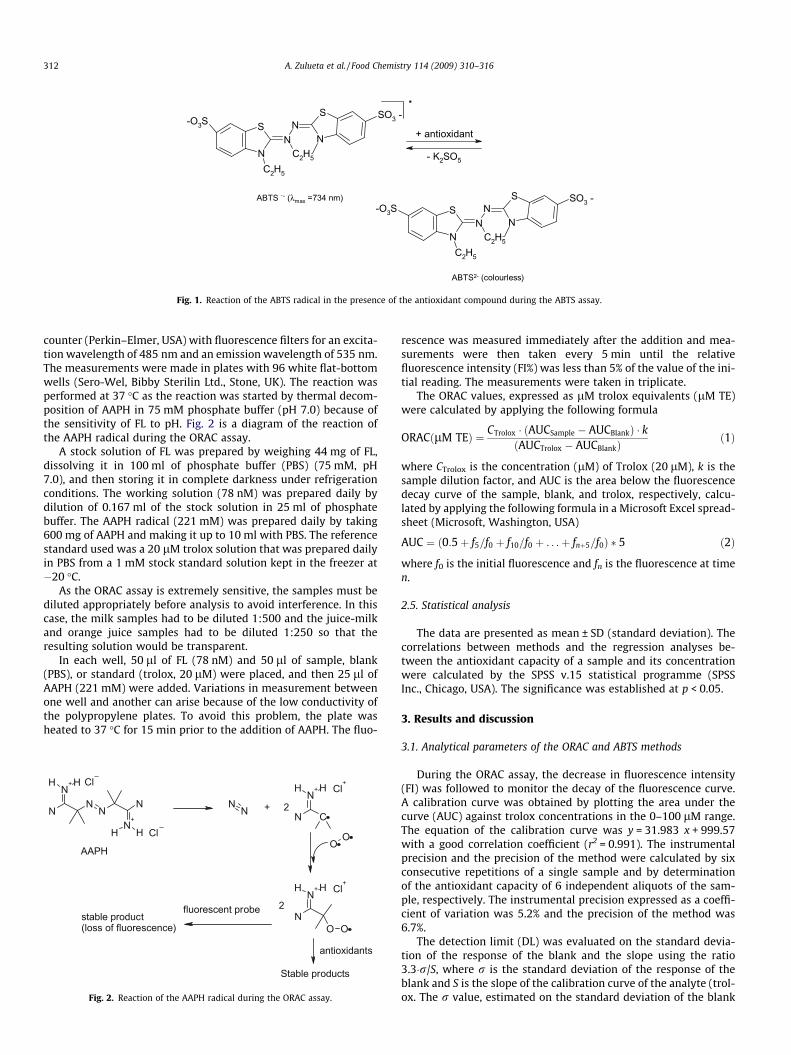
counter (Perkin–Elmer, USA) with fluorescence filters for an excita-tion wavelength of 485 nm and an emission wavelength of 535 nm.The measurements were made in plates with 96 white flat-bottomwells (Sero-Wel, Bibby Sterilin Ltd., Stone, UK). The reaction wasperformed at 37 �C as the reaction was started by thermal decom-position of AAPH in 75 mM phosphate buffer (pH 7.0) because ofthe sensitivity of FL to pH. Fig. 2 is a diagram of the reaction ofthe AAPH radical during the ORAC assay.
A stock solution of FL was prepared by weighing 44 mg of FL,dissolving it in 100 ml of phosphate buffer (PBS) (75 mM, pH7.0), and then storing it in complete darkness under refrigerationconditions. The working solution (78 nM) was prepared daily bydilution of 0.167 ml of the stock solution in 25 ml of phosphatebuffer. The AAPH radical (221 mM) was prepared daily by taking600 mg of AAPH and making it up to 10 ml with PBS. The referencestandard used was a 20 lM trolox solution that was prepared dailyin PBS from a 1 mM stock standard solution kept in the freezer at�20 �C.
As the ORAC assay is extremely sensitive, the samples must bediluted appropriately before analysis to avoid interference. In thiscase, the milk samples had to be diluted 1:500 and the juice-milkand orange juice samples had to be diluted 1:250 so that theresulting solution would be transparent.
In each well, 50 ll of FL (78 nM) and 50 ll of sample, blank(PBS), or standard (trolox, 20 lM) were placed, and then 25 ll ofAAPH (221 mM) were added. Variations in measurement betweenone well and another can arise because of the low conductivity ofthe polypropylene plates. To avoid this problem, the plate washeated to 37 �C for 15 min prior to the addition of AAPH. The fluo-
NN
NN
N+ HH
N+
H H
Cl
N C
N+ HH Cl
+
NN
OOCl
N
N+ HH
O O
Cl+
+
AAPH
antioxidants
Stable products
2
2
stable product(loss of fluorescence)
fluorescent probe
Fig. 2. Reaction of the AAPH radical during the ORAC assay.
rescence was measured immediately after the addition and mea-surements were then taken every 5 min until the relativefluorescence intensity (FI%) was less than 5% of the value of the ini-tial reading. The measurements were taken in triplicate.
The ORAC values, expressed as lM trolox equivalents (lM TE)were calculated by applying the following formula
ORACðlM TEÞ ¼ CTrolox � ðAUCSample � AUCBlankÞ � kðAUCTrolox � AUCBlankÞ
ð1Þ
where CTrolox is the concentration (lM) of Trolox (20 lM), k is thesample dilution factor, and AUC is the area below the fluorescencedecay curve of the sample, blank, and trolox, respectively, calcu-lated by applying the following formula in a Microsoft Excel spread-sheet (Microsoft, Washington, USA)
AUC ¼ ð0:5þ f5=f0 þ f10=f0 þ . . .þ fnþ5=f0Þ � 5 ð2Þ
where f0 is the initial fluorescence and fn is the fluorescence at timen.
2.5. Statistical analysis
The data are presented as mean ± SD (standard deviation). Thecorrelations between methods and the regression analyses be-tween the antioxidant capacity of a sample and its concentrationwere calculated by the SPSS v.15 statistical programme (SPSSInc., Chicago, USA). The significance was established at p < 0.05.
3. Results and discussion
3.1. Analytical parameters of the ORAC and ABTS methods
During the ORAC assay, the decrease in fluorescence intensity(FI) was followed to monitor the decay of the fluorescence curve.A calibration curve was obtained by plotting the area under thecurve (AUC) against trolox concentrations in the 0–100 lM range.The equation of the calibration curve was y = 31.983 x + 999.57with a good correlation coefficient (r2 = 0.991). The instrumentalprecision and the precision of the method were calculated by sixconsecutive repetitions of a single sample and by determinationof the antioxidant capacity of 6 independent aliquots of the sam-ple, respectively. The instrumental precision expressed as a coeffi-cient of variation was 5.2% and the precision of the method was6.7%.
The detection limit (DL) was evaluated on the standard devia-tion of the response of the blank and the slope using the ratio3.3�r/S, where r is the standard deviation of the response of theblank and S is the slope of the calibration curve of the analyte (trol-ox. The r value, estimated on the standard deviation of the blank

A. Zulueta et al. / Food Chemistry 114 (2009) 310–316 313
obtained by analysing n = 10 blanks, was equal to 78.7. The DL was8.1 lM TE and the quantification limit (QL) using the ratio 10�r/Swas 24.6 lM TE. The DL and QL reported in the original work byOu et al. (2001) were 5 lM TE and 12.5 lM TE, respectively.
The robustness of the method was evaluated by analysing a20 lM trolox solution over a period of 7 weeks with one measure-ment per week. The reproducibility analysed in this way and ex-pressed as a coefficient of variation was 9.9%.
During the ABTS assay, the decrease in absorbance was followedto monitor the consumption of the coloured ABTS�+ radical. Theequation of the calibration curve was y = 0.2183x – 1.3133 with agood correlation coefficient (r2 = 0.997). The instrumental preci-sion, expressed as a coefficient of variation, was 5.1% and the pre-cision of the method was 5.7%. The detection and quantificationlimits obtained were 10.5 lM TE and 31.9 lM TE, respectively.
For the ABTS assay, the robustness of the method was evaluatedby analysing a 50 lM trolox solution. The reproducibility, ex-pressed as a coefficient of variation, was 8.5%.
3.2. ORAC and TEAC values of antioxidant reference substances
To verify the efficiency of each method in the measurement ofantioxidant capacity, we evaluated various standards of vitaminsand other compounds with antioxidant capacity present in thesamples that are commercially available: ascorbic acid (AA), gallicacid, b-carotene, lutein, zeaxanthin and albumin. Some authorsattribute the main antioxidant capacity of milk to the casein frac-tion, but standards of casein are not yet commercially available.
Ascorbic acid, gallic acid, and albumin were prepared by dis-solving in distilled water, whereas the carotenoids were dilutedin ethanol because of their lipophilic nature. The results obtainedare shown in Table 2. As can be seen, the antioxidant capacity ob-tained for AA by the TEAC assay is higher than the value obtainedby ORAC. The results obtained for gallic acid are similar for the twomethods, and the antioxidant capacity of albumin was greater withthe ORAC method than with TEAC. Cao and Prior (1998) found thatthe contribution of AA to TAC in human serum was twice greaterwith the TEAC method than with the ORAC method, whereas albu-min contributed equally in the two methods. The antioxidantcapacity of the carotenoids measured by the TEAC method fol-lowed the order: b-carotene > lutein > zeaxanthin. These resultscoincide with those obtained by Miller, Sampson, Candeias,Bramley, and Rice-Evans (1996). However, with the ORAC method,the xanthophylls (lutein and zeaxanthin) had higher values thanhad b-carotene, which might be because of the presence of OHgroups in the terminal rings.
We also prepared concentration curves for AA (20–40 mg/100 ml), gallic acid (50–120 mg/ml), and albumin (35–45 g/l) in or-der to verify the response of the two methods to different concen-trations of these compounds. When the AA concentrationincreased, the antioxidant capacity increased with the two meth-ods (p < 0.01), TEAC (r2 = 0.968) and ORAC (r2 = 0.958). The sameresults were observed for gallic acid (r2 = 0.931 and r2 = 0.981, forTEAC and ORAC, respectively). However, the concentration of albu-
Table 2Antioxidant capacity of reference substances evaluated by the TEAC and ORACmethods
Compound Concentration (mg/ml) TEAC (lM TE) ORAC (lM TE)
Ascorbic acid 0.026 90.5 ± 2.7 40.4 ± 2.1Gallic acid 0.9 161 ± 4.8 111 ± 5.8Albumin 0.015 97.1 ± 6.4 1190 ± 63.1b-Carotene 0.001 240 ± 21.2 582 ± 30.3Lutein 0.001 40.2 ± 3.1 1247 ± 6.6Zeaxanthin 0.001 31.4 ± 1.6 1108 ± 5.9
min correlated with the total antioxidant capacity when it wasmeasured with the ORAC method (r2 = 0.946), but this did not hap-pen with the TEAC method (r2 = 0.678).
Moreover, during the TEAC assay we saw that the action withregard to the ABTS�+ radical differed with the various standards as-sayed. Vitamin C reacted with the ABTS�+ radical quickly, reachingmaximum inhibition after a reaction of one minute and remainingconstant over time, results that agree with those obtained by Reet al. (1999). However, gallic acid, albumin and the carotenoidsmaintained their inhibiting action for a longer time, so that itwould be necessary to optimize the inhibition time in the mea-surement of TAC for the TEAC method. Re et al. (1999) estimatedthat the inhibition measurement time ranged between 1 and6 min.
3.3. Comparison of the ORAC and TEAC methods for measuring theantioxidant capacity of beverages based on juice and milk
The total antioxidant capacity values of the orange juice andmilk beverage (50:20, v/v) assayed with the ORAC and TEAC meth-ods (inhibition time = 3 min) were 9648 ± 361 lM TE and3028 ± 146 lM TE, respectively. The antioxidant capacity obtainedfor orange juice was 10897 ± 593 lM TE (ORAC) and4875 ± 293 lM TE (TEAC) while, for skimmed milk (0.1% fat), theantioxidant capacity values were 20867 ± 742 lM TE (ORAC) and2649 ± 91 lM TE (TEAC). The differences in the antioxidant capac-ities (lM TE) found with the two methods were due to the differ-ent nature of the two assays.
In a previous study, the TAC obtained for commercial juice andmilk beverages that contained orange juice in their compositionranged between 610 and 3511 lM TE (Zulueta, Esteve, Frasquet,& Frígola, 2007). For orange juice, similar results were obtainedwith TEAC assays by Proteggente, Saija, De Pasquale, and Rice-Evans (2003), who found values of 4790 ± 80 lM TE for the Navelvariety, by Pellegrini et al., 2003), who obtained an approximatevalue of 3020 lM TE, and by Arena, Fallico, and Maccarone(2001), who calculated a value of 5090 lM TE for freshly squeezedjuice. Using the ORAC assay, Wang et al. (2004) obtained a slightlylower antioxidant capacity for orange juice (6820 lM TE) than thevalue obtained in the present study. This could be explained by theuse of b-PE as the fluorescent probe instead of FL, for, as Ou et al.(2001) point out, the results obtained with the use of FL are twoor three times greater than those obtained with b-PE.
With regard to antioxidant capacity in milk samples, Chen et al.(2003) obtained a value of 1246–4560 lM TE (depending on thepH of the reaction medium) for skimmed milk with the TEACmethod and, similarly to our results, Wegrzyn et al. (2008) foundfor reconstituted skimmed milk power an ORAC antioxidant capac-ity of around 20,000 lM TE.
In order to determine the contributions made by the milk andthe orange juice in the beverage, we prepared three combinationsindependently: (1) the original beverage, consisting of juice, milk,and water (50:20:30, v/v), (2) juice and water (50:50, v/v), and(3) milk and water (20:80, v/v), respecting the proportions of theoriginal mixture. Fig. 3 shows the FL decay curve for the three sam-ples. The results obtained appear in Table 3, which shows that thesum of the ORAC values in the juice and water mixture (50:50) plusthe milk and water mixture (20:80) would give a value close tothat of the juice and milk combination (50:20). However, whenwe did the measurement with the ABTS assay, the milk gave a low-er value for antioxidant capacity than did the juice, and the juiceand milk combination did not correspond to the sum of the twoseparate mixtures but was similar to the value for the juice andwater combination (50:50, v/v). This observation suggests thatthe antioxidant capacity found with the ABTS assay was due tothe fraction corresponding to the juice.

0
20
40
60
80
100
0 10 20 30 40 50 60Time (min)
Rel
ativ
e Fl
uore
scen
ce In
tens
ity (%
)
Blank
TroloxOrange juice-milkbeverage
Orange juice (50%) Milk (20%)
Fig. 3. Fluorescence decay curve during the ORAC assay in the presence of varioussamples.
Table 3Comparison of ORAC and TEAC values in the samples of juice and milk (50:20, v/v),juice (50%) and milk (20%)
ORAC (lM TE) TEAC (lM TE)
Juice:milk (50:20) 9473 ± 277 3637 ± 46.1Juice:water (50:30) 4895 ± 289 3599 ± 125Milk:water (20:80) 3991 ± 157 2288 ± 158
Data are expressed as means ± SD.
0
1000
2000
3000
4000
5000
6000
0 10 15 20 25 30
Reaction time (min)
TEA
C (µ
M T
E)
Orange juiceSkimmed milk
5
Fig. 4. Changes in TEAC according to reaction time elapsed for orange juice (e) andmilk (j).
Table 4Percentage of fluorescence with passing of time when the antioxidant capacity ofdifferent samples is measured
% Milk % Orange juice FI%
3 min 5 min 10 min
10 50 98.4 90.7 66.220 50 98.9 93.8 74.030 50 98.3 92.5 74.540 50 99.0 96.1 84.850 50 99.5 96.3 86.820 10 96.2 86.4 61.720 20 96.8 88.5 67.920 30 97.3 90.4 71.220 40 98.2 91.1 72.420 50 99.6 95.9 75.620 60 98.3 95.1 78.120 70 98.9 96.0 80.620 80 99.3 97.3 84.9100 – 98.6 96.1 90.7– 100 99.1 97.8 85.9
FI, relative fluorescence intensity.
0
20
40
60
80
100
0 10 20 30 40 50 60
Time (min)
Rel
ativ
e Fl
uore
scen
ce In
tens
ity (%
)
BlankTrolox (20 µM)Orange Juice Milk (0.1%fat)
Fig. 5. Fluorescence intensity decay curve of fluorescein in the presence of orangejuice or milk (0.1% fat).
314 A. Zulueta et al. / Food Chemistry 114 (2009) 310–316
It must be pointed out that the ORAC method is the only one sofar that combines the total inhibition time and the percentage ofthe free radical damage by the antioxidant into a single quantity,ensuring that, by the end of the process, all the antioxidants pres-ent in the sample have reacted with the radicals generated. Wanget al. (2004) compared the TEAC and ORAC methods for the analy-sis of antioxidants in plasma, finding that, with the TEAC assay, an‘‘underestimate” of the TAC of the samples was produced after3 min and that at least 30 min was needed to determine the anti-oxidant capacity of the samples, at which point a plateau situationwas reached. Samaniego-Sánchez et al. (2007) used the TEACmethod to analyze the antioxidant capacity of various olive oils,prolonging the reaction until 30 min because the TAC observedafter 2 min was considerably lower.
In order to optimize the incubation period for complete inhibi-tion of the ABTS�+ radical, we extended the reaction time and mon-itored the changes produced every 3 min. The results show that theorange juice quickly inhibited the ABTS�+ radical, with the inhibi-tion percentage remaining constant with time, whereas the milkhad a low inhibition percentage at start time, gradually increasingand reaching an antioxidant capacity value similar to that of the100% juice after 20 min (Fig. 4). If we study how the fluorescenceinhibition percentage (FI%) changes as the reaction takes place(Table 4 and Fig. 5), we see that, during the first minutes, the FI%is greater for a sample of orange juice (100%) than for a sampleof milk (100%), as happened during the ABTS assay. It is only after8–10 min that the FI% for the milk is greater than the FI% for thejuice. These results seem to corroborate the idea that, as the anti-oxidants present in these two types of matrices are of a differentnature, they have different inhibition kinetics.
To verify the effect of each of the matrices (orange juice andmilk) on each of the measurement methods, we performed (1) anassay with increasing concentrations of orange juice in the mix-ture, keeping the percentage of milk (20%) constant, and (2) an as-say with increasing concentrations of milk, keeping the percentageof juice (50%) constant. The measurement with the TEAC method
was extended over a period of 20 min, with measurements every3 min.
After the analysis, we observed that, for the TEAC assay, the in-crease in the concentration of orange juice corresponded to the in-crease in TAC, and the experimental data were fitted to a straightline (y = 28.343x + 1764.9, r2 = 0.984, p < 0.01), but increases in

0
2000
4000
6000
8000
10000
12000
14000
0 20 40 60 80 100 120
Percentage (%)
OR
AC
(µM
TE)
Orange juiceMilk
Fig. 7. Variation in ORAC antioxidant capacity in relation to increase in percentageof orange juice or milk.
A. Zulueta et al. / Food Chemistry 114 (2009) 310–316 315
the percentage of milk in the beverage were not reflected in in-creases in the antioxidant capacity (Fig. 6). The same results wereobserved by Chen et al. (2003) when they used the TEAC assay todetermine the antioxidant capacity of milk, so that the plot ofthe increasing concentrations of milk versus the reduction inabsorbance was not linear.
When the ORAC assay was used to perform the same test,increasing concentrations of either juice or milk (Fig. 7) corre-sponded to a greater antioxidant capacity, and in both cases therewas a significant fit to a straight line (r2 = 0.973, p < 0.01 andr2 = 0.921, p < 0.01, respectively).
These results may be due to the fact that orange juice is mainlyrich in ascorbic acid (�52 mg/100 ml), which, as seen in the previ-ous section, reacts quickly with the ABTS radical, and its action isfavoured by this method because it is a redox reaction. Pellegriniet al. (2007) found that water-soluble antioxidants were the maincontributors to TAC in orange juice, and ascorbic acid proved to bethe main antioxidant in juices with milk that are on the market(Zulueta et al., 2007). However, the contribution of the water-sol-uble antioxidants (uric acid, vitamin C) in milk, especially skimmedmilk, is very modest; its main antioxidant capacity resides in theliposoluble fraction and in the protein fraction that has a powerfulantioxidant effect because it is composed of amino acids, such astyrosine, tryptophan, histidine, lysine and methionine, as variousauthors have shown (Chen et al., 2003; Rival et al., 2001). Hernán-dez-Ledesma et al. (2005) found that the phenolic and indolicgroups of Trp and Tyr in milk had a special ability to act as hydro-gen donors, being responsible for the antioxidant capacity shownby these amino acids. That is why, as the ORAC method is a reac-tion based on the transfer of H atoms, these groups present in milkmay be better represented by this assay.
3.4. Correlation between the TEAC and ORAC methods for juice andmilk beverages
Upon comparing the antioxidant capacity results obtained withthe TEAC method and the ORAC method we find good correlationswhen the orange juice concentration changes (r = 0.955, p < 0.05),as it gives an increase in TAC with both methods. However, thereare no statistically significant correlations between the two meth-ods for changes in the milk concentration, as the changes do notgive an increase in TAC with the TEAC method.
Various authors have obtained correlations between the resultsfound after analysing antioxidant capacity with the TEAC andORAC methods. However, this seems to be for foods in which themain antioxidants are water-soluble and, as seen, the action of
r2 = 0.9839
0
500
1000
1500
2000
2500
3000
3500
4000
4500
5000
0 20 40 60 80 100
TEA
C (µ
M T
E)
Percentage of orange juice
A B
Fig. 6. Variation in TEAC antioxidant capacity as the percentag
these antioxidants takes place easily with both methods. Proteg-gente et al. (2002) found a good correlation between the ORAC,FRAP (ferric reducing antioxidant power), and TEAC methods forvarious fruits and vegetables. Taipong, Boonprakob, Crosby, Cisner-os-Zevallos, and Hawkins (2006) obtained comparable antioxidantcapacity results for guava juice with the TEAC, DPPH, FRAP andORAC methods, and Stintzing et al. (2005) found significant corre-lations (r = 0.974) between the ORAC and TEAC methods for ‘‘cac-tus pear” juice. However, Silva, Souza, Rogez, Rees, andLarondelle (2007) compared the ORAC and TEAC methods to mea-sure the antioxidant capacity of 15 Brazilian plants, finding thatthere was a moderate correlation between the results found withthe two methods (r = 0.551, p < 0.01). They concluded that theORAC method must be considered better because it measures theantioxidant activity of other compounds, as well as phenolic com-pounds, which was not observed with the TEAC method. On theother hand, Pérez, Leighton, Aspee, Aliaga, and Lissi (2000) com-pared the ORAC, TEAC and TRAP methods in samples of red wineand white wine and did not find correlations between the 3 meth-ods. Cao and Prior (1998) compared the ORAC, FRAP, and TEACmethods in samples of blood serum, finding a slight correlation be-tween ORAC and FRAP and not finding correlations between ORACand TEAC. They noted that the ORAC method had greater specific-ity and was capable of responding to a greater number of antioxi-dant compounds than the other two methods assayed.
0
500
1000
1500
2000
2500
3000
3500
4000
0 20 40 60
TEA
C (µ
M T
E)
Percentage of milk
e of orange juice (A) or milk (B) in the beverage increases.

316 A. Zulueta et al. / Food Chemistry 114 (2009) 310–316
The results obtained in the present study, together with thosefound by other authors, suggest that, when a sample is complexor contains antioxidants of very different kinds, the correlation be-tween the ORAC and TEAC methods is low because of the differentkinetics and reaction mechanisms of the various antioxidantspresent.
Acknowledgements
This study was carried out with funds from the Spanish Minis-try of Science and Technology and European Regional DevelopmentFunds (ERDF) (Project AGL-2003-05236-C02-02 and AGL2006-13320-C03-03/Ali) and the Generalitat Valenciana’s Aid for Re-search Groups (3/147) and CV/2007/048 project. Ana Zulueta holdsan award from this project. We are grateful to the Leche Pascualgroup for their collaboration by providing samples for analysis.
References
Arena, E., Fallico, B., & Maccarone, E. (2001). Evaluation of antioxidant capacity ofblood orange juices as influenced by constituents, concentration process andstorage. Food Chemistry, 74, 423–427.
Cao, G., & Prior, R. L. (1998). Comparison of different analytical methods forassessing total antioxidant capacity of human serum. Clinical Chemistry, 44,1309–1315.
Cao, G., Alessio, H. M., & Cutler, R. G. (1993). Oxygen-radical absorbance capacityassay for antioxidants. Free Radical and Biology Medicine, 14, 303–311.
Chen, J., Lindmark-Mansson, H., Gorton, L., & Akesson, B. (2003). Antioxidantcapacity of bovine milk as assayed by spectrophotometric and amperometricmethods. International Dairy Journal, 13, 927–935.
Frankel, E. N., & Meyer, A. S. (2000). The problems of using one-dimensionalmethods to evaluate multifunctional food and biological antioxidants. JournalScience Food Agriculture, 80, 1925–1941.
Hernández-Ledesma, B., Dávalos, A., Bartolomé, B., & Amigo, L. (2005). Preparationof antioxidant enzymatic hydrosylates from a-lactalbumin and b-lactoglobulin.Identification of active peptides by HPLC-MS/MS. Journal of Agricultural and FoodChemistry, 53, 1841–1856.
Huang, D., Ou, B., & Prior, R. L. (2005). The chemistry behind antioxidant capacityassays. Journal of Agricultural and Food Chemistry, 53, 1841–1856.
Miller, N. J., Sampson, J., Candeias, L. P., Bramley, P. M., & Rice-Evans, C. A. (1996).Antioxidant activities of carotenes and xanthophylls. FEBS Letters, 384, 240–242.
Ou, B., Hampsch-Woodill, M., & Prior, R. L. (2001). Development and validation of animproved oxygen radical absorbance capacity assay using fluorescein as thefluorescent probe. Journal of Agricultural and Food Chemistry, 49, 4619–4626.
Pellegrini, N., Colombi, B., Salvatore, S., Brenna, O., Galaverna, G., Del Rio, D., et al.(2007). Evaluation of antioxidant capacity of some fruit and vegetable foods:Efficiency of extraction of a sequence of solvents. Journal of Science and FoodAgriculture, 87, 103–111.
Pellegrini, N., Serafini, M., Colombi, B., Del Rio, D., Salvatore, S., Bianchi, M., et al.(2003). Total antioxidant capacity of plant foods, beverages and oils consumedin Italy assessed by three different in vitro assays. Journal of Nutrition, 133,2812–2819.
Peña-Ramos, E. A., & Xiong, Y. L. (2001). Antioxidative activity of whey protein.Hydrolyzates in a liposomal system. Journal of Dairy Science, 84, 2577–2583.
Pérez, D., Leighton, F., Aspee, A., Aliaga, A., & Lissi, E. (2000). A comparison ofmethods employed to evaluate antioxidant capabilities. Biology Research, 33,71–77.
Prior, R. L., Wu, X., & Schovich, K. (2005). Standardized methods for thedetermination of antioxidant capacity and phenolics in foods and dietarysupplements. Journal of Agriculture and Food Chemistry, 53, 52–63.
Proteggente, A. R., Pannala, A., Paganga, G., Van Buren, L., Wagner, E., Wiseman, S.,et al. (2002). The antioxidant activity of regularly consumed fruit andvegetables reflects their phenolic and vitamin C composition. Free RadicalResearch, 36, 217–233.
Proteggente, A. R., Saija, A., De Pasquale, A., & Rice-Evans, C. (2003). Thecompositional characterisation and antioxidant activity of fresh juices fromSicilian sweet orange (Citrus sinensisOsbeck) varieties L. Free Radical Research,37, 681–687.
Pulido, R., Hernández-García, M., & Saura-Calixto, F. (2003). Contribution ofbeverages to the intake of lipophilic and hydrophilic antioxidants in theSpanish diet. European Journal of Clinical Nutrition, 57, 1275–1282.
Re, R., Pellegrini, N., Proteggente, A., Pannala, A., Yang, M., & Rice-Evans, C. (1999).Antioxidant activity applying an improved ABTS radical cation decolourisationassay. Free Radical and Biology Medicine, 26, 1231–1237.
Rival, S. G., Boeriu, C. G., & Wichers, H. J. (2001). Caseins and casein hydrosylates. 2.Antioxidative properties and relevance to lipoxygenase inhibition. Journal ofAgricultural and Food Chemistry, 49, 295–302.
Samaniego-Sánchez, C., Troncoso-González, A. M., García-Parrilla, M. C., Quesada-Granados, J. J., López-García de la Serrana, H., & López-Martínez, M. C. (2007).Different radical scavenging tests in virgin olive oil and their relation to thetotal phenol content. Analytical Chimica Acta, 593, 103–107.
Sánchez-Moreno, C. (2002). Review: Methods used to evaluate the free radicalscavenging activity in foods and biological systems. Food Science and TechnologyInternational, 8, 121–178.
Serrano, J., Goñi, I., & Saura-Calixto, F. (2007). Food antioxidant capacity determinedby chemical methods may underestimate the physiological antioxidantcapacity. Food Research Inernational, 40, 15–21.
Silva, E. M., Souza, J. N. S., Rogez, H., Rees, J. F., & Larondelle, Y. (2007). Antioxidantactivities and polyphenolic contents of fifteen selected plant species from theAmazonian region. Food Chemistry, 101, 1012–1018.
Stintzing, F., Herbach, K., Mosshammer, M., Carle, R., Yi, W., Sellappan, S., et al.(2005). Color, betalain pattern, and antioxidant properties of cactus pear(Opuntia spp.) clones. Journal of Agriculture and Food Chemistry, 53, 442–451.
Taipong, K., Boonprakob, U., Crosby, K., Cisneros-Zevallos, L., & Hawkins, D. (2006).Comparison of ABTS, DPPH, FRAP, and ORAC assays for estimating antioxidantactivity from guava fruit extracts. Journal of Food Composition and Analysis, 19,669–675.
Wang, C. C., Chu, C. Y., Chu, J. O., Choy, K. W., Khaw, K. S., Rogers, M. S., et al. (2004).Trolox-equivalent antioxidant capacity assay versus oxygen radical absorbancecapacity assay in plasma. Clinical Chemistry, 50, 952–954.
Wegrzyn, T. F., Farr, J. M., Hunter, D. C., Au, J., Wohlers, M. W., Skinner, M. A., et al.(2008). Stability of antioxidants in an apple polyphenol-milk model system.Food Chemistry, 109, 310–318.
Wu, X., Beecher, G. R., Holden, J. M., Haytowitz, D. B., Gebhardt, S. E., & Prior, R. L.(2004). Lipophilic and hydrophilic antioxidant capacities of common foods inthe United States. Journal of Agricultural and Food Chemistry, 52, 4026–4037.
Zulueta, A., Esteve, M. J., Frasquet, I., & Frígola, A. (2007). Vitamin C, vitamin A,phenolic compounds and total antioxidant capacity of new fruit juice and skimmilk mixture beverages marketed in Spain. Food Chemistry, 103, 1365–1374.