Optimizing the transportation of international container cargoes in Korea
22
This article was downloaded by: [UAA/APU Consortium Library] On: 16 October 2014, At: 09:02 Publisher: Routledge Informa Ltd Registered in England and Wales Registered Number: 1072954 Registered office: Mortimer House, 37-41 Mortimer Street, London W1T 3JH, UK Maritime Policy & Management: The flagship journal of international shipping and port research Publication details, including instructions for authors and subscription information: http://www.tandfonline.com/loi/tmpm20 Optimizing the transportation of international container cargoes in Korea Hwa-Joong Kim a , Young-Tae Chang a , Paul T.-W. Lee b , Sung-Ho Shin a & Min-Jeong Kim a a Graduate School of Logistics, Inha University , Korea b Department of Logistics and Shipping Management , Kainan University , Taiwan Published online: 13 Feb 2008. To cite this article: Hwa-Joong Kim , Young-Tae Chang , Paul T.-W. Lee , Sung-Ho Shin & Min-Jeong Kim (2008) Optimizing the transportation of international container cargoes in Korea, Maritime Policy & Management: The flagship journal of international shipping and port research, 35:1, 103-122, DOI: 10.1080/03088830701849084 To link to this article: http://dx.doi.org/10.1080/03088830701849084 PLEASE SCROLL DOWN FOR ARTICLE Taylor & Francis makes every effort to ensure the accuracy of all the information (the “Content”) contained in the publications on our platform. However, Taylor & Francis, our agents, and our licensors make no representations or warranties whatsoever as to the accuracy, completeness, or suitability for any purpose of the Content. Any opinions and views expressed in this publication are the opinions and views of the authors, and are not the views of or endorsed by Taylor & Francis. The accuracy of the Content should not be relied upon and should be independently verified with primary sources of information. Taylor and Francis shall not be liable for any losses, actions, claims, proceedings, demands, costs, expenses, damages, and other liabilities whatsoever or howsoever caused arising directly or indirectly in connection with, in relation to or arising out of the use of the Content. This article may be used for research, teaching, and private study purposes. Any substantial or systematic reproduction, redistribution, reselling, loan, sub-licensing, systematic supply, or distribution in any form to anyone is expressly forbidden. Terms &
Transcript of Optimizing the transportation of international container cargoes in Korea

This article was downloaded by: [UAA/APU Consortium Library]On: 16 October 2014, At: 09:02Publisher: RoutledgeInforma Ltd Registered in England and Wales Registered Number: 1072954 Registeredoffice: Mortimer House, 37-41 Mortimer Street, London W1T 3JH, UK
Maritime Policy & Management: Theflagship journal of internationalshipping and port researchPublication details, including instructions for authors andsubscription information:http://www.tandfonline.com/loi/tmpm20
Optimizing the transportation ofinternational container cargoes inKoreaHwa-Joong Kim a , Young-Tae Chang a , Paul T.-W. Lee b , Sung-HoShin a & Min-Jeong Kim aa Graduate School of Logistics, Inha University , Koreab Department of Logistics and Shipping Management , KainanUniversity , TaiwanPublished online: 13 Feb 2008.
To cite this article: Hwa-Joong Kim , Young-Tae Chang , Paul T.-W. Lee , Sung-Ho Shin & Min-JeongKim (2008) Optimizing the transportation of international container cargoes in Korea, MaritimePolicy & Management: The flagship journal of international shipping and port research, 35:1,103-122, DOI: 10.1080/03088830701849084
To link to this article: http://dx.doi.org/10.1080/03088830701849084
PLEASE SCROLL DOWN FOR ARTICLE
Taylor & Francis makes every effort to ensure the accuracy of all the information (the“Content”) contained in the publications on our platform. However, Taylor & Francis,our agents, and our licensors make no representations or warranties whatsoever as tothe accuracy, completeness, or suitability for any purpose of the Content. Any opinionsand views expressed in this publication are the opinions and views of the authors,and are not the views of or endorsed by Taylor & Francis. The accuracy of the Contentshould not be relied upon and should be independently verified with primary sourcesof information. Taylor and Francis shall not be liable for any losses, actions, claims,proceedings, demands, costs, expenses, damages, and other liabilities whatsoeveror howsoever caused arising directly or indirectly in connection with, in relation to orarising out of the use of the Content.
This article may be used for research, teaching, and private study purposes. Anysubstantial or systematic reproduction, redistribution, reselling, loan, sub-licensing,systematic supply, or distribution in any form to anyone is expressly forbidden. Terms &
Conditions of access and use can be found at http://www.tandfonline.com/page/terms-and-conditions
Dow
nloa
ded
by [
UA
A/A
PU C
onso
rtiu
m L
ibra
ry]
at 0
9:03
16
Oct
ober
201
4

MARIT. POL. MGMT., FEBRUARY 2008VOL. 35, NO. 1, 103–122
Optimizing the transportation of internationalcontainer cargoes in Korea
HWA-JOONG KIM*y, YOUNG-TAE CHANGy, PAUL T.-W.
LEEz, SUNG-HO SHINy, and MIN-JEONG KIMy
yGraduate School of Logistics, Inha University, KoreazDepartment of Logistics and Shipping Management, KainanUniversity, Taiwan
This paper considers a multimodal transportation problem, which is the problemof determining the transportation flow, i.e. volume of container cargoes, and thetransportation mode in each trade route, for the objective of minimizing the sumof shipping and inland transportation costs. The problem takes account of tworestrictions: maximum cargo volumes capacitated at each seaport and maximumnumber of vehicles available at each transportation mode. To solve optimally theproblem, this paper employs a mixed integer programming, which is anoperations research technique. A case study is performed on the containercargo data in Korea and we draw several implications to improve efficiency in thetransportation of international trade cargoes in Korea.
1. Introduction
To survive in the fierce competitive world, Korean government has made manyefforts to build a logistic hub of the Northeast Asia. In spite of the effort, it is knownthat there is still great inefficiency in the transportation of international trade cargoes[1]. One of the reasons may be ill-balanced cargo flows, that is, most of these cargoeshave been handled at seaports of Busan and Kwangyang, far from Seoul andKyounggi province in which nearly 40% of Korea’s population lives. Therefore,cargo flows in the transportation network should be redesigned to improve efficiencyin the transportation of international trade cargoes in Korea.
In this paper, we consider a multimodal transportation problem (MTP) in Korea,which is the problem of determining the cargo flow quantity, i.e. volume of containercargoes, and the transportation mode in each trade route, while satisfying thedemand of cargoes in foreign seaports and Korean cities with the supply in Koreancities and foreign seaports, respectively, throughout a planning period. The objectiveof the problem is to minimize the total logistic costs, i.e. shipping and transportationcosts (more detailed definition for the costs is given later). The MTP can beconsidered as a special case of the well-known network design problem (see [2] formore details of the network design problem), in that the MTP determines the flowquantity in each trade route while satisfying the demand and supply. In the MTP,however, we should determine the transportation mode in each trade route and
*To whom correspondence should be addressed. e-mail: [email protected]
Maritime Policy & Management ISSN 0308–8839 print/ISSN 1464–5254 online � 2008 Taylor & Francishttp://www.tandf.co.uk/journalsDOI: 10.1080/03088830701849084
Dow
nloa
ded
by [
UA
A/A
PU C
onso
rtiu
m L
ibra
ry]
at 0
9:03
16
Oct
ober
201
4

consider two restrictions: maximum cargo volumes capacitated at each seaport and
maximum number of vehicles available at each transportation mode.There are several previous research articles closely related to the MTP. Note that
all of the previous research consider routing problem while the MTP determine the
transportation flow. Min [3] considers the problem of determining the transportation
route and mode (among truck, airplane and ocean-ship) while sending cargoes to a
destination located in an oversea country. The objective is to minimize the cost and
time, and risk factors. To solve the problem, he employs a goal programming model
subject to chance constraint needed to calculate the risk. Barnhart and Ratliff [4]
consider the problem of determining the minimum cost routing for each shipment
with the combination of truck and rail. The cost includes the transportation and
inventory holding costs. To solve the problem, they employ a shortest path and
weighted b-matching algorithms. More recently, Boardman et al. [5] consider the
problem of determining the transportation route and the combination of
transportation modes (truck, rail, air and barge) while minimizing cost and time.
To solve the problem, they suggest a sort of shortest path algorithm. Other related
problems are network design and multimodal network flow problems. The network
design problem has been widely considered in the literature and there is a variety of
its applications including transportation, telecommunication and power systems [6].
For literature review for applications, models and methods, see [2, 7, 8]. Since there is
huge number of existing literatures, this review deals with only outstanding articles
classified using suggested methods, which are benders decomposition [6], dual accent
[8], cutting plane [9] and Lagrangian relaxation [10]. The multimodal network flow
problem determines the transportation flow and mode. Crainic and Rousseau [11]
consider the problem for the objective of minimizing the operation and delay costs
and suggest an optimal algorithm based on decomposition and column generation.
Guelat et al. [12] suggest a heuristic algorithm for the problem with the objective of
total routing and transfer costs and perform a case study with Brazil transportation
network and after Crainic et al. [13] analyse the rail component considered by Guelat
et al. [12] and suggest a strategic modelling framework of rail freight transportation.
Drissi-Kaitouni [14] suggests several heuristics, which are improved versions of
Guelat et al.’s [12] heuristic algorithm by identifying some unnecessary time
consuming part in Guelat et al.’s [12]. Haghani and Oh [15] consider the disaster
relief management problem, which can be regarded as the multimodal network flow
problem with time windows. To solve the problem they suggest two solution
algorithms working well large sized problems. Nijkamp et al. [16] compare statistical
estimation modes: discrete choice models and the neural network model using the
data of European freight flows.In this paper, we employ a mixed integer programming model to solve the MTP,
which is an operations research technique and is commonly used to solve a problem
such as that considered in this paper. A case study is performed on the container
cargo data in Korea and test results are reported. Also, we draw several implications
to improve efficiency in the transportation of international trade cargoes in Korea.
The next section describes the MTP in more detail and section 3 employs a mixed
integer programming model. Then, a case study on the real data of international
container cargoes in Korea is performed and test results are summarized in section 4
and, finally, this paper is completed with concluding remarks as well as future
research directions.
104 H.-J. Kim et al.
Dow
nloa
ded
by [
UA
A/A
PU C
onso
rtiu
m L
ibra
ry]
at 0
9:03
16
Oct
ober
201
4

2. Problem description
This section begins with explaining the transportation network. Figure 1 shows anexample of the transportation network. In the figure, the dotted area represents seaand the shaded area represents the inland of Korea. In the network, each nodecorresponds to foreign seaports, domestic seaport, inland container depots (ICD)and domestic cities, e.g. nodes F1 and F2 are foreign seaports, D1 and D2 aredomestic seaports, I1 and I2 are ICDs, and C1 and C2 are domestic cities. Also, eacharrow represents transportation flow of cargoes, i.e. solid arrows represent importflows while dotted arrows represent export flows. In the figure, the numbers locatedat the most left side imply the supply and the demand amounts in foreign seaports,while those located at the most right side imply those at domestic cities. For example,5000 20-foot equivalent units (TEU) and 10 000 TEU are the number of suppliedcargoes and the number of the demanded cargoes in foreign seaport F1, respectively.The transportation in the country is done by trucks and trains in a direct way to adestination (cities or domestic seaports) or by the way of an ICD. When imported bythe way of an ICD, it is assumed that trains first and then trucks are used totransport cargoes to cities, while vice versa when exported by the way of an ICD,according to the real situation in Korea. Here, the flow between ICDs is assumed notto occur based on the real situation in Korea.
Now, the MTP can be described as follows: for a given transportation network,the problem is to determine the transportation quantity and the number of vehiclesof each transportation mode over one planning period while satisfying the demand ofcargoes in domestic cities and foreign seaports using the supply in foreign seaportsand domestic cities, respectively, for the objective of minimizing the sum of shippingand transportation costs. The shipping cost implies the total cost charged whiletransporting cargoes from foreign to domestic ports. The cost includes the inventoryholding and transit costs, and terminal handling charge, where the inventory holding
10000 TEU
20000 TEU
5000 TEU
15000 TEU
import flow
export flow
Foreignseaports
F2
F1
D2
D1
C2
Domestic cities
I1
ICDs
I2
15000 TEU
15000 TEU
10000 TEU
10000 TEU
Domesticseaports
C1
Figure 1. An example of the transportation network for container cargo flow.
Optimizing transportation of international container cargoes 105
Dow
nloa
ded
by [
UA
A/A
PU C
onso
rtiu
m L
ibra
ry]
at 0
9:03
16
Oct
ober
201
4
cost is the cost occurred while cargoes are held during the transportation, the transit
cost implies the cost incurred for transporting cargoes, and the terminal handling
charge is the cost occurred for the stevedoring service of cargoes at a domestic
seaport. Here, we do not take account of the terminal handling charge at foreign
seaports since we assume that the charge at foreign seaports is already given before
shipping cargoes from foreign seaports. (Note that this paper considers cargoes after
shipping from foreign seaports.) Second, the transportation cost implies the total
cost charged while transporting cargoes in the country, which includes the inventory
holding and transit costs, and the terminal handling charge (if and only if visiting
any ICD).This paper considers two restrictions: capacity restriction and vehicle restriction.
The capacity restriction implies that there is a limitation on the total cargo volume
that can be handled at each seaport. The vehicle restriction consists of two
restrictions that are different with respect to transportation mode types
(two transportation modes are considered, truck and train, which are main
transportation means in Korea). For truck, the restriction is given in the form of
the total available time of trucks, which is the total time of trucks (available at each
Korean seaport or Korean city) that can be operated during the planning period.
On the other hand, the restriction for train is given in the form of the maximum
number of trains, which is the total number of trains operated on each train line
during the planning period.Finally, other assumptions made in this paper are summarized as follows:
(a) every parameter used in this paper is given and deterministic; (b) one type of ship
is used while transporting cargoes from foreign seaports to domestic seaports;
(c) there is no limitation on the number of ships, i.e. all cargoes can be transported
from foreign seaports to domestic seaports; (d) while transporting cargoes, one type
of container is used, each transportation mode is fully loaded, and traffic congestion
never occurs; and (e) all transportation modes are in perfect state, i.e. they are not
out of order throughout the planning period.
3. A mathematical programming model
In this section, we present a mixed integer programming model to solve optimally
and represent the MTP. First, the notations used in the formulation are
summarized below. (Note that parameters and variables given below are for one
planning period.)Parameters:
I set of foreign seaportsJ set of domestic seaportsK set of domestic citiesT set of ICDsM set of transportation modes, i.e. {1, 2} where 1 and 2 represent truck and
train, respectivelycfij shipping cost per TEU between i2 I and j2 J, which is calculated as
cfij ¼ h � ttij þ ctij þ thcj
106 H.-J. Kim et al.
Dow
nloa
ded
by [
UA
A/A
PU C
onso
rtiu
m L
ibra
ry]
at 0
9:03
16
Oct
ober
201
4
where h is the inventory holding cost per unit time and container box,
ctij is the transit cost per TEU, ttij is the shipping time, and thcj is the
terminal handling charge per TEU
nm number of TEUs that can be carried by transportation mode m2Mtmjk transit time of transportation mode m2M required for operating between
j2 J[T and k2Kcdmjk transportation cost of transportation mode m2M between j and k, which
is calculated using
cd mjk ¼ h � t mjk þ c m
jk
� �� nm
if j 2 J and k 2 K, and j 2 K and k 2 T
or j 2 K and k 2 T
where c mjk are the transit cost of transportation mode m per vehicle
uj total available time of trucks at j2 J[K[Tvjk number of trains operated on train line j to k, where j2 J and k2K or j2 J
and k2Tsfi supply amount from foreign seaport i2 Isdk supply amount from city k2Kdfi demand amount at foreign seaport i2 Iddk demand amount at city k2Kaj capacity of domestic seaport j2 J
Decision variables:SIij import amount from foreign seaport i2 I to domestic seaport j2 JSEji export amount from domestic seaport j2 J to foreign seaport i2 IDIjk import amount from domestic seaport j2 J to city k2KDEkj export amount from city k to domestic seaport j2 JVImjk number of vehicles of transportation mode m2M to transport cargoes
from j to k, where j2 J and k2K, j2 J and k2T, or j2T and k2KVEm
kj number of vehicles of transportation mode m2M to transport cargoes
from k to j, where k2K and j2 J, k2K and j2T, or k2T and j2 JAIjk import amount transported directly from j2 J to k2KAEkj import amount transported directly from k2K to j2 JTIjtk import amount transported from j2 J to k2K by the way of t2TTEktj export amount transported from k2K to j2 J by the way of t2T
Now, the integer program is given below.
Minimize
Xi2I
Xj2J
cfij � SIij þ SEji
� �þXj2J
Xk2K
Xm2M
cd mjk � VI mjk þ VEm
kj
� �
þXj2J
Xt2T
cd2jt � VI2jt þ VE2tj
� �þXt2T
Xk2K
cd1tk � VI1tk þ VE1kt
� �
Optimizing transportation of international container cargoes 107
Dow
nloa
ded
by [
UA
A/A
PU C
onso
rtiu
m L
ibra
ry]
at 0
9:03
16
Oct
ober
201
4
subject toXj2J
SIij ¼ sfi for all i 2 I ð1Þ
Xj2J
DEkj ¼ sdk for all k 2 K ð2Þ
Xj2J
DIjk ¼ ddk for all k 2 K ð3Þ
Xj2J
SEji ¼ dfi for all i 2 I ð4Þ
Xi2I
SIij ¼Xk2K
DIjk for all j 2 J ð5Þ
Xk2K
DEkj ¼Xi2I
SEji for all j 2 J ð6Þ
Xi2I
SIij þ SEji
� �� aj for all j 2 J ð7Þ
DIjk ¼ AIjk þXt2T
TIjtk for all j 2 J and k 2 K ð8Þ
DEkj ¼ AEkj þXt2T
TEktj for all j 2 J and k 2 K ð9Þ
AIjk �Xm2M
nm � VImjk for all j 2 J and k 2 K ð10Þ
AEkj �Xm2M
nm � VEmkj for all j 2 J and k 2 K ð11Þ
Xk2K
TIjtk � n2 � VI2jt for all j 2 J and t 2 T ð12Þ
Xk2K
TEktj � n2 � VE2tj for all j 2 J and t 2 T ð13Þ
Xj2J
TIjtk � n1 � VI1tk for all t 2 T and k 2 K ð14Þ
Xj2J
TEktj � n1 � VE1kt for all t 2 T and k 2 K ð15Þ
108 H.-J. Kim et al.
Dow
nloa
ded
by [
UA
A/A
PU C
onso
rtiu
m L
ibra
ry]
at 0
9:03
16
Oct
ober
201
4
Xk2K
t1jk � VI1jk � uj for all j 2 J ð16Þ
Xj2J[T
t1jk � VE1kj � uk for all k 2 K ð17Þ
Xk2K
t1tk � VI1tk � ut for all t 2 T ð18Þ
VI2jk � vjk for all j 2 J and k 2 K [ T ð19Þ
VE2kj � vkj for all j 2 J and k 2 K ð20Þ
VE2tj � vtj for all j 2 J and t 2 T ð21Þ
SIij, SEji � 0 for all i 2 I and j 2 J ð22Þ
DIjk,DEkj � 0 for all j 2 J and k 2 K ð23Þ
VImjk, VEmkj � 0 and integers for all j 2 J, k 2 K, and m 2 M ð24Þ
VI1tk, VE1kt � 0 and integers for all t 2 T and k 2 K ð25Þ
VI2jt, VE2tj � 0 and integers for all j 2 J and t 2 T ð26Þ
AIjk, AEkj � 0 for all j 2 J and k 2 K ð27Þ
TIjtk, TEktj � 0 for all j 2 J, t 2 T, and k 2 K ð28Þ
The objective function denotes the sum of shipping and transportation costs.
Constraints (1)–(4) represent the supply and demand restrictions. In more detail,
constraints (1) and (2) represent the supply restrictions, which imply that the cargoes
going out from a foreign seaport and a domestic city should be equal to the supply
amount in the seaport and the city, respectively. On the other hand, constraints (3)
and (4) represent that demands in a foreign seaport and a domestic city should be
satisfied, respectively. Constraints (5) and (6) represent the flow conservation, which
implies that the amount of cargoes coming to a domestic seaport is equal to the
amount of cargoes going out from the seaport. Constraint (7) states that the total
amount of cargoes handled at a domestic seaport cannot exceed the capacity of the
seaport. Constraints (8) and (9) generate the amount of cargoes transported directly
or by way of an ICD. Constraints (10)–(15) generate the number of vehicles used to
transport cargoes, together with constraints (16)–(21) that restrict the number
of vehicles available at each depot. In more detail, the cargoes imported
(constraint (10)) and exported (constraint (11)) in a direct way, i.e. not by way of
an ICD, are transported by vehicles, i.e. truck and/or train. Constraints (12) and (13)
Optimizing transportation of international container cargoes 109
Dow
nloa
ded
by [
UA
A/A
PU C
onso
rtiu
m L
ibra
ry]
at 0
9:03
16
Oct
ober
201
4

state that cargoes are transported to the destination by way of an ICD by train, whiletrucks are used in constraints (14) and (15). Constraints (16)–(18) represent that thetotal time required for using trucks is less than or equal to their available time at eachdepot. Constraints (19)–(21) represent that the number of trains operated on atrain line cannot exceed the existing number of trains available for the line.Finally, the other constraints (22)–(28) are the conditions on the decision variables.In particular, the number of vehicles represented in constraints (24)–(26) shouldhave integer values.
4. A case study
In this section, a case study on the container cargo data in Korea is performed. First,the container cargo data in Korea is summarized and then, test results andimplications are summarized. In this test, CPLEX 9.1, a commercial softwarepackage, was used to solve the mixed integer program.
The data include two transportation modes (truck and train), two ICDs(Uiwang and Yangsan), five domestic ports (Busan, Gwanyang, Incheon, Ulsanand Pyeongteak), and 43 domestic cities (Gangwon 1, 2, 3, Gyunggi 1, 2, 3,Gyungnam 1, 2, 3, Gyungbuk 1, 2, 3, Gwangju 1, 2, 3, Daegu 1, 2, Daejon 1, 2,Busan 1, 2, 3, Seoul 1, 2, 3, 4, Ulsan 1, 2, Incheon 1, 2, 3, Cheonnam 1, 2, 3,Cheonbuk 1, 2, 3, Chungnam 1, 2, 3, and Chungbuk 1, 2, 3), which are major tradinggates in Korea. We consider only seaports in Northeast and Southeast Asia, sincethis paper focuses on seaports within short sea in the viewpoint of Korea, and theyare the seaports of Yokohama, Yamaguchi, Tokyo, Osaka, Nagoya, Hakata, Otherports in Japan, Hong Kong, Kaohsiung, Keelung, other ports in Taiwan, Shanghai,Xingang, Dalian, Qingdao, Ningbo, Weihai, Yantai, other ports in China,Singapore, Malaysia, other ports in Southeast Asia (22 foreign seaports areconsidered). Also, we aggregated cities according to an expert’s advice intransportation due to an excessive amount of cities in Korea. The number ofTEUs transported by a transportation mode was set to 1 for a truck and 50 for atrain and the number of TEUs by a ship was set to 1100 for Southeast Asiancountries, i.e. SP, ML, OS and 600 for the others. Also, the inventory holding costwas set to $0.42 using the method given in Chang and Sung [17]. Table 1 summarizesthe supply and demand data in foreign seaports and domestic cities in year 2005.Also, table 2 summarizes the capacity (Ci) of each domestic seaport, which iscalculated by
Ci ¼ ri � C�i
where ri is the ratio of the cargo volume corresponding to short sea shipping amongthe total throughput handled at domestic seaport i and Ci
* is the total capacity of theseaport obtained after eliminating the transshipment cargoes. Remaining data aregiven in the Appendix. Note that the available time of truck and the number of trainsare calculated by using the similar method used in calculating the capacity of eachdomestic seaport.
Test results are summarized in table 3, which shows the optimal solution, thethroughput at each domestic seaport and the number of vehicles of eachtransportation mode. As can be seen from table 3(a), the optimal throughput ofBusan seaport is less than its real throughput in year 2005. This result can be
110 H.-J. Kim et al.
Dow
nloa
ded
by [
UA
A/A
PU C
onso
rtiu
m L
ibra
ry]
at 0
9:03
16
Oct
ober
201
4

Table
1.
Supply
anddem
anddata
(TEU).
(a)Foreignseaport
YK
YM
TK
OS
NG
HT
OJ
HK
KS
KL
OT
Supply
109400
88351
84701
108046
62065
91710
199806
500401
45002
473842
11869
Dem
and
40207
27137
63486
53913
41723
24434
103842
264860
54847
60401
20618
SH
XG
DL
QD
NB
WH
YT
OC
SP
ML
OS
Supply
158062
176090
112332
182100
74394
36175
22378
88826
135545
107585
15703
Dem
and
182092
206449
93908
153088
71306
38333
49535
17041
68902
97937
353943
Notes:YK:Yokohama,YM:Yamaguchi,TK:Tokyo,OS:Osaka,NG:Nagoya,HT:Hakata,OJ:
Other
portsin
Japan,HK:HongKong,KS:Kaohsiung,KL:Keelung,
OT:Other
portsin
Taiwan,SH:Shanghai,XG:Xingang,DL:Dalian,QD:Qingdao,NB:Ningbo,WH:Weihai,YT:Yantai,OC:Other
portsin
China,SP:Singapore,
ML:Malaysia,OS:Other
portsin
Southeast
Asia.
Source:
KoreaCustomsandTradeDevelopmentInstitute.
Optimizing transportation of international container cargoes 111
Dow
nloa
ded
by [
UA
A/A
PU C
onso
rtiu
m L
ibra
ry]
at 0
9:03
16
Oct
ober
201
4

Table
1.
Continued.
(b)Domesticcity
GW1
GW2
GW3
GG1
GG2
GG3
GN1
GN2
GN3
GB1
GB2
Supply
230
2300
2933
37928
236253
23371
13892
57504
71583
18741
24337
Dem
and
1608
3179
1708
128875
759738
100390
14000
43918
55100
19572
39169
GB3
GJ1
GJ2
GJ3
DG1
DG2
DJ1
DJ2
BS1
BS2
BS3
Supply
93367
47345
7396
24354
17854
40374
3451
47828
13970
7368
13701
Dem
and
73812
8602
9550
61009
12379
29158
6520
93409
38109
65933
53642
SU1
SU2
SU3
SU4
US1
US2
IC1
IC2
IC3
CN1
CN2
Supply
99002
6186
64594
38199
34007
185912
1101
59231
155118
8833
2515
Dem
and
306381
23798
302355
160714
15370
27189
424
158420
50039
6258
3229
CN3
CB1
CB2
CB3
CUN1
CUN2
CUN3
CUB1
CUB2
CUB3
Supply
377182
55434
5745
1305
58379
31703
39357
45362
9750
3007
Dem
and
26678
28659
2107
3191
9898
16742
50114
51049
16855
5533
Notes:
GW1:Gangwon1,GW2:Gangwon2,GW3:Gangwon3,GG1:Gyunggi1,GG2:Gyunggi2,GG3:Gyunggi3,GN1:Gyungnam1,GN2:Gyungnam2,
GN3:Gyungnam3,GB1:Gyungbuk1,GB2:Gyungbuk2,GB3:Gyungbuk3,GJ1:Gwangju1,GJ2:Gwangju2,GJ3:Gwangju3,DG1:Daegu1,DG2:Daegu2,
DJ1:Daejon1,DJ2:Daejon2,BS1:Busan1,BS2:Busan2,BS3:Busan3,SU1:Seoul1,SU2:Seoul2,SU3:Seoul3,SU4:Seoul4,US1:Ulsan1,US2:Ulsan2,IC
1:Incheon1,
IC2:Incheon2,IC
3:Incheon3,CN1:Cheonnam1,CN2:Cheonnam2,CN3:Cheonnam3,CB1:Cheonbuk1,CB2:Cheonbuk2,CB3:Cheonbuk3,CUN1:Chungnam1,
CUN2:Chungnam2,CUN3:Chungnam3,CUB1:Chungbuk1,CUB2:Chungbuk2,CUB3:Chungbuk3
Source:
KoreaCustomsandTradeDevelopmentInstitute.
112 H.-J. Kim et al.
Dow
nloa
ded
by [
UA
A/A
PU C
onso
rtiu
m L
ibra
ry]
at 0
9:03
16
Oct
ober
201
4

translated as: Busan seaport should more focus on deep sea shipping; or a less
capacity of Busan seaport than the current capacity is required. On the contrary, the
optimal solution indicates that the other seaports should be fully used (more capacity
may be needed), in other words, the other seaports should be more used for handling
short sea shipping. From table 3(b), we can see that truck should be mainly used to
transport cargoes corresponding to short sea shipping. Note that although the
number of trains is 2903 in total and hence 145 150 TEU (¼2903 � 50) should be
carried by trains due to the assumption of full-loaded vehicle, we put the number of
TEUs of trains as 120 071 TEU in table 3(b), which is obtained by subtracting the
number of TEUs of trucks (4 852 314) from the total cargo volume for short sea
shipping traded in Korea (4 972 385 TEU).Table 4 shows the cargo volume for metropolitan cities in Korea (Seoul, Incheon,
Gyunggi province) handled at each seaport. Like the current situation in Korea,
Busan seaport should handle 70.5% of the cargo volume for Seoul (SU1-4), Incheon
(IC1-3) and Gyunggi province (GG1-3). Also, we can see that seaports of
Gwangyang and Pyeongteak should be rarely used for trading the cargoes generated
Table 2. Capacity of domestic seaport.
Port Capacity (TEU)
Busan 4 645 322Gwangyang 818 603Incheon 713 696Ulsan 183 859Pyeongteak 134 292
Source: Each Regional Ports Maritime Affairs and FisheriesOffice.
Table 3. Test result.
(a) Throughput at each domestic seaportTEU CP�� (%) Share�� (%)
Busan 3 121 935 (3 894 421)� 67.2 (83.8)� 62.8 (78.3)�
Gwangyang 818 603 (441 774) 100.0 (54.0) 16.5 (8.9)Incheon 713 696 (449 780) 100.0 (63.0) 14.4 (9.0)Ulsan 183 859 (85 672) 100.0 (46.6) 3.7 (1.7)Pyeongteak 134 292 (100 738) 100.0 (75.0) 2.7 (2.0)
Notes: �test result and real data in parenthesis.��throughput/capacity � 100.���throughput/total cargo volume � 100.
(b) Number of vehicles of each modeNV� TEU Share�� (%)
Truck 4 852 314 4 852 314 97.6Train 2903 120 071 2.4
Notes: �number of vehicles.��cargo volume/total cargo volume � 100.
Optimizing transportation of international container cargoes 113
Dow
nloa
ded
by [
UA
A/A
PU C
onso
rtiu
m L
ibra
ry]
at 0
9:03
16
Oct
ober
201
4

in metropolitan cities. An interesting point is that Incheon seaport should handleonly metropolitan cargoes as can be seen from tables 3 and 4.
5. Concluding remarks
In this paper, we considered the problem of determining the transportation flowquantity and the transportation mode in each trade route, for the objective ofminimizing the sum of shipping and transportation costs, restricted to maximumcargo volumes capacitated at each seaport and maximum number of vehiclesavailable at each transportation mode. To solve optimally and represent theproblem, this paper employed a mixed integer programming. From the case study onthe container cargo data in Korea, the optimal solution suggested that Busan seaportshould be less used for handling the cargo, while the seaports should be more used.Second, truck should be mainly to transport the cargo, and, finally, the cargo formetropolitan cities should be handled mainly Busan and Incheon seaports.
For further study, the various ship types will be considered to make this researchmore realistic. Third, the effect if transit costs become different will be analysed.Fourth, time factors will be considered in the objective function to consider the realsituation that trucks are more used than trains in Korea (note that time factors areconsidered only together with inventory holding costs in this paper).
There are some future research directions. First, it is worth considering moretransportation modes, such as airplane, barge, etc. Second, the demand in foreigncities (not that in foreign seaports as used in this paper) is worthwhile beingconsidered. In this case, the capacity of foreign seaports and all parameterscorresponding to inland transportation should be used. Third, traffic andenvironmental factors should be considered to present more realistic situations.
References1. CHANG, Y. T., 2003, Korea’s strategic plan to be northeast Asia’s logistics hub: towards
the pentaport approach. Korea Observer, 34, 437–460.2. MAGNANTI, T. L. and WONG, R. T., 1984, Network design and transportation planning:
models and algorithms. Transportation Science, 18, 1–55.3. MIN, H., 1991, International intermodal choices via chance-constrained goal
programming. Transportation Research Part A: General, 25, 351–362.4. BARNHART, C. and RATLIFF, H. D., 1993, Modeling intermodal routing. Journal of
Business Logistics, 14, 205–223.5. BOARDMAN, B. S., MALSTROM, E. M., BUTLER, D. P. and COLE, M. H., 1997, Computer
assisted routing of intermodal shipments. Computers and Industrial Engineering, 33,311–314.
Table 4. Cargo volume for metropolitan cities.
TEU Share (%)�
Busan 2 029 645 73.0Gwangyang 35 519 1.3Incheon 713 696 25.7Ulsan 600 0.02Pyeongteak 0 0
Note: �TEU/total cargo volume for the cities � 100.
114 H.-J. Kim et al.
Dow
nloa
ded
by [
UA
A/A
PU C
onso
rtiu
m L
ibra
ry]
at 0
9:03
16
Oct
ober
201
4

6. COSTA, A. M., 2005, A survey on benders decomposition applied to fixed-charge networkdesign problems. Computers and Operations Research, 32, 1429–1450.
7. MINOUX, M., 1989, Network synthesis and optimum network design problems: models,solution methods and applications. Networks, 19, 313–360.
8. BALAKRISHNAN, A., MAGNANTI, T. L. and WONG, R. T., 1989, A dual-ascent procedurefor large-scale uncapacitated network design. Operations Research, 37, 716–740.
9. BALAKRISHNAN, A., 1987, LP extreme points and cuts for the fixed-charge network designproblem. Mathematical Programming, 39, 263–284.
10. HOLMBERG, K. and YUAN, D., 1998, A Lagrangean approach to network designproblems. International Transactions in Operational Research, 5, 529–539.
11. CRAINIC, T. and ROUSSEAU, J., 1986, Multicommodity, multimode freight transportation:a general modelling and algorithmic framework for the service network design problem.Transportation Research Part B, 20, 225–242.
12. GUELAT, J., FLORIAN, M. and CRAINIC, T., 1990, A multimode multiproduct networkassignment model for strategic planning of freight flows. Transportation Science, 24,25–39.
13. CRAINIC, T., FLORIAN, M. and LEAL, J., 1990, A model for the strategic planningof national freight transportation by rail. Transportation Science, 24, l–24.
14. DRISSI-KAITOUNI, O., 1991, Solution approaches for multimode multiproduct assignmentproblems. Transportation Research Part B, 25, 317–327.
15. HAGHANI, A. and OH, S.-C., 1996, Formulation and solution of a multi-commodity,multi-modal network flow model for disaster relief operations. Transportation ResearchPart A, 30, 231–251.
16. NIJKAMP, P., REGGIANI, A. and TSANG, W. F., 2004, Comparative modelling ofinterregional transport flows: applications to multimodal European freight transport.European Journal of Operational Research, 155, 584–602.
17. CHANG, Y.-T. and SUNG, S.-K., 2002, Revisit to estimate the time cost of ships andcargoes. Journal of Korean Navigation and Port Research, 26, 383–390.
Optimizing transportation of international container cargoes 115
Dow
nloa
ded
by [
UA
A/A
PU C
onso
rtiu
m L
ibra
ry]
at 0
9:03
16
Oct
ober
201
4
Appendix
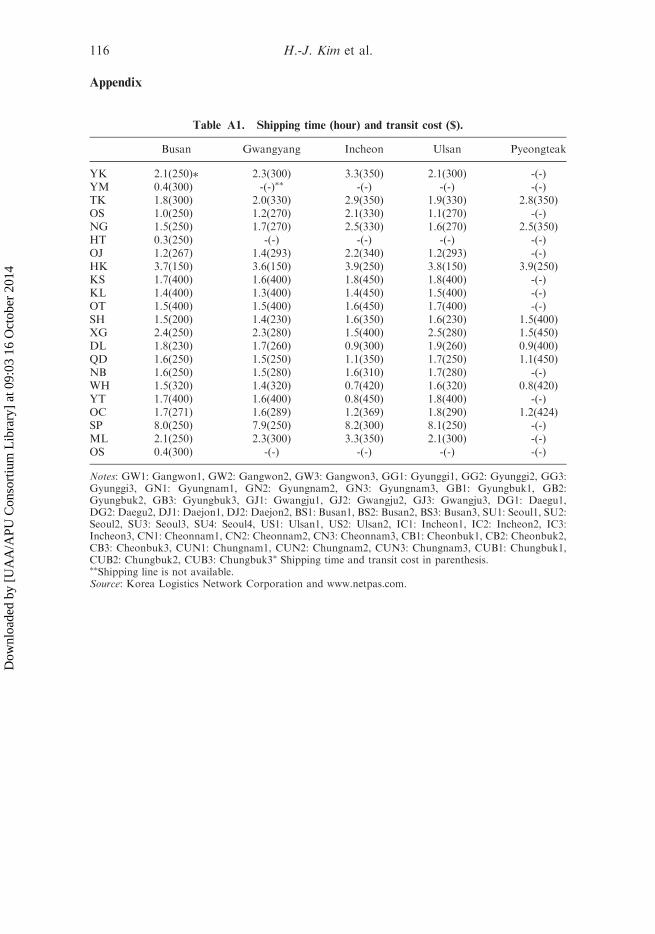
Table A1. Shipping time (hour) and transit cost ($).
Busan Gwangyang Incheon Ulsan Pyeongteak
YK 2.1(250)� 2.3(300) 3.3(350) 2.1(300) -(-)YM 0.4(300) -(-)�� -(-) -(-) -(-)TK 1.8(300) 2.0(330) 2.9(350) 1.9(330) 2.8(350)OS 1.0(250) 1.2(270) 2.1(330) 1.1(270) -(-)NG 1.5(250) 1.7(270) 2.5(330) 1.6(270) 2.5(350)HT 0.3(250) -(-) -(-) -(-) -(-)OJ 1.2(267) 1.4(293) 2.2(340) 1.2(293) -(-)HK 3.7(150) 3.6(150) 3.9(250) 3.8(150) 3.9(250)KS 1.7(400) 1.6(400) 1.8(450) 1.8(400) -(-)KL 1.4(400) 1.3(400) 1.4(450) 1.5(400) -(-)OT 1.5(400) 1.5(400) 1.6(450) 1.7(400) -(-)SH 1.5(200) 1.4(230) 1.6(350) 1.6(230) 1.5(400)XG 2.4(250) 2.3(280) 1.5(400) 2.5(280) 1.5(450)DL 1.8(230) 1.7(260) 0.9(300) 1.9(260) 0.9(400)QD 1.6(250) 1.5(250) 1.1(350) 1.7(250) 1.1(450)NB 1.6(250) 1.5(280) 1.6(310) 1.7(280) -(-)WH 1.5(320) 1.4(320) 0.7(420) 1.6(320) 0.8(420)YT 1.7(400) 1.6(400) 0.8(450) 1.8(400) -(-)OC 1.7(271) 1.6(289) 1.2(369) 1.8(290) 1.2(424)SP 8.0(250) 7.9(250) 8.2(300) 8.1(250) -(-)ML 2.1(250) 2.3(300) 3.3(350) 2.1(300) -(-)OS 0.4(300) -(-) -(-) -(-) -(-)
Notes: GW1: Gangwon1, GW2: Gangwon2, GW3: Gangwon3, GG1: Gyunggi1, GG2: Gyunggi2, GG3:Gyunggi3, GN1: Gyungnam1, GN2: Gyungnam2, GN3: Gyungnam3, GB1: Gyungbuk1, GB2:Gyungbuk2, GB3: Gyungbuk3, GJ1: Gwangju1, GJ2: Gwangju2, GJ3: Gwangju3, DG1: Daegu1,DG2: Daegu2, DJ1: Daejon1, DJ2: Daejon2, BS1: Busan1, BS2: Busan2, BS3: Busan3, SU1: Seoul1, SU2:Seoul2, SU3: Seoul3, SU4: Seoul4, US1: Ulsan1, US2: Ulsan2, IC1: Incheon1, IC2: Incheon2, IC3:Incheon3, CN1: Cheonnam1, CN2: Cheonnam2, CN3: Cheonnam3, CB1: Cheonbuk1, CB2: Cheonbuk2,CB3: Cheonbuk3, CUN1: Chungnam1, CUN2: Chungnam2, CUN3: Chungnam3, CUB1: Chungbuk1,CUB2: Chungbuk2, CUB3: Chungbuk3� Shipping time and transit cost in parenthesis.��Shipping line is not available.Source: Korea Logistics Network Corporation and www.netpas.com.
116 H.-J. Kim et al.
Dow
nloa
ded
by [
UA
A/A
PU C
onso
rtiu
m L
ibra
ry]
at 0
9:03
16
Oct
ober
201
4
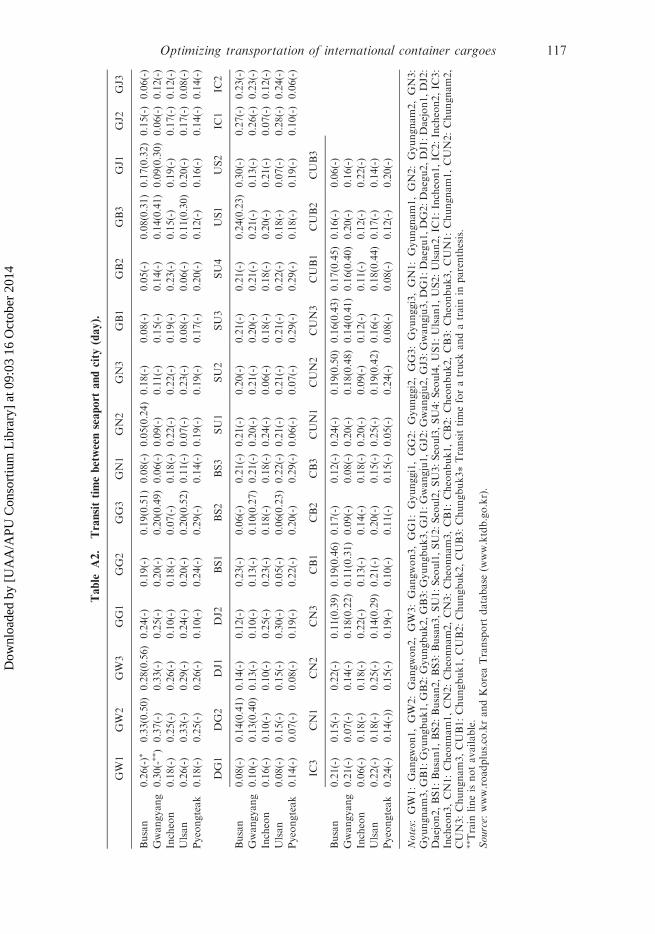
Table
A2.
Transittimebetweenseaport
andcity
(day).
GW1
GW2
GW3
GG1
GG2
GG3
GN1
GN2
GN3
GB1
GB2
GB3
GJ1
GJ2
GJ3
Busan
0.26(-)�
0.33(0.50)
0.28(0.56)
0.24(-)
0.19(-)
0.19(0.51)
0.08(-)
0.05(0.24)
0.18(-)
0.08(-)
0.05(-)
0.08(0.31)
0.17(0.32)
0.15(-)
0.06(-)
Gwangyang
0.30(-��)
0.37(-)
0.33(-)
0.25(-)
0.20(-)
0.20(0.49)
0.06(-)
0.09(-)
0.11(-)
0.15(-)
0.14(-)
0.14(0.41)
0.09(0.30)
0.06(-)
0.12(-)
Incheon
0.18(-)
0.25(-)
0.26(-)
0.10(-)
0.18(-)
0.07(-)
0.18(-)
0.22(-)
0.22(-)
0.19(-)
0.23(-)
0.15(-)
0.19(-)
0.17(-)
0.12(-)
Ulsan
0.26(-)
0.33(-)
0.29(-)
0.24(-)
0.20(-)
0.20(0.52)
0.11(-)
0.07(-)
0.23(-)
0.08(-)
0.06(-)
0.11(0.30)
0.20(-)
0.17(-)
0.08(-)
Pyeongteak
0.18(-)
0.25(-)
0.26(-)
0.10(-)
0.24(-)
0.29(-)
0.14(-)
0.19(-)
0.19(-)
0.17(-)
0.20(-)
0.12(-)
0.16(-)
0.14(-)
0.14(-)
DG1
DG2
DJ1
DJ2
BS1
BS2
BS3
SU1
SU2
SU3
SU4
US1
US2
IC1
IC2
Busan
0.08(-)
0.14(0.41)
0.14(-)
0.12(-)
0.23(-)
0.06(-)
0.21(-)
0.21(-)
0.20(-)
0.21(-)
0.21(-)
0.24(0.23)
0.30(-)
0.27(-)
0.23(-)
Gwangyang
0.10(-)
0.13(0.40)
0.13(-)
0.10(-)
0.13(-)
0.10(0.27)
0.21(-)
0.20(-)
0.21(-)
0.20(-)
0.21(-)
0.21(-)
0.13(-)
0.26(-)
0.23(-)
Incheon
0.16(-)
0.10(-)
0.10(-)
0.25(-)
0.23(-)
0.18(-)
0.18(-)
0.24(-)
0.06(-)
0.18(-)
0.18(-)
0.20(-)
0.21(-)
0.07(-)
0.12(-)
Ulsan
0.08(-)
0.15(-)
0.15(-)
0.30(-)
0.05(-)
0.06(0.23)
0.22(-)
0.21(-)
0.21(-)
0.21(-)
0.22(-)
0.18(-)
0.07(-)
0.28(-)
0.24(-)
Pyeongteak
0.14(-)
0.07(-)
0.08(-)
0.19(-)
0.22(-)
0.20(-)
0.29(-)
0.06(-)
0.07(-)
0.29(-)
0.29(-)
0.18(-)
0.19(-)
0.10(-)
0.06(-)
IC3
CN1
CN2
CN3
CB1
CB2
CB3
CUN1
CUN2
CUN3
CUB1
CUB2
CUB3
Busan
0.21(-)
0.15(-)
0.22(-)
0.11(0.39)
0.19(0.46)
0.17(-)
0.12(-)
0.24(-)
0.19(0.50)
0.16(0.43)
0.17(0.45)
0.16(-)
0.06(-)
Gwangyang
0.21(-)
0.07(-)
0.14(-)
0.18(0.22)
0.11(0.31)
0.09(-)
0.08(-)
0.20(-)
0.18(0.48)
0.14(0.41)
0.16(0.40)
0.20(-)
0.16(-)
Incheon
0.06(-)
0.18(-)
0.18(-)
0.22(-)
0.13(-)
0.14(-)
0.18(-)
0.20(-)
0.09(-)
0.12(-)
0.11(-)
0.12(-)
0.22(-)
Ulsan
0.22(-)
0.18(-)
0.25(-)
0.14(0.29)
0.21(-)
0.20(-)
0.15(-)
0.25(-)
0.19(0.42)
0.16(-)
0.18(0.44)
0.17(-)
0.14(-)
Pyeongteak
0.24(-)
0.14(-))
0.15(-)
0.19(-)
0.10(-)
0.11(-)
0.15(-)
0.05(-)
0.24(-)
0.08(-)
0.08(-)
0.12(-)
0.20(-)
Notes:
GW1:Gangwon1,GW2:Gangwon2,GW3:Gangwon3,GG1:Gyunggi1,GG2:Gyunggi2,GG3:Gyunggi3,GN1:Gyungnam1,GN2:Gyungnam2,GN3:
Gyungnam3,GB1:Gyungbuk1,GB2:Gyungbuk2,GB3:Gyungbuk3,GJ1:Gwangju1,GJ2:Gwangju2,GJ3:Gwangju3,DG1:Daegu1,DG2:Daegu2,DJ1:Daejon1,DJ2:
Daejon2,BS1:Busan1,BS2:Busan2,BS3:Busan3,SU1:Seoul1,SU2:Seoul2,SU3:Seoul3,SU4:Seoul4,US1:Ulsan1,US2:Ulsan2,IC
1:Incheon1,IC
2:Incheon2,IC
3:
Incheon3,CN1:Cheonnam1,CN2:Cheonnam2,CN3:Cheonnam3,CB1:Cheonbuk1,CB2:Cheonbuk2,CB3:Cheonbuk3,CUN1:Chungnam1,CUN2:Chungnam2,
CUN3:Chungnam3,CUB1:Chungbuk1,CUB2:Chungbuk2,CUB3:Chungbuk3�Transittimeforatruck
andatrain
inparenthesis.
��Train
lineisnotavailable.
Source:
www.roadplus.co.krandKoreaTransport
database
(www.ktdb.go.kr).
Optimizing transportation of international container cargoes 117
Dow
nloa
ded
by [
UA
A/A
PU C
onso
rtiu
m L
ibra
ry]
at 0
9:03
16
Oct
ober
201
4

Table
A3.
Transitcost
betweenseaport
andcity
($).
GW1
GW2
GW3
GG1
GG2
GG3
GN1
GN2
GN3
GB1
GB2
GB3
GJ1
GJ2
GJ3
Busan
590.0(-)�
507.0(170.7)569.5(202.6)542.5(-)
504.5(-)
489.5(176.6)199.5(-)161.5(35.5)160.0(-)
247.5(-)
218.5(-)
274.5(74.5)
318.0(76.6)318.0(-)264.5(-)
Gwangyang
525.0(-)
703.5(-)
516.0(-)
492.0(-)
428.5(-)
451.5(167.8)312.5(-)236.0(-)
180.0(-)
332.5(-)
512.5(-)
387.0(125.6)152.0(67.4)152.0(-)243.0(-)
Incheon
243.0(-)
246.5(-)
307.0(-)
192.5(-)
167.0(-)
219.5(-)
336.0(-)361.0(-)
357.0(-)
355.0(-)
355.0(-)
315.5(-)
348.5(-)
348.5(-)341.5(-)
Ulsan
505.5(-)
448.5(-)
505.5(-)
467.0(-)
446.0(-)
463.0(181.9)161.5(-)161.5(-)
136.0(-)
225.5(-)
118.0(-)
118.0(68.9)
342.0(-)
342.0(-)177.5(-)
Pyeongteak
261.5(-)
231.5(-)
317.0(-)
202.5(-)
102.0(-)
167.5(-)
338.0(-)490.5(-)
429.5(-)
405.5(-)
394.5(-)
327.0(-)
335.0(-)
335.0(-)342.0(-)
DG1
DG2
DJ1
DJ2
PS1
PS2
PS3
SU1
SU2
SU3
SU4
US1
US2
IC1
IC2
Busan
243.0(-)
306.5(126.3)306.5(-)
89.0(-)
106.0(-)
70.0(-)
482.5(-)496.5(-)
496.5(-)
482.5(-)
482.5(-)
136.5(33.6)
154.0(-)
539.0(-)502.0(-)
Gwangyang
278.5(-)
264.5(117.5)264.5(-)
249.5(-)
249.5(-)
249.5(50.4)
428.5(-)441.0(-)
441.0(-)
428.5(-)
428.5(-)
272.0(65.6)
272.0(-)
467.5(-)467.5(-)
Incheon
332.5(-)
273.0(-)
273.0(-)
465.0(-)
465.0(-)
465.0(-)
98.0(-)100.0(-)
100.0(-)
98.0(-)
98.0(-)
361.0(-)
361.0(-)
65.0(-)
65.0(-)
Ulsan
177.5(-)
290.5(-)
290.5(-)
132.5(-)
100.5(-)
117.5(30.8)
458.0(-)465.0(-)
465.0(-)
458.0(-)
458.0(-)
64.0(-)
64.0(-)
475.5(-)475.5(-)
Pyeongteak
359.5(-)1
89.0(-)
189.0(-)
463.0(-)
476.5(-)
463.0(-)
135.0(-)146.5(-)
146.5(-)
135.0(-)
135.0(-)
431.0(-)
431.0(-)
121.5(-)121.5(-)
IC3
CN1
CN2
CN3
CB1
CB2
CB3
CUN1
CUN2
CUN3
CUB1
CUB2
CUB3
Busan
539.0(-)
358.5(-)
347.5(-)
302.0(112.5)365.5(153.7)313.0(-)
322.5(-)436.5(-)
345.0(170.7)344.5(135.2)324.5(147.3)357.0(-)
372.0(-)
Gwangyang
467.5(-)
146.5(-)
160.0(-)
170.5(25.1)
237.0(73.0)
194.5(-)
203.0(-)374.5(-)
363.5(161.9)282.0(126.3)266.5(119.3)290.5(-)
421.5(-)
Incheon
65.0(-)
385.5(-)
385.5(-)
385.5(-)
303.5(-)
303.5(-)
326.0(-)289.5(-)
272.0(-)
224.0(-)
308.5(-)
308.5(-)
290.0(-)
Ulsan
475.5(-)
341.0(-)
368.0(-)
269.0(62.9)
382.0(-)
368.5(-)
357.5(-)393.0(-)
314.5(130.7)312.5(-)
298.0(143.5)320.0(-)
298.0(-)
Pyeongteak
121.5(-)
348.0(-)
386.0(-)
405.5(-)
231.0(-)
287.0(-)
303.0(-)125.5(-)
124.0(-)
113.5(-)
247.5(-)
206.5(-)
203.5(-)
Notes:See
footnote
inTable
A2.
*Transitcost
foratruck
andatrain
inparenthesis.
Source:
KoreaTransport
database
(www.ktdb.go.kr).
118 H.-J. Kim et al.
Dow
nloa
ded
by [
UA
A/A
PU C
onso
rtiu
m L
ibra
ry]
at 0
9:03
16
Oct
ober
201
4
Table
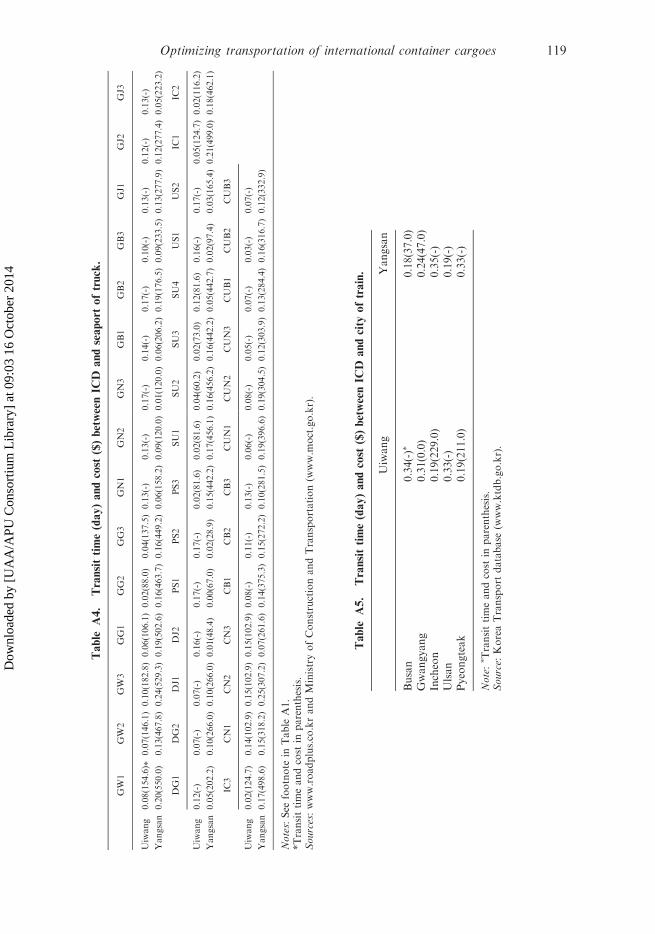
A5.
Transittime(day)andcost
($)betweenIC
Dandcity
oftrain.
Uiwang
Yangsan
Busan
0.34(-)�
0.18(37.0)
Gwangyang
0.31(0.0)
0.24(47.0)
Incheon
0.19(229.0)
0.35(-)
Ulsan
0.33(-)
0.19(-)
Pyeongteak
0.19(211.0)
0.33(-)
Note:�Transittimeandcost
inparenthesis.
Source:
KoreaTransport
database
(www.ktdb.go.kr).
Table
A4.
Transittime(day)andcost
($)betweenIC
Dandseaport
oftruck.
GW1
GW2
GW3
GG1
GG2
GG3
GN1
GN2
GN3
GB1
GB2
GB3
GJ1
GJ2
GJ3
Uiwang
0.08(154.6)�
0.07(146.1)0.10(182.8)0.06(106.1)0.02(88.0)
0.04(137.5)0.13(-)
0.13(-)
0.17(-)
0.14(-)
0.17(-)
0.10(-)
0.13(-)
0.12(-)
0.13(-)
Yangsan
0.20(550.0)
0.13(467.8)0.24(529.3)0.19(502.6)0.16(463.7)0.16(449.2)0.06(158.2)0.09(120.0)0.01(120.0)0.06(206.2)0.19(176.5)0.09(233.5)0.13(277.9)0.12(277.4)0.05(223.2)
DG1
DG2
DJ1
DJ2
PS1
PS2
PS3
SU1
SU2
SU3
SU4
US1
US2
IC1
IC2
Uiwang
0.12(-)
0.07(-)
0.07(-)
0.16(-)
0.17(-)
0.17(-)
0.02(81.6)
0.02(81.6)
0.04(60.2)
0.02(73.0)
0.12(81.6)
0.16(-)
0.17(-)
0.05(124.7)0.02(116.2)
Yangsan
0.05(202.2)
0.10(266.0)0.10(266.0)0.01(48.4)
0.00(67.0)
0.02(28.9)
0.15(442.2)0.17(456.1)0.16(456.2)0.16(442.2)0.05(442.7)0.02(97.4)
0.03(165.4)0.21(499.0)0.18(462.1)
IC3
CN1
CN2
CN3
CB1
CB2
CB3
CUN1
CUN2
CUN3
CUB1
CUB2
CUB3
Uiwang
0.02(124.7)
0.14(102.9)0.15(102.9)0.15(102.9)0.08(-)
0.11(-)
0.13(-)
0.06(-)
0.08(-)
0.05(-)
0.07(-)
0.03(-)
0.07(-)
Yangsan
0.17(498.6)
0.15(318.2)0.25(307.2)0.07(261.6)0.14(375.3)0.15(272.2)0.10(281.5)0.19(396.6)0.19(304.5)0.12(303.9)0.13(284.4)0.16(316.7)0.12(332.9)
Notes:See
footnote
inTable
A1.
*Transittimeandcost
inparenthesis.
Sources:www.roadplus.co.krandMinistryofConstructionandTransportation(w
ww.m
oct.go.kr).
Optimizing transportation of international container cargoes 119
Dow
nloa
ded
by [
UA
A/A
PU C
onso
rtiu
m L
ibra
ry]
at 0
9:03
16
Oct
ober
201
4
Table
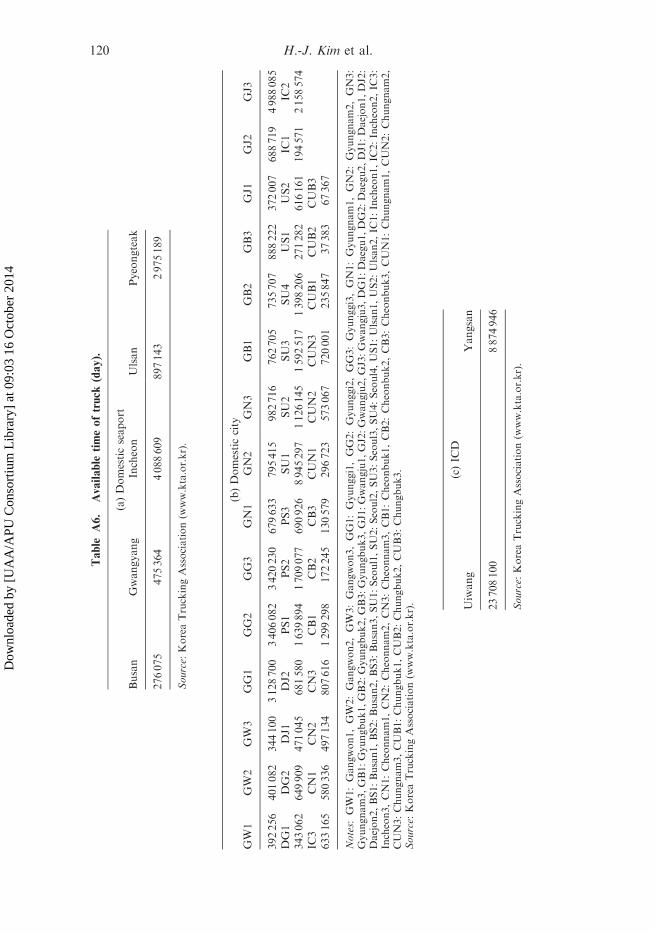
A6.
Available
timeoftruck
(day).
(a)Domesticseaport
Busan
Gwangyang
Incheon
Ulsan
Pyeongteak
276075
475364
4088609
897143
2975189
Source:
KoreaTruckingAssociation(w
ww.kta.or.kr).
(b)Domesticcity
GW1
GW2
GW3
GG1
GG2
GG3
GN1
GN2
GN3
GB1
GB2
GB3
GJ1
GJ2
GJ3
392256
401082
344100
3128700
3406082
3420230
679633
795415
982716
762705
735707
888222
372007
688719
4988085
DG1
DG2
DJ1
DJ2
PS1
PS2
PS3
SU1
SU2
SU3
SU4
US1
US2
IC1
IC2
343062
649909
471045
681580
1639894
1709077
690926
8945297
1126145
1592517
1398206
271282
616161
194571
2158574
IC3
CN1
CN2
CN3
CB1
CB2
CB3
CUN1
CUN2
CUN3
CUB1
CUB2
CUB3
633165
580336
497134
807616
1299298
172245
130579
296723
573067
720001
235847
37383
67367
Notes:
GW1:Gangwon1,GW2:Gangwon2,GW3:Gangwon3,GG1:Gyunggi1,GG2:Gyunggi2,GG3:Gyunggi3,GN1:Gyungnam1,GN2:Gyungnam2,GN3:
Gyungnam3,GB1:Gyungbuk1,GB2:Gyungbuk2,GB3:Gyungbuk3,GJ1:Gwangju1,GJ2:Gwangju2,GJ3:Gwangju3,DG1:Daegu1,DG2:Daegu2,DJ1:Daejon1,DJ2:
Daejon2,BS1:Busan1,BS2:Busan2,BS3:Busan3,SU1:Seoul1,SU2:Seoul2,SU3:Seoul3,SU4:Seoul4,US1:Ulsan1,US2:Ulsan2,IC
1:Incheon1,IC
2:Incheon2,IC
3:
Incheon3,CN1:Cheonnam1,CN2:Cheonnam2,CN3:Cheonnam3,CB1:Cheonbuk1,CB2:Cheonbuk2,CB3:Cheonbuk3,CUN1:Chungnam1,CUN2:Chungnam2,
CUN3:Chungnam3,CUB1:Chungbuk1,CUB2:Chungbuk2,CUB3:Chungbuk3.
Source:
KoreaTruckingAssociation(w
ww.kta.or.kr).
(c)IC
DUiwang
Yangsan
23708100
8874946
Source:
KoreaTruckingAssociation(w
ww.kta.or.kr).
120 H.-J. Kim et al.
Dow
nloa
ded
by [
UA
A/A
PU C
onso
rtiu
m L
ibra
ry]
at 0
9:03
16
Oct
ober
201
4
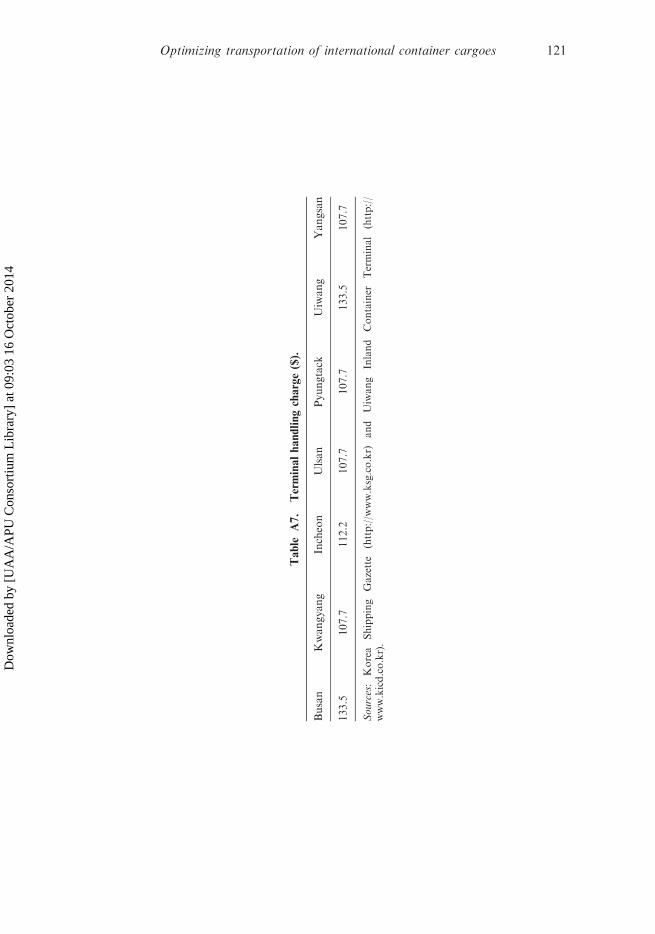
Table
A7.
Terminalhandlingcharge($).
Busan
Kwangyang
Incheon
Ulsan
Pyungtack
Uiwang
Yangsan
133.5
107.7
112.2
107.7
107.7
133.5
107.7
Sources:
Korea
Shipping
Gazette
(http://w
ww.ksg.co.kr)
and
Uiwang
Inland
Container
Terminal
(http://
www.kicd.co.kr).
Optimizing transportation of international container cargoes 121
Dow
nloa
ded
by [
UA
A/A
PU C
onso
rtiu
m L
ibra
ry]
at 0
9:03
16
Oct
ober
201
4
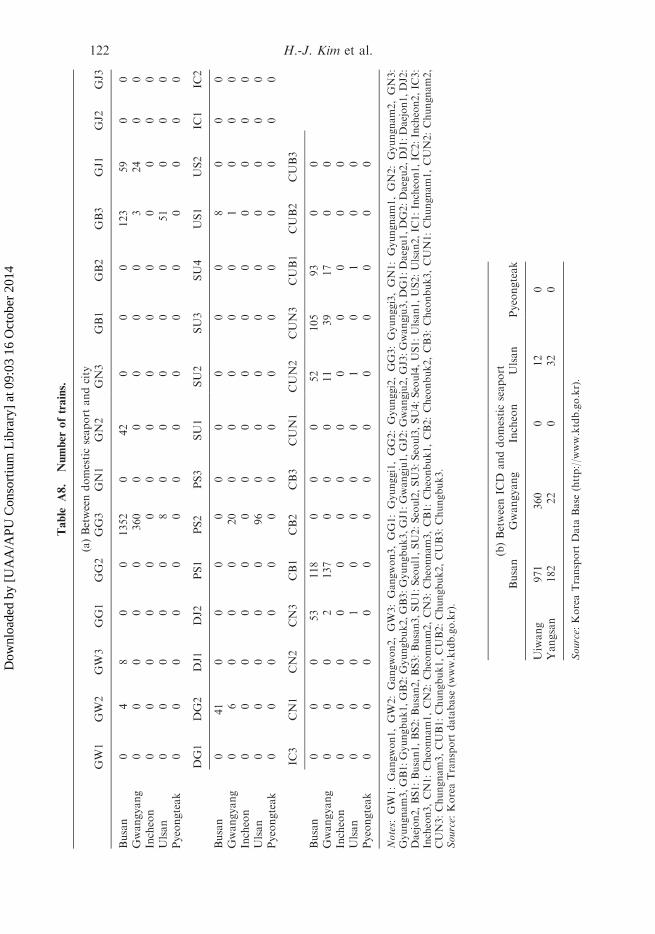
Table
A8.
Number
oftrains.
(a)Betweendomesticseaport
andcity
GW1
GW2
GW3
GG1
GG2
GG3
GN1
GN2
GN3
GB1
GB2
GB3
GJ1
GJ2
GJ3
Busan
04
80
01352
042
00
0123
59
00
Gwangyang
00
00
0360
00
00
03
24
00
Incheon
00
00
00
00
00
00
00
0Ulsan
00
00
08
00
00
051
00
0Pyeongteak
00
00
00
00
00
00
00
0
DG1
DG2
DJ1
DJ2
PS1
PS2
PS3
SU1
SU2
SU3
SU4
US1
US2
IC1
IC2
Busan
041
00
00
00
00
08
00
0Gwangyang
06
00
020
00
00
01
00
0Incheon
00
00
00
00
00
00
00
0Ulsan
00
00
096
00
00
00
00
0Pyeongteak
00
00
00
00
00
00
00
0
IC3
CN1
CN2
CN3
CB1
CB2
CB3
CUN1
CUN2
CUN3
CUB1
CUB2
CUB3
Busan
00
053
118
00
052
105
93
00
Gwangyang
00
02
137
00
011
39
17
00
Incheon
00
00
00
00
00
00
0Ulsan
00
01
00
00
10
10
0Pyeongteak
00
00
00
00
00
00
0
Notes:
GW1:Gangwon1,GW2:Gangwon2,GW3:Gangwon3,GG1:Gyunggi1,GG2:Gyunggi2,GG3:Gyunggi3,GN1:Gyungnam1,GN2:Gyungnam2,GN3:
Gyungnam3,GB1:Gyungbuk1,GB2:Gyungbuk2,GB3:Gyungbuk3,GJ1:Gwangju1,GJ2:Gwangju2,GJ3:Gwangju3,DG1:Daegu1,DG2:Daegu2,DJ1:Daejon1,DJ2:
Daejon2,BS1:Busan1,BS2:Busan2,BS3:Busan3,SU1:Seoul1,SU2:Seoul2,SU3:Seoul3,SU4:Seoul4,US1:Ulsan1,US2:Ulsan2,IC
1:Incheon1,IC
2:Incheon2,IC
3:
Incheon3,CN1:Cheonnam1,CN2:Cheonnam2,CN3:Cheonnam3,CB1:Cheonbuk1,CB2:Cheonbuk2,CB3:Cheonbuk3,CUN1:Chungnam1,CUN2:Chungnam2,
CUN3:Chungnam3,CUB1:Chungbuk1,CUB2:Chungbuk2,CUB3:Chungbuk3.
Source:
KoreaTransport
database
(www.ktdb.go.kr).
(b)BetweenIC
Danddomesticseaport
Busan
Gwangyang
Incheon
Ulsan
Pyeongteak
Uiwang
971
360
012
0Yangsan
182
22
032
0
Source:
KoreaTransport
Data
Base
(http://w
ww.ktdb.go.kr).
122 H.-J. Kim et al.
Dow
nloa
ded
by [
UA
A/A
PU C
onso
rtiu
m L
ibra
ry]
at 0
9:03
16
Oct
ober
201
4