Extended Conwip Kanban System for Single Line Multi Stage Production System
School of Innovation, Design and Engineering
Company logo
(with name)
Optimizing the process flow in heat treatment plant through value stream mapping via simulation
A case study at
Volvo Group Trucks Operations
Master thesis work
30 credits, Advanced level
Product and process development Production and Logistics
Pratikchandra J. Vasava
Report code: PPU503 Commissioned by: Tutor (VOLVO GTO): Vilhelm Söderberg & Jonas Svensson Tutor (university): Erik Dahlquist & Martin Kurdve
Examiner: Antti Salonen

ABSTRACT
II
ABSTRACT Manufacturing companies deal with inefficiencies in production processes. To optimize the
process is one solution to the problem. In the thesis it is shown how the optimization of process
flow is done in order to increase the efficiency of production processes in furnaces of heat
treatment plants.
The purpose of this thesis is about analysing the process flow in a heat treatment plant and
increasing its efficiency through value stream mapping via simulation. This gives a brief idea
about the process flow in different furnaces and designing a simulation model for optimization
of the process. The idea is to look into the process of furnaces, recipe of furnaces or other
quality issues, which need to be worked on. There is another concern, to able to have the
multiproduction of two different components i.e. gear and shaft production in same furnaces.
On based of these challenges, an efficient solution is required to make the heat treatment plant
more efficient at Volvo Group Trucks Operations.
The empirical case study was made in heat treatment plant, over the period of five months. To
investigate the process flow, material handling and production has done. Therefore, the results
from the studies will provide the information and knowledge obtained from Kaizen events and
simulation.
However, there is always unexpected rise and fall in production rate, so the demand is to have
efficient working atmosphere. The well-organized material supply system will lead to a
reduced lead-time and reduce the cost of operation, which will help to keep inventory in order
and optimize the process flow. The answer to the three research questions will give possible
solutions to the aimed objectives.
Finally, the results will show the bottlenecks and loss in waiting time. In this thesis it shows
that Volvo Group Trucks Operations can do optimization in process flow of furnaces. There
would be requirement of upgrading equipment’s and making process automation. The
optimization would lead to benefits with reduction in process flow and labours on adopting
automation.
Keywords: OEE, Multiproduct manufacturing, Value stream mapping, Flexible manufacturing
system, reduce flow time, material flow mapping, Process flow, lean manufacturing.

ACKNOWLEDGEMENTS
III
ACKNOWLEDGEMENTS
I would like to be thankful to Volvo Group Trucks Operations (GTO), Köping for giving me an
opportunity to write my Master Thesis. The project had helped me to develop academically and
professionally over the period of five months. I would like to appreciate to my managers
Vilhelm Söderberg & Jonas Svensson for their support.
The project won’t be completed without the guidance of my supervisors from Mälardalen
University and Volvo GTO, special thanks to Erik Dahlquist, Martin Kurdve and Stefan
Lidgren. I achieved personal development and a true guidance regarding working methods
from my supervisors.
I would like to express gratitude towards Ali Ansari, Asier Etxagibel Larranaga, Erik Söder and
Mats Ahlskog who helped me with reviewing my thesis work.
Västerås, 19-05-2017.

CONTENTS
IV
CONTENTS
1 INTRODUCTION .......................................................................................................................................... 1
1.1 BACKGROUND ......................................................................................................................................... 1 1.2 PROBLEM FORMULATION ..................................................................................................................... 2 1.3 AIM AND RESEARCH QUESTION .......................................................................................................... 2 1.4 PROJECT LIMITATION ............................................................................................................................ 3
1.4.1 Process variability ............................................................................................................................. 3 1.4.2 Complex process flow......................................................................................................................... 3 1.4.3 Conflicting cost factors ...................................................................................................................... 3 1.4.4 Discrete event simulation ................................................................................................................... 3
2 RESEARCH METHOD ................................................................................................................................. 5
2.1 CASE STUDY ............................................................................................................................................. 5 2.2 RESEARCH PROCESS .............................................................................................................................. 6
2.2.1 LITERATURE REVIEW ..................................................................................................................... 7 2.2.2 DATA COLLECTION ......................................................................................................................... 7 2.2.3 DATA ANALYSIS ............................................................................................................................... 8 2.2.4 VALIDITY AND RELIABILITY .......................................................................................................... 8
3 THEORETICAL BACKGROUND .............................................................................................................. 9
3.1 LEAN MANUFACTURING & OTHER IMPROVEMENT SYSTEMS .................................................... 9 3.1.1 Process at a glance .......................................................................................................................... 10 3.1.2 Value stream mapping/ Waste reduction .......................................................................................... 10 3.1.3 Just-In-Time ..................................................................................................................................... 11 3.1.4 5 S ..................................................................................................................................................... 11 3.1.5 The ‘5 whys’ ..................................................................................................................................... 12 3.1.6 Kaizen events .................................................................................................................................... 13 3.1.7 Total preventive maintenance .......................................................................................................... 14
3.2 MULTIPRODUCTION ............................................................................................................................. 15 3.2.1 Drawbacks of multiproduction ......................................................................................................... 15
3.3 MATERIAL HANDLING ......................................................................................................................... 16 3.3.1 Tools and techniques applied for material handling ........................................................................ 16 3.3.2 Well-organized material supply system through usage of technology ............................................. 16
3.4 PROCESS FLOW & LAYOUT DESIGN.................................................................................................. 19 3.5 DISCRETE EVENT SIMULATION ......................................................................................................... 21
3.5.1 Benefits of DES ................................................................................................................................ 22 3.5.2 Challenges while functioning DES ................................................................................................... 22
4 EMPIRICAL DATA .................................................................................................................................... 24
4.1 VOLVO GROUP TRUCKS OPERATIONS ............................................................................................. 24 4.1.1 Manufacturing strategy .................................................................................................................... 24 4.1.2 Production system development ....................................................................................................... 25 4.1.3 Material supply system ..................................................................................................................... 30 4.1.4 Discrete event simulation ................................................................................................................. 32
4.2 SPECIFIED PROBLEM FORMULATION AT VOLVO GTO ................................................................. 33 4.3 DESCRIPTION OF THE HEAT TREATMENT PLANT ......................................................................... 33
5 RESULTS ...................................................................................................................................................... 36
5.1.1 Current state value stream mapping ................................................................................................ 36 5.1.2 Future state suggestion .................................................................................................................... 38
5.2 KAIZEN EVENTS .................................................................................................................................... 41 5.2.1 Kaizen event 1 .................................................................................................................................. 41 5.2.2 Kaizen event 2 .................................................................................................................................. 42
5.3 DISCRETE EVENT SIMULATION RESULTS ....................................................................................... 44 5.3.1 Simulation assumptions .................................................................................................................... 44 5.3.2 Simulation results ............................................................................................................................. 45
5.4 MULTIPRODUCTION ISSUE ................................................................................................................. 46
6 ANALYSIS .................................................................................................................................................... 49

CONTENTS
V
6.1 RESEARCH QUESTION 1: HOW LEAN ME HOW VSM HELPS TO REMOVE NON VALUE ADDED ACTIVITIES AND
OPTIMIZE THE PROCESS FLOW? ............................................................................................................................. 49 6.2 RESEARCH QUESTION 2: HOW DISCRETE EVENT SIMULATION CAN PROVIDE STRENGTH TO SOLUTION
CONVEYED FROM LEAN TOOLS? ........................................................................................................................... 51 6.3 RESEARCH QUESTION 3: WHAT ARE THE CHALLENGES FACED BY ORGANIZATIONS, WHICH MAKE IT NOT
FEASIBLE TO HAVE MULTIPRODUCTION? .............................................................................................................. 52
7 CONCLUSIONS ........................................................................................................................................... 54
8 FUTURE WORK RECOMMENDATION ................................................................................................ 56
8.1 RECOMMENDATION FOR FURNACE 3 ........................................................................................................... 56 8.2 RECOMMENDATION FOR FURNACE 4 ........................................................................................................... 56 8.3 RECOMMENDATION FOR FURNACE 5 ........................................................................................................... 57 8.4 RECOMMENDATION ON MULTIPRODUCTION ISSUES OF FURNACE 3 AND 4 .................................................. 57
9 REFERENCES ............................................................................................................................................. 58
10 APPENDICES .............................................................................................................................................. 61
10.1 QUESTIONS FOR VOLVO GTO ................................................................................................................ 61 10.2 FIXTURES ............................................................................................................................................... 62 10.3 PALLETS COMING OUT ........................................................................................................................... 63 10.4 PALLETS AND EMPTY FIXTURES ............................................................................................................. 64 10.5 FORKLIFTS ............................................................................................................................................. 65 10.6 EXTENDSIM MODEL ............................................................................................................................... 66 10.7 SHUTDOWN INFORMATION .................................................................................................................... 67

ABBREVATION LIST
VI
ABBREVIATION LIST AGVs Automated guided vehicles
AHMS Automated Material Handling System
BIQ Built-In-Quality
CAD Computer-Aided Design
CONWIP Constant Work-In-Process
DES Discrete Event Simulation
EEM Early Equipment management
FMEA Failure Mode and Effect Analysis
FMS Flexible Manufacturing System
GA Genetic Algorithm
GTO Group Trucks Operations
IDS Integrated Design of Systems
JIT Just-In-Time
LMS Lean Manufacturing System
MRP Material Replenishment Planning
MSS Material Supply System
OEE Overall Equipment Efficiency
PDP Product Development Project
PFA Production Flow Analysis
POLCA Paired-cell Overlapping Loop of Cards with Authorization
SMED Single Minute Exchange of Die
SOP Standard Operating Procedures
SSC Supermarket
TAC Total Acquisition Cost
TPM Total Preventive Maintenance
TPS Toyota Production System
TQM Total Quality Management
VPS Volvo Production System
VSM Value Stream Mapping
WIP Work-In-Processes
LIST OF TABLES
VII
LIST OF FIGURES Figure 1: Applied research Process .............................................................................................. 6 Figure 2: Lean Manufacturing System Model, (Upadhye, et al., 2010), Pg. 127. ...................... 9
Figure 3: The 5S process, (Liker & Meier, 2006), Pg. 65. ........................................................ 12 Figure 4: ‘5 whys’ analysis, (Liker & Meier, 2006), Pg. 346. ................................................... 13 Figure 5: Kaizen events .............................................................................................................. 13 Figure 6: Toyota Material Handling, AGV, (Trebilcock, 2012), Pg. 19. .................................. 17 Figure 7: Design framework of Automated material handling system, (Nazzal & Bodner,
2003), Pg. 1356. ......................................................................................................................... 17 Figure 8: Scheme of kitting and assembly system , Caputo, et al., (2015), Pg. 71. .................. 18 Figure 9: Process flow and lean tools, (Liker & Meier, 2006), Pg. 89. ..................................... 19 Figure 10: Flexible manufacturing system configuration, (El-Tamimi, et al., 2011), Pg. 118. . 20 Figure 11: IDS overview, (Dias, et al., 2014), Pg. 50. ............................................................... 20
Figure 12: Step of simulation study for process flow, (Prakash & Chin, 2014), Pg. 486. ........ 21 Figure 13 : Volvo Production System, Volvo Group Internet. .................................................. 25
Figure 14 : Management Commitment, Volvo Group Internet. ................................................. 26
Figure 15: Performance Managemnet, Volvo Group Internet. .................................................. 26 Figure 16: People Development, Volvo Group Internet. ........................................................... 27 Figure 17: Improvement Structure, Volvo Group Internet. ....................................................... 28 Figure 18: Lean Practices, Volvo Group Internet. ..................................................................... 29
Figure 19: END-TO END ALIGNMENT, Volvo Group Internet. ............................................ 29 Figure 20: End-To-End supply chain concept, Volvo Group Internet. ...................................... 30
Figure 21: Kitting, Volvo Group Internet. ................................................................................. 31 Figure 22: Water strider method, Volvo Group Internet. ........................................................... 31 Figure 23: Cross Dock, Volvo Group Internet. .......................................................................... 32
Figure 24: Heat Treatment plant: Furnace 3, 4 and 5 design layouts. ........................................ 33 Figure 25: Operations and components of the production process. ........................................... 34
Figure 26: Value Stream Mapping for Furnace 3. ..................................................................... 36
Figure 27: Value Stream Mapping for Furnace 4. ..................................................................... 37
Figure 28: Value Stream Mapping for Furnace 5. ..................................................................... 37 Figure 29: Future VSM for furnance 3 ....................................................................................... 38
Figure 30: Two scenarios, process design layout ....................................................................... 39 Figure 31: Future VSM for furnance 4 ....................................................................................... 40
Figure 32: Future VSM for furnace 5 ......................................................................................... 40 Figure 33: '5 whys' for time consuming shot blasting process. .................................................. 42 Figure 34: Standard Kaizen for shot blasting cell. ..................................................................... 42
Figure 35: '5 whys' for incoming and outgoing of pallets from furnace 3, 4 & 5. ..................... 43 Figure 36: Stanadard Kaizen for for incoming and outgoing of pallets from furnace 3, 4 & 5. 44
Figure 37: Push furnace(3), Volvo Group Trucks Operation, internet. ..................................... 47 Figure 38: Ring furnace(5), Volvo Group Trucks Operation, internet. ..................................... 47 Figure 39: Results of Optimizing process in Heat Treatment Plant. .......................................... 51 Figure 40: (a) Current and (b) proposed scenerio. ..................................................................... 56
LIST OF TABLES Table 1: Interview ........................................................................................................................ 5
Table 2: Current state production of Furnace 4 .......................................................................... 45 Table 3: Future state production of Furnace 4 ........................................................................... 46

1 INTRODUCTION
1
1 INTRODUCTION
In this chapter, the background of the problem, the problem formulation and the three research
questions are presented; the project limitations are also mentioned.
1.1 BACKGROUND
Manufactures today have certain limitation in kind of variety their production of tools and
products lifecycles. Nowadays the customers have become even more sophisticated with their
choices over product along with the growing development in technology. The more efforts are
kept in production rather than on the development of a new product (Prakash & Chin, 2014;
Chen, Li, & Shady, 2010). Multi-product systems are quite common and playing important role
in today is manufacturing industry. Each processing unit is capable to produce two or various
kind of product types. Further, Kang et al. (2015) says that in multi-product system a several
buffers are always generated such as storage related issues, Work-In-Processes (WIP) and
cycle time of the production. Flexible Manufacturing System (FMS) is extremely unified
manufacturing system and supportive to deal with the issues related to multiproduction. The
FMS is worthy mixture among variety and productivity (El-Tamimi, et al., 2011).
The lean manufacturing system mainly based on Toyota Production System (TPS), which is
worldwide accepted and adopted in various manufacturing companies in their own version. To
overcome waste and overproduction, lean principles are mentioned to cut down the non-value
added service and time, not demanded by the customers (Abdulmalek & Rajgopal, 2006;
Schmidtke, et al., 2014; Chen, Li, & Shady, 2010). Lean Manufacturing System (LMS)
provides a competitive advantage to the manufactures and raise the economy level in the
market. LMS is not only a lean tool or technique which is helpful in production, while many
major business companies trying to adopt it to stay competitive in the market (Abdulmalek &
Rajgopal, 2006; Serrano, et al., 2008). The non-value added processes or Muda i.e. 7 wastes in
production cost time and money, which clients are not eager to pay. Therefore, to remove non-
value added process Kaizen was introduce for this very purpose and reduces the wastes. While
Chen et al. (2010) point out that carrying out Kaizen activity, numerous lean tools ranging from
‘value stream mapping’ to questioning the ‘5 whys’ are implemented to reach the solution of
the problem.
The Value Stream Mapping (VSM) is accomplished as a process mapping method, to detect the
bottlenecks and wastes to be analysed from the current state situation (Kurdve & Salonen, 2016).
While to quantify the situation or results of future map by VSM, we need some complementary
tool, which can support the idea with a confirmation before implementing it. The Discrete
Event Simulation (DES) displays the gains, which were assume before planning and
assessment of any new development or change (Abdulmalek & Rajgopal, 2006; McDonald, et
al., 2002; Schmidtke, et al., 2014). According to Sjögren et al. (2016) while performing DES
there is no stochastic variation of cycle time, inventory, lead time, down time, confirms from
the calculation of VSM current state.
Acknowledging the effectiveness required for the Material Supply System (MSS) development
is greatly essential in today's competition among top leading companies. Johansson &
Johansson (2006) define that today’s companies need to be efficient; therefore it is must to
provide highly beneficial supply chain system towards their customer. The study of process
flow is important; Production Flow Analysis (PFA) is well-organized methodology, which

1 INTRODUCTION
2
delivers a functional layout into product focused on layout. As Hameri (2010) argues, PFA has
been established to have a fixed planning, proper production and delivery cycles in order to
have proper scheduling system. Numerous tool and techniques comes into play together to deal
with the problem of optimization of process to deliver qualitative and quantitative results.
While simulation gives, support to that results and gives the clear differentiation between
current state and future state, which lead to excellence and better working atmosphere.
1.2 PROBLEM FORMULATION
As seen above, manufacturing industries need to have efficient working system; therefore non-
value added activities should be removed from the process. The non-value added activities is
waste for the customer and as well for organization, hence need to be eradicated. To achieve
better productivity, VSM as lean tool are introduced to analyzed the bottlenecks and work on
the area of improvement (Kurdve & Salonen, 2016). The non-value added activities meant to
be with material handling, design layout of process and old equipments which does not match
daily production targets. To bring the change in process, often return of investment is talked as
concerned of matter.
From the DES perspective, appropriate data are required to support the results for bringing out
the solution. The data for DES are taken from VSM current state such as lead time, cycle time,
down time, time period, total number of operators, time period, transportation and time period.
The Lean tools are beneficial to identify bottlenecks, whereas DES influence the results
obtained from it (Sjögren, et al., 2016). The DES shows the beneficial in terms of value after
the removal of non-value added activities. The process flow also connects with process layout
structure, to be more effective to the operators and create optimization. DES results cannot
match actual feeling of working environment, but guides with scenarios that can be look into
before implementation.
While most of the company has the rise of varieties in production, thus equipment’s should
support multiproduction to have effective organization. A suitable multiproduction issue is
experienced when equipment’s goes for maintenance and there is ramp up in production (Kang,
et al., 2015). The flexible manufacturing system is not supported due to lack of machinery or
metal adaptability. The processes are the most important factor to look on before doing
production planning. The equipment’s sometimes have fixed recipe, which fails to support all
the products. FMS are mainly used to deal with the problem of multiproduction and to have
suitable solutions for organizations (El-Tamimi, et al., 2011).
1.3 AIM AND RESEARCH QUESTION
The aim of the project is to optimize the process flow of production and try to identify the non-
value added activities, for making working process efficient. The project also consists of
problem, needs to be solved with a concern of multiproduction issues causes barrier during
ramp up in production. To reach the solution of the given problem three research questions
were created.
Research Question 1: How VSM helps to remove non value added activities and optimize the
process flow?
Research Question 2: How can Discrete Event Simulation provide strength to solution
conveyed from VSM?

1 INTRODUCTION
3
Research Question 3: What are the challenges faced by organizations, which make it not
feasible to have multiproduction?
For achieving the above objectives and having a relevant solution to the research questions will
need the study of lean manufacturing system and discrete event simulation.
1.4 PROJECT LIMITATION
The study will only consist of the optimization of the process and increasing the efficiency of
the furnaces. The study will also investigate that what are the possible reason should look into
to have multiproduction at furnace 3 & 5 was time consuming. The possible scenario that can
help in optimization of furnace 3, 4 & 5 was hard to implement at one time as it cost but
systematic adapting may lead to excellence in future. The usage of DES was not possible at
Volvo GTO; hence on weekends work on simulation model was prepared at Mälardalen
University. The kaizen events and DES was used as a method to solve the research question,
the project consequences are described below:
1.4.1 Process variability
In heat treatment plant there is much variability of processes, multiproduction are being carry
out in furnaces according to customer demand. While gathering the data for the current VSM,
very complex picture created. There are three main components and they are sub-dividing
further more. Therefore, it is time taking to carry out VSM for each component with projecting
their future VSM. It goes same with simulation modeling, several data required to in detail to
complete the work. Therefore, not all components were considered regarding decision making
for a problem.
1.4.2 Complex process flow
In heat treatment plant there is process flow of different components passing through the
process of required specification. While material handling plays a vital role, it goes on
automatic and manual both in on-going processes. Further, the time taken in manual handling
of pallets before every shot blasting process varies every time in furnace 4. Consequently, we
will not get exact lead time for waiting pallets before shot blasting process.
1.4.3 Conflicting cost factors
VSM future state will guide to various solutions, it demand changes in process layout,
requirement for more tools and demanding updated equipment’s. It will depend on company’s
priority to have possible changes or not.
With having a solution for a project through VSM and simulation, there are two questions may
remain unanswered:
- Does the future state in beneficial or not?
- When cost is a factor, changes are vital or not?
The answer demands on company, as company haven’t demand return of investment analysis,
as it was not part of the project. The project just demand solution for the problems.
1.4.4 Discrete event simulation

1 INTRODUCTION
4
Need of qualitative data for completing simulation model. The challenges in DES were the data
collected would need to be very accurate and updated which are always fluctuating. Different
scenario obtained from DES will not give 100% accurate result. It takes lot of time to collect
the data required for building up the simulation model.
The research is limited to investigate how Volvo GTO can optimize the process in heat
treatment plant, it is very important to have efficient process. In the introduction part, various
topics and methods related to the topic of case study is explained and narrow down the study to
optimize the processes in various furnaces of heat treatment plant. The methods to get the result
i.e. LMS and simulation are utilized in order to reach optimal solution for research questions.

2 RESEARCH METHOD
5
2 RESEARCH METHOD
The research methods used in this study is a combination of quantitative data along with
qualitative inputs from data collections and interviews of key persons of Volvo Group Trucks
Operations (GTO) working in heat treatment plant. This study is based on both primary data
and secondary data. Below a description of the procedure of the case study and research
process are elaborated.
2.1 CASE STUDY
A case study has been conduct to investigate the process flow in three different furnaces in heat
treatment plant, to analyze the process flow and to raise the efficiency level of each furnace.
According to Prakash & Chin (2014) the Work-In-Processes (WIPs) does the collection of data,
associated to the production of the tool, inventory and check in demand of customer. However,
efficient process flow will lead to superiority in production system. The second objective for
the Volvo GTO was to, check the multiproduct production can be processed at furnace number
3 and 5 or not, what are the consequences and results be found. Also, Kang (2015) emphasises
importance of multi-production in today’s manufacturing industries to cope with the time and
to have good hold in the world market. Primary data in the study has been gathered from the
regular participation of meetings held at Volvo GTO, Köping and having several interviews
with the department manager, production engineer, process flow engineer and operators. The
format of interview information is being presented in Table 1.
Table 1: Interview
Informant Titel Date Collection
Stefan Lidgren Production Engineer 17-1-2017 Notes
Tom Larsson Production Engineer 6-2-2017 Notes and Recording
Johan Rofelt Department Manager 6-2-2017 Notes and Recording
Frederick Bylund Machine Specialist 6-2-2017 Notes and Recording
Alexander Drott Process Engineer 7-2-2017 Notes and Recording
Source: Volvo GTO employee is working in Heat Treatment Plant
The participation was anticipated by working at the plant almost every day in order to get the
better over look how the company works, it gave better understanding and clarification of the
problem. The data collection was received from production engineer during the presentation of
the company and thesis project was described with the problem need to look into.
The heat treatment plant description and raw data relevant to furnaces was gathered in order to
accomplish kaizen events and simulation. As Chen et al. (2010) found that kaizen event
reduces the wastes and it has numerous lean tools, help in optimizing the process. The data
refers to the amount of pallets of shafts and gears goes in various furnaces with respect of dates
and time in more specified way. Some other data was collected through the participant of time
study at heat treatment plant. Kurdve & Salonen (2016) found that Value Stream Mapping
(VSM) will analyze the operations and will help with future suggestion along with supporting

2 RESEARCH METHOD
6
the idea of implementation of 5S. Liker & Meier (2006) point out that 5 whys will be good lean
tool to reach the root cause. While the Discrete Event Simulation (DES) guaranteed the
assurance to the results displayed from the utilization of kaizen events.
The data collected was divided into various forms:
1. There are 6 furnaces in Heat treatment plant, out of which 3 were consider for
performing project and different articles are being produced by each furnace. In furnace
3 shafts are produced, furnace 4 gear, shaft and marine and furnace 5 gears are
produced.
2. Multi-production issue faced during the maintenance of furnaces 3, 4 and 5.
3. Process time of each process in furnaces and its working.
4. Material handling methods and time taken by operators for handling material.
5. Waiting time for the inventory before moving it to the next process.
2.2 RESEARCH PROCESS
Figure 1: Applied research Process
First of all, the study was made on the basis of required case study of optimizing the process in
heat treatment plant area. There are two highlighting issues, optimizing process flow and
multiproduction issues were faced in heat treatment plant. Based on the research aim, the three
research questions were developed to reach the solution of the case study see Figure 1. The
kaizen events were carried out to perform lean tools for furnace 3, 4 and 5. While on the basis
of kaizen events, VSM data were applied in creating DES model for demonstrating furnace

2 RESEARCH METHOD
7
current and future state for furnace 4. In case of multiproduction, study was made to give
relevant answer to research question and possible clarification.
The research process is well defined in detailed in literature review, data collection, data
analysis and validity and reliability, mentioned below.
2.2.1 LITERATURE REVIEW
This literature review is based on the topic of “Analysing the process flow in heat treatment
plant & increasing its productivity through value stream mapping via simulation”. All the
material for the thesis was compose from different scientific databases, such as Google
Scholar, Emerald Insight, Elsevier and Taylor & Francis. A five-step methodology was conduct
to assemble the articles for the literature assessment. The five steps mentioned as below:
First step was to get the considerate about the topic and searching the keywords, which would
relate. Second step was to go to search database and try to find reference related to the topic.
The third step was to go more specific regarding the topic using keywords include “Overall
Equipment Efficiency (OEE)”, “Multiproduct manufacturing”, “Value stream mapping”,
“Reduce flow time”, “Lean manufacturing”, “Simulation”, “Material flow mapping”, “Flexible
manufacturing system” and “process flow”. The fourth step was to read the article and keep the
link of the article in paper, so the reader could understand. The fifth step is to go through the
articles more thoroughly to narrow them down and pick only the relevant articles to the topic.
2.2.2 DATA COLLECTION
The articles were carefully chosen on the base of a four step methodology which will help to
drive towards the possible conclusion and evaluation period.
Four combinations of keywords were used to find the articles:
1. Material flow mapping and value stream mapping
2. Lean manufacturing and multiproduct manufacturing
3. Flexible manufacturing system and reduce flow time
4. OEE and process flow
The “title, abstract and keywords” were used to find the scientific articles in Google scholar. From
the first keywords combination, 61 results were formed out of which 9 results were taken. Second
keywords combination gave 12 results out of which 2 results were taken. Third keyword
combination gave 27 results out of which 2 results was taken. Fourth keywords combination gave
127 results out of which 3 results were taken. All the selected articles were taken after reading the
abstract and later the full article to confirm the relevance to the topic of this study. The collected set
of articles for the topic was appropriate articles to define the thesis and the time interval of the
majority of the selected articles is between the periods of 2006 to 2016, this to keep the research up
to the date.
While two books were taken presenting about Toyota way by Jeffrey Liker (2004) and another book
By Jeffery Liker and David Meier (2006). While one article was taken on search basis of automated
guided vehicles by Bob Trebilcock. Two of the references were taken directly based on author name
Eva Johansson and Mats Johansson based on material supply system. The journal articles based on
cross-docking and kitting was taken on search of material supply system. Finally, few articles of
Martin Kurdve were taken for supporting thesis paper.

2 RESEARCH METHOD
8
2.2.3 DATA ANALYSIS
The analysis of the thesis work was characterized into six dimensions:
- Gathering the information related to topic from the Volvo GTO and comparing it with a
theoretical reference in order to get the clear differentiation in working method and
improvement can be note down.
- The interviews were recorded to have saved information which can be useful while
performing the task of value stream mapping and simulation
- The raw data was collected from the production engineers i.e. an excel sheet, which
gives the information of the number of different components produced in different
months and time.
- The value stream mapping for performed on furnace 3, 4 & 5, to get the Takt time and
lead-time. The concept of VSM focuses on the bottlenecks of the process and help to
optimize it.
- Simulation model built in ExtendSim, to figure out current and future scenarios of
working system of furnace 4. The simulation model is an imitation of the real life of
working furnaces, showcasing with the help of it, two scenarios are being compared.
- To identify the reason behind not using multiproduct i.e. gear and shaft in furnace 5 and
3.
The analysis was also based on the triangle of analysis, going back and forth between the
research question, the theory and the empirical data.
2.2.4 VALIDITY AND RELIABILITY
The primary data is a combination of reliability and validity. In other means, high reliability
refers to the same person and same measurement instrument can reproduce the results. Validity
refers to the extent to which the data measured actually measured what it intends to. Working
every day helped a lot with the study of reliability. The primary measurements were related
with process time of furnaces and finding the Takt time. Related to material handling, it varies
every time due to human error. The study reliability was very informative as collection of data
was received from all sorts of people like engineers, maintenance guy and operators, all
contributed in receiving data at company.
The secondary data was collected from the literature reviews from various scientific paper
related to project title and lead to various suggestions which were considered as possible
solutions. They are focused on specified areas, which will guide in order to restrict in moving
into wrong directions. The validity and reliability of VSM & simulation is based on the
information received from the company, which is collected from real life production.
The structure is very important criteria to formulate any case study, so the research process
would guide to solution for research questions. The data were collected and analyzed in order
to get to the route for optimizing the process using kaizen events and simulation, along with
investigating multiproduction issue.

3 THEORETICAL BACKGROUND
9
3 THEORETICAL BACKGROUND
The theoretical background will represent the theory and material which is used in study. It is
based on three topics: Lean Manufacturing System, Production system Development and
Simulation. The above mentioned topics are described according to the result required for the
study, it will show how lean manufacturing system and simulation work together in order to
give strong confirmation of the resultant formed by their usage for efficient manufacturing
system in any working organizations.
3.1 LEAN MANUFACTURING & OTHER IMPROVEMENT SYSTEMS
The Lean Manufacturing System (LMS) is very useful to stay competitive in the world
competition and mainly focus on cost reduction and saving the time behind production. The
origin of lean manufacturing came from the Toyota production system and which are
implement in various sectors of company including electronic, automotive, consumer goods
industry, white goods and other working sectors. LMS (Figure 2) is a reliable model to improve
the efficiency and effectiveness of any working organization (Upadhye, et al., 2010).
As, Krishna Jasti & Sharma (2014) emphasises the importance of implementation of the LMS
can bring several changes to production system to eliminate the unwanted process and cut
down the time, improves stability of the process, removal of non-essential transportation of the
inventory and increase production efficiency, which lead to reduce the overall production rate.
There are several tools and techniques in LMS, named as just-in-time, cellular manufacturing,
world-class manufacturing, Kaizen events, standard operation routine sheets, design of
experiment, 5s, Kanban, Total Quality Management (TQM), Just-In-Time (JIT) , Total
Preventive Maintenance (TPM), poka yoke, Single Minute exchange of Die (SMED), process
at a glance, setup time reduction, computer integrated manufacturing etc. to notice the waste
and remove from the working procedures (Abdulmalek & Rajgopal, 2006; Belekoukias, et al.,
2014; McDonald, et al., 2002; Upadhye, et al., 2010).
Figure 2: Lean Manufacturing System Model, (Upadhye, et al., 2010), Pg. 127.

3 THEORETICAL BACKGROUND
10
Lean philosophy is built on learning and improving the operation. Kurdve (2014) point out that
strong focus on efficient utilization of labour and equipment’s, will lead to optimize the process
and reduce non-value adding activities. LMS should be well define and each worker should
understand its responsibilities in order to reduce production lead-time, remove non-value
adding processes, less unproductive time during set-up etc. The tools and techniques
implemented for LMS are described here:
3.1.1 Process at a glance
After the identification of required improvement in process and product, the next step is to
involved whole manufacturing process and the people working with operations. As, Chen et al.
(2010) defines that the process at glance involved the working staff, product details, recipe of
the process and sequence order about the operations. Information gathered would be adopted
during the usage of lean activities. This information contains cycle time, number of people
working , number of operations, material information, number of times process takes place,
uptime, recipe of the equipment’s, and quality.
3.1.2 Value stream mapping/ Waste reduction
Improving the process, mainly plants tours are being held in order to view the flow of the
process and help to get the idea about the problem which needed to be fixed (Kurdve &
Salonen, 2016). The tour guide of the manufacturing plant will show the machine or
equipment’s which helps to perform the process and have a detailed look of the non-value
adding process before performing Value stream mapping (VSM).
The Value stream mapping was given name by Toyota as ‘Material and Information Flow
Diagram’. As we display VSM on piece of paper showing material flow and information flow,
which show waste in value stream. As the waste is improve in future state of VSM, which
support material and information flow according to pull system and decrease the production
lead time to reach customer demand i.e. Takt time (Chen, et al., 2010; Liker & Meier, 2006).
VSM is characterized as the finest lean tool to identify the opportunities for several lean
techniques. Abdulmalek & Rajgopal (2006) argue that VSM is gathering of all the action done
during production i.e. value added process and non-value added process that necessary to carry
the product out through main flows, starting with raw material till producing customer goods.
According to Kurdve & Salonen (2016) VSM is one of the lean tools, which identify the
bottlenecks, and shows the current situation of the operations, helps with rearranging the
production system, visualize and give better understanding of material flow and information
through value chain regarding the working stage. Further, Schmidtke et al. (2014) add that it is
a powerful tool, which turn production environment into lean operational state. VSM helps to
analyze the bottlenecks and the critical points, which need to be fixed for better production
process (Krishna Jasti & Sharma, 2014; Lacerda, et al., 2016; McDonald, et al., 2002; Serrano,
et al., 2008).
Many useful contribution is expected from performing VSM such optimizing the process,
material flow in production process and how it can be reduce the production time to meet
customer expectation. Extension to VSM may also include environmental improvements
(Kurdve, 2014) or work environmental improvements (Jarebrant, et al., 2015). While lean
metrics, which is use in VSM, helps in showing, the numerical values, which differ in current

3 THEORETICAL BACKGROUND
11
and future, state prospective. The VSM technique is present as innovative graphic technique to
design the production flow or material flow, which moreover marks the disconnected flow line
and shows where the time can be optimize (McDonald, et al., 2002; Schmidtke, et al., 2014;
Serrano, et al., 2008).
One of the targets in LMS is to achieve the cut down in production lead-time and removing
non-value adding activities to the process. The following steps must be followed before
performing VSM:
1) To perform current VSM and try to detect the non-value adding process
2) To come up with the suggestion required to improve the efficiency of the process and action
plan, which needed to implement (Kurdve, 2014).
3) To check and analysis with financial effect regarding the change in process. The Current
VSM and Future VSM show the difference in order to eliminate the waste through Kaizen
events (Chen, et al., 2010; Krishna Jasti & Sharma, 2014; Lacerda, et al., 2016).
Value added time refers to the time behind the production process and which is demand
according to the customer and are willing to pay. Cycle time refers to the process time at one
station before moving to next station. While Takt time is the frequency, in which the
production was produce according to the customer need in per shift, day, week or month and
provide ideal state for manufacturing system (Chen, et al., 2010).
3.1.3 Just-In-Time
JIT concept of a lean philosophy means providing right product to the customer in right time.
The elimination of the waste from the root cause will return productivity in the high level of
interest and continuous flow system will appear.
One of JIT technique is using continuous flow and a pull system, to reduce the level of
inventory and solve the bottlenecks. The shortening of the lead delivery time required a quick
changeover and efficient utilization of labours and equipment’s (Liker, 2004). To have the best
efficient flow for the operation by using the three M’s (Muda, Muri, and Mura) together to
reduce the waste impacts to the lowest level. The JIT optimize the process along with decrease
the production lead time of the process.
3.1.4 5 S
According to Upadhye et al. (2010) define 5S mainly focuses on the effective working
condition and environment to provide standard work by following proper working procedures.

3 THEORETICAL BACKGROUND
12
Figure 3: The 5S process, (Liker & Meier, 2006), Pg. 65.
The steps of 5S in lean thinking are described as follow:
a) Sort: To separate all the non-value adding thing and eliminate in order to have clear
view of the items at workplace
b) Straighten: To rearrange all the important things, so it is easy in order to reach when
required
c) Shine: To keep neat and clean environment, to have good working environment
d) Standardize: To maintain the routine and check the 3S’s in order to stabilize the work
e) Sustain: To make daily way of life and have a discipline working environment every
time
As a starting point it was becoming benefits on lean implementation in any company as 5S was
so easy to adopt (Liker, 2004). For keeping more productivity and full functional of any work
station, so 5S was used as a set of procedures which redesign the work place. In any future
improvement of the company, the organization use to involve workers for using 5S as shown in
Figure 3.
3.1.5 The ‘5 whys’
Problem statement: The fabrication units per hour is below goal
Why Question Answers Evidence Solution
1 Why not able to make enough part
Losing production opportunities
2 Why loosing production opportunities
Loosing time
3 Why loosing time
Cycle time losses

3 THEORETICAL BACKGROUND
13
4 Why cycle time losses
Loading machine takes too long
5 why loading machine takes long
Operators walks 5 feet for material
Operators travel long distance for material
Figure 4: ‘5 whys’ analysis, (Liker & Meier, 2006), Pg. 346.
According to Chen et al. (2010) the method to find the root cause of a given problem and to
solve the reason behind Muda is solved by performing five whys. It is written on a piece of
paper, starting with the specific problem and asking the question to know the answer behind the
problem. The cause investigation helps to reach the root cause of the problem and the whys
keeps on going until the solution is mot found with satisfactory answer (Liker & Meier, 2006).
If the answer is not found on person need to keep on asking and then it will reach root cause of
the problem. The solution will take 5 whys or more or some time very few, but the
implementation depends till the need to reach the cause of issue, shown in Figure 4.
3.1.6 Kaizen events
Kaizen is done to find root cause and solve that root cause with the help of lean/six sigma
method. The waste is identified and the reason is showed behind it and things which need to
improve are presented on kaizen sheet.
Figure 5: Kaizen events
3 THEORETICAL BACKGROUND
14
According to Chen et al. (2010) and Upadhye et al. (2010), kaizen contribute to fix the
improvement in manufacturing system. Kaizen events are also termed as root cause analysis
method, to recognize and to reduce Muda i.e. waste. The kaizen events show the future state of
process required to change for much needed development. It carries much method before
completing whole kaizen event, utilized to find the root cause which exits in manufacturing
system, bring continuous improvements and provide efficient working environment as per the
steps presented in Figure 5.
First the root cause identification is done to know the problem found in manufacturing system
i.e. waiting time, non-value added process, and long production lead time, increase the speed of
operation etc. The second step to work on various methods like 5 whys, 4 Machine, Man,
Material and Method (4M), X Matrix, Failure Mode and Effect Analysis (FMEA), Kanban, QA
matrix, VSM; poka yoke and Standard Operating Procedures (SOP) which will show the root
cause and suggestions which will help to solve the issue. Third step is various scenario or
proposal which needed to implemented to resolve the matter. Performing Kaizen event increase
the competiveness of the company and help them to reduce the non-value adding activities and
propose countermeasures which should be taken in order to maintain it (Liker, 2004).
3.1.7 Total preventive maintenance
Total Preventive maintenance (TPM) has that capability which works in to enhance
productivity and reduce the product cost. The focus of most the companies have switched from
fixing breakdowns to preventive maintenance (Abdulmalek & Rajgopal, 2006). The concept of
overall equipment efficiency (OEE) was introduced to support TPM, which works as initiatives
to increase the efficiency of the whole system mentioned about OEE as key performance
indicator, which helps in improving production rate and quality rate. TPM is experienced in
several industries as a business tool for fast and continuous improvement in its manufacturing
capabilities
Measuring of performance is must for any company to know its level and ability for
production. Abdulmalek & Rajgopal (2006) point out that performance is a topic to discuss as
it shows the creditability of machine working and how the smoothly and accurately is working.
Measuring the performance of equipment’s and its production gives a picture how the speed
and process in going on, the lacking action or essential modification can be made to increase
the performance. Maintenance is planned in such a way that the production value and logistics
are not affected and have a minimum disturbance (Upadhye, et al., 2010).
Also, Belekoukias et al. (2014) found that the three resources TPM, TQM and human resource
management interrelated with each other to have flexibility and quality in performance. OEE is
measured based on the availability performance rate and quality rate of the machine, which is
quit helpful to measure productivity level of any working machine. While the losses in the
production, are reported under OEE of that machine which failed to perform up to the level of
machine quality, productivity and its utilization OEE does not guide problem related with
downtime and rework. The exactness of OEE is largely determined on the source on quality of
the facts collected after the process.
OEE gets low has much concern behind it, such lack of labor, lack of material supply, old
machine, lack of maintenance and planned downtime. Most of the period, OEE is not low due
to machine efficiency but due to human error and lack of interest towards process. Further,

3 THEORETICAL BACKGROUND
15
Upadhye et al. (2010) have shown the common thought about OEE is regarding efficiency of
equipment, not taken into consideration as play important role in working environment.
3.2 MULTIPRODUCTION
The multiproduction plays a vital role in modern industries to have flexibility along with
utilization of machine up to its highest level. The multiproduction helps with cutting down the
inventory cost and helps to run machine with full capacity, increasing the usefulness of the
machine. There are so many methods implemented to bring up with work dealing with
estimation of the process, lead time, work-in-process, lot sizing issues and production planning
issues. Some methods has basic concept of forming queueing or sequencing the multiproduct
emerged from the queueing network model formulation of annealing the production process
(Lefranqois, et al., 1991; Schmidtke, et al., 2014). Key factor is to keep hold of production
control which is being part of material handling; the main focus area of production control is to
deliver quality and quantity of tools with respect to the time and customer demand. Prakash &
Chin (2014) argues a production control has important aspects while dealing with the
multiproduction. As it deliver the variety of product from the machine at the same time, to
reduce inventory level and avoid mismanagement.
The production control determines the multi-product procedures and the common alterations of
Constant Work-In-Process (CONWIP) machine required to produce along with the procedure it
pass through. While to run smooth flow of production system the four pull systems used in
multi-stage multi-product production are Kanban, Paired-cell Overlapping Loop of Cards with
Authorization (POLCA), CONWIP and mixed pull production system (Kurt, 1992; Prakash &
Chin, 2014). Also, Kang (2015) declare that manufacturing resource planning is kind of the
production planning system which deals with the multi-production having push systems. The
multi-objective function helps to know the batch production, sequence of the production, works
capacity of the equipment production capacity.
3.2.1 Drawbacks of multiproduction
In multi-stage multi-production utilize production planning system termed as Manufacturing
Resource Planning (MRP). Prakash & Chin (2014) emphasises that it is very important to have
in organization to avoid loss of flow time of production, if one delay in material resource or
human resource may cause damage.The failure on adaptive lot-sizing of multiproduction may
lead to the loss of flow times and decrease the efficiency of the process. The multi-objective
function of the process demands to keep the account of flow-time and allow the machine to halt
then exceeding more than its capacity level and affect the productivity of the machine
(Lefrancois, et al., 1991).
The multi-production sometimes incorporates with the flow time and creates over burden to
handle the capacity. It also creates the problem increase in WIP level and the flow time will
always be in issue, while optimizing the process (Prakash & Chin, 2014). According to Kang et
al. (2015) the multi-product procedure always faces lot of buffers and defects with the
sequencing of setup-time which may lead to big load in production lead time. It is very
important to have FMS in order to have proper design for the flow multi-product and its
process should be generalized.

3 THEORETICAL BACKGROUND
16
3.3 MATERIAL HANDLING
Material handling is very essential part of operations, the tools and techniques are also getting
advance for it.
3.3.1 Tools and techniques applied for material handling
Materials feeding, material handling, storage, transportation, packaging and manufacturing
planning and control comes under Material Supply System (MSS) but the problem related to it
is faced by Product Development Project (PDP), so all should come in with one picture and
solve the issue with meant to be faced by both areas and for that it required good
communication (Johansson & Johansson, 2006). The two constituents of importance for MSS
are physical system design and control and integration. In physical supply design includes topic
associated to storage and transportation, while control and integration connected to material
supply issues and manufacturing planning and control activities. Numerous slowdowns are
faced while having batch production, which may result into lead time in production. So to have
smooth flow of various components on assembly line or in production line, the availability of
material and material supply system should be arranged in order to reach.
Flow of material from current state can be improved with the help of lean tools (Kurdve, et al.,
2015). There are various methods and process need to be followed to keep the material flow a
smooth flow process. For handling material in plant or logistic area a well planning is required,
right decision making and proper communication will lead to optimal flow of material without
any delay or time taking process. Kurdve et al. (2015) suggest that VSM for instance is a lean
tool used to survey material flow. The information data between the process and material
handling department is very less exchange, which leaves few loop holes and may cause to long
lead time in process and extra work while handling the material while on-going process
(Johansson & Johansson, 2004).
3.3.2 Well-organized material supply system through usage of technology
In today manufacturing world, adaptation of automation and flexibility is adopted. The
automation system helps to optimize the process and can deal with fast ramp up in production
(Hedelind, et al., 2007). With new technology available for material handling, they bring more
sequencing and perfection in transportation i.e. Automated Guided Vehicles (AGVs) which are
available (Trebilcock, 2012). The test of AGVs is held in order to check the working and
capacity required to carry out the task which gives maximum throughput. For AGVs material
handling activities probability distribution are consider for handling matters by means of
statistical method. Before implementation of AGVs time study is done or many simulations are
run in order to have efficiency before its implementation. AGVs are used along with various
machinery in order to have automated manufacturing system to meet productivity objective,
automated system are always bit expensive so they must be well programmed before installing
it.
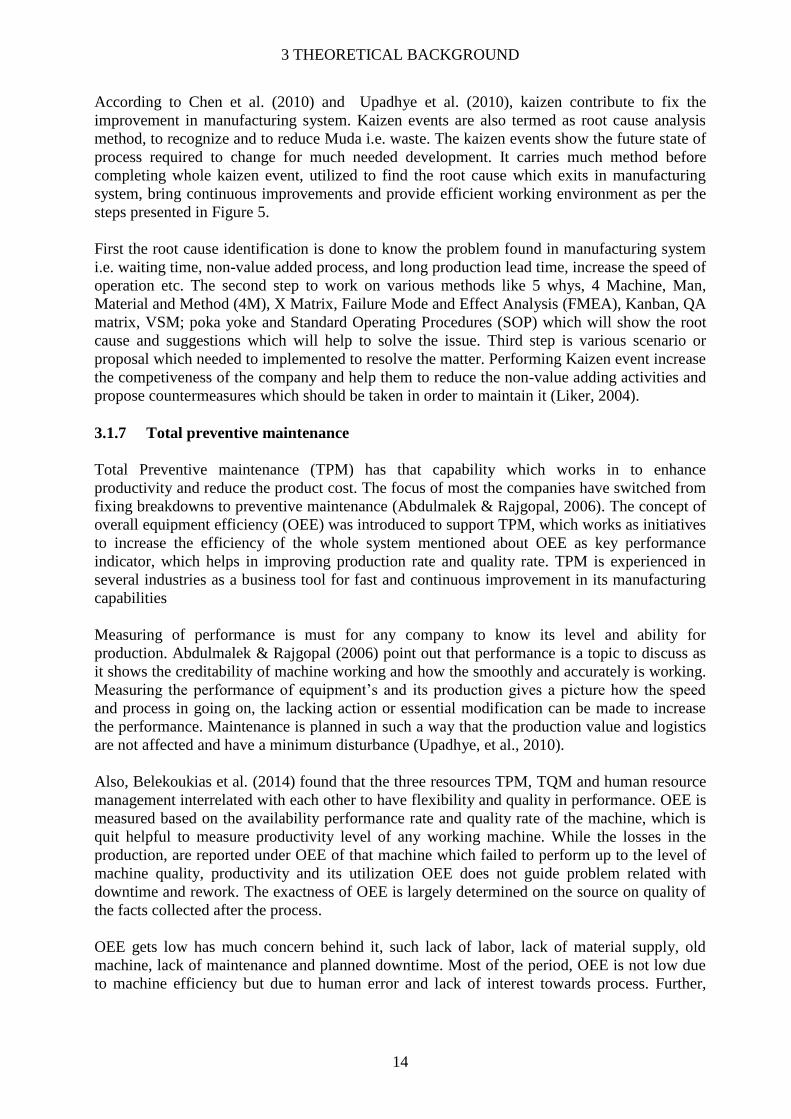
The world class and famous Toyota motor manufacturing used in material handling and
transport raw material within the working area. The AGVs are one launched in order to help
with lean production with respect to the cost and time behind the running process. According to
Trebilcock (2012) the AGVs deliver the part to the assembly line and improve the quality for
handling the material shown in Figure 6. The implementation of AGVs helps to optimize the
process, along with that it saves extra cost for the operator working for handling the material.
3 THEORETICAL BACKGROUND
17
With the help of AGVs it gives enough time to focus on other areas, such as continuous
improvement.
Figure 6: Toyota Material Handling, AGV, (Trebilcock, 2012), Pg. 19.
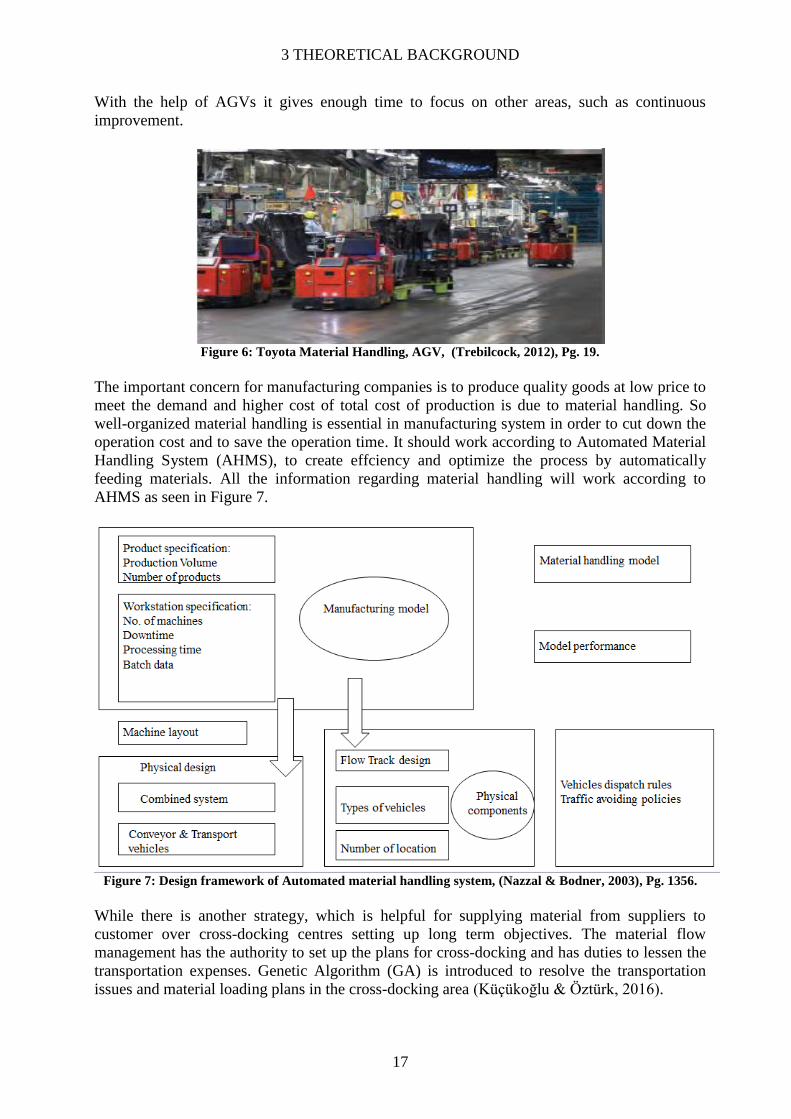
The important concern for manufacturing companies is to produce quality goods at low price to
meet the demand and higher cost of total cost of production is due to material handling. So
well-organized material handling is essential in manufacturing system in order to cut down the
operation cost and to save the operation time. It should work according to Automated Material
Handling System (AHMS), to create effciency and optimize the process by automatically
feeding materials. All the information regarding material handling will work according to
AHMS as seen in Figure 7.
Figure 7: Design framework of Automated material handling system, (Nazzal & Bodner, 2003), Pg. 1356.
While there is another strategy, which is helpful for supplying material from suppliers to
customer over cross-docking centres setting up long term objectives. The material flow
management has the authority to set up the plans for cross-docking and has duties to lessen the
transportation expenses. Genetic Algorithm (GA) is introduced to resolve the transportation
issues and material loading plans in the cross-docking area (Küçükoğlu & Öztürk, 2016).

3 THEORETICAL BACKGROUND
18
Caputo, et al., (2015) note that while designing the assembly line, there is always an
investigation made to know how the delivery of material can be made to assembly line and
maintain the smooth flow. Kitting is one of the best alternatives to supply materials to the
assembly line and keep the continuous flow of supplying material to the shop floors. In kitting
all the material are kept in a kit and are delivered during the time of need of material at the
assembly line required during the manufacturing of the parts presented in Figure 8. There is
small kit also, which are traveled from supermarket as per the need at the working stations. The
balancing of material flow is much required during ongoing production process and which
proves to be cost effective system. There will be low storage of parts around the assembly, if
the kitting system is applied.
Figure 8: Scheme of kitting and assembly system , Caputo, et al., (2015), Pg. 71.
The right supply system of material can increase the efficiency of the assembly line and
performance helps in increase the production. The kit travelling concept also prove to give
advantage to the assembly as it carries other parts also, so it reduce the cost of handling the
material. The decrease in manufacturing of floor place can be witnessed and more cleanliness
can be observed on shop floors (Caputo, et al., 2015). For the preparation of kitting there is
need for the labors to fix the material and maintain the flow with respect to JIT, which may fail
some time to deliver. The arrangement of kitting consumes more space in the store room.
Kitting has other advantages also to reduce the work load and stress of the workers, as it
requires less time to search and material availability will be found at assembly line. On other
hand it supports small operations as it customize and provide flexibility.
According to Buijs et al. (2014) the Cross-docking provides facility in reducing long
transportation lead times and deliver transport efficiencies, reduction in material handling and
storage cost. The main of cross docking to minimize the waiting time for the supply of the
material and can have an efficient flow of material. The other advantage of having cross
docking is to have Just-in-time for the supply of material for the workers. It also support
flexible material supply, as it utilizes the conveyor to send the material to assembly line and
handle the material very smoothly. It conveys that cross docking reduce the inventory cost,
order picking cost and fulfill customer demands (Küçükoğlu & Öztürk, 2016).

3 THEORETICAL BACKGROUND
19
3.4 PROCESS FLOW & LAYOUT DESIGN
The Work-In-Process (WIP) are conserved with respect to have all the collection and data
related to the production of the tool, which is repeatedly produced, and renewal tool, in order to
keep up the demand. There are two systems; either of each is utilized to meet the need of
customer, which depends on the priority. In push system of production, there will be long flow
rate and maintain the inventory level, which would become major concern. On other hand, pull
system control the inventory level and specially WIP (Prakash & Chin, 2014). Kurt (1992)
found that utilizing flexibility in production is every company’s strategy to have batch
production depends on operational planning.
Strategies Primary Lean Tools Secondary Lean Tools
Waste elimination
Force problems to
surface
Make problems
uncomfortable
Establish connected
processes to create
interdependency
Identify the weakness
Workplace design
Pull techniques
Customer
relationships
Visual controls
Kanban
Kanban boards
Supermarkets
FIFO lanes
Problem solving
Figure 9: Process flow and lean tools, (Liker & Meier, 2006), Pg. 89.
In today’s manufacturing companies try to utilize one piece flow, which is applied among work
stations to avoid the losses in production lead time and prevent overproduction. The right
process flow helps to maintain the stability and fulfil daily customer demand. The process flow
interrupts due to unreliable supply of material or lack of supply which cause delays in
operation and may cause loss in time (Liker & Meier, 2006). The downtime and changeover
time should be considered and an important factor for inconsistent flow and to ease the process
such things needed to be solved for achieving smooth flow. The lean tools work to prevent the
loss in process flow is indicated in Figure 9.
The elimination of cross flow of different product is an issue to investigate and how to reduce
the flow time. The problematic issues are generally associated with operational division to
reduce the lead-time. The flow diagrams are commonly used to know the movement regarding
material, people and transportation. The Cross traffic, backtracking, distance travelled and
process procedures are being noted down in order to analysis and find effective solution for the
workstation (Lacerda, et al., 2016).
Flexible Manufacturing System (FMS) is much required when we have various varieties in
production, work station, equipment’s, computer control and running out of time to produce
seen in Figure 10. FMS usually deals with mathematical or algorithm methods, but nowadays
its getting complicated and required simulation to analyze in which there would be no loss of
money, resource and labor (El-Tamimi, et al., 2011; Goswami & Tiwari, 2006). The rise in
demand of verity of products need to production on required machine and other adjustment
with handling and manufacturing are analyze with simulation to achieve higher speed,
flexibility and increased in manufacturing productivity.

3 THEORETICAL BACKGROUND
20
Figure 10: Flexible manufacturing system configuration, (El-Tamimi, et al., 2011), Pg. 118.
The lot-sizing approach is implemented to reduce flow-times and increase the equipment
efficiency, is major concern of every companies. The job sequencing approach developed seeks
to control day-to day operations on job floor, which must to avoid dues and have no layback in
process (Lefranqois, et al., 1991). But according to El-Tamimi et al. (2011), FMS mainly
consists of machine flexibility, operational flexibility, routine flexibility, process flexibility and
product flexibility, to improve the performance of the system as it will decrease the labor cost,
increase the output, reduced manufacturing cost, cut down supply chain cost and most
important think is decline in production lead time. There are few techniques which are used in
order to check the ability FMS systems, named as petri nets, Visual and Bottleneck technique.
The process design in production and logistics depends on technical and management factors in
order to have an optimal process flow which can be mange be Computer-Aided design (CAD)
and process simulation tools which are the part of Integrated Design of Systems (IDS) (Dias,
et al., 2014). CAD and process simulation are used in order to develop design process, in which
CAD help with static arrangement of process layout and simulation helps to analysis whole
process with different scenarios in order to select the best solution. The used of CAD is done
for designing and creating drawing which in various areas seen in Figure 11. The CAD drawing
for process layout shows various possibilities.
Figure 11: IDS overview, (Dias, et al., 2014), Pg. 50.

3 THEORETICAL BACKGROUND
21
The simplest version of layout is created by using method of Production Flow Analysis (PFA),
which support product oriented layout. To run the process smoothly and in a flow PFA is
implemented which flows scheduling and established stable planning and flow of material
(Hameri, 2010). A proper PFA is required to reduce the production lead time and improves the
process flow and clears all non-value adding activities. It also eases the operation for the
operators who are carrying multi-task or objectives need to be carried out in plant as numerous
model and algorithm are applied in order to improve PFA approach, which will also shows
improvement WIPs. PFA is well-organized methodology, which delivers a functional layout
into product focused on layout. It has been established to have a fixed planning, proper
production and delivery cycles in order to have proper scheduling system (Hameri, 2010). The
key concern with PFA is to analyze work in order to reduce lead time, production planning,
reduce variation and bottlenecks.
3.5 DISCRETE EVENT SIMULATION
Discrete Event Simulation (DES) has its own specialization on usage to verify uncertainty and
create dynamic modeling methodology of lead times, process optimization, and machine
utilization and to visualize inventory level before forming future state maps. Simulation
provides convincing approach for the adoption of lean production, as the comparison can be
made between simulation and practical performed by lean (Abdulmalek & Rajgopal, 2006;
Dias, et al., 2014; Lefranqois, et al., 1991; Schmidtke, et al., 2014). The management has better
view of two outcomes and can do potential replacement before implementation (Abdulmalek &
Rajgopal, 2006).
Figure 12: Step of simulation study for process flow, (Prakash & Chin, 2014), Pg. 486.

3 THEORETICAL BACKGROUND
22
3.5.1 Benefits of DES
Dias, et al. (2014) asserted that the simulation let the workers to conduct an experiment with
model with respect to real system where it can have different scenarios to compare. There are
numerous simulation tools which work with the modeling and help to take a step before
implementing the real task; it gives possible options as an alternative for spreadsheet
calculation. One can say the biggest advantage of a DES model is that bottlenecks can be
identified easily and the time difference can be noted down and can be comparing with the
current. DES is also an identifying tool, which help to eliminate disturbances and the company
can see with a number of scenarios that how unlike variables interact with each other, working
procedure seen in Figure 12.
Kurdve & Salonen (2016) suggest that VSM which works on improvement, which is analyzed
in order to study and make simulation model for future changes (Schmidtke, et al., 2014). The
data for DES are taken from VSM current state as there is no change in lead time, cycle time,
down time, inventory (Sjögren, et al., 2016). DES is very promising add-on to VSM, it’s a
simulation model which can perform complex tasks. The lot-sizing approach is a kind of
sustainable approach in manufacturing industry saving time and cost in producing products.
DES saves the time for redesigning and shows the pros and cons of production. DES creates
flexibility in process and can try to experiment with small or big changes in process which
gives better quality (McDonald, et al., 2002). DES gives various scenarios for observations
before implementing it (Abdulmalek & Rajgopal, 2006). It’s a cost saving model and it’s
preparation for the workers before implementation of new process or project and proves
reasonably supportive (Lefrancois, Esperance, & Turmel, 1991; Schmidtke, Heiser, &
Hinrichsen, 2014).
While creating or adjusting material handling system, the problem is faced during designing the
process and it need several evaluations before fixing permanent one. So to solve the complex
design procedure, simulation model is introduce and several trail are done on model with
various products coming in and going out with complicated dispatching rules. The simulation
model gives several scenarios regarding problem of material handling (Nazzal & Bodner,
2003).
Nazzal & Bodner (2003) have shown the kind of data that is been inputted in DES model for
instance the time between two process, waiting time, types of product, mode of transportation,
process, shutdown time, preventative maintenance schedule, stocks waiting, number of
workers, machine capacity, physical location, batch size, Takt time, number of machine, mean
time to fail and mean time to repair. Then careful construction is done for simulation model
and its run to identify the bottlenecks and it helps to design efficient production.
3.5.2 Challenges while functioning DES
The challenges faced by the organization during the usage of simulation model are that to get
the result accurate, first requirement is to have right data to run the simulation model (Dias, et
al., 2014). If all the data are not available then it make hard to make the model and to get the
excepted results. DES is very time-consuming process, it need lot of practice otherwise it will
cost lot of time and the project can get extended due to delay in time of simulation results. The
other factor which is very crucial in starting simulation is the cost gone behind the workers,
while training them for learning simulation. The other challenges which are faced using DES
are described below:
3 THEORETICAL BACKGROUND
23
Data: The collection of data before starting simulation model is important to gain the reliable
information regarding the process. The update and accurate data are not available may cause
into wrong resultant and guide towards wrong direction. It requires high qualitative data to
avoid long time behind making simulation model.
Time consuming process: It takes perfection and enough time to make the simulation model
run according to the need, as it’s always the most concern part before starting of simulation
model. When building up the DES model, a thorough study of process is vital to avoid the loss
of time (Schmidtke, et al., 2014). The time taken in validating data, modifying model and
verification of data may cause loss of time, which gives no benefits on usage of DES model.
Training required: The importance of DES is to give imitation of the real process or
manufacturing system, so to avoid complex method later on (Nazzal & Bodner, 2003). So to
verify and validate the accurate model, simulation model expert are mainly involved to avoid
misleading of the result and give the require result.
Results: The results are very important which are formed from DES need to present in right
order to make understand the opposite person who is looking into the results. The result can be
presented in form of table, graph or in number to show the improvement made in from current
to future state or in form of various scenarios.
The lean manufacturing system is explained with the lean tools which are consider as relevant
methods required for finding solution. The importance of process flow and layout is
showcased, that how beneficial it becomes during optimization along with material handling
process and methods. The factors regarding multi-production is describe to find out its
drawback and benefits. While DES with support the solution obtain obtained from lean tools.

4 EMPIRICAL DATA
24
4 EMPIRICAL DATA
In this chapter, the case study is presented along with the findings and possible solutions for
the company. The company’s current state is reported, highlighting manufacturing strategies
and production system development strategy along with company background and the project
description. The outcomes obtained from value stream mapping & simulation model is
mentioned in order to showcase what changes could be done to have smooth process flow in
Heat treatment plant and the steps which will optimize the process showing importance of lean
production.
4.1 VOLVO GROUP TRUCKS OPERATIONS
The Volvo Group is one of the world’s leading manufacturers of trucks, buses, construction
equipment and marine and industrial engines. Volvo Group Trucks Operations (GTO) has the
truck industrial entity within the Volvo Group responsible for Truck manufacturing, including
Cab & Vehicle Assembly, Powertrain Production, Logistics Services, Parts Distribution and
Remanufacturing. Volvo GTO, Köping does the production of gearboxes for trucks, bus and
other bigger vehicles. They also produce marine gearboxes and products for marine.
4.1.1 Manufacturing strategy
Volvo GTO has World-class manufacturing system, which keeps them at very strong position
in world market and to sustain the position of leading customer satisfaction. The key points
which Volvo follows from there World-class manufacturing system are as follows:
1. Continuous improvement: Importance is given to it as it is required to improve the
working and culture system of the company.
2. The importance of having a perspective view, which covers whole company working
style and takes every view to have systematic improvement in all stage.
3. Zero optimum concepts, the company can improve from current stage, so the target is to
aim for zero.
4. Countermeasures against root causes, to find out the reasons behind the problem and try
to solve it.
5. Detail Oriented, trying to know root causes of a problem and attacking it with proper
method.
6. Visualization of problems creates action, as it helps to know problem even better,
basically it is expressed in figures.
7. From reactive to preventive to proactive improvement approaches, this helps to
improvement of procedure in future.
8. Well organized importance is much required, to analyze the problem in depth during the
breakdown, it should be addressed the problem of component economically also.
9. Focusing on the quality improvement, based on inspection of quality control, process
quality control, total quality control and Total quality management.
10. Customer in focus, supply good and services to customer on time. Identifying the needs
of the markets and then developing plan to achieve the target. Promoting the
collaboration with the customer for betterment of the company.
11. Time management, following steps in order and saving time will save the cost also.
12. Knowledge management, methods of manufacturing and the countermeasures to resolve
the procedure.

4 EMPIRICAL DATA
25
13. Standardization makes abnormalities so obvious and visual that corrective actions can
be taken.
14. Cost consciousness, focused improvement will lead to low down the cost and which
need to follow up.
15. Production engineering, where product and process are the two side of the coin.
4.1.2 Production system development
The Volvo GTO had developed their own product system development, they follow own lean
approach termed as Volvo Production System (VPS) showcase in Figure 13. The pillar is
describe about how the continuous improvement culture is expressed in working environment
and betterment for the working staff to provide knowledge and setup an example for any
organization to be successful
Figure 13 : Volvo Production System, Volvo Group Internet.
Management Commitment In VPS, management commitment has been sub-divide into four parts as continuous
improvement leadership, vision & strategy deployment, living process and communication.
Continuous improvement leadership To engaged working team leaders and mangers involved to support the organization and to
create a working environment, so everyone can learn from each other and improve
continuously.
Vision & strategy deployment A plan or target is setup for the organization to achieve a responsible task, what goal, task has
to performed are distributed, and time plan is created when to achieve presented in Figure 14.

4 EMPIRICAL DATA
26
Figure 14 : Management Commitment, Volvo Group Internet.
Living process An agile and manoeverable organization, with customers and business prospective has
capability to face all the important challenges and business partners. In which people would be
collaborate to reach break through, leading high energy and higher capability.
Communication
Effective communication gives strength to VPS culture and how each person is involved in
change and improvement of the work. An effective communication process and communicative
leadership is guided transparency and open conversation at all levels.
PERFORMANCE Management Performance management ensures that performance against set target is being noted down to
have information in visual and transparent manner. To do this, a suitable structure is developed
to note performance and progress of operational and tactical activities, along with that all
problems should be informed and required support to solve it seen in Figure 15.
Data &Fact management
Data and facts should be well written and stored in order and gather, which is necessary to
measure and evolve performance.
Meeting structure & Escalation Process
Regular assessment of the work is needed, in order to track the performance and check the
activity progress. The problems appeared need to be address to right organization.
Figure 15: Performance Managemnet, Volvo Group Internet.

4 EMPIRICAL DATA
27
Prioritization
Focus and inputs should be given to the work which gets the real benefits out of it.
Visual management
An effective way should be practice to address the problems, to identify the status
abnormalities.
PEOPLE Development
People are the most important part of organization, nothing is possible without people.
Therefore to succeed VPS, people should do job with ability and develop the job. Along with
the teamwork, independently people develop with whole team as well. With teamwork effect,
an organization can recognize and create competencies necessary for the success. The
improvement in working process and development is done in technical areas. Coaching,
feedback and recognition gives both effectiveness and efficiency of the improvements, which
serves good source of new energy and commitment presented in Figure 16.
Teamwork
All employees should be involved in order for improvement and development of the company.
Figure 16: People Development, Volvo Group Internet.
Competence Development
The competence from the people is much required for the growth of organization and VPS. The
competence of the people must be evaluated and should be developed continuously. The
culture of ‘learning and sharing’ should be created.
Feedback & Recognition
Coaching, recognition and feedback from the people helps to have excellent growth.
Knowledge Management
The systematical use of create; capture and reuse of energy and knowledge should be done, to
generate continuous improvement for individual and organization.

4 EMPIRICAL DATA
28
IMPROVEMENT Structure An organization sustainable success mainly depends on skill to adapt the change and improve.
Teams are fundamental approach to facilitate improvement and come up with better
suggestions for prosperity. Problem solving helps to deal with problem and find the root cause
of the problem. Structured methods reinsure that the improvement can be done and can get
information in order to it is available to reprocess when need presented in Figure 17.
Standardization
Standardization can sees problem and establish the solution for the required improvement.
Problem Solving
A well-structured method which works to identify the errors and drawbacks, on basis on root
cause trying to find the solution of the problem.
Figure 17: Improvement Structure, Volvo Group Internet.
Support Structure
People or Team with various abilities and skills, which helps organization to improve work at
diverse range.
Improvement Methods
Appropriate methods are used to solve various problems, as it is needed for the success.
Improvements are giving more significance if they are outcome of a method.
LEAN PRACTICES
Lean practices permits care towards customer. There are important mindsets which suggest
minimum operational cost such as Built-In-Quality and Just-In-Time.
Built-In-Quality (BIQ)
It means delivering the product in order according to the customer demand and needs i.e.
following the procedure according to the customer right from the first step. To reach zero
defect level, so whenever the problem appears, the solution can be formed by knowing the root

4 EMPIRICAL DATA
29
cause and analysis in a manner that, preventive measures can be developed. While the
development of anything new process and product, the past experience should be address.
Figure 18: Lean Practices, Volvo Group Internet.
Just-in-Time (JIT)
It means delivering of the goods in right time and right process to the customer within right
quantity. Lean tools are implemented in order to eliminate the waste and methods used to make
the process more accurate, shortening the processes lead time.
END-TO END ALIGNMENT
Figure 19: END-TO END ALIGNMENT, Volvo Group Internet.
Connections between function, different working areas, and all departments should one
common customer oriented focus by an effective collaboration and group of individual, team,
goals and measurement, value chain should be formed in order to achieve goal with long term
and short term target. Communication, cross-functional work and collaboration form
improvement road. Integration of different team of same organizations works for same goal and
targets, to reduce lead time and provide quality to the company´s goal. Cross Functional work
comes into play when team of different expertise combines to develop new product, process,
solve error and give possible best possible solution.
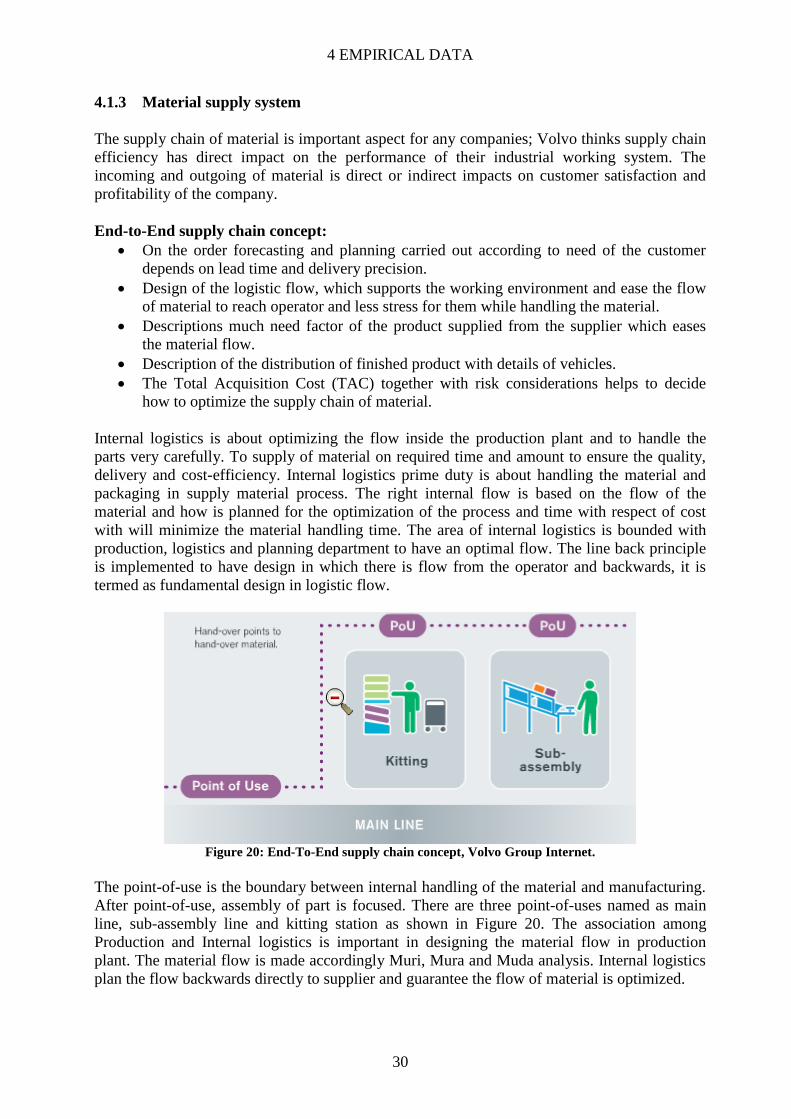
4 EMPIRICAL DATA
30
4.1.3 Material supply system
The supply chain of material is important aspect for any companies; Volvo thinks supply chain
efficiency has direct impact on the performance of their industrial working system. The
incoming and outgoing of material is direct or indirect impacts on customer satisfaction and
profitability of the company.
End-to-End supply chain concept:
On the order forecasting and planning carried out according to need of the customer
depends on lead time and delivery precision.
Design of the logistic flow, which supports the working environment and ease the flow
of material to reach operator and less stress for them while handling the material.
Descriptions much need factor of the product supplied from the supplier which eases
the material flow.
Description of the distribution of finished product with details of vehicles.
The Total Acquisition Cost (TAC) together with risk considerations helps to decide
how to optimize the supply chain of material.
Internal logistics is about optimizing the flow inside the production plant and to handle the
parts very carefully. To supply of material on required time and amount to ensure the quality,
delivery and cost-efficiency. Internal logistics prime duty is about handling the material and
packaging in supply material process. The right internal flow is based on the flow of the
material and how is planned for the optimization of the process and time with respect of cost
with will minimize the material handling time. The area of internal logistics is bounded with
production, logistics and planning department to have an optimal flow. The line back principle
is implemented to have design in which there is flow from the operator and backwards, it is
termed as fundamental design in logistic flow.
Figure 20: End-To-End supply chain concept, Volvo Group Internet.
The point-of-use is the boundary between internal handling of the material and manufacturing.
After point-of-use, assembly of part is focused. There are three point-of-uses named as main
line, sub-assembly line and kitting station as shown in Figure 20. The association among
Production and Internal logistics is important in designing the material flow in production
plant. The material flow is made accordingly Muri, Mura and Muda analysis. Internal logistics
plan the flow backwards directly to supplier and guarantee the flow of material is optimized.

4 EMPIRICAL DATA
31
The plant in Volvo is set-up according to Fishbone concept, where the main assembly is
supported by sub-assembly and materials are in sequence or kits. The idea behind using
Fishbone is to bring diversity in sub-flows then from main assembly line, to have more option
for high production and would have less throughput times in the main line. The operations
which are carrying forward in fishbone are sub-assembly, kitting and sequencing. So to balance
workload and to have flexibility therefore sub-assemblies and kitting station are placed nearby.
The sequencing is done near to the storage area. The usage of fishbone in material handling
will reduce the number of handling times before the parts are delivered to point of use. To
decrease the transport distance and unloading the material, the material should be placed near
where they are being going too used. Therefore, fishbone plays vital role in handling and
storage of material in plant area. Another objective of internal logistics is to support operator to
receive parts in a one-piece-flow, which shorten assembly time variation.
Sequencing play an vital role to allot material to production line in same order as the
production sequence in very optimize method which supports the operator and make their work
easier while handling and moving of material. While in kitting it is applied for medium and
small sized parts as shown in Figure 21. In comparison to sequencing the different part of
families can be mixed in kitting, as parts can be kitted together with part of sequence.
Figure 21: Kitting, Volvo Group Internet.
In box or trolley, the kitted are usually placed and it’s another way to provide optimally to
operator. Two-bin system is a delivery mode based on minimum two boxes in material facade.
When one box gets empty another one triggers the requirement of new box. By applying this
system it ensure that there is always material available for assembly line and there is no
shortage. The material ordering and distribution works on basic rule of Kanban signal, the
needs occur then the delivery order are made. One more method used to supply material is
termed as water strider method is used to feed several parts to assembly points by train as seen
in Figure 22. The raw material is delivering by train and reduces the work-in-process
inventories i.e. minimizing transportation Muda. The supermarket train is setup to reach
operators when they run out of parts.
Figure 22: Water strider method, Volvo Group Internet.
The forklifts are used for loading and unloading of the material, while tugger trains are used for
material distribution. The other equipment to handle material is trolley, which handle light

4 EMPIRICAL DATA
32
weight parts. Automated guided trucks or vehicles are used on assembly line to optimize the
process and put less stress on operators while handling the material from the storage.
Figure 23: Cross Dock, Volvo Group Internet.
While handling the delivering material, the Cross dock is a consolidation hub where various
goods from the supplier and further cross dock is done before entering the plant area. Cross
dock helps to plan systematic distribution of material sorted by receiving plant shown in Figure
23.
There are various events which are tracked for handling the material are transport booking
request, transport booking confirmation, proof of collection, proof of arrival, load confirmation
and proof of delivery. Furthermore daily frequency of material, takt time, weekly frequency
and multi day frequency are closely observed to have smooth flow of material instead of
overloading at supermarket. Material controlling parameters are as important and other
methods for controlling the flow of material, to set delivery frequency, communication
frequency and about safety stock. The main target of this parameter to keep lowest level of
safety stock, reduce material handling, eliminate the risk of handling heavy goods and tied-up
capital.
While picking the replenishment method, the main aim is to minimize the material handling
and the capital which is attached to the transportation. There are different replenishment
methods:
Kanban (pull) - It is related to internal logistics, where the suppliers are directly connected to
the plant. To apply Kanban supplier must be 1-2 days from the plant and they should follow
same working calendar.
Material Replenishment Planning (MRP) (push) - Planning is made on the consumption of the
material. The supplier lead time is within firm planning horizon in order to call off material
when only it is really required.
Order based replenishment (push) – Low volume of parts with high diversity. Various parts are
forecast in delivery schedule and stay in forecast until and unless they are not entered in the
plant’s order system.
Sequence deliveries (push or pull) – The various parts are order according to production plans
sequence The part chassis number are connected to parts ordered and delivered in sequence.
4.1.4 Discrete event simulation
Volvo GTO does not use any type of simulation for analyzing the loss in time or to reduce
process flow in heat treatment plant. Mostly the kaizen is used to find out the solution of a
problem, where kaizen is divided into two types major kaizen and standard kaizen. Major
Kaizen usually formulate big task, while small problem are solved by using standard kaizen.

4 EMPIRICAL DATA
33
4.2 SPECIFIED PROBLEM FORMULATION AT VOLVO GTO
Volvo GTO is planning to do optimize the process flow and to increase the efficiency of the
heat treatment plant for the furnaces 3, 4 & 5. The other task was to inspect what are the
possible reasons or technical drawback face during the usage of furnace 3 and 5 where
multiproduction can’t be done. The company needs to increase the production efficiency and
utilization to be able to produce more efficiently. Since the furnace has the same recipe and
construction limitation, so the drawbacks can be only obtained from the material flow as the
process is continuous when the components goes inside the furnace till it comes out. The other
option is to reduce the no value added time while handling the material in heat treatment plant.
Before reducing the non-value added time, an understanding of how much time that is spent on
material handling is needed to be investigated. Dealing with this problem could improve the
cycle and lead-time and the procedure in heat treatment plant would be more effective.
At the heat treatment plant, we can see that the material is taken by the trucks and stored near
furnace before putting on the lane. There is not a big space which could help trucks to take easy
turns, it pretty time consuming and stressful for the operators while handling the material. In
furnace construction cannot be done physical or technical change. The company need is to
increase the efficiency of the furnace that it can produce more. While in furnace 3 only shaft
can produce and in furnace 5 gear and sync tool. So the problem comes when 3 or 5 furnace
goes for maintenance, as gear cannot be produce in 3 and shaft cannot be produce in 5. It’s a
big loss of time and money, while in furnace 4 shaft and gear can be produce. The process need
to be investigated and find the possible solution or suggest the method which will lead to the
result for furnace 3 and 5. The project doesn’t required to know the return of investment on
suggestions, as it is not demanded by company.
4.3 DESCRIPTION OF THE HEAT TREATMENT PLANT
Figure 24: Heat Treatment plant: Furnace 3, 4 and 5 design layouts.
Heat treatment is used to either maintain or alter the properties of metals. This is done by
means of changing in temperature and influence from the oven atmosphere. In heat treatment
plant at Volvo GTO has in total six furnaces which have various processes run according the
specification required for various articles. In this thesis work, three furnaces are considered and
their design layout is mentioned in Figure 24. In furnace one articles like marine, synchronizing
part and powertronic goes in. In second furnace synchronizing part goes in, third furnace
shafts and some gear parts are made, in fourth gears, marine and shaft are produce, in fifth gear
production is done and in sixth synchronizing part are produce. This all articles come from Soft

4 EMPIRICAL DATA
34
production and after heat treatment it goes in hard department. For the movement of the articles
forklifts are used in heat treatment plant.
To change the surface of the metal, an active gas atmosphere is used. The gas mixtures most
depend on the change in the metal you are looking or required according to specification.
The active components used in these reactions are:
Oxidation: Oxygen, water and carbon dioxide
Reduction: carbon monoxide and hydrogen gas
Charcoal: carbon monoxide, propane and methanol
De-cooling: carbon dioxide, water and oxygen
Nitration: ammonia
There are various processes in each furnaces are showed in Figure 25. They are named as pre-
washing, pre-heating, first furnace, oil bath, cooling, post washing, secondary furnace, shot
blasting and packing.
Figure 25: Operations and components of the production process.
The work performed by each processes in heat treatment plant are mentioned below:
1. Pre-washing: To clean the tool before carbonization.
2. Pre-heating: It perform pre-oxidation, active the surface for carbonization and face
transformation to avoid bending.
3. First Furnace: To increase carbonization in tools, achieve harden ability and maintain
required carbon for the tools.
4. Oil bath: Hardening takes place.
5. Cool bath: Water cooling.
6. Post-washing: To remove the oil from the surface of the tools.
7. Second Furnace: To make less brittle and remove unnecessary hardening.
8. Cooling: Put down the burning or heat.

4 EMPIRICAL DATA
35
9. Shot blasting: Giving proper finishing effects i.e. cleaning the surface and also works
with tensile stress in parts.
10. Packaging: Packing shafts, gears and marine in pallets.
The appropriate data and information are gathered from Volvo GTO required to solve the case
study. The VPS is explained in a systematic way to solve the problem and material handling
methods at Volvo GTO. The problem formulation is presented regarding heat treatment plant,
processes taken in various furnaces.

5 RESULTS
36
5 RESULTS
The Lean tools and simulation were applied to find the solution for research questions. Value
Stream Mapping (VSM) was performed to get the information regarding material flow and
information flow, this from current state VSM for furnace 3, 4 & 5. While ExtendSim model
was developed for furnace 4, to support the results obtained from kaizen events. The VSM will
help to understand the bottlenecks and simulation to evaluate the improvement needed to
increase the performance of heat treatment plant.
5.1.1 Current state value stream mapping
In Heat treatment plant, the current state map of furnace 3, 4 & 5 are mentioned in Figure 26,
27 and 28. Various parameters regarding process time, cycle time of each process, buffers and
inventory were registered. The process in all furnaces starts from the loading of inventory from
Supermarket (SSC) and back to SSC after packaging.
As the first step of current state VSM, the Takt time for the whole process was determined. The
Heat treatment plant has three shifts, and the production is counted in total time of 24 hours.
The measurement was carried out in the plant, collecting all the relevant data required such
process time, batch time, inventory, medium of transportation, customer demand and cycle
time. Instead of the number of pieces done, production of pallets was counted as per day
production unit.
VSM was performed on furnace 3, 4 and 5, here all the information were collected regarding
material flow and information flow. The highlighted areas shows the future improvement,
which would help with optimization of the process and will increase the efficiency of heat
treatment plant.
Furnace 3
Figure 26: Value Stream Mapping for Furnace 3.
Production Lead time = 13.7 hr. /pallet
Cycle time = 12.8 hr. /pallet

5 RESULTS
37
Takt time = 785.45 sec/pallet
Furnace 4
Figure 27: Value Stream Mapping for Furnace 4.
Production Lead time = 15.2(Gear)/ 17.2(shafts) hr. /pallet
Cycle time = 13.8(Gear)/ 15.8(shaft) hr. /pallet
Takt time = 576 sec/pallet
Furnace 5
Figure 28: Value Stream Mapping for Furnace 5.
Production Lead time = 15.3 hr. /pallet
Cycle time = 13.3 hr. /pallet
Takt Time = 1004.65 sec/pallet

5 RESULTS
38
5.1.2 Future state suggestion
The future suggestions for the furnaces are created to show the optimization of the process flow
is possible after implementation of suggestion. The modifications and the suggestion required
to increase the efficiency of heat treatment plant are mentioned below:
Furnace 3
There are possibilities of having two changes, first to introduce Automated Guided Vehicles
(AGVs) in order to save time behind handling the material, which will give many advantages
mentioned below:
1. Less stress for operators
2. Low storage of inventory in front of furnace i.e. zero inventory
3. Material flow will work according to just-in-time
4. Less usage of truck in heat treatment plant i.e. AGVs will prove more cost effective
5. In future Volvo GTO can have 1 operator each at furnace as implementation of AGVs
will cut down lot of work for operators.
The second suggestion for furnace 3 is to reduce the process time for handling the shafts before
putting them in the shot blasting process. To move the shafts from the pallets to the fixtures is a
time consuming process, and a robot could be installed to optimize the process. The same
suggestion applies after the process; Volvo GTO should have a robot instead of humans
moving the shafts from the fixtures to the pallets for packaging. This should be developed in a
similar way as furnace 4 and 5. The improvements are highlighted in Figure 29.
Figure 29: Future VSM for furnance 3
Furnace 4 There are possibilities of having two changes, first to introduce AGVs in order to save time
behind handling the material, which will give many advantages mentioned below:
1. Less stress for operators

5 RESULTS
39
2. Low storage of inventory in front of furnace i.e. zero inventory
3. Material flow will work according to just-in-time
4. Less usage of truck in heat treatment plant i.e. AGVs will prove more cost effective
5. In future Volvo GTO can have 1 operator each at furnace as implementation of AGVs
will cut down lot of work for operators.
The second suggestion is to change the process design of the shot blasting cell, this to optimize
the process and increase the efficiency of furnace 4. The process should be designed in a more
convenient way:
To help the operators with their work, and reduce their stress.
To facilitate their possibility to see the pallets and fixtures coming out.
To design process in a way that one should can see the fixtures and pallets coming out
in one direction along with packaging.
Two scenarios formed using AutoCAD Mechanical, to design the process layout of
blasting cell. The two scenarios were provided to Volvo GTO, which can be seen in the
figure Figure 30.
Figure 30: Two scenarios, process design layout
The other suggestions are mentioned below:
1. To have ABB robots (A5 level) to hold the shafts and gears, similar like furnace 5
2. To replace old shot blasting cell in order to increase efficiency of equipment
3. To have upgraded robots for handling gears and shafts from taking them from pallets to
fixtures for shot blasting till putting back in pallets for packing.
The improvements are highlighted in Figure 31, which helps to optimize the process in future
state.

5 RESULTS
40
Figure 31: Future VSM for furnance 4
Furnace 5
There are possibilities of having two changes, first to introduce AGVs in order to save time
behind handling the material, which will give many advantages mentioned below:
1. Less stress for operators
2. Low storage of inventory in front of furnace i.e. zero inventory
3. Material flow will work according to just-in-time
4. Less usage of truck in heat treatment plant i.e. AGVs will prove more cost effective
5. In future Volvo GTO can have 1 operator each at furnace as implementation of AGVs
will cut down lot of work for operators.
Figure 32: Future VSM for furnace 5

5 RESULTS
41
The other suggestion would be to not use manual handling for moving gears to other furnaces.
The robots should handle the articles before the shot blasting and packing processes, this to
avoid loss of time and to allow processes to be more automated. The other advantage would be
less stress for operators and low gathering of inventory. The improvements are highlighted in
Figure 32, which will optimize the process flow.
5.2 KAIZEN EVENTS
The two kaizen events were performed to find the root cause of the problem and removing
wastes from the processes at furnaces.
5.2.1 Kaizen event 1
Reducing the time loss and defects identified in shot blasting machine of furnace 4.
Root cause identification: The waiting line in front of the shot blasting cell was one of the
biggest concerns for Volvo GTO. However, to have different lane for shafts and to move shaft
pallets to the furnace 3 was a major concern for the operators. It was so problematic for
operators that they can’t see from other side of furnace 4 along with shaft pallets and empty
fixtures. The time to handle each pallet takes sometime up to 35 min which is very big loss
while the fastest is could be quite low as after having shaft handling tool at furnace 4 there
won’t be need to do shot blasting of shaft at furnace 3. The process layout is quite complex and
work is stressful for the operators working on furnace 4, while doing the manual handling of
pallets done before shot blasting. The waiting line and slow speed in production may cost
more, to identify the root cause and solution of the problem the lean method was utilised.
Problem statement: A lot of waiting time in front of shot blasting
Why Question Answers Evidence Solution
1 Why there is waiting time before shot blasting machine?
Shaft pallets need to be taken to furnace 3
Material gathering near furnace 3
2 Why are shaft pallets are blasted in furnace 3 not 4?
Robots don’t have tools to handle shafts/ complex layout of shot blasting
Shafts are send to furnace 3 for shot blasting
3 Why is the process time consuming?
Process layout in current state is design in a way that the pallets and the fixtures are hard to see when they are coming out
Operators ride fork lifts in small place and complex design layout to handle shaft and fixtures.
4 Why is process complex?
Its same from time of installation
Loss in waiting time
5 why process Company cannot High customer Required new
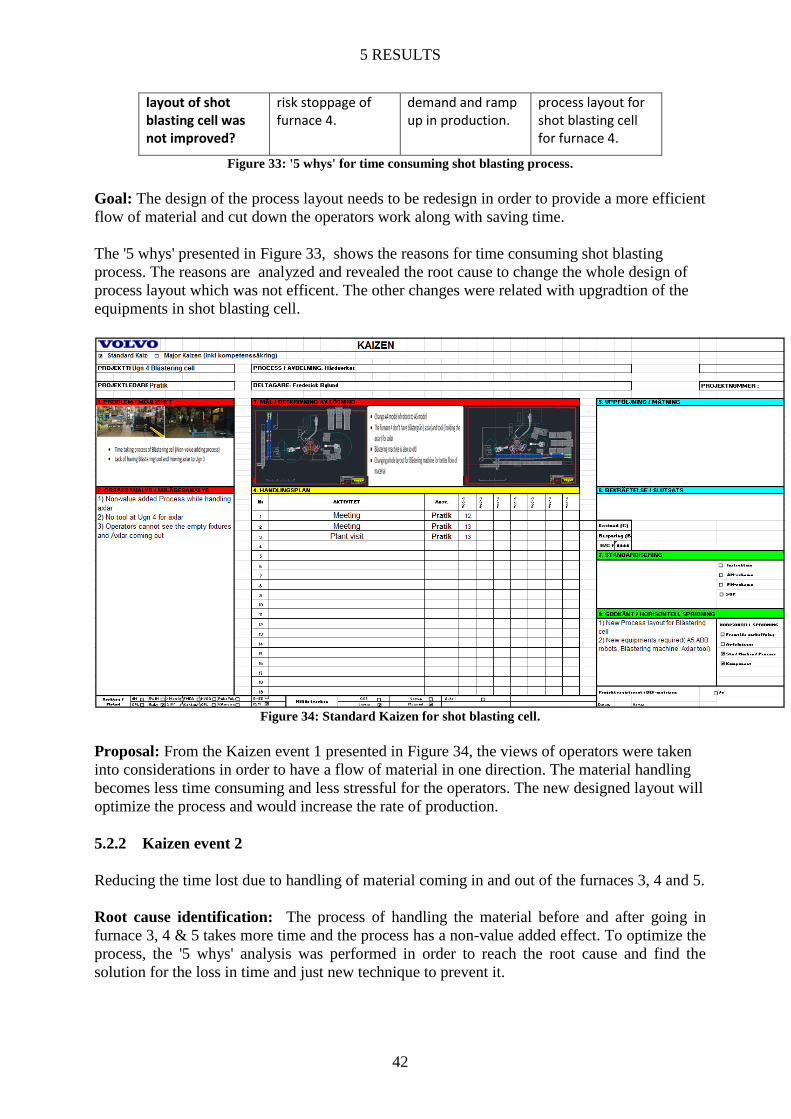
5 RESULTS
42
layout of shot blasting cell was not improved?
risk stoppage of furnace 4.
demand and ramp up in production.
process layout for shot blasting cell for furnace 4.
Figure 33: '5 whys' for time consuming shot blasting process.
Goal: The design of the process layout needs to be redesign in order to provide a more efficient
flow of material and cut down the operators work along with saving time.
The '5 whys' presented in Figure 33, shows the reasons for time consuming shot blasting
process. The reasons are analyzed and revealed the root cause to change the whole design of
process layout which was not efficent. The other changes were related with upgradtion of the
equipments in shot blasting cell.
Figure 34: Standard Kaizen for shot blasting cell.
Proposal: From the Kaizen event 1 presented in Figure 34, the views of operators were taken
into considerations in order to have a flow of material in one direction. The material handling
becomes less time consuming and less stressful for the operators. The new designed layout will
optimize the process and would increase the rate of production.
5.2.2 Kaizen event 2
Reducing the time lost due to handling of material coming in and out of the furnaces 3, 4 and 5.
Root cause identification: The process of handling the material before and after going in
furnace 3, 4 & 5 takes more time and the process has a non-value added effect. To optimize the
process, the '5 whys' analysis was performed in order to reach the root cause and find the
solution for the loss in time and just new technique to prevent it.

5 RESULTS
43
Problem statement: Handling the material coming in and going out of each furnace 3, 4 & 5.
Why Question Answers Evidence Solution
1 Why is it loss in time while handling the material in furnaces 3, 4 & 5?
There are two operators handling material and fork lifts take much time to feed material to furnaces?
Lot of time consuming handling of each pallets
2 Why does it take two operators take a lot of time?
Too many pallets , need efficient way to supply material
Inventory gathering near furnaces
3 Why does it exist a need a more need of efficient way to supply material?
To have Just-In-Time, to reduce the waiting time and reduce inventory level near furnaces
Lot of time loss in handling of incoming and outgoing of material
4 Why is JIT required?
To have efficient and optimize flow
To installed Automated Guided Vehicles
Figure 35: '5 whys' for incoming and outgoing of pallets from furnace 3, 4 & 5.
Goal: To reduce the time consuming process of handling material before and after furnace 3, 4
and 5. This is to reduce the waiting time, gathering of inventory and to provide Just-In-Time to
the operations at furnace 3, 4 and 5.
The 5 whys presented in Figure 35 shows the root cause and suggest the solution to installed
AGVs.

5 RESULTS
44
Figure 36: Stanadard Kaizen for for incoming and outgoing of pallets from furnace 3, 4 & 5.
Proposal: The AGVs are more efficient way to deliver material to production line or assembly
line. They would be more efficient along with saving time it will provide Just-in-time to
process flow. AGVs will consume less time will decrease the work load for operators and there
would be no need of trucks to run as lifting each pallet every time which takes lot of time and
slow down the process. AGVs are proposed for a more efficient incoming and outgoing of
pallets from furnace 3, 4 & 5. The Kaizen event is presented in Figure 36.
5.3 DISCRETE EVENT SIMULATION RESULTS
The DES model was developed to identify the transportation time for handling material in
furnace 4. To show the difference in production level between current state and future state the
use of ExtendSim simulation tool was made.
5.3.1 Simulation assumptions
Some assumptions have been made in demand to execute ExtendSim simulation results to
simplify simulation model.
It is always two operators working at furnace 4 and two robots (automated stations) in
all processes. While the future Discrete Event Simulation (DES) had one operator
working at furnace 4 and implementation of AGVs for material feeding.
Material is picked as per instruction of production schedule, so it works according pull
production.
The transportation distance in front of shot blasting process was cut down from 20
meters (current state) to 2 meters (future state).
Three articles go into production, as per the demand of the customer per day.
Material is delivered to the automated robots, through transportation facilities.
There are several range of pallets queue in front of each station , 15 pallets in front of
pre- washing, 1 in front of pre- heating, 0 in front of furnace, 1 in front of oil
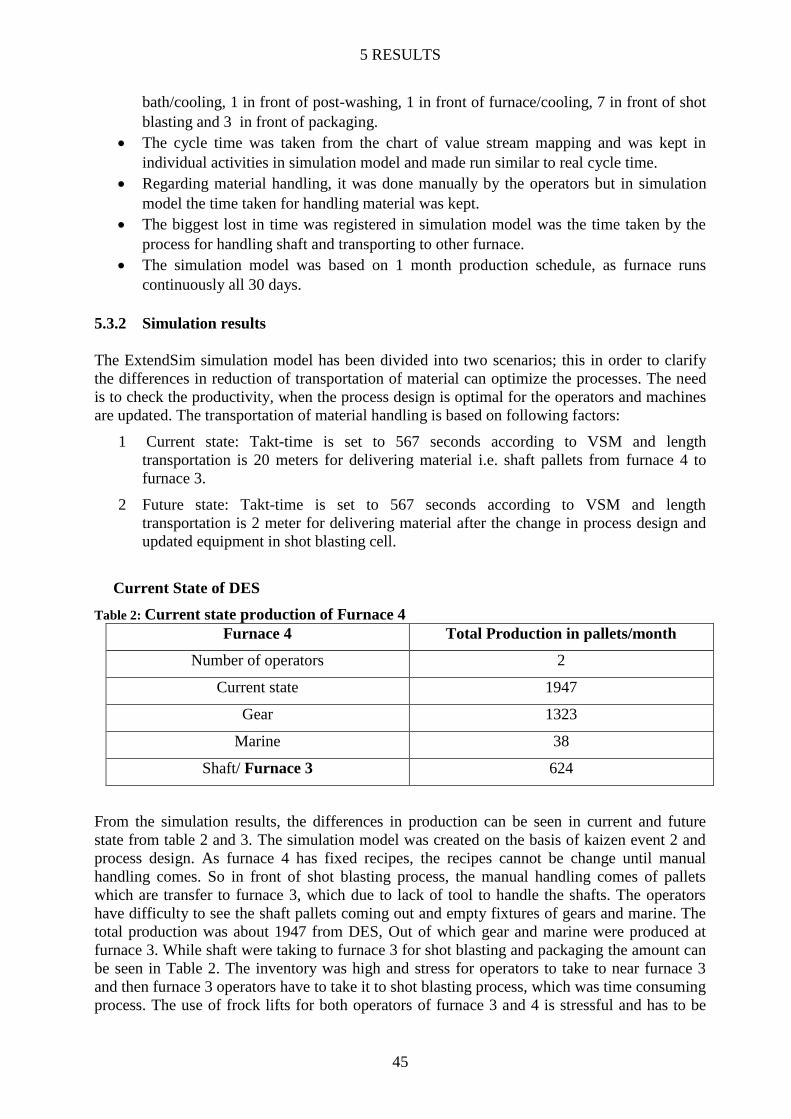
5 RESULTS
45
bath/cooling, 1 in front of post-washing, 1 in front of furnace/cooling, 7 in front of shot
blasting and 3 in front of packaging.
The cycle time was taken from the chart of value stream mapping and was kept in
individual activities in simulation model and made run similar to real cycle time.
Regarding material handling, it was done manually by the operators but in simulation
model the time taken for handling material was kept.
The biggest lost in time was registered in simulation model was the time taken by the
process for handling shaft and transporting to other furnace.
The simulation model was based on 1 month production schedule, as furnace runs
continuously all 30 days.
5.3.2 Simulation results
The ExtendSim simulation model has been divided into two scenarios; this in order to clarify
the differences in reduction of transportation of material can optimize the processes. The need
is to check the productivity, when the process design is optimal for the operators and machines
are updated. The transportation of material handling is based on following factors:
1 Current state: Takt-time is set to 567 seconds according to VSM and length
transportation is 20 meters for delivering material i.e. shaft pallets from furnace 4 to
furnace 3.
2 Future state: Takt-time is set to 567 seconds according to VSM and length
transportation is 2 meter for delivering material after the change in process design and
updated equipment in shot blasting cell.
Current State of DES
Table 2: Current state production of Furnace 4
Furnace 4 Total Production in pallets/month
Number of operators 2
Current state 1947
Gear 1323
Marine 38
Shaft/ Furnace 3 624
From the simulation results, the differences in production can be seen in current and future
state from table 2 and 3. The simulation model was created on the basis of kaizen event 2 and
process design. As furnace 4 has fixed recipes, the recipes cannot be change until manual
handling comes. So in front of shot blasting process, the manual handling comes of pallets
which are transfer to furnace 3, which due to lack of tool to handle the shafts. The operators
have difficulty to see the shaft pallets coming out and empty fixtures of gears and marine. The
total production was about 1947 from DES, Out of which gear and marine were produced at
furnace 3. While shaft were taking to furnace 3 for shot blasting and packaging the amount can
be seen in Table 2. The inventory was high and stress for operators to take to near furnace 3
and then furnace 3 operators have to take it to shot blasting process, which was time consuming
process. The use of frock lifts for both operators of furnace 3 and 4 is stressful and has to be

5 RESULTS
46
careful with traffics. So to have efficient process flow near blasting cell of furnace 4, the design
layout was made as suggestion for Volvo Group Trucks Operations (GTO) and was
implemented in future DES.
Future State of DES
Table 3: Future state production of Furnace 4
Furnace 4 Total Production in pallets/month
Number of operators 1
Future state 2210
Gear 1394
Marine 63
Shaft 753
In future state, the implementations of AGVs were made in DES model and one operator
was used. After the redesigning of the process layout for the shot blasting cell at furnace 4,
the transportation distance of shafts pallets turn from 20 meters to 2 meters. Therefore, the
information about the process was taken from VSM and simulation model was formed to
check the impact of process optimization and it shows the rise of approximately 8 % in
production in future state of DES model seen Table 3. In current state of simulation model
the production was approximately 1947 pallets and in future state the production growth was
approximately 2210. It will also be less stressful for the operators and they would be having
enough time, this is a big benefit of having updated shot blasting cell. The biggest advantage
after installation of AGVs is that there could be a 50% reduction in use of operators.
5.4 MULTIPRODUCTION ISSUE
The difficulty faced in heat treatment plant by Volvo GTO was about flexible manufacturing of
gear and shaft. There are in total 6 furnaces in the heat treatment plant, the task was to look into
three (furnaces 3, 4 & 5) of these furnaces. This three furnaces deal with the production of
shafts, gears and marine. Furnace three deal with shafts only, furnace four deal with shafts,
gears and marine, and furnace 5 deals with gears and marine.
The process in glance was applied before going through other lean activities. To investigate
the problem of multiproduction at furnace 3 and 5, not being able to produce shafts and gears in
the same furnace, data and information were collected. The whole process where examined and
the reasons behind the failure were identified and analyzed. From analysis, following
departments should be checked:
1. Product development department
- Specification of the shafts
- Types of steel ( expensive or cheap)
- Grain boundary oxidation depth ( need to be <= 20Micrometer, required to look into
shaft grain boundary oxidation depth)
2. Metallurgy department/ Heat Treatment engineers
- Material investigation, shaft material can be change or not ( e.g. try to make same
recipe for shaft and gear)

5 RESULTS
47
3. Reprogramming / software department
- Recipe of furnace should be same for gear and shaft.
- Furnace 3 shown in Figure 37 have two lane should have same recipe to support gear
and shaft
- For furnace 4 shown in Figure 38 have ring furnace all three lane should work together
to have same Takt-time.
Figure 37: Push furnace(3), Volvo Group Trucks Operation, internet.
Figure 38: Ring furnace(5), Volvo Group Trucks Operation, internet.
4. Quality department
After the assessment of Product development, Metallurgy and Software department the work
come for quality department to check the shaft quality is better or not.
The other options were given to think of purchasing new furnace to avoid the low production
during maintenance or ramp up in production.
- If Volvo buys a new furnace it would have same recipe for all furnaces and it may turn
out positive.
- Batch furnace which would be flexible and the recipe can be optimizing from shaft to
gear even if the total volume varies, it won’t cost anything i.e. optimizing production
system/ saves large area also/ less inventory issue.
- Old furnace all need to run the production if quantity is less that won’t be same in batch
furnace.
The method used to solve the thesis related research questions, Kaizen events and simulation
model are solved. The results obtained from these methods will help to optimize the process

5 RESULTS
48
flow in heat treatment plant. The investigation of process will give the solution regarding
multiproduction issue.

6 ANALYSIS
49
6 ANALYSIS
In this chapter the results formed from the kaizen events, Discrete Event Simulation (DES) and
AutoCAD Mechanical are being analysed on the base of three research questions. The first
analysis to optimize the process using kaizen events to make process efficient, which will be
compared along with literature study and empirical. Second, the results from DES studies,
which support the solution formed from kaizen events and elaborate more with literature study.
Third, to make comparison with literature study and write the relevant facts, which suggest
relevant solution to resolve multiproduction issues.
6.1 Research Question 1: How lean me How VSM helps to remove non value added activities and optimize the process flow?
To sustain the position of one of the leading customer satisfaction company, Volvo Group
works on the principal of Volvo Production System (VPS) inspired by world-class
manufacturing system. It is common to see nowadays that most of the world leading companies
have their own reliable model, to be efficient in world market (Upadhye, et al., 2010). It has
been stated by Krishna Jasti & Sharma (2014) that to achieve the efficient working
environment in order to remove non-value adding activities, reducing the waiting time, reduce
the overall production lead time and for optimizing the process there should be implementation
of Lean Manufacturing System (LMS). Volvo Group Trucks Operation (GTO) keeps the idea
of working with VPS for continuous improvement, zero optimum concepts, focusing on quality
improvement and other proactive improvement approaches.
The VPS pillars are described about how the continuous improvement culture and its effect for
the betterment of environment and working staffs. Volvo GTO from the right beginning works
in the favor for the customers and takes care in their interest, it is important for them to
optimize the operational cost such as Built-In-Quality and Just-In-Time (JIT). As Liker (2004)
stated in his book, performing kaizen would help to remove non-value added activities, it goes
similar with Volvo GTO uses mainly the kaizen to find out the solution of a problem. Kaizen is
divided into two types, major kaizen and standard kaizen. Major Kaizen usually formulate big
task, while small problem are solved by using standard kaizen. The usage of kaizen is divided
into three steps; the first step is to find the root cause identification. The second step is to work
with methods like 5 whys, Machine, Man, Material and Method (4M), X Matrix, Failure Mode
Effect Analysis (FMEA), Kanban, QA matrix, Value Stream Mapping (VSM), poka yoke and
Standard Operating Procedures (SOP) which will show the root cause and suggestions which
will help to solve the issue. Third step is various scenarios or proposals which are required to
be implemented in order to resolve the matter. While problem solving, the standard kaizen was
used as a method to find solution to optimize the process for furnaces in heat treatment plant.
In addition, to find the bottlenecks in the process of the furnaces, the lean tools such as Kaizen
events was used to show where the process is losing time and optimization of process can be
done. The kaizen events were done to find the improvements in operation to bring usefulness to
the operators working. The process can lose time due to material handling, complex process
layout and changeover time of machines. It have been conveyed by Prakash & Chin (2004),
that the Work-In-Processes (WIP) keeps the collection of data regarding production and
material required, to keep the flow going on. Most of the leading companies operate one piece

6 ANALYSIS
50
flow, to avoid loss in production lead time. So the downtime and changeover time are crucial
factor when there is inconsistent process flow.
The flow diagram is used in order to have the information regarding the material flow and
people operating. On the basis of Production Flow Analysis (PFA), which support product
oriented layout, notify the loss of lead time in process and suggest the bottleneck which need to
be fixed. Therefore to reduce the flow time and having right process layout which can be
manage by Computer-Aided Design (CAD). According to Dias et al. (2014) CAD can be used
to designing the layout of any tool and even production process.
The Volvo GTO material support system consists of AGVs and trolleys for feeding of material
to the furnaces. Forklifts are used for the movements of the material within the internal part of
the company. It is stated by Johansson & Johansson (2006) that the material supply system
issues related to material feeding, material handling, transportation packaging and
manufacturing planning should be solved by communication as it contributes for more effective
material handling.
Volvo GTO required to have AGVs at all furnaces or at all production lines, to make the
process of material feeding efficient, which according to Trebilcock (2102) is adopted after
proper study and investigation Volvo used the method of kitting and cross docking for the
supply of material to furnaces in order to speed up the process and fulfill the requirement of
material when needed. The AGVs will shorten the lead delivery time (Trebilcock, 2012) and
will be efficient in utilization of labours and equipment’s (Liker, 2004). To have the best
efficient flow for the operation by using the three M’s (Muda, Muri, and Mura) together to
reduce the waste impacts to the lowest level. The JIT optimize the process along with decrease
the production lead time of the process, as AGVs will take care of material feeding for
furnaces. The advantage it will create is that there would be low inventory near furnace and it
will adopt lean implementation i.e. 5S was so easy to adopt for any company. So 5S would
have to keep furnaces to be clean and redesign the workplace. According to Buijs, et al., (2014)
the Cross-docking provides facility in reducing long transportation lead times and deliver
transport efficiencies, reduction in material handling and storage cost. Kitting is one of the best
alternatives to supply materials to the assembly line and keep the continuous flow of supplying
material to the shop floors (Caputo, et al., 2015). It will create a lot of free space near the
furnaces; an implementation of tool like 5S may be valuable and take Volvo to even more
efficient approach.
The tool for process mapping, such as VSM was performed to identify the bottlenecks and help
to optimize the processes in furnace 3. After visualising the process, it was clearly seen that
there was a lot of waiting time for each pallet incoming and outgoing from the furnace. The
other bottleneck can be seen in front of the shot blasting process i.e. the waiting is so high. The
other drawback is that the shafts were handle manually before being sent to the shot blasting
process and same is seen when shaft need to take out from the fixtures coming out of shot
blasting before packing in pallets.
The VSM was performed for furnace 4, to identify the bottlenecks and help to optimize the
process. It was clearly seen that there is lot of waiting time for each pallet for incoming and
outgoing of the material. The other bottleneck can be seen in front of the shot blasting process.
The waiting is so high and the other drawback is to take the shafts pallet to furnace 3, which is
lot of time consuming process for operators. While doing kaizen events, it was clearly visualize

6 ANALYSIS
51
that the operators were facing difficulty to see the pallets of shafts coming out and the empty
fixtures of gears and marine.
The VSM was performed to identify the bottlenecks and help to optimize the process for
furnace 5. It was clearly seen that lot of waiting time is taken by each pallet for incoming and
outgoing of the material. The other bottleneck can be seen in front of the shot blasting process.
The non-value adding process is when manual handling of gear pallets are done, which is not
required, as furnace 5 are having automated process. The usage of manual handling of gear
should be stop in order to decrease stress level for operators and avoid high inventory
gathering.
Figure 39: Results of Optimizing process in Heat Treatment Plant.
Current state: Value stream mapping and companies expectations
The current state VSM shows that the process of incoming and outgoing of material is
consuming a lot of time in handling the material for all the furnaces. While the process around
blasting cell need to be changed.
The time taken behind handling of material at each furnace in heat treatment plant for
incoming and outgoing of material for furnaces 3, 4 and 5.
The design process of shot blasting cell, which was time consuming and was not
supporting operators while working. There was a demand of changing the process and
updating the equipment’s at shot blasting cell for furnace 4.
Requirement of implementing of the robots at furnace 3 for handling shaft for shot
blasting and packaging process.
The final outcome from the kaizen events and supporting the result of first research question
are mentioned in Figure 39.
6.2 Research Question 2: How Discrete Event Simulation can provide strength to solution conveyed from lean tools?
In order to integrate VSM and simulation, the motivation was to obtain the results to optimize
the process for furnace 4. According to Kurdve & Salonen (2016), to provide improvements for
future changes VSM and DES work mutually. In this study DES is being used to contribute
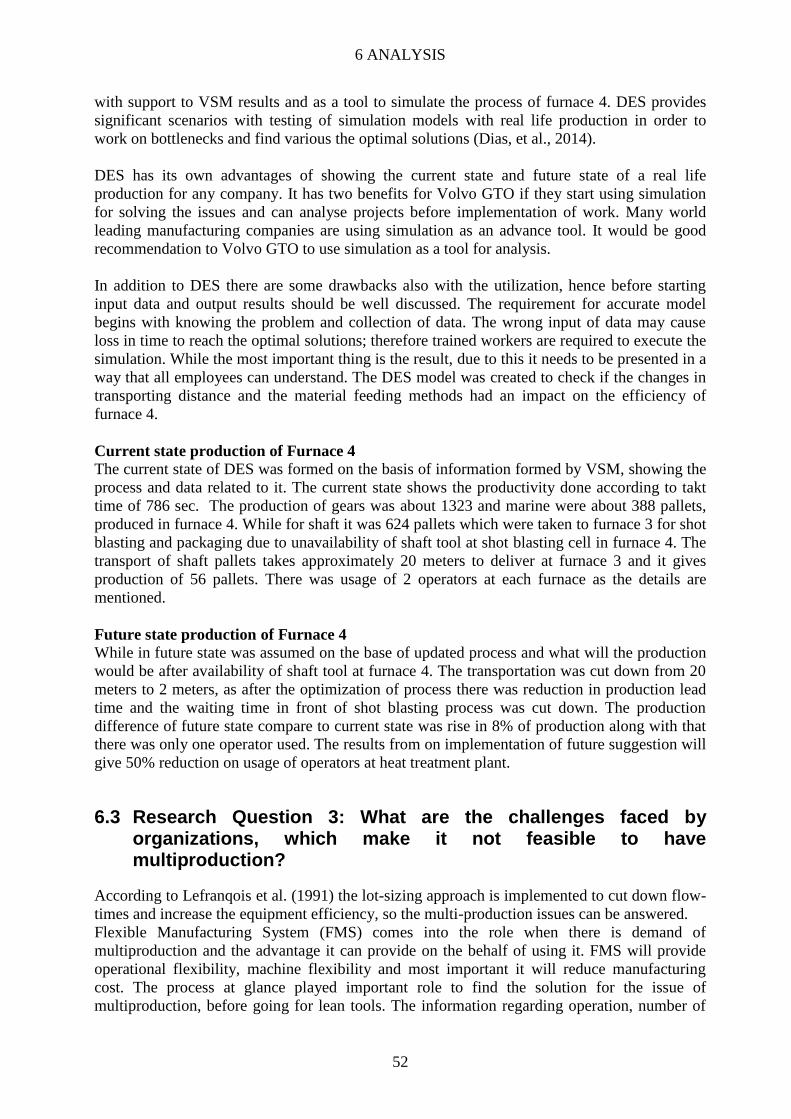
6 ANALYSIS
52
with support to VSM results and as a tool to simulate the process of furnace 4. DES provides
significant scenarios with testing of simulation models with real life production in order to
work on bottlenecks and find various the optimal solutions (Dias, et al., 2014).
DES has its own advantages of showing the current state and future state of a real life
production for any company. It has two benefits for Volvo GTO if they start using simulation
for solving the issues and can analyse projects before implementation of work. Many world
leading manufacturing companies are using simulation as an advance tool. It would be good
recommendation to Volvo GTO to use simulation as a tool for analysis.
In addition to DES there are some drawbacks also with the utilization, hence before starting
input data and output results should be well discussed. The requirement for accurate model
begins with knowing the problem and collection of data. The wrong input of data may cause
loss in time to reach the optimal solutions; therefore trained workers are required to execute the
simulation. While the most important thing is the result, due to this it needs to be presented in a
way that all employees can understand. The DES model was created to check if the changes in
transporting distance and the material feeding methods had an impact on the efficiency of
furnace 4.
Current state production of Furnace 4
The current state of DES was formed on the basis of information formed by VSM, showing the
process and data related to it. The current state shows the productivity done according to takt
time of 786 sec. The production of gears was about 1323 and marine were about 388 pallets,
produced in furnace 4. While for shaft it was 624 pallets which were taken to furnace 3 for shot
blasting and packaging due to unavailability of shaft tool at shot blasting cell in furnace 4. The
transport of shaft pallets takes approximately 20 meters to deliver at furnace 3 and it gives
production of 56 pallets. There was usage of 2 operators at each furnace as the details are
mentioned.
Future state production of Furnace 4
While in future state was assumed on the base of updated process and what will the production
would be after availability of shaft tool at furnace 4. The transportation was cut down from 20
meters to 2 meters, as after the optimization of process there was reduction in production lead
time and the waiting time in front of shot blasting process was cut down. The production
difference of future state compare to current state was rise in 8% of production along with that
there was only one operator used. The results from on implementation of future suggestion will
give 50% reduction on usage of operators at heat treatment plant.
6.3 Research Question 3: What are the challenges faced by organizations, which make it not feasible to have multiproduction?
According to Lefranqois et al. (1991) the lot-sizing approach is implemented to cut down flow-
times and increase the equipment efficiency, so the multi-production issues can be answered.
Flexible Manufacturing System (FMS) comes into the role when there is demand of
multiproduction and the advantage it can provide on the behalf of using it. FMS will provide
operational flexibility, machine flexibility and most important it will reduce manufacturing
cost. The process at glance played important role to find the solution for the issue of
multiproduction, before going for lean tools. The information regarding operation, number of

6 ANALYSIS
53
operators, cycle time, material description and quality need to be checked during process at
glance (Chen, et al., 2010).
Volvo GTO also wants to make flexible manufacturing for their furnace 3 and 5, where
production of gear and shaft both can be down. Maintenance and Total Production
Maintenance (TPM) are planned in order to increase the capacity of equipment and raise the
OEE of machine in order to make available for more production. Multiproduction can help
Volvo GTO to have flexibilities at furnace along with utilizing the machine up to its extreme
level. When TPM comes for furnace 4, where production of gear and shaft both are possible
may cause loss in production for Volvo as furnace 3 and 5 cannot do multiproduction. So it is
determine the multi-product procedures and the common alterations of Constant Work-In-
Process (CONWIP) machine required to pass through the procedure to produce.
Multiproduction may cause lot of production planning for Volvo, as variety of products are
manufactured at the same time and inventory need to be managed. But from the investigation it
was found out that the materials of shafts and gear are different in order to accept by the
furnace to specific quality of product according to the customer demand. It was not a problem
which was affecting flexible manufacturing system but the furnace was not giving the required
quality to the product produce.
Current state: Multiproduction issues and companies expectations
The investigation was made to find the solution for the research question and the solution was
made to look into specification of shaft, type of material used for making the shaft, types of
steel, type material used for making gears. The reprogramming of the recipe of the gears and
shafts combine, for furnace 3 and 5. After doing process, the quality check should be done in
order to pass the quality of product coming out of furnace 3 and 5.
Volvo will try to investigate right from the beginning of material selection of shaft and gear,
which will take time but along with that they are planning to have another furnace to resolve
the issue of multiproduction.
The analysis made for the entire three research question made on the basis of literature review
and empirical findings. The thoughts about the researchers and the solution obtained from
results, would lead to good understanding. The analyses would help to reach right conclusions,
which is good for the report and the company as well.

7 CONCLUSIONS
54
7 CONCLUSIONS
The major conclusion one can see is the mutual work of lean tools and simulation combined to
defined the solution for the optimization of process (Abdulmalek & Rajgopal, 2006). Volvo
GTO is already using kaizen for finding the solution for a problem and future suggestion would
be to adopt DES. As DES will support the results from Kaizen and will show the difference in
number of results can be formed before and after changes. In order to improve performance
efficiency of machines the study are being made, to analysis the processes. While the issue of
multiproduction is very important for organizations, which need to be improved and as Chen et
al., (2010) suggests process at glance to verify the production process.
A Lean Manufacturing System can be a good support to optimize the process flow and to know
the bottlenecks that causes the delays (Upadhye, et al., 2010). The study in this thesis shows
how lean tools work in way to achieve the solution and helps to raise the efficiency of the
furnaces of heat treatment plant at Volvo Group Trucks Operations (GTO). The Kaizen events
results were formed due to the usage of Value Stream Mapping (VSM) and 5 whys (Chen, et
al., 2010). The results were showcasing the bottlenecks where the time was lost which could be
optimize by upgrading the process. VSM can bring out the positive impact for the company’s,
as it very useful tool in term to put in practice in auto components industry to improve the
efficiency of process flow of production line (Krishna Jasti & Sharma, 2014). The VSM and 5
whys were performed for furnaces 3, 4 and 5. The first bottleneck was common in all the three
furnace of losing time while handling the material of incoming and outgoing in furnaces. The
Automated Guided Vehicles (AGVs) can be installed to have just-in-time, avoid the loss of
waiting time and have a clean shop floor with low inventory around furnaces (Trebilcock,
2012).
The second bottleneck for furnace 3 was seen during moving the shafts from the pallets to the
fixtures is a time consuming process, and to avoid this a robot should be installed to optimize
the process. The automation system benefits in optimizing the process and can deal with ramp
up in the production (Hedelind, et al., 2007). The same suggestion applies after the process;
Volvo should have a robot instead of humans moving the shafts from the fixtures to the pallets.
This should be developed in a similar way as furnace 4 and 5. Respectively for furnace 5,
should avoid the use of manual handling as they already have automated system for shot
blasting and packing. The multiproduction issues for furnace 3 and 5 need to resolve from
beginning of selection of material. The other suggestion to this issue would be that Volvo GTO
purchase new furnace which can produce both shaft and gear. The benefit would be seen during
maintenance and ramp up in production, the production level won’t decrease.
During achieving target of optimization of process for furnace 4 was bit complex and working
there required extra effort for the operators. As the fixtures comes on the other side of the shot
blasting cell, which operators cannot see the empty fixture of gears and pallets of shaft which
are send to furnace 3 for the shot blasting and packaging. There was a need to change the
process layout, to make it more effective and optimize for the betterment of the workers.
Therefore, the design is created with the support of the AutoCAD Mechanical, for designing
new process layout (Dias, et al., 2014). The second suggestion is to have ABB robots (A5
level) to hold the shafts and gears, similar like furnace 5 and to replace old shot blasting cell.
To create more value to the solution the Discrete Event Simulation model was made on the
current and future state of VSM results (Sjögren, et al., 2016). To showcase the difference the

7 CONCLUSIONS
55
model was made on the data taken from VSM, the current simulation shows the distance of 20
meters of transportation was turn to 2 meters on future suggestion from VSM. According to
current Discrete Event Simulation (DES) model, production of 1947 pallets per month was
produced with having two operators at furnace 4. While in the future state of DES, the rise of
approx. 8% production was seen along with reduction of one operator. As in future state the
change was made in distance of the transport of the shaft pallets, as it can be shot blasted and
packed after installation of new shaft tool handler. DES is very promising add-on to VSM, it’s
a simulation model which can perform and support the results from lean (McDonald, et al.,
2002). The change in process design was made and installation of AGVs from the results of
kaizen events, which ultimately optimize the process and give efficiency to furnace 4. DES
gives flexibility during forming the solution and gives scenarios for observation (Abdulmalek
& Rajgopal, 2006).
In general, the solution for non-value added activities makes easy for any manufacturing
company to make plans for the investment. The lean and DES as a tool may lead to solution,
but it difficult to observe the advantage until research for return of investment is not done.
Since the thesis just demand the solution for non-value added activities, further research should
be made by any organization regarding the cost before implanting new design or new
equipment’s.

8 FUTURE WORK RECOMMENDATION
56
8 FUTURE WORK RECOMMENDATION
The results of this thesis will provide knowledge and outcomes for Volvo Group Trucks
Operations (GTO). The objective was to optimize the process of furnace and increase its
efficiency. The adoption of following recommendations will lead to Volvo GTO expectation.
8.1 Recommendation for furnace 3
The company should installed AGVs for incoming and outgoing of material (Trebilcock,
2012). It will help with just-in-time, reduce inventory near furnaces and keep the shop floor
clean (Upadhye, et al., 2010). The usage of VSM even supports the implementation of 5S after
removing non-value added activities (Kurdve & Salonen, 2016). The reduction in work load
can make think company to reduce one operator at furnace.
The second suggestion was to reduce the process time for handling the shafts, before putting
them in the shot blasting process. Volvo GTO should work with Early Equipment Management
(EEM) to installed robots instead of operators moving the shafts from the fixtures to the pallets.
The automation in process should be developed in a similar way as furnace 4 and 5. As
automated process would reduce work level for operators and there would be reduction in
waiting time (Hedelind, et al., 2007).
The following suggestion will optimize the process and increases the efficiency of operation.
8.2 Recommendation for furnace 4
The company should install AGVs for incoming and outgoing of material for reducing the
gathering of inventory near operation process. It will help with just-in-time, reduce inventory
near furnaces and keep the shop floor clean (Upadhye, et al., 2010). From the DES model it
was seen rise in production of approximately 8% with reduction of 50% usage of operators.
Figure 40: (a) Current and (b) proposed scenerio.
The second recommendation for furnace 4 was to change the design process, which optimize
the process and it is already accepted by Volvo GTO. The CAD develop new design layout to
ease the process in organization (Dias, et al., 2014). So in Figure 40 the proposed design layout
of shot blasting cell is design using CAD tool.

8 FUTURE WORK RECOMMENDATION
57
The third suggestion for Volvo GTO is that they should work with EEM to have ABB robots
(A5 level) to hold the shafts and gears, similar like furnace 5 and to replace old shot blasting
cell.
8.3 Recommendation for furnace 5
The company should install AGVs for incoming and outgoing of material to reduce gathering
of inventory (Trebilcock, 2012). It will help with just-in-time, reduce inventory near furnaces
and keep the shop floor clean. The second suggestion was to avoid inventory and stress for
operators; manual handling should be avoided in front of shot blasting.
8.4 Recommendation on multiproduction issues of furnace 3 and 4
The suggestion for multiproduction issue would be company should purchase new furnace for
having production of shafts and gears. Generally, if the machine recipe doesn’t support the
outcome of production, appropriate machine should be utilized. If the organization wants to
have old machine and want to have multiproduction, then they should go through right
beginning of selection of material to all quality check. The procedure would consume lot of
time and it will make hard to take decision on selection of method. It is preferable to have
eligible machines to support multiproduction.

9 REFERENCES
58
9 REFERENCES
Abdulmalek, F. A. & Rajgopal, J., 2006. Analyzing the benefits of lean manufacturing and
value stream mapping via simulation: A process sector case study. International journel of
Production economics , pp. 223-236.
Ali, M. & Khan, W. u., 2010. Implementation Issues of AGVs in Flexible Manufacturing
System : A Review. Global Journal of Flexible Systems Management, 11(1), pp. 55-62.
Belekoukias, I., Garza-Reyes, J. A. & Kumar, V., 2014. The impact of lean methods and tools
on the operational performance of manufacturing organisations. International Journal of
Production Research, 52(18), pp. 5346-5366.
Buijs, P., Vis, I. F. & Carlo, H. J., 2014. Synchronization in cross-docking networks: A
research classification and framework. European Journal of Operational Research, 239(3), pp.
593-608.
Buyurgan, N., Meyyappan, L., Saygin, C. & Dagli, C. H., 2007. Real-time routing selection for
automated guided vehicles in a flexible manufacturing system. Journal of Manufacturing
Technology Management, 18(2), pp. 169-181.
Caputo, A., Pelagagge, P. & Salini, P., 2015. A model for kitting operations planning. Emerald
Group Publishing Limited , 35(1), pp. 69-80.
Chen, J., Li, Y. & Shady, B. D., 2010. From value stream mapping toward a lean/sigma
continous improvement process: an industrial case study. International Journal of Production
Research , 48(4), pp. 1069-1086.
Dias, L. M., Pereira, G. A. & Vik, P., 2014. Layout and process optimisation: using computer-
aided design (CAD) and simulation through an integrated systems design tool. Int. J.
Simulation and Process Modelling.
El-Tamimi, A. M., Abidi, M. H., Hammad, M. S. & Javed, A., 2011. Analysis of performance
measures of flexible manufacturing system. Journal of King Saud University – Engineering
Sciences, pp. 115-129.
Hameri, A.-P., 2010. Production flowanalysis—Cases frommanufacturingandserviceindustry.
Int. J.ProductionEconomics, pp. 233-241.
Hedelind, M., Jackson, M. & Funk, P., 2007. FACTORY-IN-A-BOX – SOLUTIONS FOR
AVAILABILITY AND MOBILITY OF FLEXIBLE PRODUCTION CAPACITY.
ResearchGate.
Jarebrant, C., Winkel, J., Hanse, J. J. M. ,. S. E. & Öjmertz, B., 2015. ErgoVSM: A Tool for
Integrating Value Stream Mapping and Ergonomics in Manufacturing. Research article, 26(2),
pp. 191-204.

9 REFERENCES
59
Jeong, K.-Y. & Phillips, D. T., 2011. Application of a concept development process to evaluate
process layout designs using value stream mapping and simulation. Journal of Industrial
Engineering and Management , Volume 4, pp. 206-230.
Johansson, E. & Johansson, M. I., 2004. The information gap between design engineering and
materials supply systems design. International Journal of Production Research, 42(17), pp.
3787-3801.
Johansson, E. & Johansson, M. I., 2006. Materials supply system design in product
development projects. International Journal of Operations & Production Management, 26(4),
pp. 371-393.
Kang, N., Zheng, L. & Jingshan, L., 2015. Analysis of multi-product manufacturing systems
with arbitrary processing times. International Journal of Production Research, pp. 983-1001.
Krishna Jasti, N. V. & Sharma, A., 2014. Lean manufacturing implementation using value
stream mapping as a tool : A case study from auto components industry. International Journal
of Lean Six Sigma, pp. 89-116.
Kurdve, M., 2014. DEVELOPMENT OF COLLABORATIVE GREEN LEAN
PRODUCTION SYSTEMS.
Kurdve, M. & Salonen, A., 2016. Value stream mapping used in interaction between industry
and university. ResearchGate.
Kurdve, M. et al., 2015. Waste flow mapping to improve sustainibility of waste mangement: a
case study approch. Journal of cleaner Production, pp. 304-315.
Küçükoğlu, İ. & Öztürk, N., 2016. Two-stage optimisation method for material flow and
allocation management in cross-docking networks. International Journal of Production
Research, 55(2), pp. 410-429.
Lacerda, A. P., Xambre, A. R. & Alvelos, H. M., 2016. Applying Value Stream Mapping to
eliminate waste: a case study of an original equipment manufacturer for the automotive
industry. International Journal of Production Research, pp. 1708-1720.
Lefrancois, P., Esperance, P. L. & Turmel, M., 1991. BATCHING ANNEALING
OPERATIONS TO OPTIMIZE QUEUEING TIMES AND FURNACE EFFICIENCY: A
SIMULATION MODEL. Proceedings of the 1991 Winter Simulation Conference, pp. 270-279.
Liker, J., 2004. The Toyota Way : 14 Management Principles from the World's Greatest
Manufacturer. s.l.:The McGraw-Hill Companies.
Liker, J. & Meier, D., 2006. The Toyota Way Fieldbook- A Practical Guide for Implementing
Toyota's 4Ps. s.l.:The McGraw-Hill Companies.
McDonald, T., Van Aken, E. M. & Rentes, A. F., 2002. Utilising Simulation to Enhance Value
Stream Mapping: A Manufacturing Case Application. International Journal of Logistics
Research and, pp. 213-232.
9 REFERENCES
60
Nazzal, D. & Bodner, D., 2003. A SIMULATION-BASED DESIGN FRAMEWORK FOR
AUTOMATED MATEWAL HANDLIlVC SYSTEMS IN 300MM FABRICATION
FACILITIES. Proceedings of the 2003 Winter Simulation Conference.
Prakash, J. & Chin, J. F., 2014. Comparison between production controls in multi-stage multi-
product manufacturing environments: two case studies. Production & Manufacturing
Research: An Open Access Journal, pp. 477-500.
Schmidtke, D., Heiser, U. & Hinrichsen, O., 2014. A simulation-enhanced value stream
mapping approach for optimisation of complex production environments. International Journal
of Production Research, pp. 6146-6160.
Serrano, I., Ochoa, C. & De Castro, R., 2008. Evaluation of value stream mapping in
manufacturing system redesign. International Journal of Production Research, pp. 4409-4430.
Sjögren, P., Gåsvaer, D., Widfeld, M. & Wiktorsson, M. M., 2016. Production System change
strategy in lightweight manufacturing. ScienceDirect, pp. 160-165.
Trebilcock, B., 2012. Toyota Motor Manufacturing, Kentucky: Production that's world class.
Modern Materials Handling, october , pp. 18-20.
Upadhye, N., Deshmukh, S. & Garg, S., 2010. Lean Manufacturing for Sustainable
Development. Global Business and Management Research: An International Journal, 2(1), pp.
125-137.
Upadhye, N., Deshmukh, S. G. & Garg, S., 2010. Lean manufacturing system for medium size
manufacturing enterprises: an Indian case. International Journal of Management Science and
Engineering Management, pp. 362-375.
Wang, Q. & Wu, Z., 2010. Optimization Study on the Supply Chain based on Value Stream
Analysis. IEEE.

10 APPENDICES 10.1 Questions for Volvo GTO
61
10 APPENDICES
10.1 Questions for Volvo GTO
Volvo GTO (Manufacturing, Material handling & Simulation)
1) What are the manufacturing strategies of Volvo GTO?
2) How the material handling is done in heat treatment plant?
3) Is the furnaces is utilized up to its full capacity? If not why?
4) Which articles goes into production for furnaces 3, 4 & 5?
5) Why Volvo wants to produce shaft and gear both in furnaces 3 and 5?
6) For current situation, what is the reason Volvo facing in heat treatment plant that they cannot
mix the shaft and gear production in furnaces 3 and 5?
7) Is the required production of gear and shafts are low?
8) Is Volvo facing issue related to production ramp up?
9) Is Volvo facing issues related to material handling?
10) Can the recipe be made for furnace 3 and 4, that gear and shaft can be used simultaneously?
11) If not, Should Volvo change the old furnaces to increase the production?
12) Does Volvo use Simulation for heat treatment plant?
13) How many times the shutdown does take place?

10 APPENDICES 10.2 Fixtures
62
10.2 Fixtures
Fixtures are used for handling shafts, gears and marines, before sending to shot blasting
process.

10 APPENDICES 10.3 Pallets coming out
63
10.3 Pallets coming out
Pallets coming out at furnace 4 after packaging of gears and marines.

10 APPENDICES 10.4 Pallets and empty fixtures
64
10.4 Pallets and empty fixtures
A place where shaft pallets and empty fixtures of gear are waiting for shot blasting at furnace 4.

10 APPENDICES 10.5 Forklifts
65
10.5 Forklifts
The forklifts are used to feed the material at furnaces.
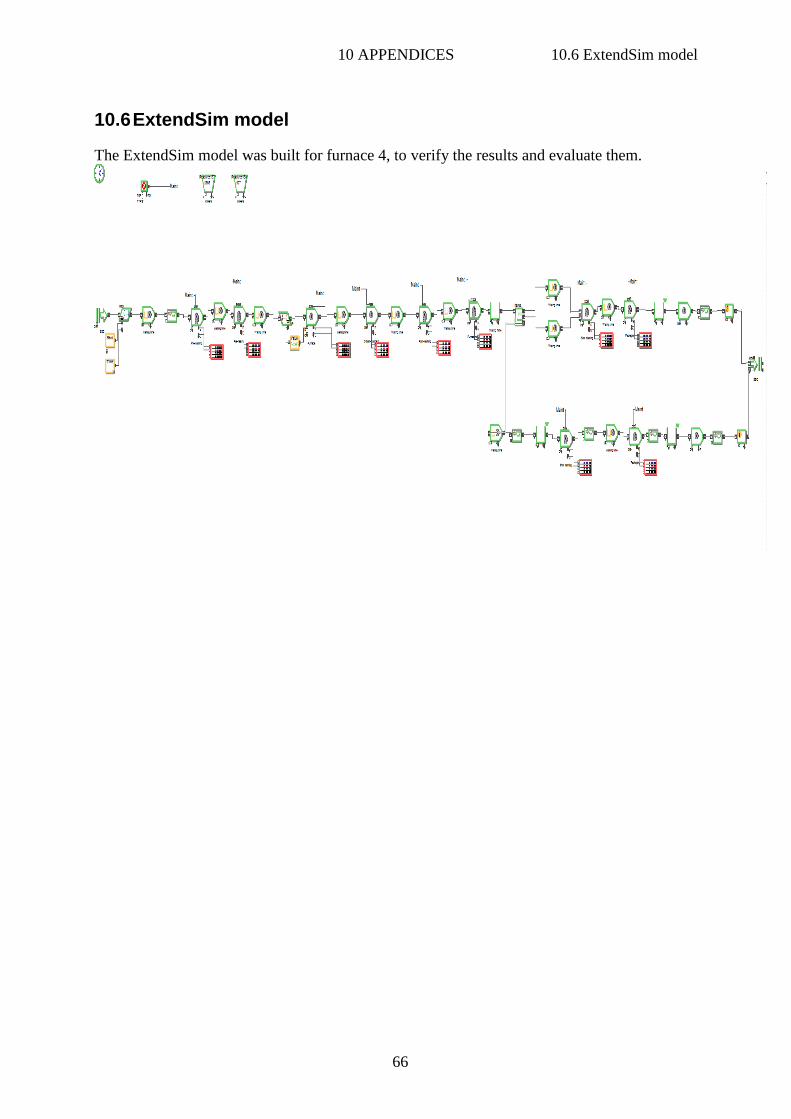
10 APPENDICES 10.6 ExtendSim model
66
10.6 ExtendSim model
The ExtendSim model was built for furnace 4, to verify the results and evaluate them.

10 APPENDICES 10.7 Shutdown Information
67
10.7 Shutdown Information
The information regarding shutdown was used in ExtendSim model to verify the results.