Optimizing the CSP Tower Air Brayton Cycle System … the CSP... · Optimizing the CSP Tower Air...
85
S O U T H W E S T R E S E A R C H I N S T I T U T E ® Optimizing the CSP Tower Air Brayton Cycle System to Meet the SunShot Objectives Final Technical Report DOE Award No. DE-EE0005805 SwRI ® Project No. 18.17842 Reporting Period Start Date: 09/01/2014 Reporting Period End Date: 11/30/2015 Prepared by Elliott Bryner, Ph.D. Klaus Brun, Ph.D. Shane Coogan C. Seth Cunningham Nathan Poerner Prepared for: U.S. Department of Energy Submitted on February 26, 2016
Transcript of Optimizing the CSP Tower Air Brayton Cycle System … the CSP... · Optimizing the CSP Tower Air...

S O U T H W E S T R E S E A R C H I N S T I T U T E®
Optimizing the CSP Tower Air Brayton Cycle System to Meet the SunShot Objectives
Final Technical Report
DOE Award No. DE-EE0005805 SwRI® Project No. 18.17842
Reporting Period Start Date: 09/01/2014 Reporting Period End Date: 11/30/2015
Prepared by
Elliott Bryner, Ph.D. Klaus Brun, Ph.D.
Shane Coogan C. Seth Cunningham
Nathan Poerner
Prepared for:
U.S. Department of Energy
Submitted on
February 26, 2016

SOUTHWEST RESEARCH INSTITUTE® 6220 Culebra Road
San Antonio, Texas 78238
Optimizing the CSP Tower Air Brayton Cycle System to Meet the SunShot Objectives
Final Technical Report
DOE Award No. DE-EE0005805 SwRI® Project No. 18.17842
Reporting Period Start Date: 09/01/2014 Reporting Period End Date: 11/30/2015
Prepared by
Elliott Bryner, Ph.D. Klaus Brun, Ph.D.
Shane Coogan C. Seth Cunningham
Nathan Poerner
Prepared for:
U.S. Department of Energy
February 26, 2016
Approved:
____________________________ Edgar B. Bowles, Jr., Director Fluids & Machinery Engineering Department Mechanical Engineering Division
DE-EE0005805 Optimizing the CSP Tower Air Brayton Cycle System to Meet the SunShot Objectives
Southwest Research Institute
SwRI Project 17842 Page 3 of 85 Final Technical Report February 26, 2016
DISCLAIMER
This report was prepared as an account of work sponsored by an agency of the United States Government. Neither the United States nor any agency thereof, nor any of their employees, makes any warranty, express or implied, or assumes any legal liability or responsibility for the accuracy, completeness, or usefulness of any information, apparatus, product, or process disclosed, or represents that its use would not infringe privately owned rights. Reference herein to any specific commercial product, process, or service by trade name, trademark, manufacturer, or otherwise does not necessarily constitute or imply its endorsement, recommendation, or favoring by the United States Government or any agency thereof. The views and opinions of authors expressed herein do not necessarily state or reflect those of the United States Government or any agency thereof.

DE-EE0005805 Optimizing the CSP Tower Air Brayton Cycle System to Meet the SunShot Objectives
Southwest Research Institute
SwRI Project 17842 Page 4 of 85 Final Technical Report February 26, 2016
EXECUTIVE SUMMARY The objective of this project is to increase Concentrated Solar Power (CSP) tower air receiver and gas turbine temperature capabilities to 1,000ºC by the development of a novel gas turbine combustor, which can be integrated on a megawatt-scale gas turbine, such as the Solar Turbines Mercury 50™. No combustor technology currently available is compatible with the CSP application target inlet air temperature of 1,000°C.
Autoignition and flashback at this temperature prevent the use of conventional lean pre-mix injectors that are currently employed to manage NOx emissions. Additional challenges are introduced by the variability of the high-temperature heat source provided by the field of solar collectors, the heliostat in CSP plants. For optimum energy generation from the power turbine, the turbine rotor inlet temperature (TRIT) should remain constant. As a result of changing heat load provided to the solar collector from the heliostat, the amount of energy input required from the combustion system must be adjusted to compensate. A novel multi-bank lean micro-mix injector has been designed and built to address the challenges of high-temperature combustion found in CSP applications. The multi-bank arrangement of the micro-mix injector selectively injects fuel to meet the heat addition requirements to maintain constant TRIT with changing solar load.
To validate the design, operation, and performance of the multi-bank lean micro-mix injector, a novel combustion test facility has been designed and built at Southwest Research Institute® (SwRI®) in San Antonio, TX. This facility, located in the Turbomachinery Research Facility, provides in excess of two kilograms per second of compressed air at nearly eight bar pressure. A two-megawatt electric heater raises the inlet temperature to 800°C while a secondary gas-fired heater extends the operational temperature range of the facility to 1,000°C.
A combustor test rig connected to the heater has been designed and built to test the multi-bank lean micro-mix injector over the range of CSP operating conditions. The fuel is controlled and selectively delivered to the banks of the injector based on combustor inlet conditions that correspond to turbine operating points. The combustor rig is equipped with a data acquisition system and a suite of instrumentation for measuring temperature, pressure, and species concentration.
This unique test facility has been built and commissioned and a prototype of the multi-bank lean micro-mix injector design has been tested. Operation of the combustor and injector has been demonstrated over the full range of CSP inlet conditions and for the range of turbine load conditions specified. The multi-bank operation of the injector has been proven to be an effective design for managing the variable flow rates of air and fuel due to changing inlet conditions from the solar field and turbine loads.

DE-EE0005805 Optimizing the CSP Tower Air Brayton Cycle System to Meet the SunShot Objectives
Southwest Research Institute
SwRI Project 17842 Page 5 of 85 Final Technical Report February 26, 2016
TABLE OF CONTENTS 1. INTRODUCTION ...................................................................................................... 9 2. SUMMARY OF INJECTOR AND FACILITY DESIGN ........................................... 12
Task 1.1 Combustor Concept Review ........................................................... 12 2.1 Task 1.2 Definition of Operating Range Requirements, ................................ 13 2.2 Task 1.3, Combustor Design ......................................................................... 13 2.3
2.3.1 Task 1.3.1 Combustion Stability, Efficiency, and Emissions .........................14 2.3.2 Task 1.3.2 Heat Transfer Analysis ...............................................................17 2.3.3 Task 1.3.3 Combustor Acoustic Analysis .....................................................17 2.3.4 Task 1.3.4 Structural Analysis ......................................................................17 2.3.5 Task 1.3.5 Material and Coating Analysis ....................................................17 2.3.6 Task 1.3.6 Combustor and Test Facility Control System ..............................18 2.3.7 Task 1.3.7 Air Bypass Design ......................................................................18
Task 1.4 Combustor Test Facility Design...................................................... 18 2.4 Task 1.5 Technology Commercialization and Product Development 2.5
Path .............................................................................................................. 18 3. COMBUSTOR AND TEST FACILITY .................................................................... 19
Task 2.1 Combustor Fabrication ................................................................... 19 3.13.1.1 Combustor Case ..........................................................................................19 3.1.2 Refractory Liner ...........................................................................................24 3.1.3 Exhaust Heat Shield and Cooling Air Manifold .............................................25 3.1.4 Perforated Plates .........................................................................................26 3.1.5 Injector and Fuel Lines .................................................................................27
Task 2.2 Test Facility Fabrication ................................................................. 28 3.23.2.1 Air Supply and Exhaust Piping .....................................................................28 3.2.2 Primary Heater .............................................................................................31 3.2.3 Secondary Heater ........................................................................................33 3.2.4 Fuel System .................................................................................................34 3.2.5 Combustor Case Cooling Air ........................................................................35 3.2.6 Instrumentation ............................................................................................35 3.2.7 Exhaust Quench Water ................................................................................36 3.2.8 Data Acquisition and Control System ...........................................................36
Task 3.1 Combustor Integration into Test Facility with Supply Air 3.3Control System ............................................................................................. 40 3.3.1 Temperature Range and Stability .................................................................40 3.3.2 Pressure Range and Stability .......................................................................53 3.3.3 Mass Flow Rate ...........................................................................................55
Task 3.2 Combustor No-Heat Flow Test ....................................................... 55 3.4 Task 3.3 Fuel Supply and Control System .................................................... 56 3.5 Task 3.4 Emissions Analyzers: Set-up, Calibration and Measurements ....... 57 3.6 Task 3.5 Preliminary Combustion Tests: Ignition, Fuel Sequencing and 3.7
Operation Troubleshooting............................................................................ 57 Task 3.6 Shakedown Tests: Optimization, Preliminary Emissions 3.8
Measurements .............................................................................................. 58

DE-EE0005805 Optimizing the CSP Tower Air Brayton Cycle System to Meet the SunShot Objectives
Southwest Research Institute
SwRI Project 17842 Page 6 of 85 Final Technical Report February 26, 2016
Task 3.7 Endurance and Stability Test: effect of Thermal Cycling on 3.9Liner Temperature and Emissions ................................................................ 60
Task 3.9 Commercialization Assessment ..................................................... 63 3.103.10.1 High Temperature Combustor System Design and Fabrication ....................63 3.10.2 Combustor Testing .......................................................................................63 3.10.3 New Turbine Hardware Development ..........................................................64 3.10.4 Combustor Incorporated in a Demonstation Plant ........................................64 3.10.5 Instrumentation and Controls Modification ...................................................65 3.10.6 Scaled Testing .............................................................................................65 3.10.7 Full-Size Testing ..........................................................................................65 3.10.8 Field Evaluation Plant ..................................................................................65 3.10.9 Commercialization .......................................................................................65
4. FINAL DELIVERABLES AND DISCUSSION ........................................................ 67 Functioning Combustor Design Meets Operational Requirements ............... 67 4.1 Functioning Combustor System Prototype Meets Performance and 4.2
Durability Targets .......................................................................................... 68 4.2.1 Emissions Performance ...............................................................................68 4.2.2 Durability ......................................................................................................68
Detailed Material Evaluation Reports ............................................................ 73 4.34.3.1 Inlet and Exhaust Piping ..............................................................................73 4.3.2 Primary Heater and Piping ...........................................................................73 4.3.3 Combustor Case ..........................................................................................74 4.3.4 Refractory Insert ..........................................................................................76 4.3.5 Injector .........................................................................................................77
Patents and Publications .............................................................................. 77 4.44.4.1 Patents ........................................................................................................77 4.4.2 Papers .........................................................................................................77 4.4.3 Abstracts ......................................................................................................77
5. Conclusions .......................................................................................................... 79 6. Future Work .......................................................................................................... 83
Additional Instrumentation............................................................................. 83 6.1 Facility Modifications ..................................................................................... 84 6.2 Other Work .................................................................................................... 84 6.3

DE-EE0005805 Optimizing the CSP Tower Air Brayton Cycle System to Meet the SunShot Objectives
Southwest Research Institute
SwRI Project 17842 Page 7 of 85 Final Technical Report February 26, 2016
List of Figures
Figure 1-1. Stoichiometric Autoignition Delay Time for Various Fuels at 9 atm .......... 11 Figure 2-1. Complete Combustor Design ................................................................... 13 Figure 2-2. Multi-Bank Micro-Mix Injector Assembly .................................................. 14 Figure 2-3. Temperature in the Plane of the Cross-Jet, 8-mm Hole Diameter,
L/D = 10, 600°C Inlet Air Condition (Established Flame) ......................... 14 Figure 2-4. Temperature in the Plane of the Cross-Jet, 8-mm Hole Diameter,
L/D = 10, 1,000°C Inlet Air Condition (Established Flame) ...................... 15 Figure 2-5. Temperature in the Plane of the Cross-Jet, 8-mm Hole Diameter,
L/D = 10, End of 5 ms Transition from 1,000°C to 600°C Inlet Air Condition .................................................................................................. 15
Figure 2-6. NO Mass Fraction in the Plane of the Cross-Jet, 8-mm Hole Diameter, L/D = 10, 600°C Inlet Air Condition (Established Flame) ......... 16
Figure 2-7. CO Molar Fraction Profile in the Combustion Chamber for 1,000°C Inlet Air (One Fuel Bank in Operation) ..................................................... 16
Figure 2-8. CO Molar Fraction Profile in the Combustion Chamber for 600°C Inlet Air (All Fuel Banks in Operation) ...................................................... 17
Figure 3-1. Combustor Casing Overview ................................................................... 20 Figure 3-2. Spin-Cast Casings Before Final Machining .............................................. 20 Figure 3-3. Surface Defect in the Exhaust Reducer Housing ..................................... 21 Figure 3-4. Weld Repair of Exhaust Reducer Housing Defect ................................... 21 Figure 3-5. Exhaust Reducer Housing after Electron Beam Weld, before Final
Machining ................................................................................................ 22 Figure 3-6. Combustor Housings after Final Machining ............................................. 23 Figure 3-7. Inconel 625 Inlet Pipe and Blind Flange .................................................. 24 Figure 3-8. Refractory Liner Details ........................................................................... 25 Figure 3-9. Exhaust Heat Shield and Cooling Air Manifold ........................................ 26 Figure 3-10. Injector Manifold – Post Water Jet ........................................................... 27 Figure 3-11. Installed Fuel Lines .................................................................................. 28 Figure 3-12. Dresser Rand Research Compressor ...................................................... 29 Figure 3-13. Combustor Facility Inlet and Exhaust Piping ............................................ 30 Figure 3-14. Rotork Four Inch Diameter Back-Pressure Control Valve ........................ 30 Figure 3-15. Primary Heater Prior to Installation .......................................................... 31 Figure 3-16. Primary Heater after Installation .............................................................. 32 Figure 3-17. Combustor Layout with Primary Heater Infrastructure ............................. 32 Figure 3-18. Secondary Heater .................................................................................... 33 Figure 3-19. Fuel Panel ................................................................................................ 34 Figure 3-20. Control & DAQ System Layout ................................................................ 37 Figure 3-21. Main Compressor Loop Control Screen ................................................... 38 Figure 3-22. Primary Combustor Control Screen ......................................................... 39 Figure 3-23. Primary Heater Sub-Screen ..................................................................... 39 Figure 3-24. Main Case Sub-Screen ............................................................................ 40 Figure 3-25. High-Voltage Step-Down Transformer ..................................................... 41

DE-EE0005805 Optimizing the CSP Tower Air Brayton Cycle System to Meet the SunShot Objectives
Southwest Research Institute
SwRI Project 17842 Page 8 of 85 Final Technical Report February 26, 2016
Figure 3-26. Combustor Integration Test Results ........................................................ 42 Figure 3-27. Stability of Mass Flow Rate and Inlet Temperature ................................. 43 Figure 3-28. Heater and Combustor Inlet Temperature ............................................... 46 Figure 3-29. Detailed View of Heater Outlet and Combustor Inlet Temperatures ........ 47 Figure 3-30. Primary Heater Ceramic Refractory Insert ............................................... 48 Figure 3-31. Combustor Inlet Temperature after Heater Insert .................................... 49 Figure 3-32. Detail of Primary Heater and Combustor Inlet Temperatures .................. 50 Figure 3-33. Combustor Rig Inlet Temperatures with Secondary Heater
Operation ................................................................................................. 51 Figure 3-34. Detail of Heater and Combustor Inlet Temperatures (900°C) .................. 52 Figure 3-35. Detail of Heater and Combustor Inlet Temperatures (950°C) .................. 52 Figure 3-36. Detail of Heater and Combustor Inlet Temperatures (1,000°C) ............... 53 Figure 3-37. Pressure Distribution through Combustor ................................................ 54 Figure 3-38. Mass Flow Rate through the Combustor Test Facility ............................. 55 Figure 3-39. No-Heat Flow Testing in the Combustor Test Facility .............................. 56 Figure 3-40. Preliminary Combustion Test Results ...................................................... 58 Figure 3-41. Combustor Shakedown Testing Results .................................................. 59 Figure 3-42. Detail of Combustor Shakedown Testing Data (Left Side Figure
3-41) ........................................................................................................ 59 Figure 3-43. Detail of Combustor Shakedown Testing Data (Right Side Figure
3-41) ........................................................................................................ 60 Figure 3-44. Combustor Endurance and Stability Test Results (Max. Inlet Temp
950°C)...................................................................................................... 61 Figure 3-45. Combustor Endurance and Stability Test Results (Max. Inlet Temp
1,000°C)................................................................................................... 61 Figure 3-46. Combustor Operation during Injector Damage ........................................ 62 Figure 3-47. NOx measurements at full turbine load conditions ................................... 63 Figure 3-48. New Turbine Hardware ............................................................................ 64 Figure 4-1. Fully Functional Combustor Test Facility ................................................. 68 Figure 4-2. Leakage Path around Injector Pegs ......................................................... 70 Figure 4-3. Evidence of Combustion on the Upstream Side of the Injector ................ 71 Figure 4-4. Downstream Face of the Injector after Conclusion of Testing .................. 72 Figure 4-5. Combustor Housing with Moderate Discoloration .................................... 75 Figure 4-6. Hot Spot on the Combustor Case Due to Combustion Gases
Ingested in Cooling Passage ................................................................... 76 Figure 5-1. Conceptual Model of Injector made using Additive Manufacturing .......... 81
List of Tables
Table 3-1. Maximum Pressure and Pressure Differences in Combustor Facility ...... 55

DE-EE0005805 Optimizing the CSP Tower Air Brayton Cycle System to Meet the SunShot Objectives
Southwest Research Institute
SwRI Project 17842 Page 9 of 85 Final Technical Report February 26, 2016
1. INTRODUCTION
The objective of the project is to enable the increase of CSP tower air receiver temperatures to 1,000ºC by the development of novel combustor injector architecture for use with a modern industrial gas turbine, such as a Solar Turbines Incorporated Mercury 50. The solar receiver target temperature of 1,000ºC of this project significantly exceeds the 650ºC combustor inlet temperatures demonstrated in the Solugas Air Brayton CSP project in Spain.
The European Commission funded the Solugas 4.5 MW CSP tower gas turbine demonstration project located near Seville, Spain. The demonstration plant began testing in May 2012 and represents the state-of-the-art in hybrid CSP turbine technology. It features next generation Abengoa Solar heliostats, a high-temperature air receiver designed by the German national aerospace research center, DLR and built by GEA Group, and a Mercury 50 gas turbine generator set supplied by Solar Turbines and Turbomach. The air receiver in this system is capable of operating at temperatures up to 800°C, while the gas turbine combustor inlet temperature is limited to 650°C. In order to meet DOE SunShot Initiative objectives, this demo plant needs to be capable of operating with a receiver temperature of 1,000°C.
No currently available combustor technology is capable of operating at this temperature. The most similar technology program, in terms of combustion physics, is the ongoing development of micro-mix injectors for hydrogen combustion. Most recently, researchers in Europe have demonstrated 10 ppm NOx hydrogen combustion, in a 200 kW-scale combustor using a micro-mix jet-in-cross-flow injector with 1,600 injection points. Hydrogen exhibits short autoignition delay times and high flame speeds at standard combustor inlet temperatures; therefore, the hydrogen application shares some of the technical challenges of this project. However, combustion with air over a high temperature range requires additional solutions not provided by hydrogen combustion technology. First, the material challenges presented by the intense solar thermal environment are not addressed in the hydrogen research programs. Second, a challenge uniquely addressed by this project is the efficient management of airflow and fuel input needs that vary with inlet air temperature fluctuations.
Some non-hydrogen combustion research programs have used inlet air temperatures similar to those required by this project. For instance, research has been performed for unpressurized industrial furnaces using highly pre-heated vitiated air up to 1,000°C. This application differs significantly from a high-pressure solar hybrid gas turbine. Low fuel consumption in the solar hybrid results in little vitiation, and moving combustion products upstream in the pressurized system would require a complex solution.
Perhaps the most active area of research for thermal management and materials for oxidizing environments operating in excess of 1,000°C is the design of high-temperature solar receivers. The materials being evaluated in those programs are important to high-temperature injector design and data from these programs is the best available reference. However, data developed for
DE-EE0005805 Optimizing the CSP Tower Air Brayton Cycle System to Meet the SunShot Objectives
Southwest Research Institute
SwRI Project 17842 Page 10 of 85 Final Technical Report February 26, 2016
receiver designs tends to focus on very thin geometries ideal for a heat exchanger. Injectors require thicker material to contain the fuel pressure, and the oxidation durability of these parts may differ from the thin materials tested to date. In addition, the injector must contend with flame temperatures in addition to the high-temperature inlet air.
The high-temperature solar hybrid combustor problem shares some combustion challenges with hydrogen-fueled systems and some thermal challenges with the solar receivers it is designed to augment. It is the overlap of the constraints imposed by these two design spaces that makes high inlet temperature combustor development a unique and demanding task.
NOx is regulated emissions that turbine manufacturers attempt to minimize, with the best systems emitting less than 10 ppm normalized to 15% O2. Current state-of-the-art industrial gas turbines use a lean pre-mix injection scheme to achieve this target. These systems create a lean mixture of fuel and air in a pre-mixing chamber upstream of the combustion chamber. The mixture is nearly homogenous by the time of ignition, which prevents locally stoichiometric regions from creating NOx-forming high temperatures. Combustor inlet temperatures of 1,000°C preclude the use of conventional premixing technology in this application due to the risk of autoignition.
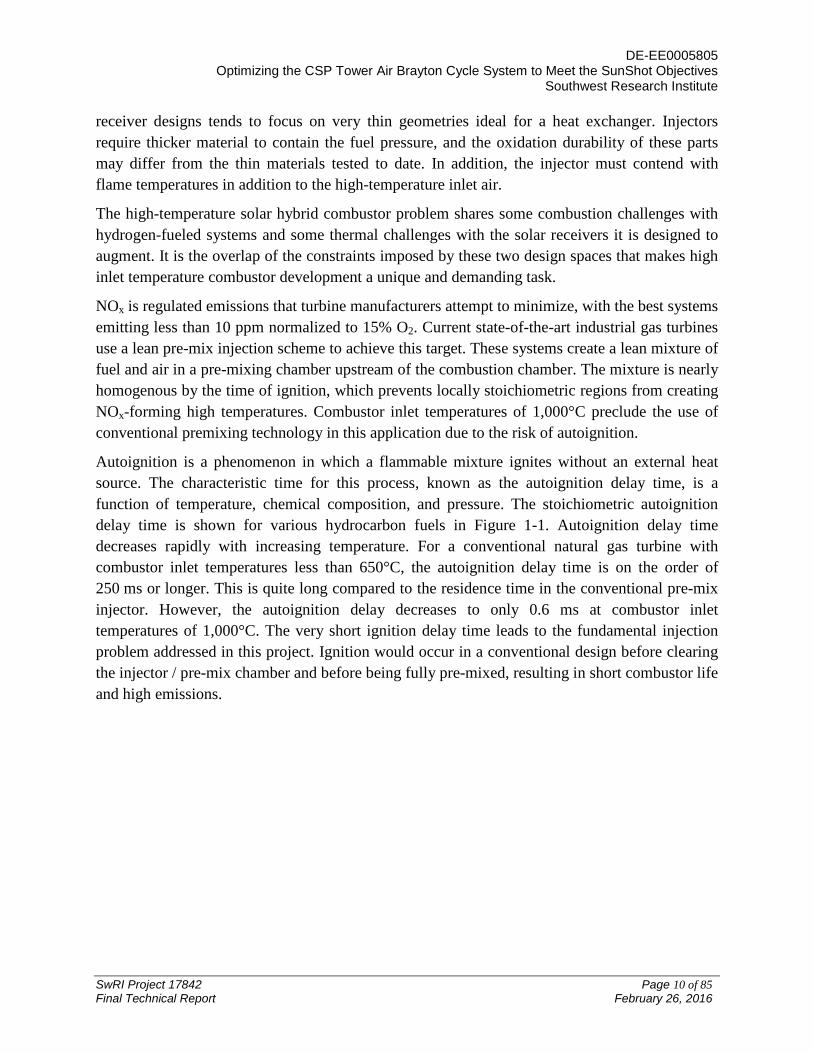
Autoignition is a phenomenon in which a flammable mixture ignites without an external heat source. The characteristic time for this process, known as the autoignition delay time, is a function of temperature, chemical composition, and pressure. The stoichiometric autoignition delay time is shown for various hydrocarbon fuels in Figure 1-1. Autoignition delay time decreases rapidly with increasing temperature. For a conventional natural gas turbine with combustor inlet temperatures less than 650°C, the autoignition delay time is on the order of 250 ms or longer. This is quite long compared to the residence time in the conventional pre-mix injector. However, the autoignition delay decreases to only 0.6 ms at combustor inlet temperatures of 1,000°C. The very short ignition delay time leads to the fundamental injection problem addressed in this project. Ignition would occur in a conventional design before clearing the injector / pre-mix chamber and before being fully pre-mixed, resulting in short combustor life and high emissions.

DE-EE0005805 Optimizing the CSP Tower Air Brayton Cycle System to Meet the SunShot Objectives
Southwest Research Institute
SwRI Project 17842 Page 11 of 85 Final Technical Report February 26, 2016
Figure 1-1. Stoichiometric Autoignition Delay Time for Various Fuels at 9 atm
The innovation of this project is the development of a combustor capable of achieving low emissions, efficient operation based on changing solar conditions, minimum possible heat loss through the combustor walls, and structural integrity at 1,000°C for the desired 30,000 hour component life.
This innovative combustor design was completed in the previous phases of this project. The work of the current phase and subject of this report encompasses fabrication of the injector, addressing the design challenges described above, and construction of a high-temperature test facility in which operation of the injector prototype can be demonstrated. This phase also includes the commissioning of the test facility, demonstrating operation over the full range of combustor inlet conditions.

DE-EE0005805 Optimizing the CSP Tower Air Brayton Cycle System to Meet the SunShot Objectives
Southwest Research Institute
SwRI Project 17842 Page 12 of 85 Final Technical Report February 26, 2016
2. SUMMARY OF INJECTOR AND FACILITY DESIGN
The primary combustor and facility design effort was performed in a previous phase of the project and is divided into five tasks.
• Task 1.1: Combustor concept review
• Task 1.2: Definition of operating range requirements
• Task 1.3: Combustor design
• Task 1.4: Design of combustor test stand and combustion facility modifications
• Task 1.5: Commercialization and partnering agreements plan
The scope and results of each task are summarized below.
TASK 1.1 COMBUSTOR CONCEPT REVIEW 2.1This task identified the best concept that met the technical demands of the project while also being compatible with the Mercury 50™ gas turbine. Matrix decision analysis was used to select an injector and liner capable of achieving the project objectives. The following configuration was selected:
• Single can extensible to can-annular or multi-can: To simplify development, a single can was selected at the 0.6 MW scale (1/8th Mercury 50™ scale). This design may be scaled to production systems through a can-annular or multi-can approach.
• Multi-bank lean micro-mix injector: A showerhead injector with many small jet-in-cross-flow mixing passages was selected to reduce the mixing length scale and achieve uniform lean pre-mix behavior before autoignition and without flashback. The injection ports are divided into multiple banks to achieve airflow management without the need for a high temperature valve. Additional information on the design is provided in the discussion of Task 1.3.
• Refractory lined pressure vessel: Thick-walled cast refractory elements were selected to protect the chamber wall from the hot inlet air, combustion, and exhaust gases. This approach is favored over the film and transpiration cooled liner technologies used in conventional gas turbines due to the lack of lower temperature bypass air.
Solar receiver integration issues were also addressed in Task 1.1. DLR studied existing and future receiver technologies and analyzed solar transients that would affect the temperature of air entering the combustor. The worst case was identified as an emergency defocus event, where all elements of the heliostat are rapidly directed away from the receiver. Simulations showed that receiver outlet temperature transients are very slow when compared to combustor time scales. Coupling with the receiver does not pose the limiting design challenge; rather the much sharper transients driven by fuel throttling define the extreme operation requirements.
DE-EE0005805 Optimizing the CSP Tower Air Brayton Cycle System to Meet the SunShot Objectives
Southwest Research Institute
SwRI Project 17842 Page 13 of 85 Final Technical Report February 26, 2016
TASK 1.2 DEFINITION OF OPERATING RANGE REQUIREMENTS, 2.2
This task defined the required definition of pressures, temperatures, and loads for integration with the Mercury 50™ gas turbine. Requirements for steady-state combustor operation were defined based on communication with Solar Turbines.
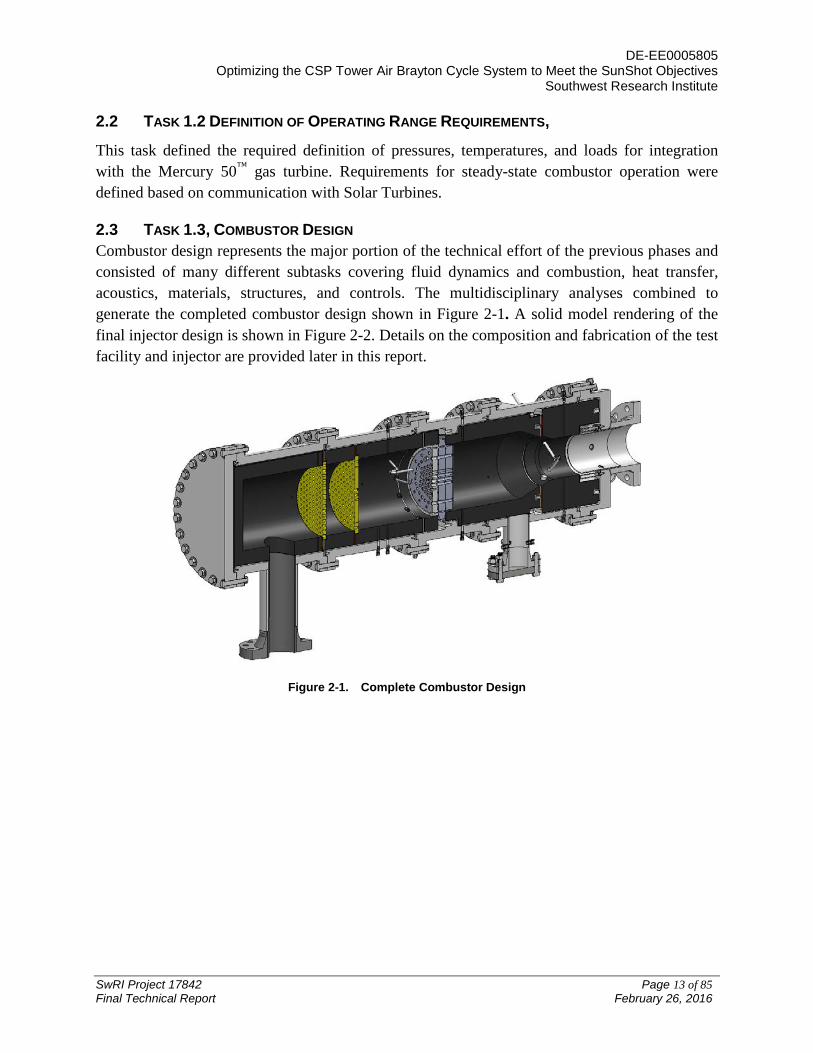
TASK 1.3, COMBUSTOR DESIGN 2.3Combustor design represents the major portion of the technical effort of the previous phases and consisted of many different subtasks covering fluid dynamics and combustion, heat transfer, acoustics, materials, structures, and controls. The multidisciplinary analyses combined to generate the completed combustor design shown in Figure 2-1. A solid model rendering of the final injector design is shown in Figure 2-2. Details on the composition and fabrication of the test facility and injector are provided later in this report.
Figure 2-1. Complete Combustor Design
DE-EE0005805 Optimizing the CSP Tower Air Brayton Cycle System to Meet the SunShot Objectives
Southwest Research Institute
SwRI Project 17842 Page 14 of 85 Final Technical Report February 26, 2016
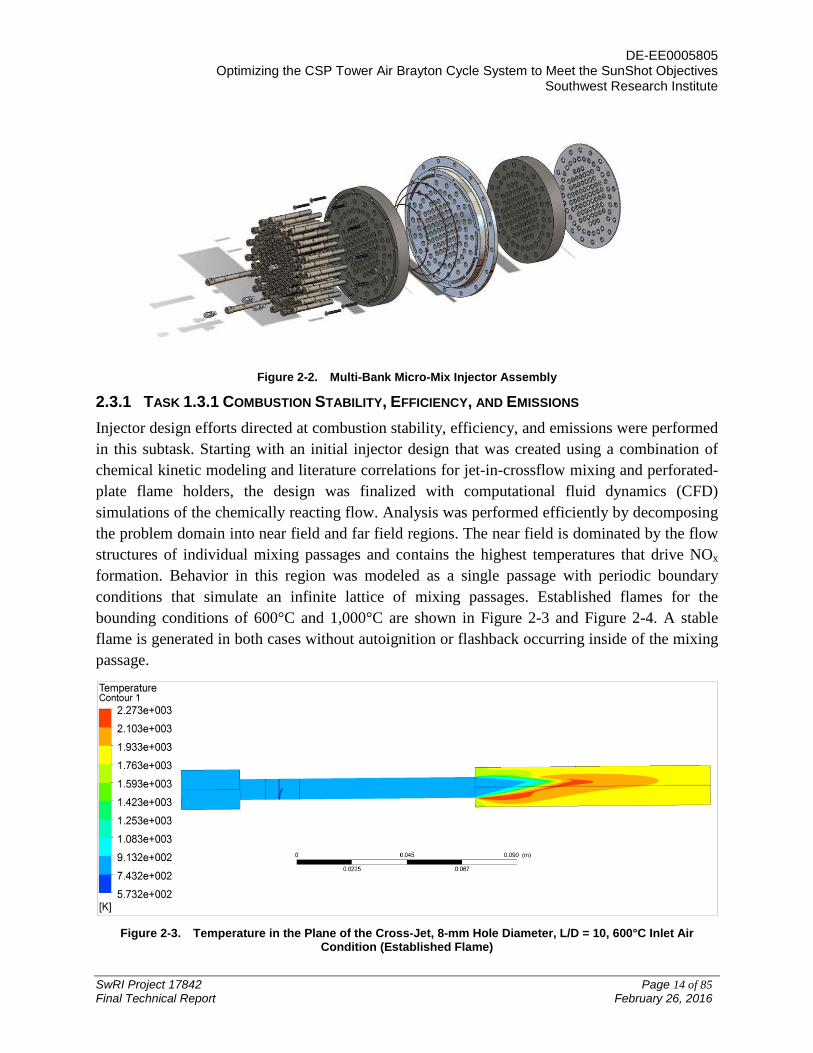
Figure 2-2. Multi-Bank Micro-Mix Injector Assembly
2.3.1 TASK 1.3.1 COMBUSTION STABILITY, EFFICIENCY, AND EMISSIONS Injector design efforts directed at combustion stability, efficiency, and emissions were performed in this subtask. Starting with an initial injector design that was created using a combination of chemical kinetic modeling and literature correlations for jet-in-crossflow mixing and perforated-plate flame holders, the design was finalized with computational fluid dynamics (CFD) simulations of the chemically reacting flow. Analysis was performed efficiently by decomposing the problem domain into near field and far field regions. The near field is dominated by the flow structures of individual mixing passages and contains the highest temperatures that drive NOx formation. Behavior in this region was modeled as a single passage with periodic boundary conditions that simulate an infinite lattice of mixing passages. Established flames for the bounding conditions of 600°C and 1,000°C are shown in Figure 2-3 and Figure 2-4. A stable flame is generated in both cases without autoignition or flashback occurring inside of the mixing passage.
Figure 2-3. Temperature in the Plane of the Cross-Jet, 8-mm Hole Diameter, L/D = 10, 600°C Inlet Air
Condition (Established Flame)

DE-EE0005805 Optimizing the CSP Tower Air Brayton Cycle System to Meet the SunShot Objectives
Southwest Research Institute
SwRI Project 17842 Page 15 of 85 Final Technical Report February 26, 2016
Figure 2-4. Temperature in the Plane of the Cross-Jet, 8-mm Hole Diameter, L/D = 10, 1,000°C Inlet Air
Condition (Established Flame)
The combustor was designed to be resilient to inlet temperature disruptions caused by transient variations in heat load from the solar collector. A transient analysis was performed starting with an established flame at the 1,000ºC inlet condition and then reducing the inlet temperature to 600ºC over a 5 ms interval. The fuel input was simultaneously increased to match the temperature change. A transient model covering 5 ms was selected to match the response time of the fuel control valves. This length of transient model time allows for solution convergence in a reasonable amount of computing time while capturing the important physics of flame behavior on the scale of response time of the fuel control valves. Demonstrating the ability of the combustor to maintain stable operation at this rate shows that the injector is also stable at the slower rate of solar transients. The temperature profile at the end of the transient is shown in Figure 2-5. The flame structure remains basically unchanged indicating that the combustor is not expected to be the limiting factor in solar transient events.
Figure 2-5. Temperature in the Plane of the Cross-Jet, 8-mm Hole Diameter, L/D = 10, End of 5 ms Transition from 1,000°C to 600°C Inlet Air Condition
NOx emissions were estimated in the CFD using the Zeldovich and prompt formation mechanisms and are predicted to be 1 ppm @ 15% O2 as shown in Figure 2-6. However, the

DE-EE0005805 Optimizing the CSP Tower Air Brayton Cycle System to Meet the SunShot Objectives
Southwest Research Institute
SwRI Project 17842 Page 16 of 85 Final Technical Report February 26, 2016
nitrous oxide pathway that was not considered in the CFD can become significant under low temperature conditions. A literature review found that 40%-90% of the total NOx is generated by this pathway in lean premixed systems. The total NOx was, therefore, estimated by multiplying the Zeldovich and prompt estimates accordingly. This gives a total NOx estimate of 9 ppm, below the project design objective of 10 ppm.
Figure 2-6. NO Mass Fraction in the Plane of the Cross-Jet, 8-mm Hole Diameter, L/D = 10, 600°C Inlet Air
Condition (Established Flame)
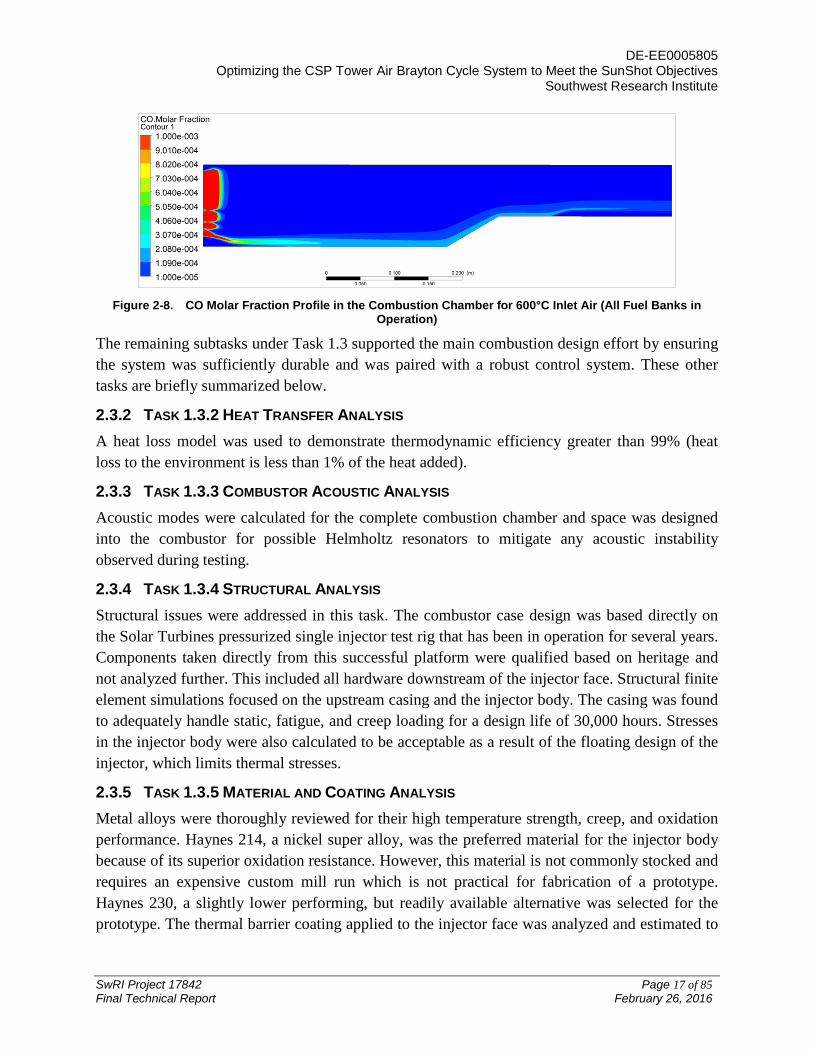
CO emissions are calculated to be below 10 ppm for the vast majority of the operating range but increase to 30 ppm for 600°C operation. A durable structural solution could not be obtained for a traditional liner with cooling air at 600°C to 1,000°C. The intended purpose for this liner is to separate the air not needed in combustion for any inlet temperature condition from the air sent into the injector mixing passages. This part was eliminated to solve the structural problem based on the expectation that the high inlet temperature and injector arrangement would facilitate adequate CO oxidation. This was confirmed for inlet temperatures over the range 733°C - 1,000°C (Figure 2-7). However, at 600°C the entrainment and quenching action of the unreacted air is strong enough to elevate the output emissions, as shown in Figure 2-8. This is not viewed as detrimental to the design considering the small portion of the operating range affected.
Figure 2-7. CO Molar Fraction Profile in the Combustion Chamber for 1,000°C Inlet Air (One Fuel Bank in
Operation)
DE-EE0005805 Optimizing the CSP Tower Air Brayton Cycle System to Meet the SunShot Objectives
Southwest Research Institute
SwRI Project 17842 Page 17 of 85 Final Technical Report February 26, 2016
Figure 2-8. CO Molar Fraction Profile in the Combustion Chamber for 600°C Inlet Air (All Fuel Banks in
Operation)
The remaining subtasks under Task 1.3 supported the main combustion design effort by ensuring the system was sufficiently durable and was paired with a robust control system. These other tasks are briefly summarized below.
2.3.2 TASK 1.3.2 HEAT TRANSFER ANALYSIS A heat loss model was used to demonstrate thermodynamic efficiency greater than 99% (heat loss to the environment is less than 1% of the heat added).
2.3.3 TASK 1.3.3 COMBUSTOR ACOUSTIC ANALYSIS Acoustic modes were calculated for the complete combustion chamber and space was designed into the combustor for possible Helmholtz resonators to mitigate any acoustic instability observed during testing.
2.3.4 TASK 1.3.4 STRUCTURAL ANALYSIS Structural issues were addressed in this task. The combustor case design was based directly on the Solar Turbines pressurized single injector test rig that has been in operation for several years. Components taken directly from this successful platform were qualified based on heritage and not analyzed further. This included all hardware downstream of the injector face. Structural finite element simulations focused on the upstream casing and the injector body. The casing was found to adequately handle static, fatigue, and creep loading for a design life of 30,000 hours. Stresses in the injector body were also calculated to be acceptable as a result of the floating design of the injector, which limits thermal stresses.
2.3.5 TASK 1.3.5 MATERIAL AND COATING ANALYSIS Metal alloys were thoroughly reviewed for their high temperature strength, creep, and oxidation performance. Haynes 214, a nickel super alloy, was the preferred material for the injector body because of its superior oxidation resistance. However, this material is not commonly stocked and requires an expensive custom mill run which is not practical for fabrication of a prototype. Haynes 230, a slightly lower performing, but readily available alternative was selected for the prototype. The thermal barrier coating applied to the injector face was analyzed and estimated to

DE-EE0005805 Optimizing the CSP Tower Air Brayton Cycle System to Meet the SunShot Objectives
Southwest Research Institute
SwRI Project 17842 Page 18 of 85 Final Technical Report February 26, 2016
have approximately a 3,000 hour life, significantly lower than the target 15,000 hour life because of high temperature oxidation.
2.3.6 TASK 1.3.6 COMBUSTOR AND TEST FACILITY CONTROL SYSTEM A robust system that extended the existing National Instruments and Woodward compressor control hardware was implemented for the combustion testing. Mass flow controllers, valves, and logic were defined to safely control the air, fuel, and purge gas flow rates.
2.3.7 TASK 1.3.7 AIR BYPASS DESIGN Air bypass was not a focus because air bypass capability is an inherent feature of the multi-bank lean micro-mix design. Individual fuel banks are turned on or off to respond to changes in inlet temperature and load, eliminating the need for an additional bypass system design.
TASK 1.4 COMBUSTOR TEST FACILITY DESIGN 2.4
This task covers the design of new components and modifications to the existing facility necessary to operate the system, including characterization of the source air compressor, the design of air supply and exhaust piping and design of fuel supply system. The most significant effort was the selection of an affordable preheating system that could deliver 1,000°C air to the combustor. After an exhaustive search, an electric heater from OSRAM Sylvania was selected to heat the air to 800°C. Vendor-provided solutions for the final increment from 800°C to 1,000°C were available but cost prohibitive and not within the project budget. A custom direct-gas-fired secondary heater was incorporated as part of the test stand design to efficiently meet the temperature requirement.
TASK 1.5 TECHNOLOGY COMMERCIALIZATION AND PRODUCT DEVELOPMENT PATH 2.5
Solar Turbines presented its technology maturation plan through 2020 and a letter of understanding was signed between Solar Turbines, SwRI, and Abengoa Solar. In addition, SwRI analyzed the projected levelized cost of electricity (LCOE) and found this project’s technology offers three principal advantages:
• The hybrid system dramatically reduces the LCOE for all receiver temperatures compared to solar-only plants.
• Increasing the combustor inlet capability to 1,000°C greatly increases the fraction of solar energy produced by the hybrid plant.
• Achieving a specified energy mix of natural gas and renewables through hybrid systems is more economical than through completely separate plants.
The efforts of previous phases of this project designed a system to meet the demanding challenges of high inlet temperature combustors with varying conditions. A design that addresses performance, durability, and emissions goals with the exception of CO emissions at one operating point and the expected life of the injector face has been developed.
DE-EE0005805 Optimizing the CSP Tower Air Brayton Cycle System to Meet the SunShot Objectives
Southwest Research Institute
SwRI Project 17842 Page 19 of 85 Final Technical Report February 26, 2016
3. COMBUSTOR AND TEST FACILITY
The current phase of this project began on December 1, 2014, when funding from the U.S. Department of Energy was received by SwRI. The work scope of this phase included the completion of several tasks, that due to long lead times and supplier delays, were not completed by the conclusion of previous phases, as well as the tasks originally designated for this phase in the Statement of Project Objectives. These tasks were:
• Task 2.1: Combustor Fabrication • Task 2.2: Test Stand Fabrication • Task 3.1: Combustor Integration into Test Stand with Air Bypass and Control System • Task 3.2: Combustor No-Heat Flow Test • Task 3.3: Fuel Supply and Control System • Task 3.4: Emissions Analyzers: Set-up, Calibration and Measurements • Task 3.5: Preliminary Combustion Tests: Ignition, Fuel Sequencing and Operation
Troubleshooting • Task 3.6: Shakedown Tests: Optimization, Preliminary Emissions Measurements an • Task 3.7: Endurance and Stability Test: Effect of Thermal Cycling on Liner
Temperature and Emissions • Task 3.8: Performance Testing: Effect of Fuel on Emissions with Thermal Cycle • Task 3.9: Commercialization Assessment
The following sections detail the tasks from the Statement-of-Project-Objectives and the results for each of the tasks.
TASK 2.1 COMBUSTOR FABRICATION 3.1
This task included the fabrication of the combustor system and its various component parts. For the purposes of completion of this task, the combustor consisted of the combustor case and all of the components contained within the case. These components were the combustor case, the refractory liner, exhaust heat shield and cooling manifold, perforated plate flow conditioners, and injector and fuel supply lines. The deliverable for this task is the completion of a fully fabricated combustor that meets the design specifications from Task 1.3. Acquisition and fabrication of each of the components is discussed in the following subsections.
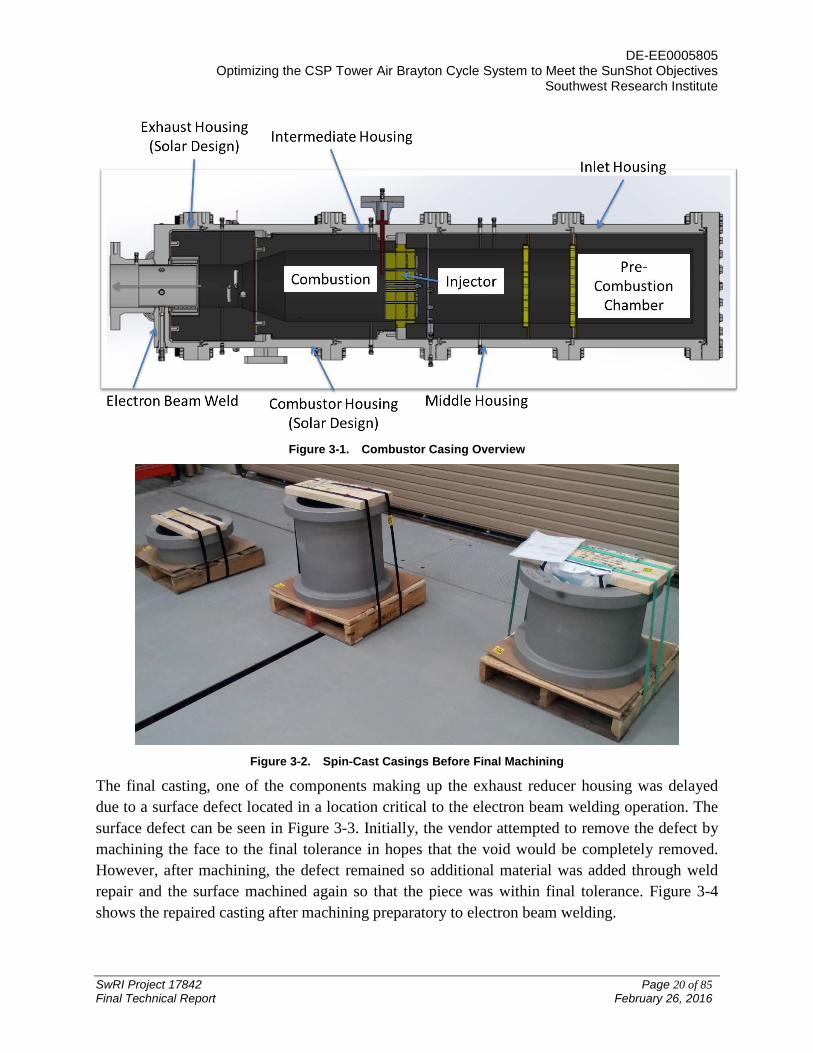
3.1.1 COMBUSTOR CASE The combustor case (shown in Figure 3-1) is made up of four sections fabricated from five spun cast spool pieces. The exhaust housing was cast in two spool pieces and joined using an electron beam welding process to form the exhaust reducer housing. All rough cast spool pieces were then finish-machined by Hahn and Clay in Houston, TX. The inlet housing blind flange and inlet standpipe were custom machined. The inlet pipe was welded to the inlet case using a conventional arc welding technique.
DE-EE0005805 Optimizing the CSP Tower Air Brayton Cycle System to Meet the SunShot Objectives
Southwest Research Institute
SwRI Project 17842 Page 20 of 85 Final Technical Report February 26, 2016
Figure 3-1. Combustor Casing Overview
Figure 3-2. Spin-Cast Casings Before Final Machining
The final casting, one of the components making up the exhaust reducer housing was delayed due to a surface defect located in a location critical to the electron beam welding operation. The surface defect can be seen in Figure 3-3. Initially, the vendor attempted to remove the defect by machining the face to the final tolerance in hopes that the void would be completely removed. However, after machining, the defect remained so additional material was added through weld repair and the surface machined again so that the piece was within final tolerance. Figure 3-4 shows the repaired casting after machining preparatory to electron beam welding.

DE-EE0005805 Optimizing the CSP Tower Air Brayton Cycle System to Meet the SunShot Objectives
Southwest Research Institute
SwRI Project 17842 Page 21 of 85 Final Technical Report February 26, 2016
Figure 3-3. Surface Defect in the Exhaust Reducer Housing
Figure 3-4. Weld Repair of Exhaust Reducer Housing Defect
Due to the nature of the casting, each of the spool pieces of the combustor housings needed to be machined to ensure the final dimensions were within tolerance. This final machining process also added essential features, such as bolt holes and sealing surfaces in the flanges, drilled and tapped holes for instrumentation and cooling air and exhaust quench water, and internal alignment and retaining features for securing the refractory liner. As each of the spool pieces was received at SwRI from the casting vendor, they were shipped to the machine shop.
The two castings that made up the exhaust reducer housing underwent an additional machining step in preparation for the electron beam weld process that joined them to form the final housing. After the weld preparation machining, the two castings were sent to the electron beam weld vendor, EBTEC in Agawam, MA. As one of these components had the surface defect during casting, the start of the electron beam weld process was delayed considerably.
DE-EE0005805 Optimizing the CSP Tower Air Brayton Cycle System to Meet the SunShot Objectives
Southwest Research Institute
SwRI Project 17842 Page 22 of 85 Final Technical Report February 26, 2016
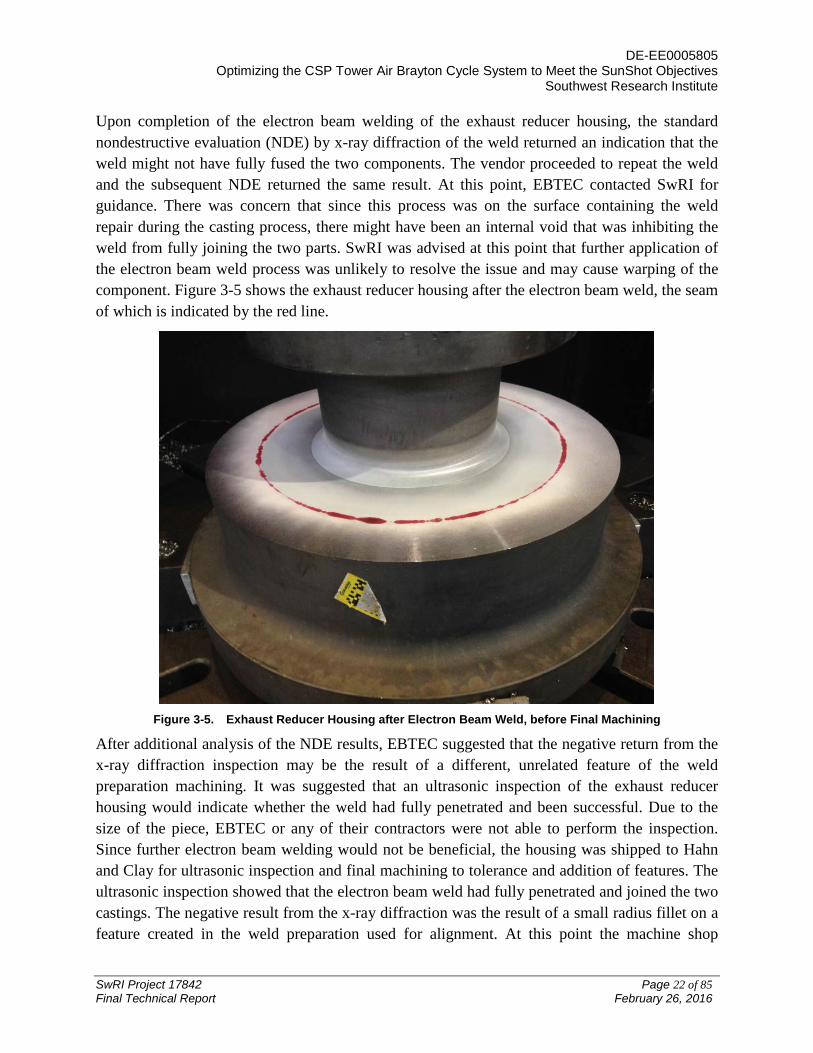
Upon completion of the electron beam welding of the exhaust reducer housing, the standard nondestructive evaluation (NDE) by x-ray diffraction of the weld returned an indication that the weld might not have fully fused the two components. The vendor proceeded to repeat the weld and the subsequent NDE returned the same result. At this point, EBTEC contacted SwRI for guidance. There was concern that since this process was on the surface containing the weld repair during the casting process, there might have been an internal void that was inhibiting the weld from fully joining the two parts. SwRI was advised at this point that further application of the electron beam weld process was unlikely to resolve the issue and may cause warping of the component. Figure 3-5 shows the exhaust reducer housing after the electron beam weld, the seam of which is indicated by the red line.
Figure 3-5. Exhaust Reducer Housing after Electron Beam Weld, before Final Machining
After additional analysis of the NDE results, EBTEC suggested that the negative return from the x-ray diffraction inspection may be the result of a different, unrelated feature of the weld preparation machining. It was suggested that an ultrasonic inspection of the exhaust reducer housing would indicate whether the weld had fully penetrated and been successful. Due to the size of the piece, EBTEC or any of their contractors were not able to perform the inspection. Since further electron beam welding would not be beneficial, the housing was shipped to Hahn and Clay for ultrasonic inspection and final machining to tolerance and addition of features. The ultrasonic inspection showed that the electron beam weld had fully penetrated and joined the two castings. The negative result from the x-ray diffraction was the result of a small radius fillet on a feature created in the weld preparation used for alignment. At this point the machine shop

DE-EE0005805 Optimizing the CSP Tower Air Brayton Cycle System to Meet the SunShot Objectives
Southwest Research Institute
SwRI Project 17842 Page 23 of 85 Final Technical Report February 26, 2016
proceeded with the final machining of the exhaust reducer housing. The exhaust reducer housing was the last of the combustor housings to be delivered and arrived at SwRI in the second week of September 2015.
Figure 3-6. Combustor Housings after Final Machining
The design of several combustor housing components that contained critical features was provided by Solar Turbines as part of this project. The design of those components used nonstandard flanges and sealing features. To maintain continuity throughout the combustor and to leverage the high temperature sealing scheme employed by the Solar Turbines design, all of the combustor case parts followed the same design. Figure 3-6 shows combustor housings after final machining with bolt holes and sealing features on the flanges and instrumentation and cooling air ports.
The end cap at the inlet of the combustor was a custom blind flange machined by CCC Group Inc. in San Antonio, TX. This was because the end cap was completely insulated from the inlet flow by the refractory liner and there was a large surface area to volume ratio that allowed the part to remain at acceptably low temperatures. A six inch pipe made with a standard ANSI 300# class flange was welded to the inlet housing. ANSI standard flanges and six inch pipe are commonly available and were selected for use in this application to reduce cost and schedule. The end cap and inlet pipe are shown in Figure 3-7. The piping connecting the combustor to the electric heater will be discussed later in this report.

DE-EE0005805 Optimizing the CSP Tower Air Brayton Cycle System to Meet the SunShot Objectives
Southwest Research Institute
SwRI Project 17842 Page 24 of 85 Final Technical Report February 26, 2016
Figure 3-7. Inconel 625 Inlet Pipe and Blind Flange
3.1.2 REFRACTORY LINER The combustor was lined with castable ceramic refractory inserts backed by high temperature resistant sheet metal. Figure 3-8 details the construction of the refractory. The sheet metal liners were made from stainless steel alloy 304H that was cut and formed by J&N Metals in Brazil, IN.
The sheet metal liners for the refractory were cut to fit the retaining and alignment features in the combustor case as well as to have additional holes cut for instrumentation, fuel, and cooling air to be allowed to pass through. The liners were then formed to fit the inner diameter of the combustor case with a small gap for cooling air supplied to the case from an external manifold.
A less expensive material, SS304H, was deemed to be an acceptable alternative and was selected for use in the liner. The subsequent cost was a third that of the exotic alloy option, bringing the cost of the refractory inserts back in line with the projected budget.
Inlet Pipe Blind Flange

DE-EE0005805 Optimizing the CSP Tower Air Brayton Cycle System to Meet the SunShot Objectives
Southwest Research Institute
SwRI Project 17842 Page 25 of 85 Final Technical Report February 26, 2016
Figure 3-8. Refractory Liner Details
The purchase order for the sheet metal liners was placed with J&N Metals at the end of April 2015 with a quoted lead time of four to eight weeks after receipt of the order. Efforts to follow up with the vendor to check on the status of the liners began in mid-June, five to six weeks after issuing the purchase order. The vendor was not responsive to these requests. At eight weeks after issuing the PO, SwRI began more frequent attempts to get a status update on the liners to the point of daily phone calls. In mid-July, SwRI was informed that the laser cutter used to make these parts had been broken for the past several months and was again functioning and the refractory liners were being made and would be ready in four weeks. The liners were shipped directly to the refractory casting vendor in the last week of August 2015.
3.1.3 EXHAUST HEAT SHIELD AND COOLING AIR MANIFOLD Due to the reduced diameter of the combustor case transition to the exhaust pipe in the exhaust reducer housing, there was not room for a refractory lining to protect the case. Thermal protection of the case up to the exhaust quench was accomplished with a sheet metal heat shield cooled by a cooling air manifold. The inner face of the manifold had a regular rectangular pattern of round holes that blew cooling air on the outer diameter of the heat shield. The manifold was fabricated by J&N Metals from SS304H. The exhaust reducer with cooling manifold and heat shield is shown in Figure 3-9.

DE-EE0005805 Optimizing the CSP Tower Air Brayton Cycle System to Meet the SunShot Objectives
Southwest Research Institute
SwRI Project 17842 Page 26 of 85 Final Technical Report February 26, 2016
Figure 3-9. Exhaust Heat Shield and Cooling Air Manifold
Two identical versions of the heat shield were fabricated at J&N Metals: one in SS304H and one in Hastalloy-X. The Hastalloy-X heat shield was used for this project with the SS304H held as a spare.
3.1.4 PERFORATED PLATES In wind tunnel design, when flow might be subject to a non-uniform total pressure distribution due to features such as an obstruction, sudden expansion or contraction, or turning, perforated plates are used to rebalance the total pressure distribution across the flow area. In a region where the static pressure is uniform the non-uniform distribution of total pressure is equivalent to a non-uniform velocity distribution. The perforated plates aid in removing non-uniformities in the velocity distribution by the fact that a higher velocity fluid will experience more resistance flowing through a hole than lower velocity fluid. This means that the pressure loss through the hole is greater for the fluid with a higher velocity and, therefore, the velocity difference throughout the flow is reduced by passing through the perforated plate.
There are two perforated plates in the combustor to help even out any non-uniform pressure distribution introduced by the abrupt flow area expansion from the inlet pipe to the combustor case and by the 90° turn the flow makes from the inlet to the injector face. To resist the high inlet temperature, the perforated plates are made from Haynes 230 alloy. The plates were cut to size and the holes cut using a waterjet machining process by Aqua Power Cutting in Blanco, TX.
DE-EE0005805 Optimizing the CSP Tower Air Brayton Cycle System to Meet the SunShot Objectives
Southwest Research Institute
SwRI Project 17842 Page 27 of 85 Final Technical Report February 26, 2016
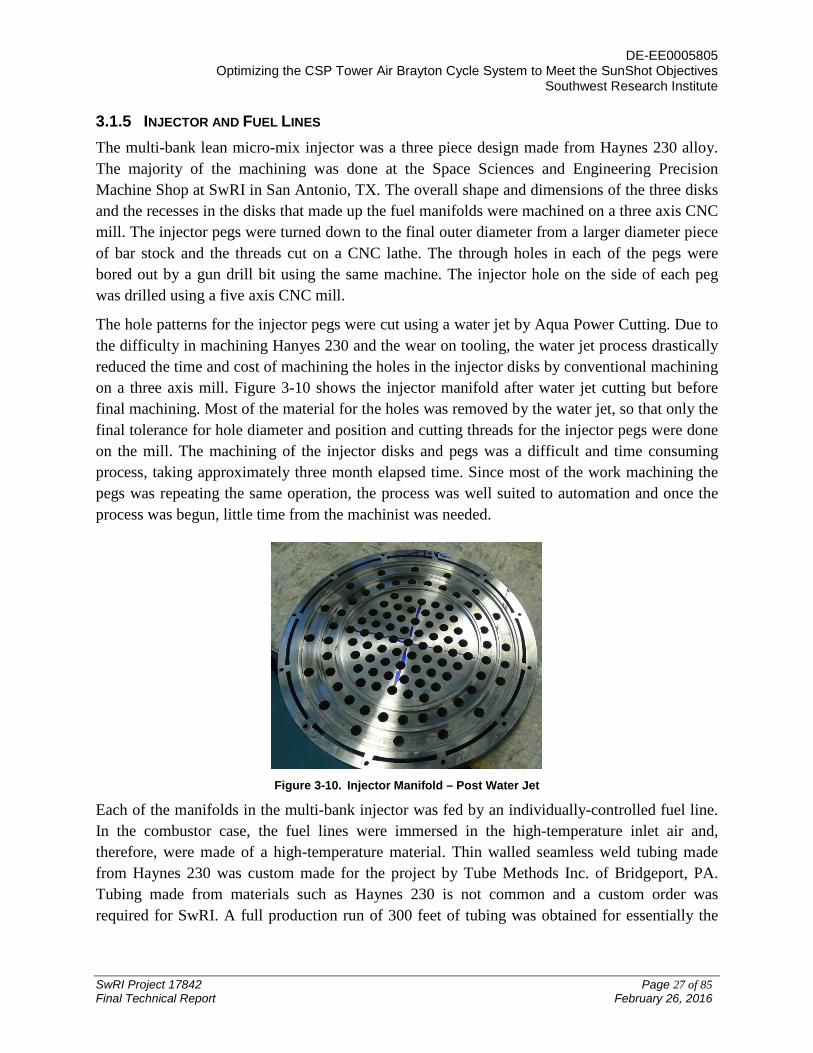
3.1.5 INJECTOR AND FUEL LINES The multi-bank lean micro-mix injector was a three piece design made from Haynes 230 alloy. The majority of the machining was done at the Space Sciences and Engineering Precision Machine Shop at SwRI in San Antonio, TX. The overall shape and dimensions of the three disks and the recesses in the disks that made up the fuel manifolds were machined on a three axis CNC mill. The injector pegs were turned down to the final outer diameter from a larger diameter piece of bar stock and the threads cut on a CNC lathe. The through holes in each of the pegs were bored out by a gun drill bit using the same machine. The injector hole on the side of each peg was drilled using a five axis CNC mill.
The hole patterns for the injector pegs were cut using a water jet by Aqua Power Cutting. Due to the difficulty in machining Hanyes 230 and the wear on tooling, the water jet process drastically reduced the time and cost of machining the holes in the injector disks by conventional machining on a three axis mill. Figure 3-10 shows the injector manifold after water jet cutting but before final machining. Most of the material for the holes was removed by the water jet, so that only the final tolerance for hole diameter and position and cutting threads for the injector pegs were done on the mill. The machining of the injector disks and pegs was a difficult and time consuming process, taking approximately three month elapsed time. Since most of the work machining the pegs was repeating the same operation, the process was well suited to automation and once the process was begun, little time from the machinist was needed.
Figure 3-10. Injector Manifold – Post Water Jet
Each of the manifolds in the multi-bank injector was fed by an individually-controlled fuel line. In the combustor case, the fuel lines were immersed in the high-temperature inlet air and, therefore, were made of a high-temperature material. Thin walled seamless weld tubing made from Haynes 230 was custom made for the project by Tube Methods Inc. of Bridgeport, PA. Tubing made from materials such as Haynes 230 is not common and a custom order was required for SwRI. A full production run of 300 feet of tubing was obtained for essentially the

DE-EE0005805 Optimizing the CSP Tower Air Brayton Cycle System to Meet the SunShot Objectives
Southwest Research Institute
SwRI Project 17842 Page 28 of 85 Final Technical Report February 26, 2016
same cost as the 100 feet that was originally needed. The Haynes tubing proved to be extremely useful throughout the project for applications in addition to the fuel lines.
Thin-walled tubing was selected for cost reasons, i.e., less expensive material and fabrication costs, and the thinner wall allowed the fuel to come up to the air temperature in a relatively short length of tubing before being introduced into the injector manifolds. The installed fuel lines were approximately four feet in total length with coils to allow fitting the fuel lines in the space immediately upstream of the injector. Figure 3-11 shows the installed fuel lines upstream of the injector.
c Figure 3-11. Installed Fuel Lines
TASK 2.2 TEST FACILITY FABRICATION 3.2
The test facility fabrication task included all facility modifications required to test the combustion system. This included air supply and exhaust piping, primary heater, secondary heater, fuel delivery system, combustor case cooling air, instrumentation, water system for exhaust quenching, and data acquisition and control system modifications. Each of these is discussed in the following sections.
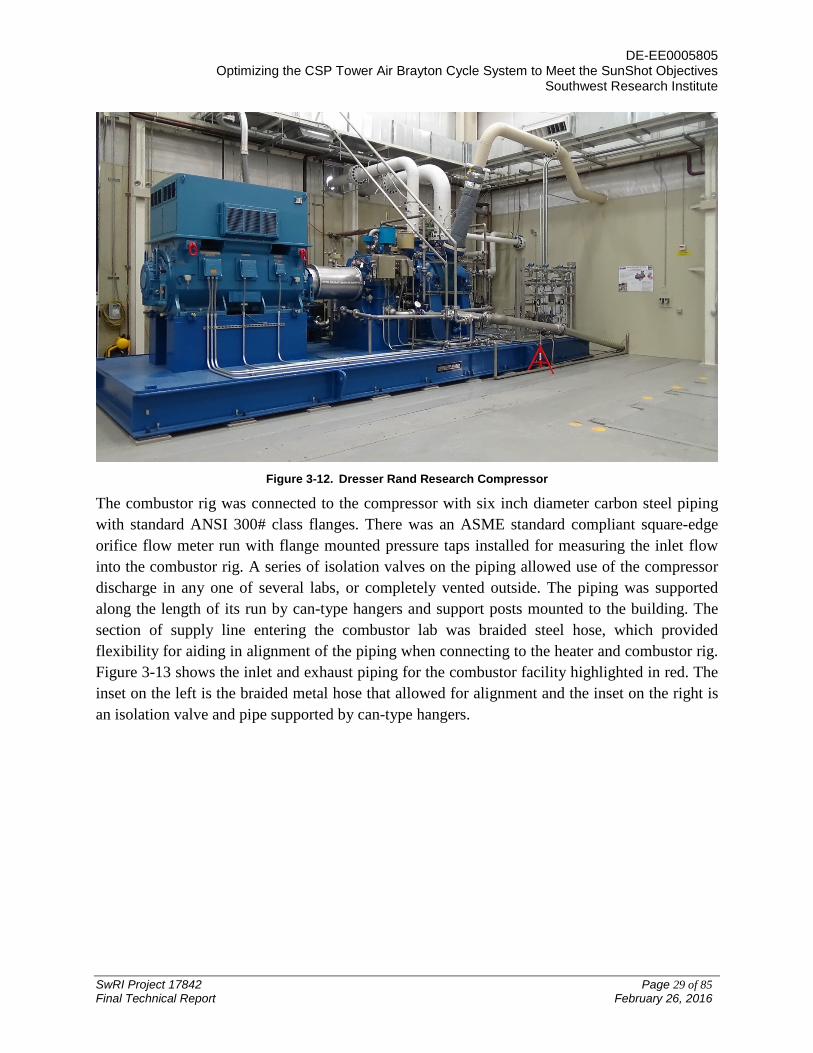
3.2.1 AIR SUPPLY AND EXHAUST PIPING The compressed air for the combustor rig was supplied by the research compressor located in the Turbomachinery Research Facility. This compressor (shown in Figure 3-12) was designed, built, and commissioned as part of a U.S. Department of Energy project, DOE Award No. DE-FC26-05NT42650, and entered service in 2014.
DE-EE0005805 Optimizing the CSP Tower Air Brayton Cycle System to Meet the SunShot Objectives
Southwest Research Institute
SwRI Project 17842 Page 29 of 85 Final Technical Report February 26, 2016
Figure 3-12. Dresser Rand Research Compressor
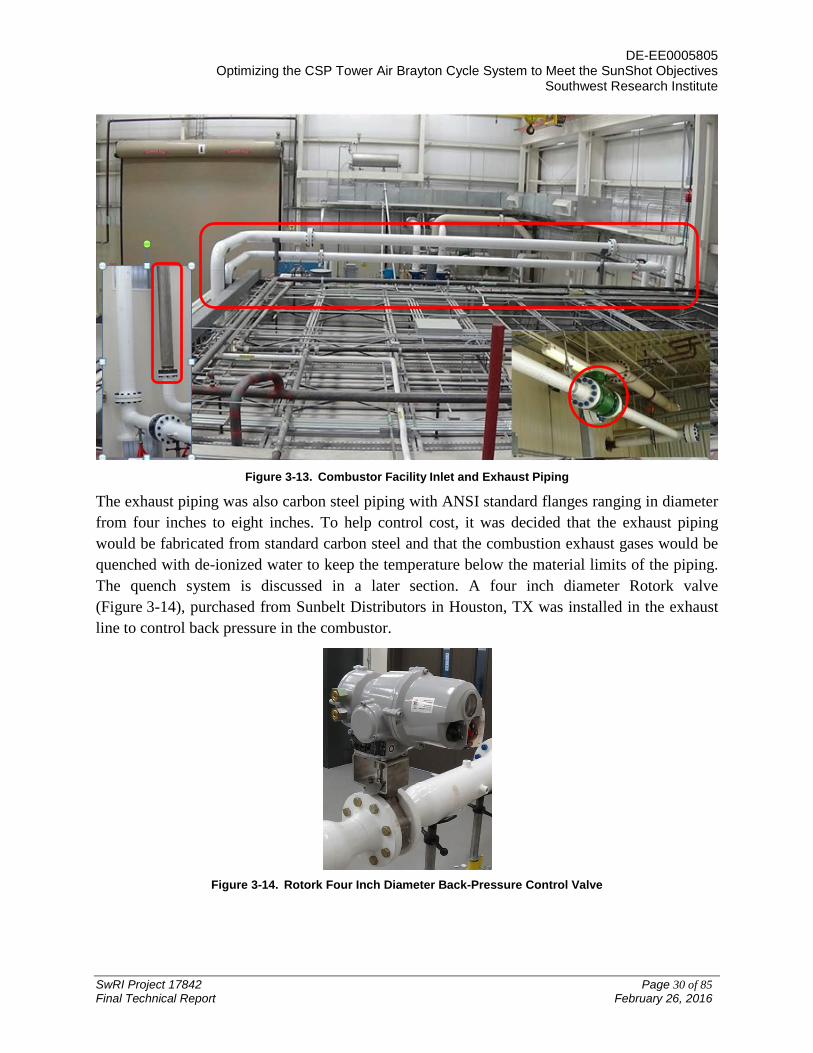
The combustor rig was connected to the compressor with six inch diameter carbon steel piping with standard ANSI 300# class flanges. There was an ASME standard compliant square-edge orifice flow meter run with flange mounted pressure taps installed for measuring the inlet flow into the combustor rig. A series of isolation valves on the piping allowed use of the compressor discharge in any one of several labs, or completely vented outside. The piping was supported along the length of its run by can-type hangers and support posts mounted to the building. The section of supply line entering the combustor lab was braided steel hose, which provided flexibility for aiding in alignment of the piping when connecting to the heater and combustor rig. Figure 3-13 shows the inlet and exhaust piping for the combustor facility highlighted in red. The inset on the left is the braided metal hose that allowed for alignment and the inset on the right is an isolation valve and pipe supported by can-type hangers.
DE-EE0005805 Optimizing the CSP Tower Air Brayton Cycle System to Meet the SunShot Objectives
Southwest Research Institute
SwRI Project 17842 Page 30 of 85 Final Technical Report February 26, 2016
Figure 3-13. Combustor Facility Inlet and Exhaust Piping
The exhaust piping was also carbon steel piping with ANSI standard flanges ranging in diameter from four inches to eight inches. To help control cost, it was decided that the exhaust piping would be fabricated from standard carbon steel and that the combustion exhaust gases would be quenched with de-ionized water to keep the temperature below the material limits of the piping. The quench system is discussed in a later section. A four inch diameter Rotork valve (Figure 3-14), purchased from Sunbelt Distributors in Houston, TX was installed in the exhaust line to control back pressure in the combustor.
Figure 3-14. Rotork Four Inch Diameter Back-Pressure Control Valve
DE-EE0005805 Optimizing the CSP Tower Air Brayton Cycle System to Meet the SunShot Objectives
Southwest Research Institute
SwRI Project 17842 Page 31 of 85 Final Technical Report February 26, 2016
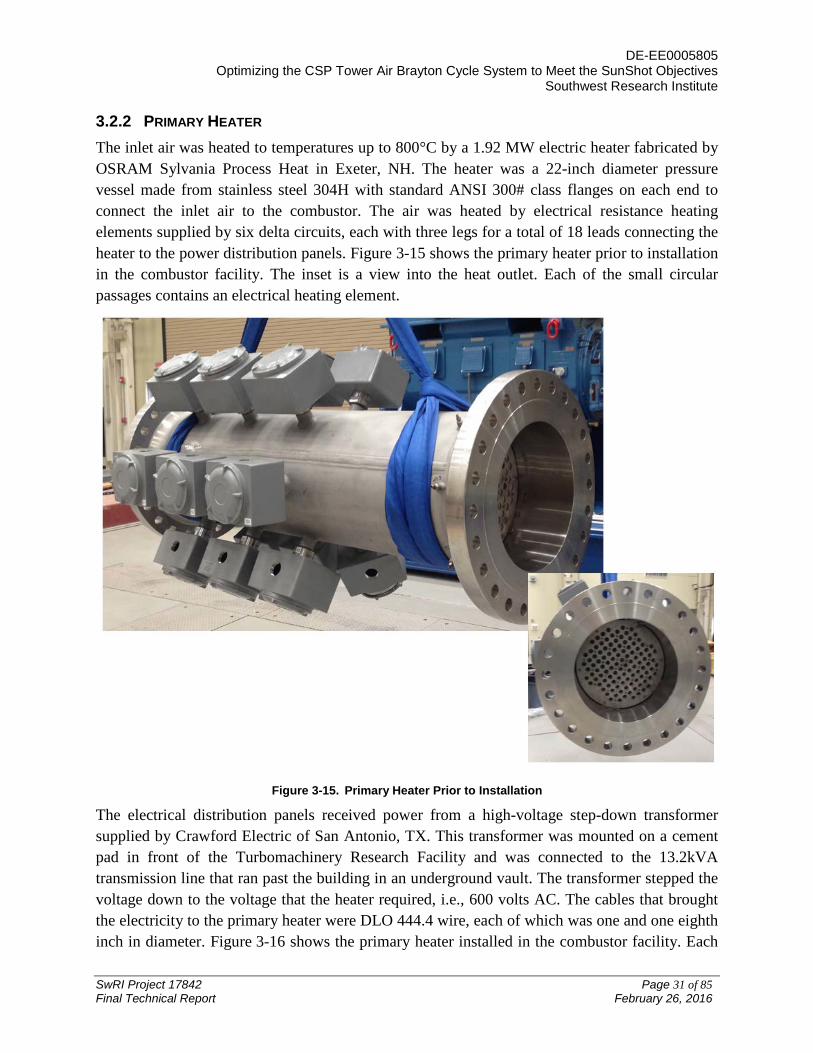
3.2.2 PRIMARY HEATER The inlet air was heated to temperatures up to 800°C by a 1.92 MW electric heater fabricated by OSRAM Sylvania Process Heat in Exeter, NH. The heater was a 22-inch diameter pressure vessel made from stainless steel 304H with standard ANSI 300# class flanges on each end to connect the inlet air to the combustor. The air was heated by electrical resistance heating elements supplied by six delta circuits, each with three legs for a total of 18 leads connecting the heater to the power distribution panels. Figure 3-15 shows the primary heater prior to installation in the combustor facility. The inset is a view into the heat outlet. Each of the small circular passages contains an electrical heating element.
Figure 3-15. Primary Heater Prior to Installation
The electrical distribution panels received power from a high-voltage step-down transformer supplied by Crawford Electric of San Antonio, TX. This transformer was mounted on a cement pad in front of the Turbomachinery Research Facility and was connected to the 13.2kVA transmission line that ran past the building in an underground vault. The transformer stepped the voltage down to the voltage that the heater required, i.e., 600 volts AC. The cables that brought the electricity to the primary heater were DLO 444.4 wire, each of which was one and one eighth inch in diameter. Figure 3-16 shows the primary heater installed in the combustor facility. Each

DE-EE0005805 Optimizing the CSP Tower Air Brayton Cycle System to Meet the SunShot Objectives
Southwest Research Institute
SwRI Project 17842 Page 32 of 85 Final Technical Report February 26, 2016
grey conduit leading to a junction box on the heater case contained one DLO 444.4 cable. The layout of the primary heater and the supporting infrastructure, power distribution panels, cable trays, etc. is shown in Figure 3-17.
Figure 3-16. Primary Heater after Installation
Figure 3-17. Combustor Layout with Primary Heater Infrastructure
Power Distribution Panels
Cable Tray with DLO 444.4 Wire
Primary Heater
Combustor
DE-EE0005805 Optimizing the CSP Tower Air Brayton Cycle System to Meet the SunShot Objectives
Southwest Research Institute
SwRI Project 17842 Page 33 of 85 Final Technical Report February 26, 2016
The process temperature and over limit temperature for the heater were sensed at the heater outlet by six probes, each with two, type-K thermocouple beads. The thermocouple leads were routed to the temperature control panel located in a control room adjacent to the combustor lab, where six leads, one from each probe, were connected to over temperature limit switches and one was connected to the process control input. Signals from the other five leads were routed directly through to the data acquisition system, while the process control temperature value was passed to the data acquisition system as a 4 -20 mA signal for use in monitoring process control. The set-point temperature was passed to the heater control panel from the data acquisition and control system and the heater power was varied by a closed-loop PID (proportional - integral - differential) controller until the process temperature reaches the set point.
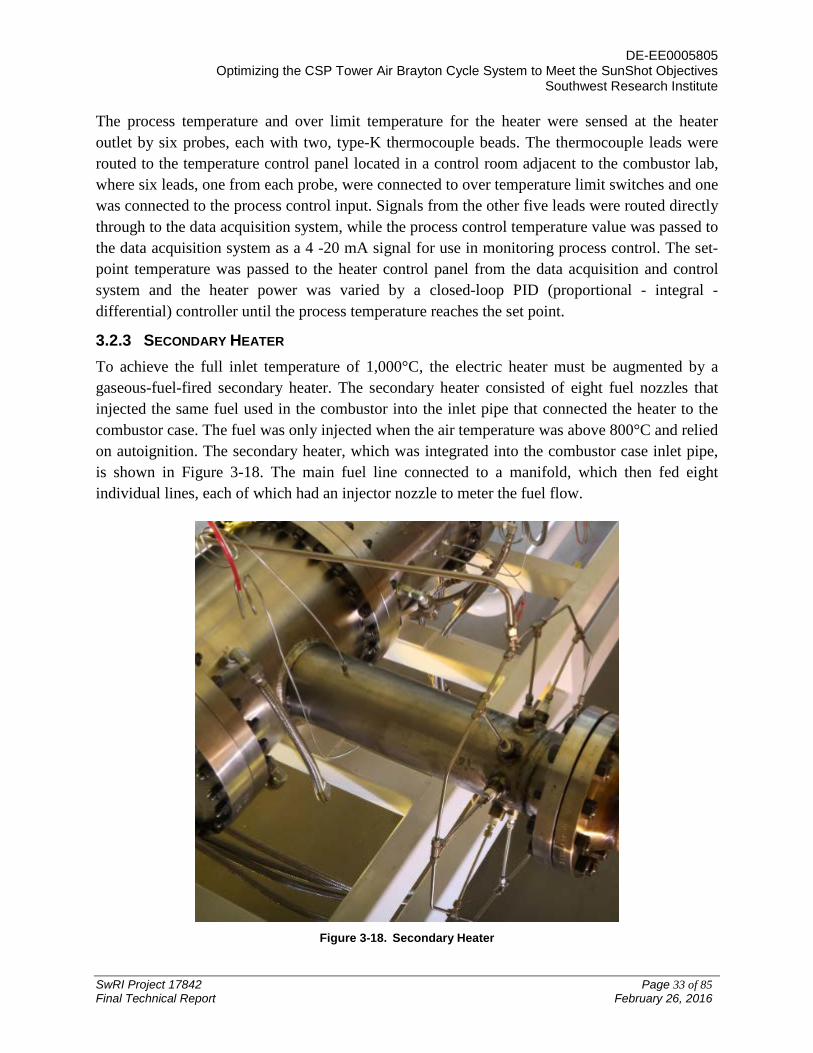
3.2.3 SECONDARY HEATER To achieve the full inlet temperature of 1,000°C, the electric heater must be augmented by a gaseous-fuel-fired secondary heater. The secondary heater consisted of eight fuel nozzles that injected the same fuel used in the combustor into the inlet pipe that connected the heater to the combustor case. The fuel was only injected when the air temperature was above 800°C and relied on autoignition. The secondary heater, which was integrated into the combustor case inlet pipe, is shown in Figure 3-18. The main fuel line connected to a manifold, which then fed eight individual lines, each of which had an injector nozzle to meter the fuel flow.
Figure 3-18. Secondary Heater
DE-EE0005805 Optimizing the CSP Tower Air Brayton Cycle System to Meet the SunShot Objectives
Southwest Research Institute
SwRI Project 17842 Page 34 of 85 Final Technical Report February 26, 2016
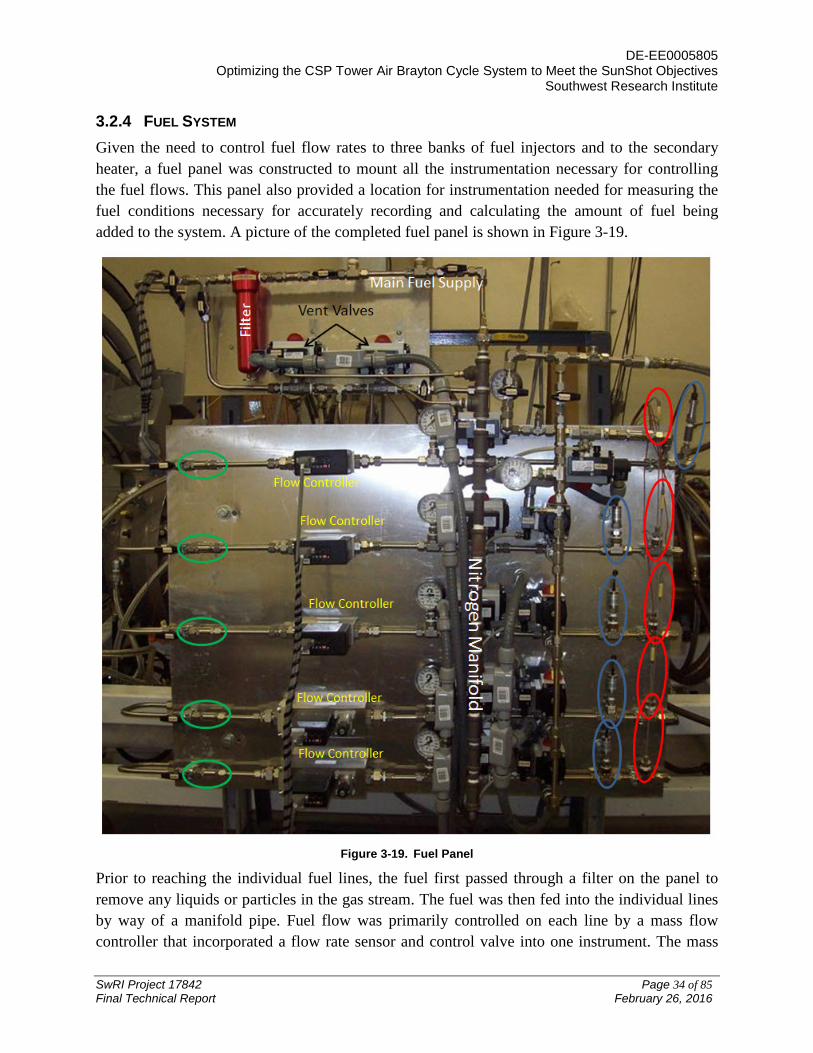
3.2.4 FUEL SYSTEM Given the need to control fuel flow rates to three banks of fuel injectors and to the secondary heater, a fuel panel was constructed to mount all the instrumentation necessary for controlling the fuel flows. This panel also provided a location for instrumentation needed for measuring the fuel conditions necessary for accurately recording and calculating the amount of fuel being added to the system. A picture of the completed fuel panel is shown in Figure 3-19.
Figure 3-19. Fuel Panel
Prior to reaching the individual fuel lines, the fuel first passed through a filter on the panel to remove any liquids or particles in the gas stream. The fuel was then fed into the individual lines by way of a manifold pipe. Fuel flow was primarily controlled on each line by a mass flow controller that incorporated a flow rate sensor and control valve into one instrument. The mass

DE-EE0005805 Optimizing the CSP Tower Air Brayton Cycle System to Meet the SunShot Objectives
Southwest Research Institute
SwRI Project 17842 Page 35 of 85 Final Technical Report February 26, 2016
flow controllers selected were purchased from Teledyne-Hastings and sized to fit the design flow rates. In addition to the mass flow controller, each fuel line had a check valve (green circles) to prevent reverse flow, an air-operated solenoid to isolate fuel from the system, an air-operated solenoid to allow purging of the line, and one each temperature (red circles) and pressure sensors (blue circles).
3.2.5 COMBUSTOR CASE COOLING AIR A cooling manifold supplied air at 150 psig through a three inch diameter flexible hose, the flow through which was controlled by a pneumatic valve. The manifold consisted of an ANSI 300# tee flanged with a pipe run with two three-inch diameter pipes on either side to form the header. The manifold rested on the combustor support stand lower section, allowing for an air gap to reduce the heat gain from the combustor case to the cooling air.
There were 23 steel-braided hoses connected to half-inch diameter NPT male/female fittings on the cooling air manifold. The steel braided hose was rated for a temperature range of -325°F to 1,200°F. The steel hoses were routed to individual cooling air ports along the outer surface of the combustor case. The cooling ports varied from quarter inch diameter NPT to one inch diameter NPT and were fitted with male/male elbows or nipples, as needed.
3.2.6 INSTRUMENTATION The combustor rig and associated support infrastructure was monitored by a suite of instrumentation that included thermocouples measuring both air and metal temperature, steady-state pressure transducers, and a gas sampling system for determining composition of combustion products.
Type-K thermocouples with nickel sheaths were used throughout the test rig to measure air temperature, while bare type-K thermocouple beads were connected to the outer surface of the combustor case to measure metal temperatures. The air temperature probes were inserted into the flow and secured with eighth inch diameter compression fittings and pipe fitting adapters into threaded holes on the combustor case or weld-o-let fittings on the inlet and exhaust piping.
Steady-state pressures were measured in the inlet and exhaust pipes via pressure taps in the pipe walls that were connected to eighth inch diameter stainless steel tubing stand-offs that were, in turn, connected to plastic tubing that ran to the instrumentation rack that housed the transducers in the adjacent control room. The stainless steel stand-offs were used to keep the plastic tubing from being damaged by hot gas in the pressure sensor line. The plastic tubes were secured to the stand-offs by safety wire.
Two independent systems were used to measure the combustion products composition. Each was connected to the combustor by a water-cooled gas sampling probe. The probes consisted of an outer tube of stainless steel through which the cooling water circulated, while a length of quarter inch Haynes 230 tubing passed through the water jacket and extended into the flow to
DE-EE0005805 Optimizing the CSP Tower Air Brayton Cycle System to Meet the SunShot Objectives
Southwest Research Institute
SwRI Project 17842 Page 36 of 85 Final Technical Report February 26, 2016
sample the combustion products. The end of the outer tube was sealed around the inner sampling tube and the cooling water recirculated to the supply reservoir.
An E-instruments E5500 emissions analyzer capable of measuring O2, CO, and NOx was connected to one of the gas sampling lines. The analyzer itself was mounted in the instrumentation rack in the control room adjacent to the combustor lab and the test results were written to a hard drive on a computer in the control room.
A Nicolet 670 FTIR Spectrometer provided by the Engines, Emissions and Vehicle Research Division of SwRI i=was equipped with an ETC Everglo infrared source and 2-meter long gas cell with ZnSe windows to allow sampling at a broad range of wavelengths with maximum cell durability. Detection was with a liquid-nitrogen-cooled Mercury-cadmium-telluride (MCT) photoconductive detector. For this testing, the calibrated natural gas components were CO, CO2, NO, NO2, ethane, methane and water. This instrument was selected, in addition to the E5500, primarily for its ability to detect unburned hydrocarbons.
3.2.7 EXHAUST QUENCH WATER To quickly reduce the temperature of the exhaust gases in the exhaust piping, de-ionized water was injected by five nozzles in the exhaust reducer housing. De-ionized water was used to reduce scaling and mineral deposits building up in the exhaust lines due to the flash boiling of the quench water. The de-ionized water was produced by an Ionright system leased from Evoqua Water Technologies in San Antonio, TX.
The quench water was produced by the Ionright system and stored in a 1,500 gallon tank then pumped into the quench system by a Grudfos positive-displacement pump. The quench system could consume up to 13 gallons per minute, while the Ionright system could produce a maximum of seven gallons per minute. At the maximum quench rate, starting with the storage tank full, the system could run for over four hours. The water used for cooling the emissions sampling probes was also provided by the Ionright system, but it could be recirculated so it was not a net water consumer and did not impact total run time.
3.2.8 DATA ACQUISITION AND CONTROL SYSTEM Control and data-acquisition of the combustor testing were accomplished through modifications of an existing system. The original system was designed for operating the centrifugal compressor that provided the test air to the combustor test cell. Modifications to the system, including additional hardware and software capabilities, allowed user control of the compressor to be maintained in the same system. The various components in the system and their interconnections with the rest of the system are shown in Figure 3-20.

DE-EE0005805 Optimizing the CSP Tower Air Brayton Cycle System to Meet the SunShot Objectives
Southwest Research Institute
SwRI Project 17842 Page 37 of 85 Final Technical Report February 26, 2016
Figure 3-20. Control & DAQ System Layout
The primary controller that operated the test cell was comprised of a Woodward Compressor Core. This unit performed all critical operating measurements and provided all critical control signals. As such, the Woodward maintained the current status of the test system in the event of other unit failures and performed emergency control of the compressor and combustor in case of shutdown conditions.
Hardware was added to this unit to provide the new critical operating measurements of the combustor test cell; such as temperatures, pressures, flow rates, and gas and fire monitors. Hardware was also added to provide control signals for all solenoids in the combustor system, the primary heater control panel, the various control valves, and the mass flow controllers. A new code for the Woodward developed by the third-party, Drake Controls, incorporated the new hardware and performed monitoring and emergency control for the combustor test system. SwRI worked closely with the Drake Controls’ programmers to design the logic control that went into this code.
User interface was handled by communication with the Woodward controller via a National Instrument’s cRIO with an on-board Windows platform. The primary control panel for operation
DE-EE0005805 Optimizing the CSP Tower Air Brayton Cycle System to Meet the SunShot Objectives
Southwest Research Institute
SwRI Project 17842 Page 38 of 85 Final Technical Report February 26, 2016
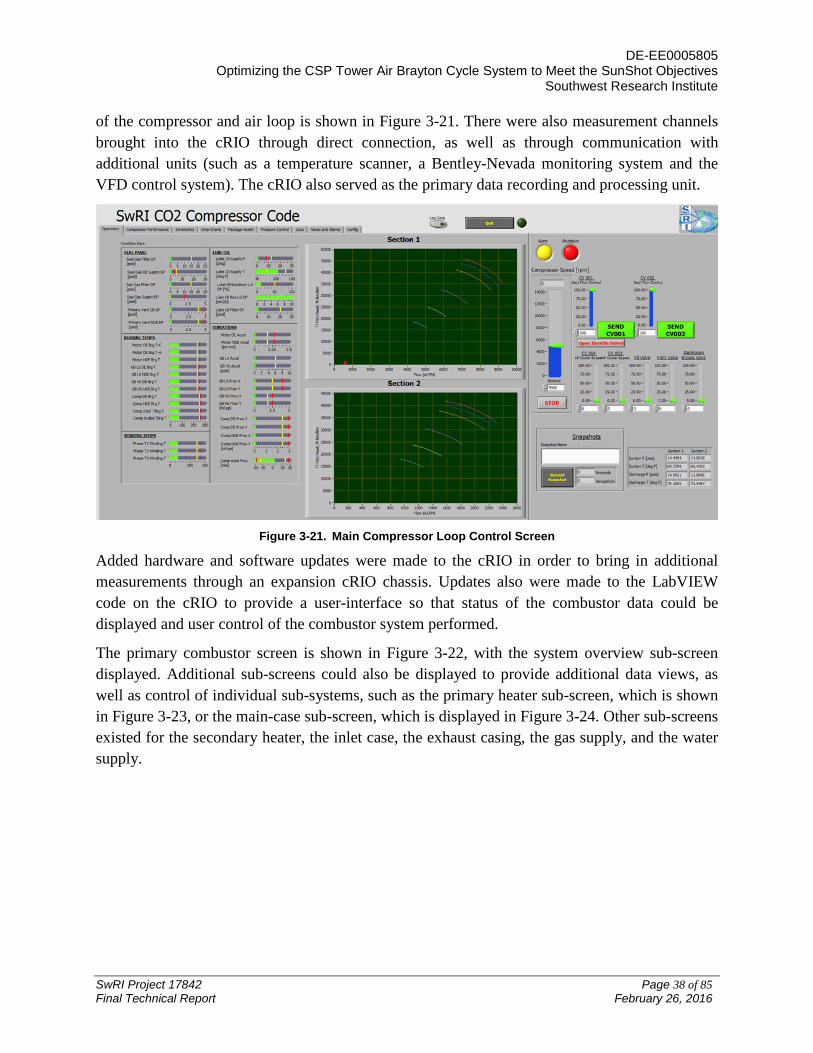
of the compressor and air loop is shown in Figure 3-21. There were also measurement channels brought into the cRIO through direct connection, as well as through communication with additional units (such as a temperature scanner, a Bentley-Nevada monitoring system and the VFD control system). The cRIO also served as the primary data recording and processing unit.
Figure 3-21. Main Compressor Loop Control Screen
Added hardware and software updates were made to the cRIO in order to bring in additional measurements through an expansion cRIO chassis. Updates also were made to the LabVIEW code on the cRIO to provide a user-interface so that status of the combustor data could be displayed and user control of the combustor system performed.
The primary combustor screen is shown in Figure 3-22, with the system overview sub-screen displayed. Additional sub-screens could also be displayed to provide additional data views, as well as control of individual sub-systems, such as the primary heater sub-screen, which is shown in Figure 3-23, or the main-case sub-screen, which is displayed in Figure 3-24. Other sub-screens existed for the secondary heater, the inlet case, the exhaust casing, the gas supply, and the water supply.

DE-EE0005805 Optimizing the CSP Tower Air Brayton Cycle System to Meet the SunShot Objectives
Southwest Research Institute
SwRI Project 17842 Page 39 of 85 Final Technical Report February 26, 2016
Figure 3-22. Primary Combustor Control Screen
Figure 3-23. Primary Heater Sub-Screen
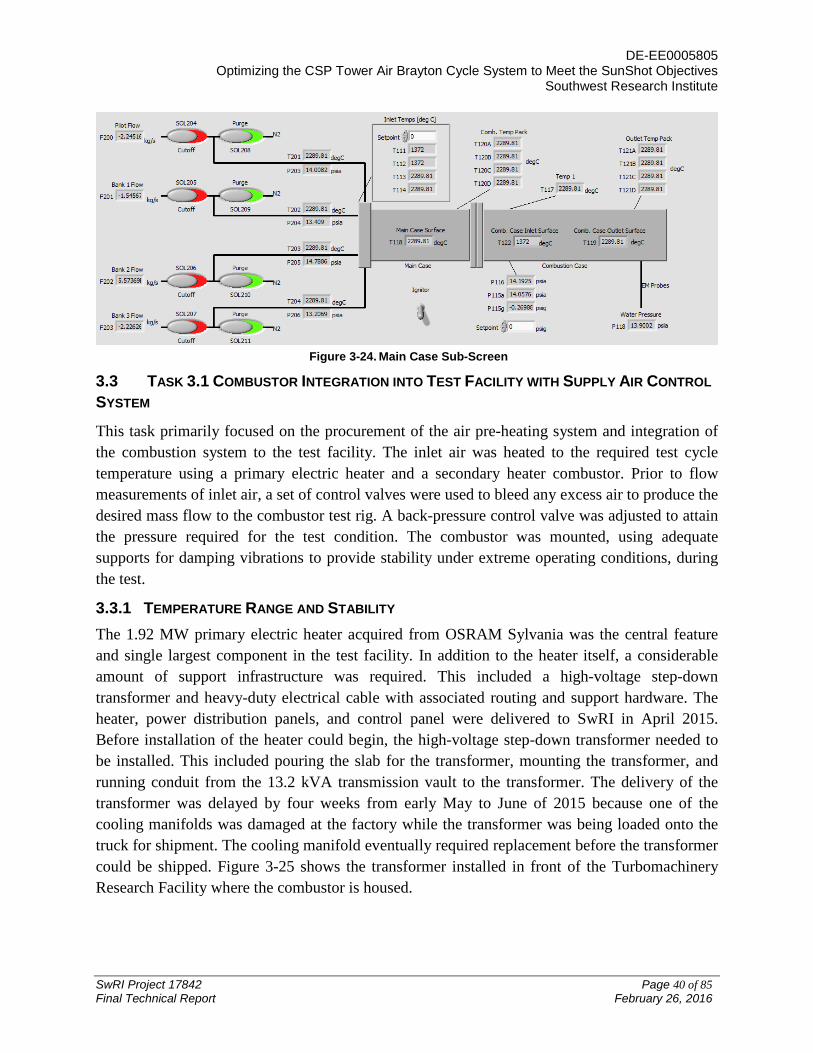
DE-EE0005805 Optimizing the CSP Tower Air Brayton Cycle System to Meet the SunShot Objectives
Southwest Research Institute
SwRI Project 17842 Page 40 of 85 Final Technical Report February 26, 2016
Figure 3-24. Main Case Sub-Screen
TASK 3.1 COMBUSTOR INTEGRATION INTO TEST FACILITY WITH SUPPLY AIR CONTROL 3.3SYSTEM
This task primarily focused on the procurement of the air pre-heating system and integration of the combustion system to the test facility. The inlet air was heated to the required test cycle temperature using a primary electric heater and a secondary heater combustor. Prior to flow measurements of inlet air, a set of control valves were used to bleed any excess air to produce the desired mass flow to the combustor test rig. A back-pressure control valve was adjusted to attain the pressure required for the test condition. The combustor was mounted, using adequate supports for damping vibrations to provide stability under extreme operating conditions, during the test.
3.3.1 TEMPERATURE RANGE AND STABILITY The 1.92 MW primary electric heater acquired from OSRAM Sylvania was the central feature and single largest component in the test facility. In addition to the heater itself, a considerable amount of support infrastructure was required. This included a high-voltage step-down transformer and heavy-duty electrical cable with associated routing and support hardware. The heater, power distribution panels, and control panel were delivered to SwRI in April 2015. Before installation of the heater could begin, the high-voltage step-down transformer needed to be installed. This included pouring the slab for the transformer, mounting the transformer, and running conduit from the 13.2 kVA transmission vault to the transformer. The delivery of the transformer was delayed by four weeks from early May to June of 2015 because one of the cooling manifolds was damaged at the factory while the transformer was being loaded onto the truck for shipment. The cooling manifold eventually required replacement before the transformer could be shipped. Figure 3-25 shows the transformer installed in front of the Turbomachinery Research Facility where the combustor is housed.

DE-EE0005805 Optimizing the CSP Tower Air Brayton Cycle System to Meet the SunShot Objectives
Southwest Research Institute
SwRI Project 17842 Page 41 of 85 Final Technical Report February 26, 2016
Figure 3-25. High-Voltage Step-Down Transformer
Connection from the transformer to the power distribution panels required trenching and positioning rigid conduit in the trench and then running eighteen lines of DLO 444.4 cable approximately 100 feet through the conduit. To connect the power distribution panels to the heater required running eighteen lines of DLO 444.4 cable on cable trays approximately 130 feet from the electrical room to the combustor lab. The weight of the cables, 40 pounds per ten feet, required that the cable tray be firmly secured to the building and, in some places, such as above the combustor lab, an additional support structure was required. The installation of the heater, including the electrical wiring and associated support infrastructure took six months and the heater was ready for commissioning in mid-September 2015.
Due to delays in the delivery of the combustor housing and the refractory inserts, it was decided to proceed with commissioning of the heater without the combustor case in line. The flow loop was completed with several pieces of pipe that were available from previous projects. Since the quench water was injected through the exhaust reducer housing, an alternate quench injector was fabricated for this test.
On September 15, 2015 representatives from OSRAM Sylvania Process Heat and SwRI personnel commissioned the primary heater. During commissioning, the process temperature reached a maximum of 802°C, a maximum mass flow rate of 2.1 kg/s and maximum pressure of 7.8 bar. This testing demonstrated the ability of the heater to meet temperature and flow conditions at the heater exit. The upper limit of pressure operating conditions was not fully demonstrated due to a malfunction in the back-pressure valve feedback control unit. There was concern that manual operation of the valve might cause the back pressure in the combustor to suddenly increase and send the compressor into surge.

DE-EE0005805 Optimizing the CSP Tower Air Brayton Cycle System to Meet the SunShot Objectives
Southwest Research Institute
SwRI Project 17842 Page 42 of 85 Final Technical Report February 26, 2016
Integration of the combustor and test stand continued as the final components, combustor case, refractory insert, and injector, were delivered to SwRI. The combustor test facility was fully assembled and ready to continue integration testing on November 10, 2015. This included the work covered by Task 3.2 Combustor No-Heat Flow Test, which is discussed in the following section.
On November 17, 2015, operation of the facility with the combustor case installed and the primary heater in use was began. Figure 3-26 shows the mass flow through the combustor as measured by the orifice flow meter run on the inlet piping and the measured inlet temperatures on the combustor. The locations of the thermocouples were as follows; T106 was located just upstream of the flange of the inlet case of the combustor and T113 and T114 were located just upstream of the injector.
Figure 3-26. Combustor Integration Test Results
Note the sudden dip in temperature in Figure 3-26. This was the result of tripping a temperature over-limit switch on the primary heater. Tripping a temperature over-limit switch cuts power to the heating elements in the heater and were there fuel flowing to either the injector or secondary heater, the fuel would be cut off. This would also set a fault that must be cleared before the heater can be re-engaged, but does not affect the compressor and other systems. This is due to
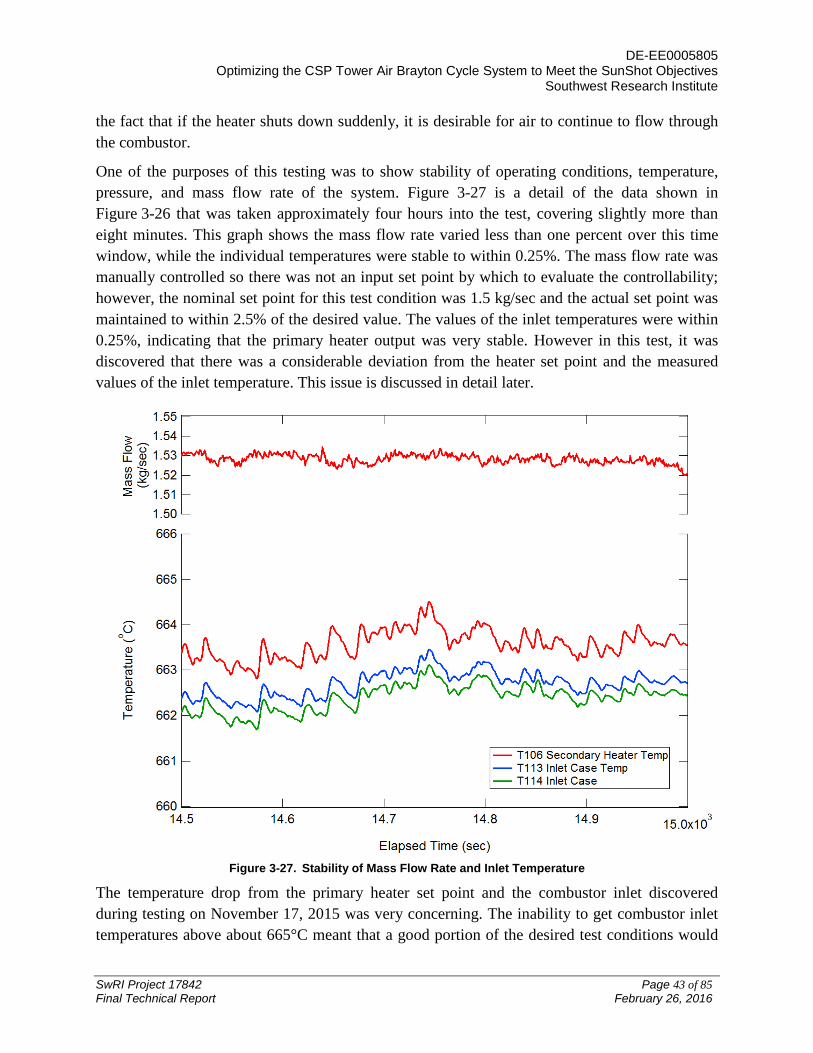
DE-EE0005805 Optimizing the CSP Tower Air Brayton Cycle System to Meet the SunShot Objectives
Southwest Research Institute
SwRI Project 17842 Page 43 of 85 Final Technical Report February 26, 2016
the fact that if the heater shuts down suddenly, it is desirable for air to continue to flow through the combustor.
One of the purposes of this testing was to show stability of operating conditions, temperature, pressure, and mass flow rate of the system. Figure 3-27 is a detail of the data shown in Figure 3-26 that was taken approximately four hours into the test, covering slightly more than eight minutes. This graph shows the mass flow rate varied less than one percent over this time window, while the individual temperatures were stable to within 0.25%. The mass flow rate was manually controlled so there was not an input set point by which to evaluate the controllability; however, the nominal set point for this test condition was 1.5 kg/sec and the actual set point was maintained to within 2.5% of the desired value. The values of the inlet temperatures were within 0.25%, indicating that the primary heater output was very stable. However in this test, it was discovered that there was a considerable deviation from the heater set point and the measured values of the inlet temperature. This issue is discussed in detail later.
Figure 3-27. Stability of Mass Flow Rate and Inlet Temperature
The temperature drop from the primary heater set point and the combustor inlet discovered during testing on November 17, 2015 was very concerning. The inability to get combustor inlet temperatures above about 665°C meant that a good portion of the desired test conditions would

DE-EE0005805 Optimizing the CSP Tower Air Brayton Cycle System to Meet the SunShot Objectives
Southwest Research Institute
SwRI Project 17842 Page 44 of 85 Final Technical Report February 26, 2016
not be achievable. Therefore, the cause of the nearly 140°C temperature drop from the primary heater to the combustor needed to be identified and a solution implemented. The following list of possible causes was generated:
1. Incorrect measurement from the control thermocouple 2. Unfavorable velocity distribution through the heating elements 3. Excessive heat loss between heater and combustor
Several actions were taken to address the first item on the list, incorrect measurement from the control thermocouple. During the November 17th test, it was observed that the output of the thermocouple beads not in use by the primary heater controller were not being displayed in the control room or being recorded by the data acquisition system. The first action was to connect the output of the heater thermocouples to the data system to be monitored and recorded. These additions to the data system provided more information about the heater operation and aided in understanding the source of the problem.
The heater supplier, OSRAM Sylvania was contacted to inquire if they had experienced similar issues on other installations and if they could suggest a remedy. OSRAM Sylvania suggested changing which thermocouple was used as the control and suggested that the high temperature limit switches could also be adjusted to a higher value, up to around 900°C without endangering the heater. Changing the control thermocouple was a matter of disconnecting and reconnecting wires in the heater control panel and was done several times during the test program to aid the test operators in monitoring and controlling the heater. All temperature over-limit switches were adjusted to 900°C with the use of a digital thermocouple simulator/reader.
It was speculated that the temperature difference from the heater to the combustor could be caused by the air flowing more freely through the center of the heater at a lower temperature and the air near the outer diameter of the heater being more restricted and recirculating, thus, experiencing more heating. This concept came about as the result of heater outlet configuration. In the original design of the piping, the connection from the heater to the combustor included a transition piece from the larger diameter heater (22 inches) to the smaller diameter combustor inlet pipe (6 inches). Due to the high temperature of the heater outlet, the transition piece needed to be fabricated from a high-temperature material, such as Inconel or stainless steel. At the start of the current phase, when this piece was being sourced, most potential suppliers declined quoting and the few quotes received were five times greater than the budget line item for this component. An alternative design that consisted of a blind flange of ANSI standard dimensions for 22 inches with a hole machined in the center and a six inch diameter pipe welded to the hole and an ANSI standard six-inch 300# class flange at the other end was conceived. For this piece, both flange and pipe would be made from stainless steel 304H. Even though the dimensions were to ANSI standard for 22-inch 300# class pipe, due to the infrequent use of 22-inch pipe and the uncommon material, the blind flange was custom fabricated by CCC Group, Inc. The cost of the component following this design fit within the original budget estimate.

DE-EE0005805 Optimizing the CSP Tower Air Brayton Cycle System to Meet the SunShot Objectives
Southwest Research Institute
SwRI Project 17842 Page 45 of 85 Final Technical Report February 26, 2016
It was proposed that the difference in temperature was due to a relatively higher velocity core flowing through the heater directly into the pipe with a recirculation region around the outer diameter, where air would be relatively stagnant. This could lead to an erroneous signal from the control thermocouple if it were sufficiently immersed in the recirculation region. The corrective action identified for this was fabrication and installation of a baffle that would enhance mixing in the heater between the heating elements and the outlet. This baffle was constructed from a frame made of Haynes 230 tubing with stainless steel mesh screens overlapping to create variable regions of flow resistance, similar to the distortion screens used in testing aircraft engines.
The third possible cause of the low combustor inlet temperature was excessive heat loss between the heater and the combustor. This heat loss could have been through the pipe walls and flanges between the heater and the combustor inlet. The heat transfer in this section of pipe could have been significant due to the high temperature difference, approximately 700°C, between hot gas and the ambient room air and the high convective heat transfer coefficient inside the pipe due to high flow velocities. Mitigating factors were the relatively small heat transfer area of the pipe surfaces, the relatively low thermal conductivity of the stainless steel, and the relatively low convective heat transfer coefficient from the quiescent room air. The corrective action for this source of heat loss was to insulate the pipe between heater and the combustor. The insulation material that was used was Utilicore HP5 Mat purchased from Trident Distributors in San Antonio, TX. Utilicore is a fiberglass blanket-like sheet fabricated by Owens Corning. Two layers were used on the piping.
Due to the pressing nature of the schedule, to get the facility fully commissioned and begin combustor testing as soon as possible, all of the identified corrective actions were implemented following the November 17th testing. Changing the control thermocouple, adding the new thermocouple and routing signals from existing thermocouples, as well as insulating the pipe were tasks that could be done in a short amount of time and were completed within a day of the decision to proceed. Fabrication and installation of the baffle in the heater was the most substantial effort, as it required removal of the 22-inch flange to gain access to the heater. This process took several days and the next test was conducted on November 20, 2015. Figure 3-28 shows the temperatures in the heater (T132, T133 and T134) and same inlet temperature sensors as Figure 3-26.

DE-EE0005805 Optimizing the CSP Tower Air Brayton Cycle System to Meet the SunShot Objectives
Southwest Research Institute
SwRI Project 17842 Page 46 of 85 Final Technical Report February 26, 2016
Figure 3-28. Heater and Combustor Inlet Temperature
A detailed view of the temperatures in the heater and the combustor inlet is shown in Figure 3-29. With the addition of the output to the control thermocouples, it could be seen that there was a variation in temperature in the heater thermocouples. Further investigation showed that this was most likely due to the thermocouple bead alignment relative to the heating elements. Some of the heater thermocouples were aligned directly with a heating element and some were offset from the nearest element. This resulted in the variations in the local temperature measured by any given sensor. SwRI consulted OSRAM Sylvania on the matter; they acknowledge the phenomenon and instructed that best practice was to control using a sensor that displayed a temperature about in the middle of the range. Further OSRAM Sylvania assured SwRI that the design of the heater included sufficient operational margin that the temperatures greater than the control thermocouple posed no danger to the heater components and reassured SwRI that the heater was indeed capable of operating safely at set-point temperatures as high as 900°C.
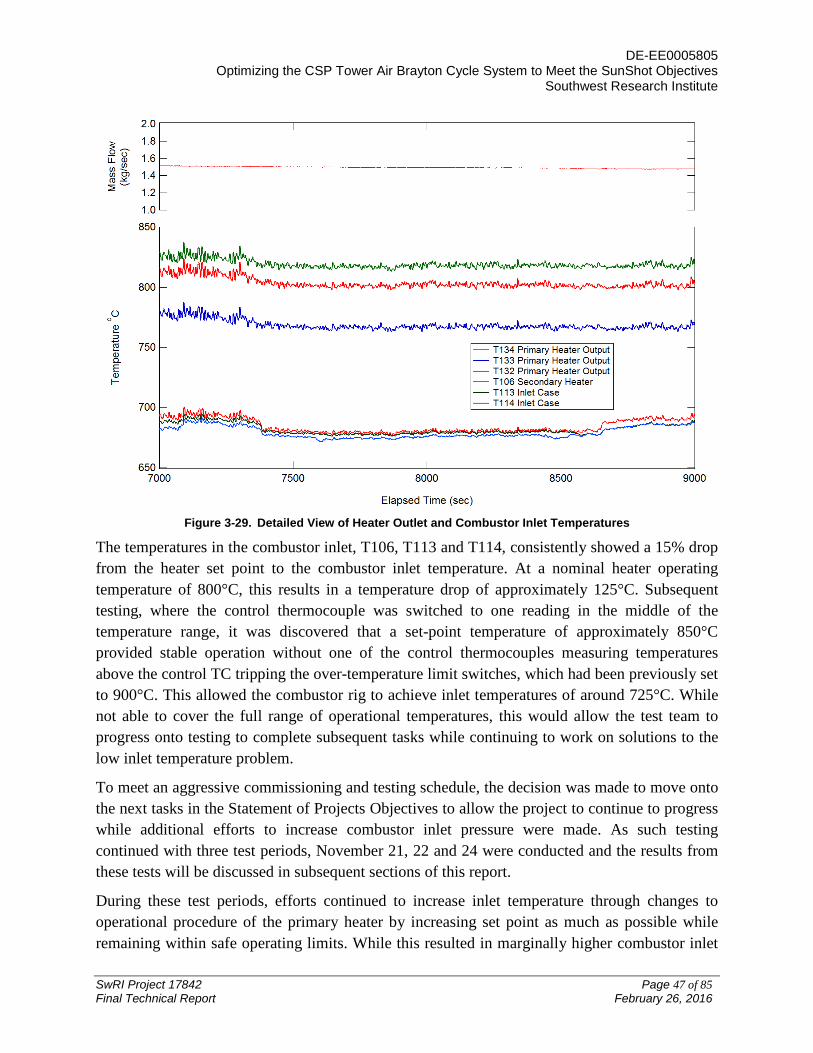
DE-EE0005805 Optimizing the CSP Tower Air Brayton Cycle System to Meet the SunShot Objectives
Southwest Research Institute
SwRI Project 17842 Page 47 of 85 Final Technical Report February 26, 2016
Figure 3-29. Detailed View of Heater Outlet and Combustor Inlet Temperatures
The temperatures in the combustor inlet, T106, T113 and T114, consistently showed a 15% drop from the heater set point to the combustor inlet temperature. At a nominal heater operating temperature of 800°C, this results in a temperature drop of approximately 125°C. Subsequent testing, where the control thermocouple was switched to one reading in the middle of the temperature range, it was discovered that a set-point temperature of approximately 850°C provided stable operation without one of the control thermocouples measuring temperatures above the control TC tripping the over-temperature limit switches, which had been previously set to 900°C. This allowed the combustor rig to achieve inlet temperatures of around 725°C. While not able to cover the full range of operational temperatures, this would allow the test team to progress onto testing to complete subsequent tasks while continuing to work on solutions to the low inlet temperature problem.
To meet an aggressive commissioning and testing schedule, the decision was made to move onto the next tasks in the Statement of Projects Objectives to allow the project to continue to progress while additional efforts to increase combustor inlet pressure were made. As such testing continued with three test periods, November 21, 22 and 24 were conducted and the results from these tests will be discussed in subsequent sections of this report.
During these test periods, efforts continued to increase inlet temperature through changes to operational procedure of the primary heater by increasing set point as much as possible while remaining within safe operating limits. While this resulted in marginally higher combustor inlet

DE-EE0005805 Optimizing the CSP Tower Air Brayton Cycle System to Meet the SunShot Objectives
Southwest Research Institute
SwRI Project 17842 Page 48 of 85 Final Technical Report February 26, 2016
temperatures, it also resulted in unstable system behavior that was prone to tripping the temperature over-limit switches.
As SwRI personnel gained operation experience with the combustor facility and the characteristics of the various components, it was remarked that the inlet piping and even the combustor case exhibited extensive discoloration from heating during operation. The heater, however, showed almost no discoloration. This included the bling flange transition piece. This was somewhat of a surprise because the heated air was impinging directly on the inner face of the flange at the temperature indicated by the heater control thermocouples. It was suggested that the flange on the heater outlet was acting as a heat sink and that the heat loss that resulted in the low combustor inlet temperature was the result. The flange heat sink theory had several compelling factors; the mass of the flange would allow it to absorb a large amount of energy with a minimal increase in temperature, the surface area for heat transfer, both on the inner surface and the external surface, was quite large, with the air on the convective heat transfer coefficient on the inner surface having the potential to be quite high due to air velocity and material properties.
To limit the heat loss through the heater flange, a refractory insert was made of Uniform A1A, a machinable ceramic material purchased from ZIRCAR Ceramics, Inc. of Florida, NY. The insert was composed of three disks of Uniform A1A cut to fit snugly in the heater. The central hole of each disk was cut with a bevel such that when the three disks were assembled, the central hole formed a smooth transition from inner diameter of heater pressure containment vessel to the six-inch diameter hole in the flange where the pipe to the heater connected.
Figure 3-30. Primary Heater Ceramic Refractory Insert

DE-EE0005805 Optimizing the CSP Tower Air Brayton Cycle System to Meet the SunShot Objectives
Southwest Research Institute
SwRI Project 17842 Page 49 of 85 Final Technical Report February 26, 2016
Figure 3-30 is a photograph of the refractory insert as it was being installed in the primary heater. The notches visible on the outer diameter allowed the control thermocouples mounted in the heater pressure vessel to penetrate.
In addition to the refractory insert, a new thermocouple was added to the data system to measure the temperature in the pipe connecting the primary heater to the combustor. Due to the difficulty in machining a new instrumentation port into the pipe, a spacer with an instrumentation port machined in it was designed to fit into the spacer in the flange approximately three feet along the inlet pipe. A type-K thermocouple was installed in the spacer and the output sent to the data system. These modifications were ready for use in the test period conducted on November 27, 2015. Figure 3-31 shows the temperature of the heater, inlet pipe, and combustor inlet after the installation of the refractory insert. A detailed view of the temperature of the primary heater and combustor inlet temperatures, including the new thermocouple installed in the inlet pipe, is provided in Figure 3-32.
Figure 3-31. Combustor Inlet Temperature after Heater Insert
In Figure 3-32, it can be seen that there was a temperature difference between the heater set point and the combustor inlet temperatures, T113 and T114. However, to achieve a combustor inlet temperature of 800°C, the set point need only be 840°C, within the safe operating conditions of the primary heater. On the left hand side of the figure, the temperature traces for the combustor inlet (T106, T113 and T114) can be seen approaching the level of the inlet pipe (T135). The combustor inlet temperature takes longer to come up to the steady-state temperature due to the

DE-EE0005805 Optimizing the CSP Tower Air Brayton Cycle System to Meet the SunShot Objectives
Southwest Research Institute
SwRI Project 17842 Page 50 of 85 Final Technical Report February 26, 2016
thermal inertia of the combustor case and refractory liner. Eventually, the steady-state temperature of the system is reached and remains stable. The steady-state combustor inlet temperature still exhibited a temperature drop from the primary heater control thermocouples; however, the thermocouple in the inlet piping between the heater and the combustor had the same temperature as the inlet temperatures in the combustor case. This indicates that the heat loss responsible for the temperature difference took place in between the heater thermocouples and the location of the thermocouple in the first flange in the inlet pipe. Since the maximum combustor inlet temperature from use, exclusively, of the primary heater had been reached, this demonstrates full functional capability.
Figure 3-32. Detail of Primary Heater and Combustor Inlet Temperatures
With the combustor inlet temperature capable of reaching 800°C, the secondary heater, designed to take advantage of the high inlet temperature to ignite the fuel is able to operate. The secondary heater operation was demonstrated during the test period on December 4, 2015. Figure 3-33 shows the heater and inlet temperatures for the first test run, where operation of the secondary heater was demonstrated. Combustor inlet temperatures of 900°C and 950°C were reached and maintained while the primary heater set point held the air temperature entering the secondary heater at 800°C.

DE-EE0005805 Optimizing the CSP Tower Air Brayton Cycle System to Meet the SunShot Objectives
Southwest Research Institute
SwRI Project 17842 Page 51 of 85 Final Technical Report February 26, 2016
Figure 3-33. Combustor Rig Inlet Temperatures with Secondary Heater Operation
Figure 3-34 and Figure 3-35 show the temperature distribution through the combustor rig from the primary heater to the upstream side of the injector. Figure 3-34 is for a secondary heater set point of 900°C and Figure 3-35 is for a secondary heater set point of 950°C. Thermocouple T106 is named Secondary Heater and the original intent was for the measurement from this sensor to be used in the closed-loop feedback system for the secondary heater fuel pump. However, the temperature immediately upstream of the injector (T113) was used instead. It was realized that the temperature of the air entering the injector needed to be regulated. From the traces in Figure 3-34 and Figure 3-35, it is clear that the combustion of the fuel in the secondary heater was not complete at the location of T106, as evidenced by the rise in temperature from T106 to T113 and T114. There was also less fluctuation in the temperatures at T113 and T114 than at T106, another reason for selecting one of them as the feedback control signal.
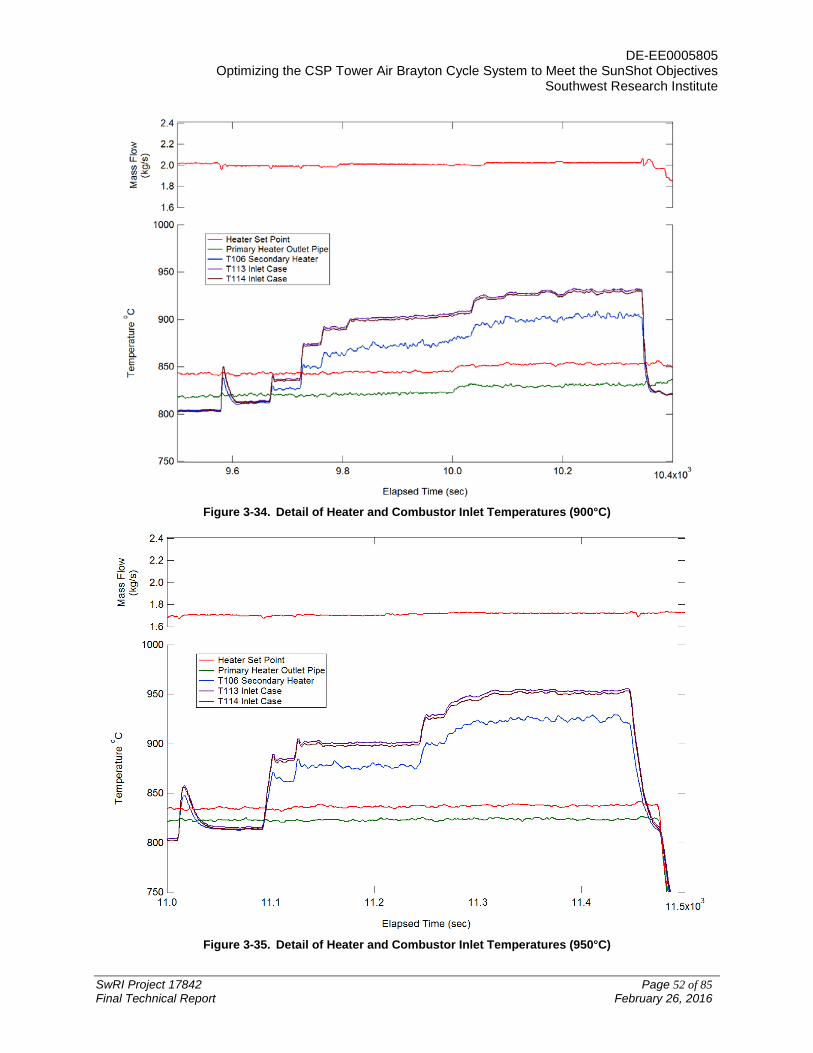
DE-EE0005805 Optimizing the CSP Tower Air Brayton Cycle System to Meet the SunShot Objectives
Southwest Research Institute
SwRI Project 17842 Page 52 of 85 Final Technical Report February 26, 2016
Figure 3-34. Detail of Heater and Combustor Inlet Temperatures (900°C)
Figure 3-35. Detail of Heater and Combustor Inlet Temperatures (950°C)
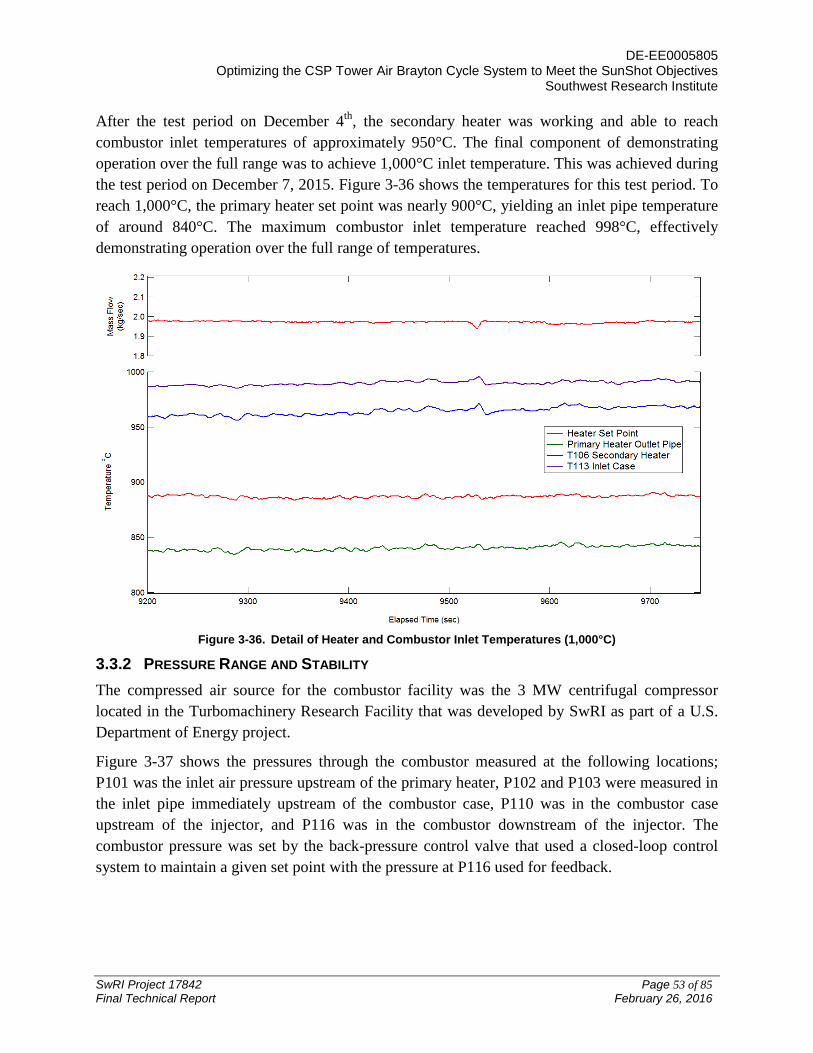
DE-EE0005805 Optimizing the CSP Tower Air Brayton Cycle System to Meet the SunShot Objectives
Southwest Research Institute
SwRI Project 17842 Page 53 of 85 Final Technical Report February 26, 2016
After the test period on December 4th, the secondary heater was working and able to reach combustor inlet temperatures of approximately 950°C. The final component of demonstrating operation over the full range was to achieve 1,000°C inlet temperature. This was achieved during the test period on December 7, 2015. Figure 3-36 shows the temperatures for this test period. To reach 1,000°C, the primary heater set point was nearly 900°C, yielding an inlet pipe temperature of around 840°C. The maximum combustor inlet temperature reached 998°C, effectively demonstrating operation over the full range of temperatures.
Figure 3-36. Detail of Heater and Combustor Inlet Temperatures (1,000°C)
3.3.2 PRESSURE RANGE AND STABILITY The compressed air source for the combustor facility was the 3 MW centrifugal compressor located in the Turbomachinery Research Facility that was developed by SwRI as part of a U.S. Department of Energy project.
Figure 3-37 shows the pressures through the combustor measured at the following locations; P101 was the inlet air pressure upstream of the primary heater, P102 and P103 were measured in the inlet pipe immediately upstream of the combustor case, P110 was in the combustor case upstream of the injector, and P116 was in the combustor downstream of the injector. The combustor pressure was set by the back-pressure control valve that used a closed-loop control system to maintain a given set point with the pressure at P116 used for feedback.
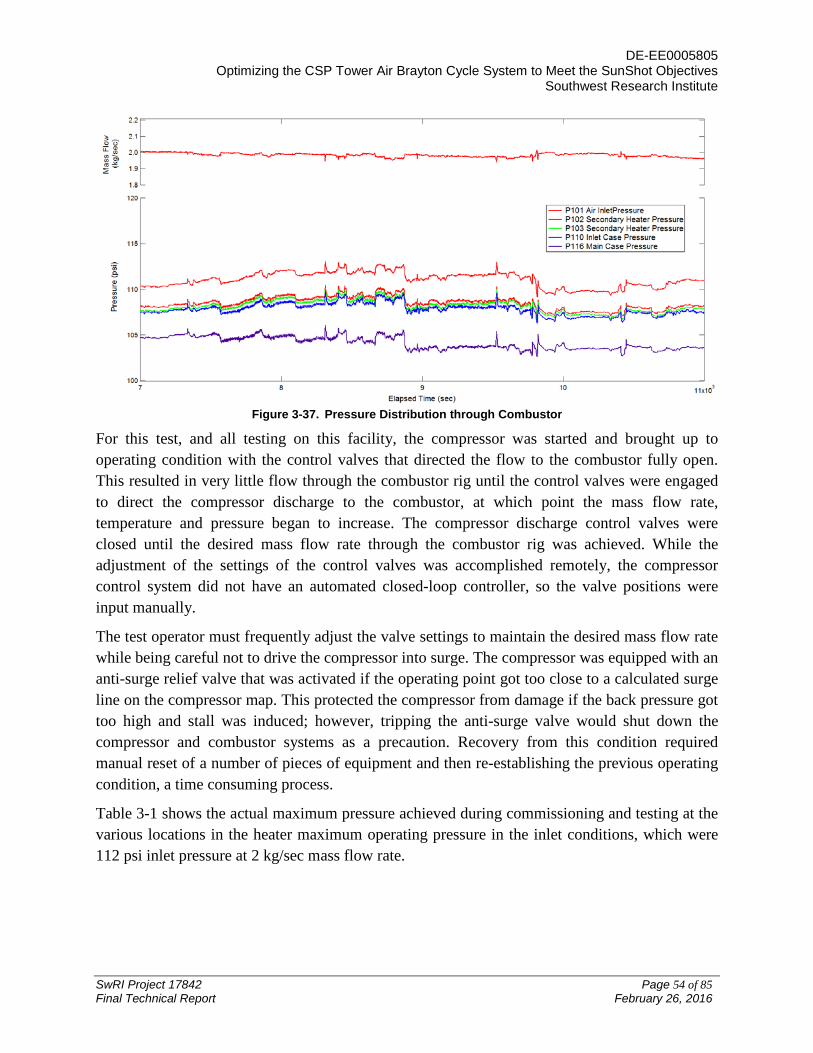
DE-EE0005805 Optimizing the CSP Tower Air Brayton Cycle System to Meet the SunShot Objectives
Southwest Research Institute
SwRI Project 17842 Page 54 of 85 Final Technical Report February 26, 2016
Figure 3-37. Pressure Distribution through Combustor
For this test, and all testing on this facility, the compressor was started and brought up to operating condition with the control valves that directed the flow to the combustor fully open. This resulted in very little flow through the combustor rig until the control valves were engaged to direct the compressor discharge to the combustor, at which point the mass flow rate, temperature and pressure began to increase. The compressor discharge control valves were closed until the desired mass flow rate through the combustor rig was achieved. While the adjustment of the settings of the control valves was accomplished remotely, the compressor control system did not have an automated closed-loop controller, so the valve positions were input manually.
The test operator must frequently adjust the valve settings to maintain the desired mass flow rate while being careful not to drive the compressor into surge. The compressor was equipped with an anti-surge relief valve that was activated if the operating point got too close to a calculated surge line on the compressor map. This protected the compressor from damage if the back pressure got too high and stall was induced; however, tripping the anti-surge valve would shut down the compressor and combustor systems as a precaution. Recovery from this condition required manual reset of a number of pieces of equipment and then re-establishing the previous operating condition, a time consuming process.
Table 3-1 shows the actual maximum pressure achieved during commissioning and testing at the various locations in the heater maximum operating pressure in the inlet conditions, which were 112 psi inlet pressure at 2 kg/sec mass flow rate.

DE-EE0005805 Optimizing the CSP Tower Air Brayton Cycle System to Meet the SunShot Objectives
Southwest Research Institute
SwRI Project 17842 Page 55 of 85 Final Technical Report February 26, 2016
Table 3-1. Maximum Pressure and Pressure Differences in Combustor Facility
Maximum Pressure (psia) Average ΔP (psid) Heater Inlet (P101)
112 ---
Combustor Inlet (P113)
109.5 2.56 (to Comb. Inlet)
Combustor Exit (P116)
105.5 3.71 (to Comb. Chamber)
Total --- 6.95 (Heater Inlet to Combustor Exit)
3.3.3 MASS FLOW RATE The desired capability of the facility is to provide primary air mass flow rates in excess of 2.0 kg/sec with specific operating points with mass flow rates of 1.4, 1.7 and 2.0 kg/sec. Figure 3-38 shows the mass flow rate through the combustor facility as the operating set point was changed from 2.0 to 1.7, then to 1.4 kg/sec.
Figure 3-38. Mass Flow Rate through the Combustor Test Facility
TASK 3.2 COMBUSTOR NO-HEAT FLOW TEST 3.4
This task consisted of conducting a no-heat flow test to determine the actual pressure-mass-flow operating points for the combustor. This test was conducted using the bypass and back-pressure control valves in the test facility. This task recorded the pressure drop across the combustor rig as a function of mass flow at ambient air temperatures. The data were considered while formulating the test matrix for the emissions and thermal cycling tests in Task 3.7.
Considerable testing was performed to demonstrate the pressure-mass-flow characteristics of the combustor rig integrated into the test facility. Due to the manual control scheme of the research compressor that was the air source for the combustor facility, shakedown testing for adjusting the settings of the control valves on the compressor bypass required several test periods. Three periods for flow testing with no-heating were performed between November 10 and 16,, 2015. Figure 3-39 shows the mass flow rate and pressures through the combustor for a typical no-heat

DE-EE0005805 Optimizing the CSP Tower Air Brayton Cycle System to Meet the SunShot Objectives
Southwest Research Institute
SwRI Project 17842 Page 56 of 85 Final Technical Report February 26, 2016
flow test. These tests were used to tune the back-pressure valve closed-loop control systems settings and the compressor bypass valve settings.
Figure 3-39. No-Heat Flow Testing in the Combustor Test Facility
TASK 3.3 FUEL SUPPLY AND CONTROL SYSTEM 3.5
The purpose of this task was to verify and commission the fuel supply and control system. The fuel supply to each injector was controlled by individual calibrated mass flow control valves. In addition to the mass flow controllers, fuel-pressure was also monitored in each line for individual injectors during the test.
Throughout the test facility fabrication portion of this project, the fuel supply and control system underwent repeated testing. Immediately after the fuel supply panel was assembled, the operation of the solenoid valves was verified manually. Testing of the fuel mass flow controllers was carried out using carbon dioxide as a substitute for the fuel. These test consisted of pressurizing the fuel inlet with bottled CO2 regulated to 500 psi and exhausting the CO2 through the valve under test into a pressure vessel, allowing the ability to control back pressure. The mass flow controllers were each remotely controlled with LabVIEW and communication and function were verified for each controller. During the course of this testing, it was discovered that one of the flow controllers was not functioning properly and was returned to the vendor, Teledyne Industries, for evaluation and repair.
When the combustor was fully assembled and the fuel line connected to the supply system, the operation of all of the control valves, solenoid shut-off, and mass flow control were exercised with the facility control system. This initial checkout was performed with compressed air as a
DE-EE0005805 Optimizing the CSP Tower Air Brayton Cycle System to Meet the SunShot Objectives
Southwest Research Institute
SwRI Project 17842 Page 57 of 85 Final Technical Report February 26, 2016
substitute for the fuel and the nitrogen line connected for the purge system to flush the fuel lines when demand for the fuel was cut off by the control system.
During the testing conducted as part of Task 3.5 Preliminary Combustion Tests, the fuel control system operation was verified connected to the actual fuel system. The control system was based on lookup tables for fuel flow rate as a function of inlet air mass flow rate and inlet temperature. Based on the lookup tables, the fuel mass flow control valves responded to fuel demand with a closed-loop feedback system. During the initial combustion testing, the closed-loop control system parameters were tuned to optimize combustor operation.
TASK 3.4 EMISSIONS ANALYZERS: SET-UP, CALIBRATION AND MEASUREMENTS 3.6
Emissions were measured using an E-Instruments E5500 flue gas analyzer and a Nicolet 670 FTIR spectrometer. For this testing, the FTIR spectrometer was calibrated daily for the following components: CO, CO2, NO, NO2, ethane, methane and water. This instrument served as a comparison standard for the E5500 for these gas mixture components. It was recommended by the manufacturer that the factory calibration of the E5500, which was used to measure O2, be repeated annually. At the time that the E5500 was integrated into the combustor facility, the calibration was due. However, due to the compressed test schedule, it was decided that the ambient O2 reading would be used to validate the sensor readings.
When the E5500 was integrated into the combustor rig, the reading from the oxygen sensor exhibited a tendency to drift. When the instrument was initialized and performed startup calibration, the oxygen reading showed 21% O2 in the ambient air present in the sampling line. However, over the course of several minutes, without any other changes to the environment, i.e., starting the combustor facility, the O2 reading began to decrease. Over the period of about half an hour, the oxygen sensor reading would settle in to values of approximately 15%. SwRI personnel attempted to troubleshoot faults from the instrument without success, so the manufacturer was contacted about calibrating the sensor. After discussion with E-Instruments personnel, it was determined that the behavior of the O2 sensor was not due to a calibration issue, but instead, the sensor head needed to be replaced. A new sensor head was ordered and expedited for delivery. As such, the instrument with the new sensor head was only available for use in testing for the final two test periods.
TASK 3.5 PRELIMINARY COMBUSTION TESTS: IGNITION, FUEL SEQUENCING AND 3.7OPERATION TROUBLESHOOTING This task was to determine the ignition characteristics of the combustor. The task focused on optimizing the sequence of injector operation. The number of operating injectors and their locations primarily determine emissions characteristics and temperature distribution of the liner. Testing proceeded by increasing the inlet temperature, simulating air heated by the solar field with the ultimate goal of demonstrating that the combustor can deliver the required temperature rise across the anticipated operating range from 600°C to 1,000°C.
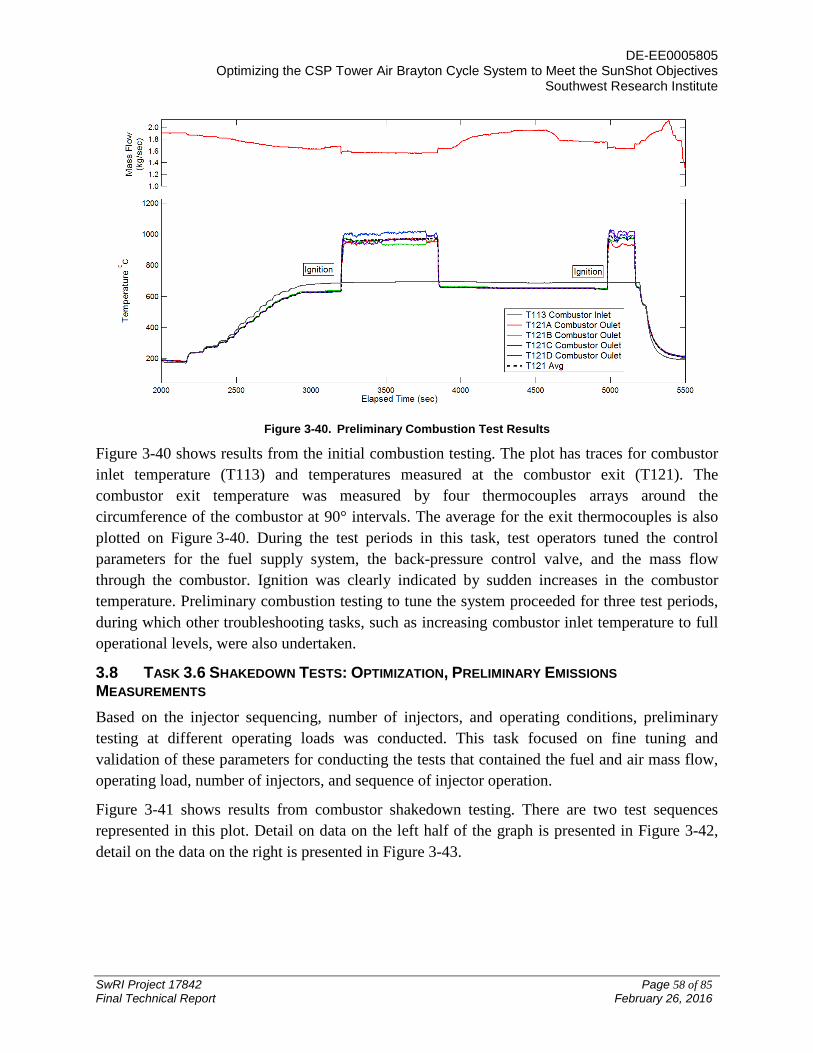
DE-EE0005805 Optimizing the CSP Tower Air Brayton Cycle System to Meet the SunShot Objectives
Southwest Research Institute
SwRI Project 17842 Page 58 of 85 Final Technical Report February 26, 2016
Figure 3-40. Preliminary Combustion Test Results
Figure 3-40 shows results from the initial combustion testing. The plot has traces for combustor inlet temperature (T113) and temperatures measured at the combustor exit (T121). The combustor exit temperature was measured by four thermocouples arrays around the circumference of the combustor at 90° intervals. The average for the exit thermocouples is also plotted on Figure 3-40. During the test periods in this task, test operators tuned the control parameters for the fuel supply system, the back-pressure control valve, and the mass flow through the combustor. Ignition was clearly indicated by sudden increases in the combustor temperature. Preliminary combustion testing to tune the system proceeded for three test periods, during which other troubleshooting tasks, such as increasing combustor inlet temperature to full operational levels, were also undertaken.
TASK 3.6 SHAKEDOWN TESTS: OPTIMIZATION, PRELIMINARY EMISSIONS 3.8MEASUREMENTS Based on the injector sequencing, number of injectors, and operating conditions, preliminary testing at different operating loads was conducted. This task focused on fine tuning and validation of these parameters for conducting the tests that contained the fuel and air mass flow, operating load, number of injectors, and sequence of injector operation.
Figure 3-41 shows results from combustor shakedown testing. There are two test sequences represented in this plot. Detail on data on the left half of the graph is presented in Figure 3-42, detail on the data on the right is presented in Figure 3-43.
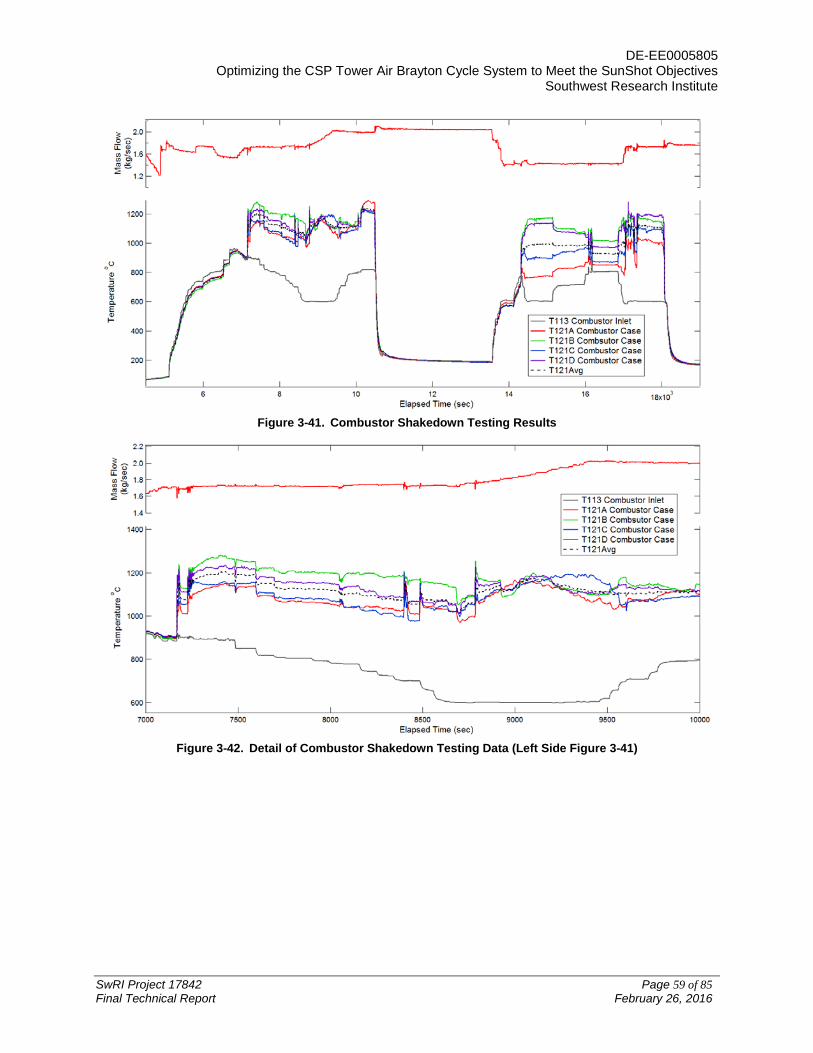
DE-EE0005805 Optimizing the CSP Tower Air Brayton Cycle System to Meet the SunShot Objectives
Southwest Research Institute
SwRI Project 17842 Page 59 of 85 Final Technical Report February 26, 2016
Figure 3-41. Combustor Shakedown Testing Results
Figure 3-42. Detail of Combustor Shakedown Testing Data (Left Side Figure 3-41)

DE-EE0005805 Optimizing the CSP Tower Air Brayton Cycle System to Meet the SunShot Objectives
Southwest Research Institute
SwRI Project 17842 Page 60 of 85 Final Technical Report February 26, 2016
Figure 3-43. Detail of Combustor Shakedown Testing Data (Right Side Figure 3-41)
Note the distribution of combustor exhaust temperatures in Figure 3-41, indicating that this injector had a distinct pattern factor of combustion. The spread of temperatures was greater later in the testing (right hand side of Figure 3-41) and shown in Figure 3-43. It is likely that the uneven distribution of temperature in the combustor was due to leakage between the banks of the injector at the various operating conditions. This is discussed later in this report.
TASK 3.7 ENDURANCE AND STABILITY TEST: EFFECT OF THERMAL CYCLING ON LINER 3.9TEMPERATURE AND EMISSIONS The purpose of this task was to perform endurance and stability testing. The testing covered a wide range of operating conditions and at durations of the various states, which were adequate to confirm the combustor performance as determined previously. The test matrix included testing across the operational space from part-load to full load. The testing included an inlet air temperature cycle varying between 600°C and 1,000°C. Combustor temperature and emissions were monitored throughout the test. Figure 3-44 and Figure 3-45 show the results from the two test periods of the fully commissioned combustor facility covering the range of inlet temperatures from 600°C to 1,000°C and combustor mass flow rates of 1.4, 1.7, and 2.0 kg/sec.
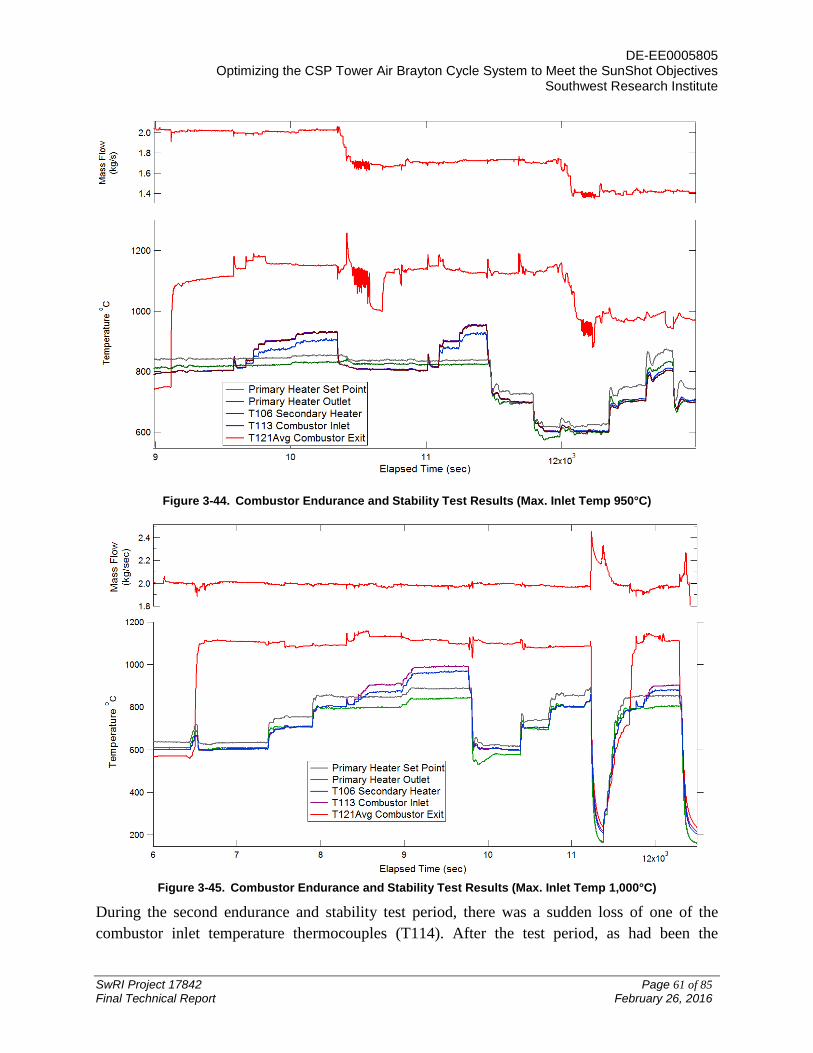
DE-EE0005805 Optimizing the CSP Tower Air Brayton Cycle System to Meet the SunShot Objectives
Southwest Research Institute
SwRI Project 17842 Page 61 of 85 Final Technical Report February 26, 2016
Figure 3-44. Combustor Endurance and Stability Test Results (Max. Inlet Temp 950°C)
Figure 3-45. Combustor Endurance and Stability Test Results (Max. Inlet Temp 1,000°C)
During the second endurance and stability test period, there was a sudden loss of one of the combustor inlet temperature thermocouples (T114). After the test period, as had been the
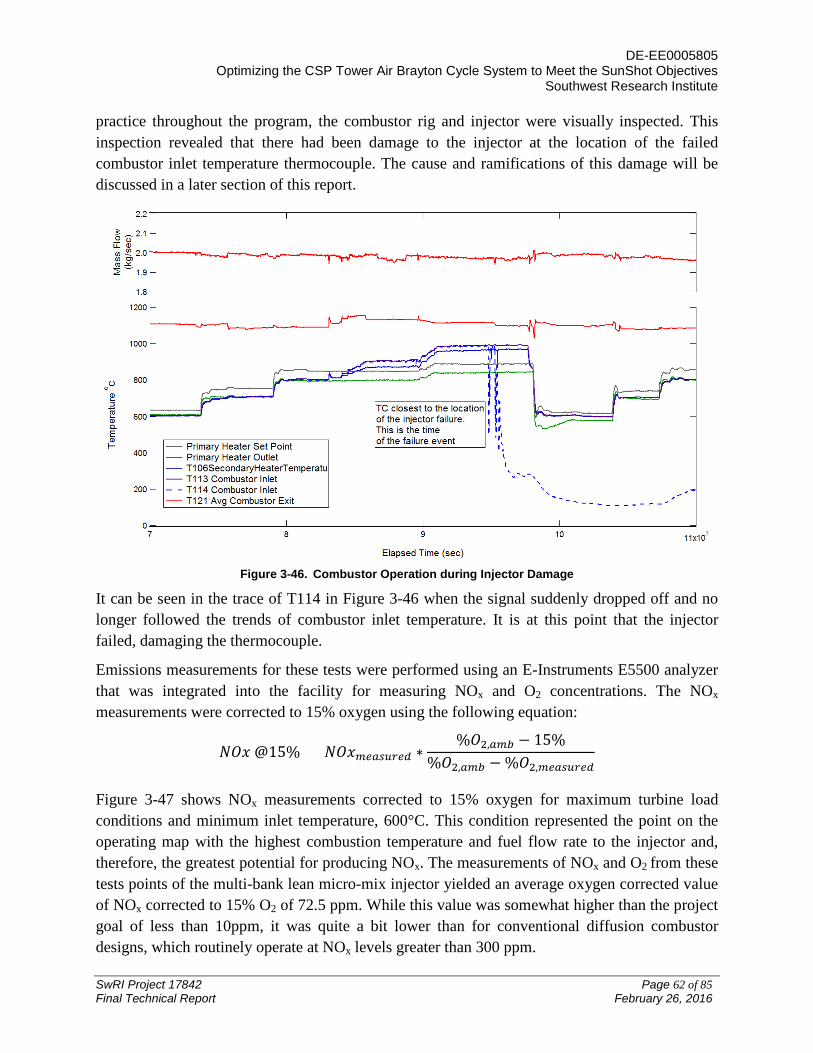
DE-EE0005805 Optimizing the CSP Tower Air Brayton Cycle System to Meet the SunShot Objectives
Southwest Research Institute
SwRI Project 17842 Page 62 of 85 Final Technical Report February 26, 2016
practice throughout the program, the combustor rig and injector were visually inspected. This inspection revealed that there had been damage to the injector at the location of the failed combustor inlet temperature thermocouple. The cause and ramifications of this damage will be discussed in a later section of this report.
Figure 3-46. Combustor Operation during Injector Damage
It can be seen in the trace of T114 in Figure 3-46 when the signal suddenly dropped off and no longer followed the trends of combustor inlet temperature. It is at this point that the injector failed, damaging the thermocouple.
Emissions measurements for these tests were performed using an E-Instruments E5500 analyzer that was integrated into the facility for measuring NOx and O2 concentrations. The NOx measurements were corrected to 15% oxygen using the following equation:
𝑁𝑁𝑁 @15% = 𝑁𝑁𝑁𝑚𝑒𝑒𝑒𝑒𝑒𝑒𝑒 ∗%𝑁2,𝑒𝑚𝑎 − 15%
%𝑁2,𝑒𝑚𝑎 − %𝑁2,𝑚𝑒𝑒𝑒𝑒𝑒𝑒𝑒
Figure 3-47 shows NOx measurements corrected to 15% oxygen for maximum turbine load conditions and minimum inlet temperature, 600°C. This condition represented the point on the operating map with the highest combustion temperature and fuel flow rate to the injector and, therefore, the greatest potential for producing NOx. The measurements of NOx and O2 from these tests points of the multi-bank lean micro-mix injector yielded an average oxygen corrected value of NOx corrected to 15% O2 of 72.5 ppm. While this value was somewhat higher than the project goal of less than 10ppm, it was quite a bit lower than for conventional diffusion combustor designs, which routinely operate at NOx levels greater than 300 ppm.

DE-EE0005805 Optimizing the CSP Tower Air Brayton Cycle System to Meet the SunShot Objectives
Southwest Research Institute
SwRI Project 17842 Page 63 of 85 Final Technical Report February 26, 2016
Figure 3-47. NOx measurements at full turbine load conditions
SwRI asserts that the reason that the NOx readings were even as high as 70 ppm is that combustion was occurring on the upstream face of the injector due to leakage around the injector pegs. This phenomenon is discussed in detail in the following section, as are possible solutions.
TASK 3.9 COMMERCIALIZATION ASSESSMENT 3.10
The current state-of-the-art combustor operating in a hybrid turbine in a demonstration plant is capable of an inlet temperature of 650°C. The goal of this project was to develop a combustor capable of an inlet temperature of 1,000°C that could be incorporated into a hybrid turbine. The following tasks outline the steps needed to take the combustor from its current status of development to a technology readiness level (TRL) 6, where it can be incorporated into a megawatt-scale hybrid turbine for prototype demonstration.
3.10.1 HIGH TEMPERATURE COMBUSTOR SYSTEM DESIGN AND FABRICATION The final combustor design has already been reviewed and approved by DOE. Fabrication of the prototype injector and test facility is complete and initial testing has been conducted.
3.10.2 COMBUSTOR TESTING With the combustor test facility complete and commissioned, testing of injector prototype designs, with the goal of emissions output, combustion efficiency, and structural integrity while putting as many thermal cycles on the system as possible, can be conducted. Results from the
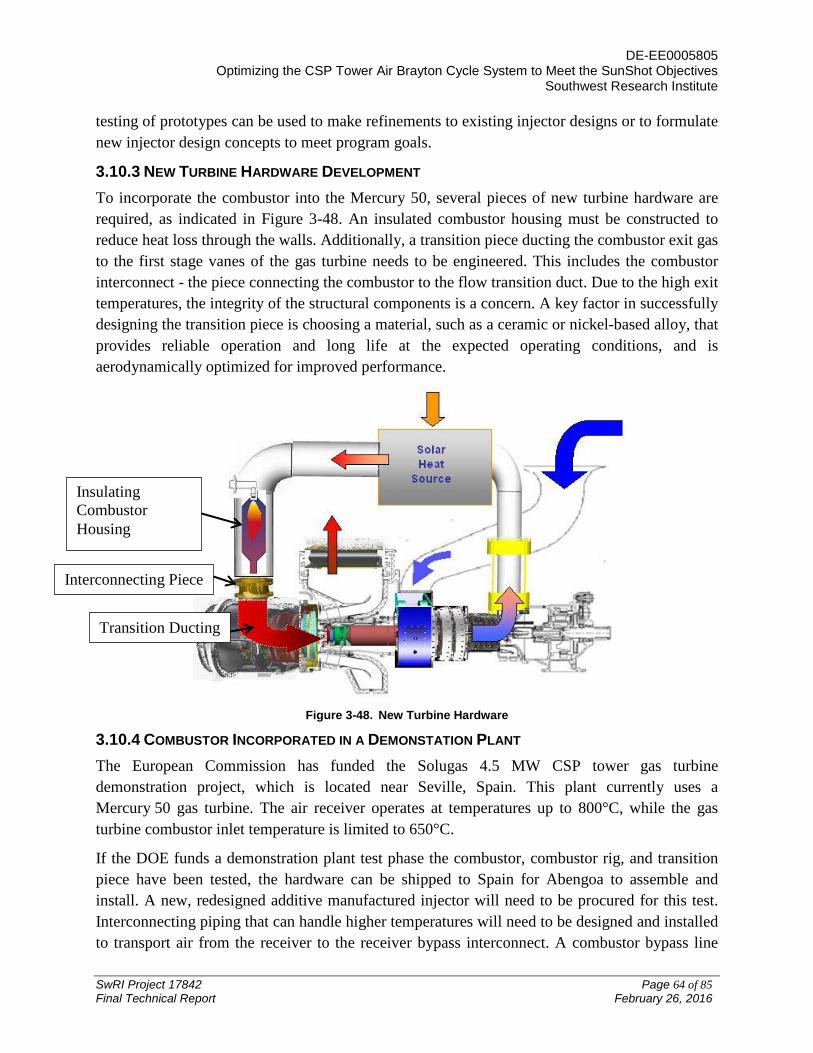
DE-EE0005805 Optimizing the CSP Tower Air Brayton Cycle System to Meet the SunShot Objectives
Southwest Research Institute
SwRI Project 17842 Page 64 of 85 Final Technical Report February 26, 2016
testing of prototypes can be used to make refinements to existing injector designs or to formulate new injector design concepts to meet program goals.
3.10.3 NEW TURBINE HARDWARE DEVELOPMENT To incorporate the combustor into the Mercury 50, several pieces of new turbine hardware are required, as indicated in Figure 3-48. An insulated combustor housing must be constructed to reduce heat loss through the walls. Additionally, a transition piece ducting the combustor exit gas to the first stage vanes of the gas turbine needs to be engineered. This includes the combustor interconnect - the piece connecting the combustor to the flow transition duct. Due to the high exit temperatures, the integrity of the structural components is a concern. A key factor in successfully designing the transition piece is choosing a material, such as a ceramic or nickel-based alloy, that provides reliable operation and long life at the expected operating conditions, and is aerodynamically optimized for improved performance.
Figure 3-48. New Turbine Hardware
3.10.4 COMBUSTOR INCORPORATED IN A DEMONSTATION PLANT The European Commission has funded the Solugas 4.5 MW CSP tower gas turbine demonstration project, which is located near Seville, Spain. This plant currently uses a Mercury 50 gas turbine. The air receiver operates at temperatures up to 800°C, while the gas turbine combustor inlet temperature is limited to 650°C.
If the DOE funds a demonstration plant test phase the combustor, combustor rig, and transition piece have been tested, the hardware can be shipped to Spain for Abengoa to assemble and install. A new, redesigned additive manufactured injector will need to be procured for this test. Interconnecting piping that can handle higher temperatures will need to be designed and installed to transport air from the receiver to the receiver bypass interconnect. A combustor bypass line
Transition Ducting
Interconnecting Piece
Insulating Combustor Housing
DE-EE0005805 Optimizing the CSP Tower Air Brayton Cycle System to Meet the SunShot Objectives
Southwest Research Institute
SwRI Project 17842 Page 65 of 85 Final Technical Report February 26, 2016
and valves to control the flow and temperature of the combustor inlet may need to be included, as well as additional piping to bypass the receiver when conventional-mode operation is required, such as at night or on cloudy days.
3.10.5 INSTRUMENTATION AND CONTROLS MODIFICATION The instrumentation, such as pressure gauges, flow meters, and thermocouples, need to be modified for higher operating temperatures. The receiver outlet air temperature must be monitored as it is increased to the desired level by adding additional heliostats. Additionally, it is important to control the air temperature variation from the receiver to maintain allowable levels for the inlet of the combustor.
The control system for the turbine must be optimized for stable operation, ramp up, and transient conditions. Each of the meteorological conditions found at the prototype plant site need to be considered, as well as the thermal gradient.
3.10.6 SCALED TESTING A demonstration test of the new combustor in the hybrid turbine with the modified control system and instrumentation needs to be performed at the Solugas plant. This test will start with the scaled receiver and combustor designed for 15% turbine flow. It will use natural gas to reach the TRIT design point. This will include testing at various temperatures, pressures, and flows to analyze the receiver, interconnecting piping, and all modifications made to allow for higher temperature operation.
To test the efficiency of the system, bypass piping around the combustor will be installed to test unfired operation at a TRIT of 1,000°C without the combustor. The turbine will also be run in hybrid operation at 1,000°C combustor inlet temperature and a representative TRIT.
3.10.7 FULL-SIZE TESTING Upon successful completion of the scaled testing, a receiver and combustor designed to handle 100% turbine flow will be constructed. A potential test can be achieved with the addition of heliostats for full thermal power at the CSP Solugas Demonstration Plant. Testing similar to that of the demonstration test described above can be performed.
3.10.8 FIELD EVALUATION PLANT The next stage in development will be to test the new combustor in a multi-turbine power block in the United States. This will include a bottoming cycle using the waste heat from the gas turbines to attain higher efficiencies (greater than 50%) for a lower cost of energy. The plant will take approximately a year to construct.
3.10.9 COMMERCIALIZATION After testing in a full-size plant, the hybrid turbine will be ready to go into commercialization and development. There are several potential applications for this technology. Utilities can use the hybrid turbine in a simple-cycle or combined-cycle operation for peaking when power

DE-EE0005805 Optimizing the CSP Tower Air Brayton Cycle System to Meet the SunShot Objectives
Southwest Research Institute
SwRI Project 17842 Page 66 of 85 Final Technical Report February 26, 2016
requirements are between 50 and 100 MW. Additionally, for a utility’s baseload operation, a combined-cycle hybrid turbine can be used for power generation. For IT and military markets, a simple-cycle hybrid turbine configuration can provide the 5-20 MW of distributed generation needed. For combined heat and power (CHP) industrial and institutional applications requiring high-quality exhaust heat as well as power generation, a CHP hybrid turbine in the 5-20 MW range could be used.
The Solar hybrid Brayton cycle presents clear advantages, in comparison to other electricity generation from renewable and conventional sources, through the additional use of hybridization, combining solar energy with heat from other energy sources and optional thermal energy storage:
• Full dispatchability and grid stability through flexibility and instant regulation of the additional combustible flow.
• Fast startup of the gas turbine.
• Compared to other solar technologies, easy operability.
• Low to null water consumption.
• Air as cheap and “harmless” heat transfer fluid.
• A wide range of plant concepts, adapting to the requirements of the country and region, are feasible: independent recuperated Brayton cycle, peaking plants, and especially combined-cycle with or without storage are possible.
• Cycle efficiencies of greater than 50% in solarized combined cycle configuration.
Thus, it provides reliable power with variable solar share and if fuels from renewable sources are used, it is also 100% sustainable at zero net emissions.
The higher temperature (1000°C) technology is still in the development phase and federal government funding is critical to keep these development efforts moving forward. The higher temperature will result in higher power block efficiency and solar thermal share, resulting in lower LCOE. Utilizing the low cost natural gas as a topping energy source will also contribute to a lower LCOE. Cost analysis indicates the CSP hybrid Brayton power plant can be LCOE competitive with wind and PV solar for a utility-scale power plant. The 100% dispatchability with natural gas gives solar hybrid Brayton a distinct advantage over these other renewable options.
DE-EE0005805 Optimizing the CSP Tower Air Brayton Cycle System to Meet the SunShot Objectives
Southwest Research Institute
SwRI Project 17842 Page 67 of 85 Final Technical Report February 26, 2016
4. FINAL DELIVERABLES AND DISCUSSION
The project deliverables enumerated in the statement of project objectives are
• Functioning combustor system prototype that meets operational requirements • Functioning combustor system prototype that meets performance and durability targets • Detailed material evaluation reports • Test reports demonstrating performance and durability targets were met • Final commercialization assessment • Patents and publications
FUNCTIONING COMBUSTOR DESIGN MEETS OPERATIONAL REQUIREMENTS 4.1
Operation of the multi-bank lean micro-mix injector has been successfully demonstrated over the full range of temperatures and flow rates, reaching nearly the maximum target pressure for the project set out in the statement of project objectives. The combustor and all of the sub-systems achieved stable operation at all of the test points for both the inlet conditions corresponding to the solar heating load of the CSP plant and the combustor outlet conditions for the range of turbine loads and operating points. The operating temperatures of the combustor at each of these combinations of conditions met the project goals compatible with operation of the notional application of installation in a CSP plant with a Solar Turbines Mercury 50 turbine.
The multi-bank injector worked as designed to accommodate variable fuel flow rates based on changing inlet conditions and turbine load. Demonstration of this feature of the combustor design is a key indicator of successful operation, since the multi-bank aspect of the injector eliminates the need for high-temperature air bypass hardware, such as valves and ducting, the designs of which pose considerable engineering challenges. The use of the multi-bank scheme simplifies the combustor design by not including moving parts that are exposed to the high-temperature inlet air and by maintaining a single unified flow path for the combustion air. Demonstration of the successful operation of this design concept is a key accomplishment of this project.
In addition to successful demonstration of the multi-bank functionality of the injector, other key features of the combustor design were proven out during the test campaign. The micro-mix injection scheme of air passages, in the form of central longitudinal holes in the injector pegs, and fuel injection ports, in the form of small transverse holes in the pegs, resulted in a pressure drop across the injector head that was well below the target value at all operating conditions. The micro-mix injector design demonstrated robust behavior in the presence of combustion initiated by autoignition due to high inlet air temperature. There is no evidence of damage on the downstream face of the injector that indicates that autoignition occurred in a manner inconsistent with the design intent. Evidence, in the form of the lack of damage to the outlets of any of the pegs, supports the assertion that no flashback occurred in the course of normal operation during the injector tests.

DE-EE0005805 Optimizing the CSP Tower Air Brayton Cycle System to Meet the SunShot Objectives
Southwest Research Institute
SwRI Project 17842 Page 68 of 85 Final Technical Report February 26, 2016
Figure 4-1. Fully Functional Combustor Test Facility
FUNCTIONING COMBUSTOR SYSTEM PROTOTYPE MEETS PERFORMANCE AND 4.2DURABILITY TARGETS
This project has been successful in producing a combustor prototype in that the injector design was tested in the fully commissioned facility over the full range of inlet and turbine operating conditions.
4.2.1 EMISSIONS PERFORMANCE NOx emissions from the multi-bank lean micro-mix injector measured in this project were well below those of conventional diffusion combustors. At the combination of inlet conditions and turbine load that had the potential to produce the highest levels of NOx, the average was 72.5 ppm. This value was higher than the level predicted in the design phase of the project. This was due to the combustion of fuel that had leaked upstream from the manifold around the injector peg heads. Adjustment of the injector design to mitigate the leakage issue will result in NOx emissions that are lower and more in line with those predicted.
4.2.2 DURABILITY The multi-bank lean micro-mix injector prototype that was tested in this project lasted for approximately 50 hours of testing. This was a first-of-its-kind injector that was tested in

DE-EE0005805 Optimizing the CSP Tower Air Brayton Cycle System to Meet the SunShot Objectives
Southwest Research Institute
SwRI Project 17842 Page 69 of 85 Final Technical Report February 26, 2016
conditions under which few, if any, injector designs have been exposed to before. Additionally, due to the low volume production nature of prototype fabrication, the material of choice for fabrication of the injector, Haynes 214, was not used. Instead, an alternate material, Haynes 230, was used for the injector prototype. Accounting for these factors and the extreme conditions, which at times exceeded those seen in even state-of-the-art CSP applications, the initial life of the injector design lasting 50 hours was a substantial achievement.
After nearly a month of testing, it was discovered during routine borescope inspection between test periods that there was damage to the downstream face of the injector. Let it be noted that the damage was not to any of the injectors, but to the injector housing near the outer diameter of the body.
Extensive investigation of the injector and analysis of the data after the end of testing showed that the cause of the damage was combustion occurring on the upstream face of the injector due to leakage of the fuel from the pressurized manifold to the combustor inlet case. The leak path was from the pressurized manifold upstream, along the injector peg around the head of the injector peg. The hot combustion gases were then ingested through the bypass slots on the outer edges of the injector body, damaging the injector to a level that was deemed sufficient to halt testing.
The design of the injector called for gaskets sealing between the bank manifolds, as well as under the heads of the injector pegs. Thermiculite high-temperature gasket material was water jet cut to fit in both locations and placed during the initial assembly of the injector. After the initial assembly, the fuel manifold was pressurized with air at approximately 140 psi to check for leaks. Leaks were discovered between the manifolds, as well as past the heads of injector pegs. The injector pegs were extensively adjusted and re-torqued until there was no longer leakage between the bank manifolds or upstream past the injector peg heads.
Figure 4-3 is a cut-away view of the injector assembly with the direction of air flow, fuel manifold, and leakage path around the injector peg called out. Pegs were tightened down to prevent leakage at the time of assembly, thermal cycling of injectors during testing affected the seals to allow fuel to leak between bank manifolds and from the manifolds to the upstream face. The fuel that had leaked to the upstream face underwent autoignition and the hot combustion gases entrained through the bypass slots of the injector body.

DE-EE0005805 Optimizing the CSP Tower Air Brayton Cycle System to Meet the SunShot Objectives
Southwest Research Institute
SwRI Project 17842 Page 70 of 85 Final Technical Report February 26, 2016
Figure 4-2. Leakage Path around Injector Pegs
Figure 4-4 is a close up photograph of the upstream side of the injector after the conclusion of testing. The material around the injector heads is the remains of the thermiculite gasket used in the initial assembly of the injector for sealing. The peg in the center of the photo with the nut of a compression fitting is one of the fuel supply lines feeding the outer bank of the injector. Immediately below the fuel line is an injector peg with clear indications of combustion on the upstream face at the leakage point around the head.
Temperature plots of inlet temperature (Figure 3-33) indicate that combustion in the secondary heater is still occurring at the location of the combustor inlet thermocouples. The localized damage to injectors, such as that shown in Figure 4-4, was due to leakage and combustion occurring at or near the point of the leak. With the combustor inlet temperature at 1,000°C the combustion from autoignition would be extremely rapid causing the localized damage which would lead to increased leakage.

DE-EE0005805 Optimizing the CSP Tower Air Brayton Cycle System to Meet the SunShot Objectives
Southwest Research Institute
SwRI Project 17842 Page 71 of 85 Final Technical Report February 26, 2016
Figure 4-3. Evidence of Combustion on the Upstream Side of the Injector
Figure 4-5 is a photograph of the injector after it had been removed from the combustor. The areas on the outer diameter of the injector are damage caused by combustion of leaking fuel igniting on the upstream face and burning as it flows through the bypass slots. This burning in the bypass slots caused the damage to the injector body. The large area of damage in the upper left-hand side corresponds to the clock location of T114, the thermocouple upstream of the injector that was suddenly lost during testing. Inspection of this region showed that a large amount of the injector body was burned away and injector material was liberated with sufficient energy to fold some of the injector material over. The condition of the injector supports very strongly that this damage to the injector was the cause of the loss of the T114 sensor. The other smaller regions of damage around the outer circumference of the injector are similar in character, though less in severity to the primary location.

DE-EE0005805 Optimizing the CSP Tower Air Brayton Cycle System to Meet the SunShot Objectives
Southwest Research Institute
SwRI Project 17842 Page 72 of 85 Final Technical Report February 26, 2016
Figure 4-4. Downstream Face of the Injector after Conclusion of Testing
In addition to leakage from the fuel manifolds to the upstream face of the injector along the pegs, there were indications of leakage between the individual bank fuel manifolds. This leakage between manifolds explains the wide variation in temperatures measured at the combustor outlet by sensors T121 A through D, as shown in Figure 3-43. The localized leakage between manifolds resulted in greater fuel flow through some pegs and less through others, resulting in the observed combustor pattern factor.
This initial prototype test showed that the multi-bank design was successful in managing air and fuel flow over the range of combustor inlet and turbine load conditions, as well as demonstrating the function of the micro-mix injection scheme. The NOx emissions were well below those of conventional diffusion combustors and can reasonably be expected to be much lower when the leakage issues of the fabrication and assembly of the injectors are resolved. The 50-hour test life was a considerable achievement for a clean sheet combustor and injector design in operating conditions that are not currently present in any gas turbine in service or development anywhere in the world.
Location of damage corresponding to loss of T114
Additional evidence of combustion on the upstream face of the injector

DE-EE0005805 Optimizing the CSP Tower Air Brayton Cycle System to Meet the SunShot Objectives
Southwest Research Institute
SwRI Project 17842 Page 73 of 85 Final Technical Report February 26, 2016
DETAILED MATERIAL EVALUATION REPORTS 4.3
Due to the high temperatures and oxidizing environment of this test, specialized high-temperature materials were used in many of the components. This section reports on the materials used in each of the components of the facility and test article and evaluation of the suitability of material. The components discussed in this section are:
• Inlet and exhaust piping • Primary heater and piping • Combustor case • Refractory liner and heatshield • Injector
4.3.1 INLET AND EXHAUST PIPING The inlet and exhaust piping consisted of the pipe that ran from the research compressor to the upstream flange of the primary heater and from the exhaust reducer housing to the exhaust stack outside of the Turbomachinery Research Facility. It was made from ANSI standard carbon steel pipe of various diameters. The inlet air was at an elevated temperature due to compression but the carbon steel pipe was capable of handling the temperature and pressure. In fact, the inlet pipe was designed to be capable at the compressor discharge temperature at 300 psi, over twice the pressure of the current compressor capability of around 115 psi used in this test. The exhaust pipe vented to atmosphere and was, therefore, not at elevated pressure and the combustion products were quenched in the exhaust reducer housing so the maximum temperature was kept below 250°C. As a practice in the test program, the combustor exhaust temperature was quenched to between 150°C and 175°C. The inlet and exhaust pipe material and construction were well suited for the operation of the combustor facility and other than some discoloration of the paint on the pipes from mild heating, showed no ill effects from this test.
4.3.2 PRIMARY HEATER AND PIPING This component consisted of the primary heater and the pipes connecting it to the combustor. The major elements in this component, the primary heater pressure vessel, the heater exhaust flange, and connector pipes were all made from stainless steel 304H, an extremely temperature-resistant alloy. The combustor pressure vessel was very well suited for operation in this facility and did not show even minor discoloration due to heating. Measurements of the heater during operation indicated that the vessel temperature remained below about 250°C.
The heater exhaust flange showed some minor local discoloration around the exit pipe due to the heating from the primary heater air. The material choice of SS304H was well suited to stand up to the high temperature. The configuration of the large surface and sudden area change that was selected due to budget factors was not optimum, but was mitigated by the use of the refractory insert.

DE-EE0005805 Optimizing the CSP Tower Air Brayton Cycle System to Meet the SunShot Objectives
Southwest Research Institute
SwRI Project 17842 Page 74 of 85 Final Technical Report February 26, 2016
The pipe connecting the primary heater to the combustor showed extensive and extreme discoloration due to general heating. To prevent heat losses, this section of piping was heavily insulated and, thus, the metal temperature at steady-state operation approached the primary heater air temperature. SS304H was a good compromise for these pieces for its relatively low cost and availability compared to exotic alloys, such as Inconel 718 and its mechanical properties at high temperature relative to more common materials, such as carbon steel.
This pipe section contained two six-inch diameter ANSI standard 300# class flanges made of SS304H. The nuts and bolts for sealing were made from Inconel 718. This material was chosen for its mechanical properties at elevated temperature despite the high cost per piece. The nuts and bolts showed extensive oxidation after even a single use and when the system was allowed to return to ambient temperature, many of the nuts could be loosened by hand. Despite the fact that the nuts had become loose during operation, the complete removal of the bolts required use of a power tool, such as an impact wrench, because of damage to the threads from heating. Experience showed that these bolts must be retightened before each test period. The threads of the bolts on the heater exhaust flange, also made from Inconel, were damaged from heating, and while the bolts did not become loose during testing and could be left on for extended periods of use, did have a finite number of times that they could be loosened and tightened before needing to be replaced. Inconel 718 was an appropriate material for these nuts and bolts as a result of the mechanical properties of the material, however, the set of nuts and bolts should be considered a test consumable and replaced at least as often as each test campaign, and more frequently for extended test programs.
4.3.3 COMBUSTOR CASE The inlet case, mid case and combustor case showed moderate discoloration caused by heating (Figure 4-5), while the inlet pipe showed severe discoloration similar to the heat piping. The end cap and exhaust reducer housing showed no discoloration. The end cap was well insulated from the inlet air by the refractory insert and had a large heat transfer area for dissipating heat. The exhaust reducer housing was protected by a much thicker refractory layer and sheet metal heat shield, and was being cooled by an air manifold and the exhaust quench water.
During testing, the surface temperatures for each of the case sections were measured with a type-K thermocouple strapped down with NiChrome shim stock. During steady-state operation, the mid case and the combustor case reached temperatures in excess of 500°C, while the inlet case reached 400°C.

DE-EE0005805 Optimizing the CSP Tower Air Brayton Cycle System to Meet the SunShot Objectives
Southwest Research Institute
SwRI Project 17842 Page 75 of 85 Final Technical Report February 26, 2016
Figure 4-5. Combustor Housing with Moderate Discoloration
The combustor case showed great resiliency during testing at temperatures as high as nearly 1,200°C. At one point during testing, some combustion gases were ingested into the cooling passage between the combustor case and refractory insert causing localized heating in excess of 700°C (see Figure 4-6) with no damage to the combustor case other than discoloration. In addition, the proposed future development plan is to use this combustor case in the Solugas demo plant to field test the injector with the Mercury 50 engine. This casing needs to be robust to last many years of demo plant operation.

DE-EE0005805 Optimizing the CSP Tower Air Brayton Cycle System to Meet the SunShot Objectives
Southwest Research Institute
SwRI Project 17842 Page 76 of 85 Final Technical Report February 26, 2016
Figure 4-6. Hot Spot on the Combustor Case Due to Combustion Gases Ingested in Cooling Passage
4.3.4 REFRACTORY INSERT The refractory insert component consisted of the sheet metal liner, made from stainless 304H, the heat shield, and the cooling air manifold. The choice for the sheet metal parts to be made from SS304H was necessitated by budgetary pressure. However, the performance of the 304H parts was satisfactory throughout. The only damage to a sheet metal part was in the combustor liner where combustion gases were ingested into the cooling gap between the refractory liner and combustor case. It is unlikely that another more exotic material would have been undamaged from this event.
The ceramic refractory material was an appropriate choice for use in the insert. The only area where the refractory sustained damage was where the combustion gases were ingested. This part of the refractory insert will have to be repaired before the next test. A rework design for this component will most likely employ a machinable ceramic, such as Uniform A1A, the material used in the heater insert.

DE-EE0005805 Optimizing the CSP Tower Air Brayton Cycle System to Meet the SunShot Objectives
Southwest Research Institute
SwRI Project 17842 Page 77 of 85 Final Technical Report February 26, 2016
4.3.5 INJECTOR The injector was made completely from Haynes 230. The downstream face of the injector body was coated with a thermal barrier coating. The high temperature in which the injector was completely immersed required that the material retain mechanical properties at extreme temperature for extended periods. Haynes 230 was a good choice for applications such as the injector. Despite the fact that it was the injector that was damaged, the damage was not the result of material choice, but rather a byproduct of the complex design, difficult fabrication process, and large number of individual parts, problems in this design that might be addressed using the same or similar material but an alternate manufacturing process. This is discussed in a later section of this report.
PATENTS AND PUBLICATIONS 4.4
In addition to the final deliverables, SwRI has filed a patent application for the multi-bank lean micro-mix injector design with the United States Patent Office. The SwRI intellectual property legal team has been informed by the U.S Patent Office that the application is currently under review.
SwRI has published several conference papers covering the design of the multi-bank lean micro-mix injector and at the time of writing of this report has several abstracts submitted to high-profile conferences and plans to submit abstracts to additional internationally-renowned meetings of organizations such as; AIAA, ASME, and SAE. All of these publications will include an acknowledgement that the work was supported by the U.S. Department of Energy, SunShot Initiative, under award number DE-EE0005805. A list of the patents and publications is provided below.
4.4.1 PATENTS Coogan, Shane B. and Brun, Klaus, “Air-Fuel Micromix Injector Having Multibank Ports for Adaptive Cooling of High Temperature Combustor,” U.S. Patent Application Number 20150300647, October 2015.
4.4.2 PAPERS Coogan, S., Brun, K., and Teraji, D., “Micromix Combustor for High Temperature Hybrid Gas Turbine Concentrated Solar Power Systems,” Energy Procedia, Vol. 49, pp. 1298-1307, 2014.
Coogan, S., Brun, K., and Teraji, D., “Design of a Micromix Fuel Injector for High Temperature Hybrid Concentrated Solar Power Plants,” ES-FuelCell2014-6471, Proceedings of the ASME 8th International Conference on Energy Sustainability, Boston, MA, July 2014.
4.4.3 ABSTRACTS Bryner, E., Cunningham, C., and Brun, K., “A Clean Air High Temperature Facility for Combustion Testing,” AIAA Paper, Propulsion and Energy Forum, Salt Lake City, UT, July 25 -27, 2106.

DE-EE0005805 Optimizing the CSP Tower Air Brayton Cycle System to Meet the SunShot Objectives
Southwest Research Institute
SwRI Project 17842 Page 78 of 85 Final Technical Report February 26, 2016
Bryner, E. and Brun, K., “High Inlet Temperature Combustion Testing for Gas Turbine Applications,” SAE Paper Number 16ASTC-0011, SAE 2016 Aerospace Systems and Technology Conference and International Powered Lift Conference, Hartford, CT.

DE-EE0005805 Optimizing the CSP Tower Air Brayton Cycle System to Meet the SunShot Objectives
Southwest Research Institute
SwRI Project 17842 Page 79 of 85 Final Technical Report February 26, 2016
5. Conclusions
The Optimizing the CSP Tower Air Brayton Cycle System to Meet the SunShot Objectives project has produced a number of very valuable results. First among these is the successful demonstration of the operation of the multi-bank lean micro-mix injector design. The injector operated under conditions in excess of the current state-of-the-art CSP plant applications. The combustor rig using the multi-bank lean micro-mix injector demonstrated stable performance across the full range of specified inlet and turbine load conditions. The multi-bank nature of the injector allows for management of the varying air and fuel flow needs as inlet and turbine load conditions change without the need of an air bypass system using high-temperature valves or ducting, simplifying the design and operation of the combustor.
A unique high inlet temperature combustion test facility was fabricated and commissioned for testing of this first-of-its-kind multi-bank lean micro-mix injector design. This facility is capable of reaching combustor inlet temperatures of 1,000°C with an air mass flow rate in excess of 2.0 kg/sec and pressures of nearly 8 bar. The facility is equipped with a flexible and extensible instrumentation and data acquisition system for measuring temperatures, static pressures, air flow, and species concentration. Leveraging Solar Turbines combustor rig experience and technology development over the last 40 years, the combustor rig case design and procurement cost were greatly reduced for this project and the casing technical risk was minimized. This facility is now commissioned and has demonstrated operation over the full temperature range and over more than 90% of the pressure range.
Testing of a patented multi-bank lean micro-mix injector design in this facility consisted of preliminary flow testing showing that the pressure drop through the injector met design targets across the range of operating conditions. Initial combustion and shakedown testing demonstrated the function of the micro-mix scheme to be robust and meeting design intent for stability and controllability. The design met project goals in resistance to damage due to autoignition and flashback as demonstrated by the integrity of the injector peg outlets upon completion of the test program.
Endurance of the injector design was demonstrated by the test article lasting through 50 hours of testing - a notable achievement due to several factors. As a first-of-its-kind demonstration test, the number of test hours and thermal cycles accumulated by the injector is remarkable when compared to other similar development programs. Further, the material selected for the fabrication of the prototype, Haynes 230, was a compromise made as part of the test program due to the unit cost of low production runs of Haynes 214, the preferred material for the injector design. Use of Haynes 214 in the prototype was cost prohibitive, but is more economical for production runs, even at low volumes that are needed for use in testing on a turbine installed in a demonstrator CSP plant. Therefore, Haynes 214 could be used in future combustor tests that employ multiple injectors.

DE-EE0005805 Optimizing the CSP Tower Air Brayton Cycle System to Meet the SunShot Objectives
Southwest Research Institute
SwRI Project 17842 Page 80 of 85 Final Technical Report February 26, 2016
The test life being limited to 50 hours was the result of a manufacturing issue and not as a result of the behavior of the normally-functioning multi-bank lean micro-mix injector design. Rather the reduced life was caused by fuel leakage from the manifolds around the injector peg heads. This leakage was the result of the reduced effectiveness of seals exposed to high temperature and the degradation of the seal through thermal cycling, effects that have their root in the fabrication and assembly of the injector body rather than the micro-mix injection concept.
NOx emissions corrected to 15% O2 were in excess of the program goal of less than 10 ppm. The NOx measured at 72.5 ppm at maximum fuel flow rate was significantly lower than conventional diffusion combustors, which operate at about 300 ppm. Since conventional lean premixed combustor technology cannot be used in these conditions, comparison to the emissions levels of diffusion combustors is appropriate. Additionally, the value of 72.5 ppm also included the combustion due to leakage upstream around the injector peg, and as such, the NOx readings of the micro-mix injector design when functioning properly are sure to be much lower than the values measured during the testing in this project.
Incremental improvements of the injector design oriented toward manufacturability will prove to be of great value in maturing the multi-bank lean micro-mix design. The solution that maintains the greatest similarity to the as-built prototype tested during this effort is refinement of the high-temperature sealing system around the heads of the injector pegs and between the fuel manifolds. Use of leaf seals or a high-temperature sealant are possible methods of sealing the injector and should be investigated in detail to determine the increase in sealing effectiveness and durability versus additions to the complexity of the manufacture and fabrication of the injector assembly.
Alternate fabrication methods that allow the injector to be made from fewer parts, thus, reducing the number of locations that require high-temperature sealing is another option. One fabrication method that would improve the design by eliminating potential leakage paths is additive manufacturing (AM). The use of additive manufacturing would allow the multi-bank lean micro-mix injector to be made of one solid piece of material. Additive manufacturing has the additional benefit that if the preferred high-temperature metal is compatible with the selected fabrication technique, the prohibitively high cost for low-volume production or even individual prototypes can be eliminated.
Additive manufacturing would also introduce the possibility of fabricating the injector from non-metallic materials, such as ceramic, which has excellent tolerance to very high temperatures. The use of ceramics in the multi-bank lean micro-mix injector design would be advantageous with respect to resistance to high temperatures, but would also introduce a new set of design considerations that must be analyzed. Mechanical design considerations must be made for the brittle nature of ceramic, as well as accounting for the potentially large difference in thermal coefficients of expansion of the ceramic compared to the material that it would be mounted in, most likely metal. This mismatch in coefficients of thermal expansion has the potential to lead to large thermally-induced stresses and cause cracking.
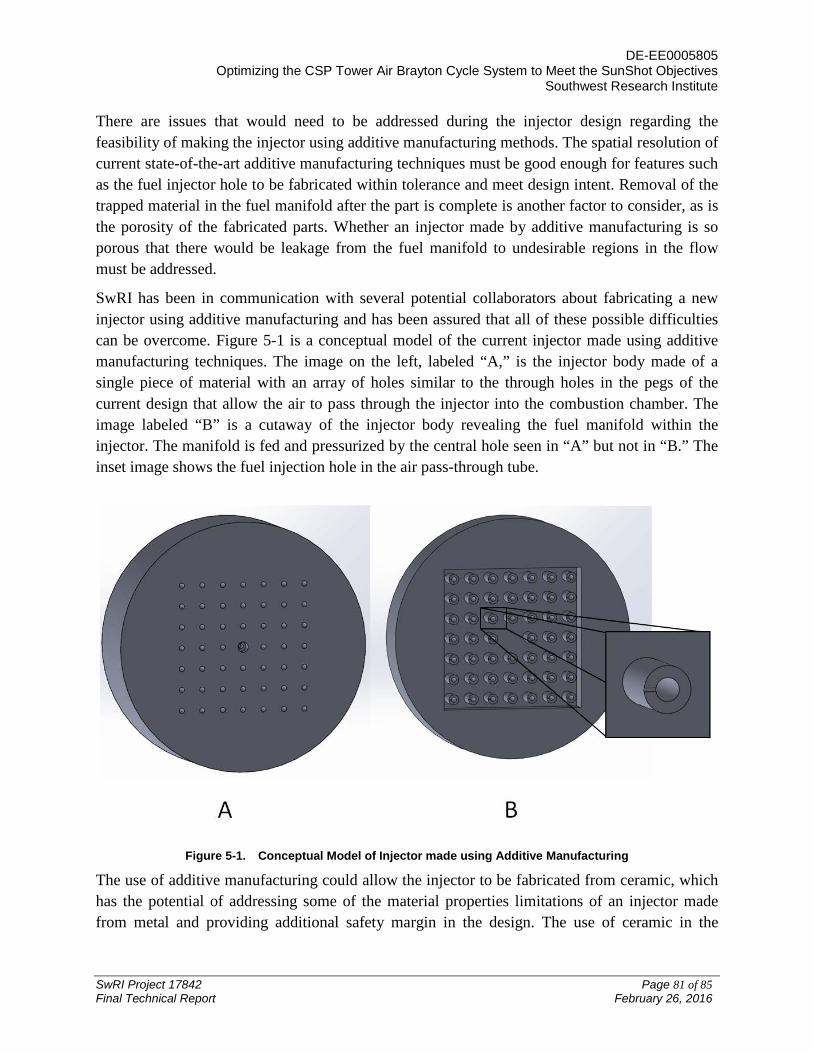
DE-EE0005805 Optimizing the CSP Tower Air Brayton Cycle System to Meet the SunShot Objectives
Southwest Research Institute
SwRI Project 17842 Page 81 of 85 Final Technical Report February 26, 2016
There are issues that would need to be addressed during the injector design regarding the feasibility of making the injector using additive manufacturing methods. The spatial resolution of current state-of-the-art additive manufacturing techniques must be good enough for features such as the fuel injector hole to be fabricated within tolerance and meet design intent. Removal of the trapped material in the fuel manifold after the part is complete is another factor to consider, as is the porosity of the fabricated parts. Whether an injector made by additive manufacturing is so porous that there would be leakage from the fuel manifold to undesirable regions in the flow must be addressed.
SwRI has been in communication with several potential collaborators about fabricating a new injector using additive manufacturing and has been assured that all of these possible difficulties can be overcome. Figure 5-1 is a conceptual model of the current injector made using additive manufacturing techniques. The image on the left, labeled “A,” is the injector body made of a single piece of material with an array of holes similar to the through holes in the pegs of the current design that allow the air to pass through the injector into the combustion chamber. The image labeled “B” is a cutaway of the injector body revealing the fuel manifold within the injector. The manifold is fed and pressurized by the central hole seen in “A” but not in “B.” The inset image shows the fuel injection hole in the air pass-through tube.
Figure 5-1. Conceptual Model of Injector made using Additive Manufacturing
The use of additive manufacturing could allow the injector to be fabricated from ceramic, which has the potential of addressing some of the material properties limitations of an injector made from metal and providing additional safety margin in the design. The use of ceramic in the

DE-EE0005805 Optimizing the CSP Tower Air Brayton Cycle System to Meet the SunShot Objectives
Southwest Research Institute
SwRI Project 17842 Page 82 of 85 Final Technical Report February 26, 2016
injector would require analysis of the mechanical behavior during thermal cycling and operation. SwRI is currently pursuing funding from outside sources for this work.
With the fully commissioned and functional test facility that was used in the testing of this project, additional design iterations can be tested at a greatly reduced cost and a highly accelerated schedule. Evaluation of both incremental design changes to the current design of the multi-bank lean micro-mix injector, as well as substantial changes to the current design can be analyzed, built, and tested to advance the project goals for relatively little additional investment in time and capital.
There were a number of valuable successes and first-of-their-kind achievements resulting from this project. A novel, patented multi-bank lean micro-mix injector was demonstrated and testing over the full range of combustor inlet and turbine load conditions performed. A unique facility to perform high inlet temperature combustor testing was also fabricated and commissioned. Vital lessons on the operation of the facility, the conduct of combustion tests in this facility, and the design and fabrication of injectors for use in high inlet temperature combustors, such as those in a CSP air Brayton cycle, were learned.

DE-EE0005805 Optimizing the CSP Tower Air Brayton Cycle System to Meet the SunShot Objectives
Southwest Research Institute
SwRI Project 17842 Page 83 of 85 Final Technical Report February 26, 2016
6. Future Work
While the operation of the multi-bank lean micro-mix injector has been demonstrated over a range of CSP plant relevant inlet conditions and turbine loads, additional work can be done on both injector design and understanding of the physics of the lean micro-mix injection scheme. The testing done in this project was very successful at demonstrating overall system operation and proof-of-concept. Additional instrumentation that was not included in the initial test program can be added to provide more data on future test programs. Further, some minor modifications to the test facility would prove useful in efficient testing operations.
ADDITIONAL INSTRUMENTATION 6.1
The suite of instrumentation used in this project provided a great deal of data about the combustor operation; however, there were some trade-offs made in the interest of meeting schedule and budget constraints. Primary among these was a combustor camera system. Such a system would include a high-temperature viewing port and periscope upon which a digital camera could be mounted. The addition of this type of system would allow the test operators to monitor the combustion during test operations, providing information on things such as pattern factor and autoignition point. It would also aid in detecting anomalous behavior during operation, such as flameout, flashback, or combustion in unexpected locations, as occurred during this testing. This camera system could also be used for post-test inspection of the facility and test article.
While there were a number of temperature sensor located at various positions throughout the facility, additional temperature measurements would provide important insight in future tests. The use of immersion rakes to measure radial distribution of temperature at both the injector inlet and combustor outlet would be of particular use. Characterization of the temperature distribution of the air at the injector inlet provides understanding of the boundary conditions of the injector and can be used in any post-test data matching of computational and analytical models. Similar reasons exist for the use of temperature rakes at the combustor exit. However, the design and fabrication of immersion rakes for use in combustion environments must be done with care. The high temperatures and oxidizing environment necessitate the use of exotic materials and the probes would need to be substantial to withstand aerodynamic loading and allow for cooling. As such, care would need to be taken to not disturb excessively the flow with the probe bulk or influence the readings with the probe cooling system.
In a manner similar to the temperature probes, pressure ports were located throughout the combustor and facility for this test. All of the pressures in the current configuration were wall static. Immersion rakes similar to those for temperature could be used to measure total pressure. Total pressure rakes could provide radial distribution that could be used to characterize the behavior of the facility and for detailed post-test validation of numerical models. Similar care
DE-EE0005805 Optimizing the CSP Tower Air Brayton Cycle System to Meet the SunShot Objectives
Southwest Research Institute
SwRI Project 17842 Page 84 of 85 Final Technical Report February 26, 2016
and consideration would need to be taken in the design and fabrication of total pressure immersion rakes as for temperature rakes.
Due to the extreme temperatures at the combustor face, temperature measurement by conventional thermocouples is highly problematic. The use of advanced optical diagnostic techniques could potentially provide data about the combustor right up to the injector face. There are a number of techniques, such as Tunable Diode Laser Spectroscopy (TDLAS) and Coherent Anti-Raman Scattering (CARS), that could provide not only temperature in the combustion gases, but also concentration of selected species produced in combustion.
Another location where temperature measurements would be of great use would be within the injector. Measuring the gas temperatures in the bank manifold and at various locations inside selected injector pegs would provide a great deal on information that could be useful in future design refinements. Measuring metal temperatures at a series of locations on the injector could provide similarly insightful data. The ability to make these measurements needs to be designed into the injector test article for best results. Future injector designs should include some provision for measuring temperature.
FACILITY MODIFICATIONS 6.2
The addition of the camera port was discussed in the previous section and is mentioned again here because it is the most substantial of the facility modifications suggested here. The addition of the camera port would require modification of the combustor case and refractory lining to allow for the periscope and the high-temperature view port. Solar Turbines has an existing design that could be readily adapted for use in this application.
In the test program just completed in this project, it was the practice to perform borescope inspections in between test periods. This was done through existing holes in the combustor case that were present for other uses, such as instrumentation ports. There were several that served adequately for the combustion chamber downstream of the injector, however there were none upstream of the injector. As such, no borescope inspections were performed on the upstream side of the injector during the test program. Addition of several borescope ports, both upstream and downstream of the injector would be of considerable use in future test programs.
One of the problems that plagued the early tests was the heat loss from the primary heater to the combustor. To mitigate this, a thermal barrier coating could be added to the inner surface of the piping that connects the primary heater to the combustor. This should also include the inner surface of the primary heater outlet transition piece. The thermal barrier coating should be as thick as possible to help reduce heat loss and to protect the transition piping components.
OTHER WORK 6.3
The facility used in this project is unique and could be used in a range of development test programs. Some possible uses, in addition to further advancement and refinement of CSP injectors, are: conventional gas turbine engine combustor testing, hot-gas-path sensors for use in

DE-EE0005805 Optimizing the CSP Tower Air Brayton Cycle System to Meet the SunShot Objectives
Southwest Research Institute
SwRI Project 17842 Page 85 of 85 Final Technical Report February 26, 2016
gas turbine engines, and advanced combustion measurement technique development, to name a few.