Optimization of Venturi Flow Meter Model for the Angle of ... · Keywords---Venturimeter,...
13
International Conference on Challenges and Opportunities in Mechanical Engineering, Industrial Engineering and Management Studies 658 (ICCOMIM - 2012), 11-13 July, 2012 ISBN 978-93-82338-04-8 | © 2012 Bonfring Abstract--- The conceptualization of this project is inspired by the experiments conducted for the calibration of Venturimeter and the loss of water head at the downstream of pipe flow in various hydraulic power plants. The Venturimeter, a typical obstruction type flow meters are widely used in industry for flow measurements. A significant amount of pressure loss occurs in pipelines due to the obstructions present in these types of flow meters. Permanent pressure loss depends on the shape of obstruction, the diameter ratio and also on properties of the fluid [1]. But a differential pressure at minimum pressure loss is the most desirable condition for an ideal Flow Meter. In the present work, Computational Fluid Dynamics (CFD) has been used to compute the permanent pressure loss and relative pressure loss for 2D incompressible fluid for various designs of a classical Venturimeter. The Computational Fluid Dynamics (CFD) software ANSYS FLUENT© has been used as a tool to perform modeling and simulation of the Venturimeter. The results of the simulation show that there is a minimum pressure drop in the instrument only for one value of angle of divergence for an unchanged angle of convergence. The simulation results were compared to the Venturi flow meter installed at R V College of Engineering. The results can be interpreted for a better design of the throat shape and the overall Venturi flow meter design and can reduce the pumping cost of the system. Hence, the focus of the study was directed towards optimizing the present model that takes into account most of the experimental variables. Keywords--- Venturimeter, Computational Fluid Dynamics (CFD), pressure drop, angle of divergence, angle of convergence I. INTRODUCTION low meters are used in the industry to measure the volumetric flow rate of fluids. Differential pressure type flow meters (Head flow meters) measure flow rate by introducing a constriction in the flow. The pressure difference caused by the constriction is correlated to the flow rate using Bernoulli's theorem. If a constriction is placed in a pipe carrying a stream of fluid, there will be an increase in velocity, and hence an increase in kinetic energy, at the point of constriction. From energy balance as given by Bernoulli’s theorem, there must be a corresponding reduction in static pressure. Rate of discharge from the constriction can be calculated by knowing this pressure reduction, the area available for flow at the constriction, the density of the fluid and the coefficient of discharge Cd. Coefficient of discharge is the ratio of actual flow to the theoretical flow and makes allowances for stream contraction and frictional effects. Venturimeter, orifice meter, and Pitot tube are widely used head flow meters in the industry. The Pitot-static is often used for measuring the local velocity in pipes or ducts. For measuring flow in enclosed ducts or channels, the Venturimeter and orifice meters are more convenient and more frequently used. The Venturimeter is widely used particularly for large volume liquid and gas flows since it exhibits little pressure loss. However, for smaller pipes orifice meter is a suitable choice. In order to use any of these devices for measurement it is necessary to empirically calibrate them. That is, pass a known volume through the T. Nithin, Department of Mechanical Engineering, R V College of Engineering, Bangalore. Nikhil Jain, Department of Mechanical Engineering, R V College of Engineering, Bangalore. Adarsha Hiriyannaiah, Assistant professor, Department of Mechanical Engineering, R V College of Engineering, Bangalore. PAPER ID: MET21 Optimization of Venturi Flow Meter Model for the Angle of Divergence with Minimal Pressure Drop by Computational Fluid Dynamics Method T. Nithin, Nikhil Jain and Adarsha Hiriyannaiah F
Transcript of Optimization of Venturi Flow Meter Model for the Angle of ... · Keywords---Venturimeter,...
International Conference on Challenges and Opportunities in Mechanical Engineering, Industrial Engineering and Management Studies 658 (ICCOMIM - 2012), 11-13 July, 2012
ISBN 978-93-82338-04-8 | © 2012 Bonfring
Abstract--- The conceptualization of this project is inspired by the experiments conducted for the calibration of Venturimeter and the loss of water head at the downstream of pipe flow in various hydraulic power plants.
The Venturimeter, a typical obstruction type flow meters are widely used in industry for flow measurements. A significant amount of pressure loss occurs in pipelines due to the obstructions present in these types of flow meters. Permanent pressure loss depends on the shape of obstruction, the diameter ratio and also on properties of the fluid [1]. But a differential pressure at minimum pressure loss is the most desirable condition for an ideal Flow Meter. In the present work, Computational Fluid Dynamics (CFD) has been used to compute the permanent pressure loss and relative pressure loss for 2D incompressible fluid for various designs of a classical Venturimeter.
The Computational Fluid Dynamics (CFD) software ANSYS FLUENT© has been used as a tool to perform modeling and simulation of the Venturimeter. The results of the simulation show that there is a minimum pressure drop in the instrument only for one value of angle of divergence for an unchanged angle of convergence. The simulation results were compared to the Venturi flow meter installed at R V College of Engineering. The results can be interpreted for a better design of the throat shape and the overall Venturi flow meter design and can reduce the pumping cost of the system. Hence, the focus of the study was directed towards optimizing the present model that takes into account most of the experimental variables.
Keywords--- Venturimeter, Computational Fluid Dynamics (CFD), pressure drop, angle of divergence, angle of convergence
I. INTRODUCTION low meters are used in the industry to measure the volumetric flow rate of fluids. Differential pressure type flow meters (Head flow meters) measure flow rate by introducing a constriction in the flow. The pressure difference
caused by the constriction is correlated to the flow rate using Bernoulli's theorem.
If a constriction is placed in a pipe carrying a stream of fluid, there will be an increase in velocity, and hence an increase in kinetic energy, at the point of constriction. From energy balance as given by Bernoulli’s theorem, there must be a corresponding reduction in static pressure. Rate of discharge from the constriction can be calculated by knowing this pressure reduction, the area available for flow at the constriction, the density of the fluid and the coefficient of discharge Cd. Coefficient of discharge is the ratio of actual flow to the theoretical flow and makes allowances for stream contraction and frictional effects. Venturimeter, orifice meter, and Pitot tube are widely used head flow meters in the industry. The Pitot-static is often used for measuring the local velocity in pipes or ducts.
For measuring flow in enclosed ducts or channels, the Venturimeter and orifice meters are more convenient and more frequently used. The Venturimeter is widely used particularly for large volume liquid and gas flows since it exhibits little pressure loss. However, for smaller pipes orifice meter is a suitable choice. In order to use any of these devices for measurement it is necessary to empirically calibrate them. That is, pass a known volume through the
T. Nithin, Department of Mechanical Engineering, R V College of Engineering, Bangalore. Nikhil Jain, Department of Mechanical Engineering, R V College of Engineering, Bangalore. Adarsha Hiriyannaiah, Assistant professor, Department of Mechanical Engineering, R V College of Engineering, Bangalore. PAPER ID: MET21
Optimization of Venturi Flow Meter Model for the Angle of Divergence with Minimal Pressure Drop by Computational Fluid Dynamics Method
T. Nithin, Nikhil Jain and Adarsha Hiriyannaiah
F
International Conference on Challenges and Opportunities in Mechanical Engineering, Industrial Engineering and Management Studies 659 (ICCOMIM - 2012), 11-13 July, 2012
ISBN 978-93-82338-04-8 | © 2012 Bonfring
meter and note the reading in order to provide a standard for measuring other quantities.
Venturimeter: One of the disadvantages of orifice meters is the large irreversible pressure loss across the orifice, which results
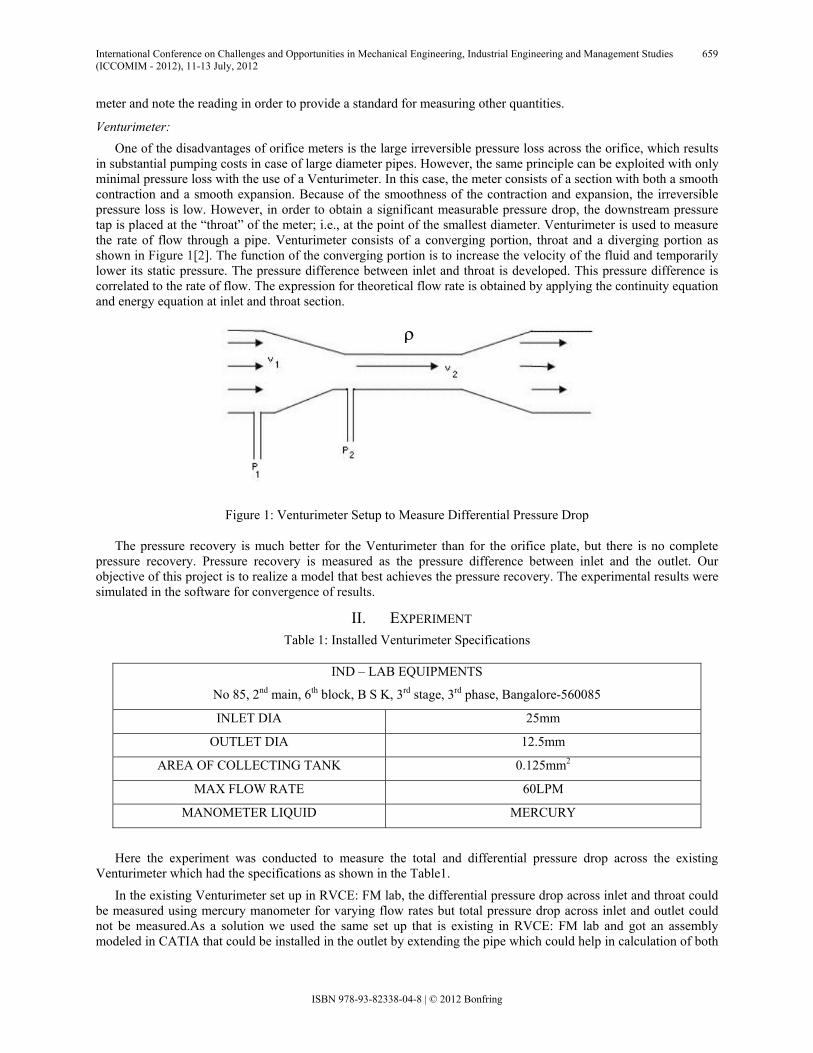
in substantial pumping costs in case of large diameter pipes. However, the same principle can be exploited with only minimal pressure loss with the use of a Venturimeter. In this case, the meter consists of a section with both a smooth contraction and a smooth expansion. Because of the smoothness of the contraction and expansion, the irreversible pressure loss is low. However, in order to obtain a significant measurable pressure drop, the downstream pressure tap is placed at the “throat” of the meter; i.e., at the point of the smallest diameter. Venturimeter is used to measure the rate of flow through a pipe. Venturimeter consists of a converging portion, throat and a diverging portion as shown in Figure 1[2]. The function of the converging portion is to increase the velocity of the fluid and temporarily lower its static pressure. The pressure difference between inlet and throat is developed. This pressure difference is correlated to the rate of flow. The expression for theoretical flow rate is obtained by applying the continuity equation and energy equation at inlet and throat section.
Figure 1: Venturimeter Setup to Measure Differential Pressure Drop
The pressure recovery is much better for the Venturimeter than for the orifice plate, but there is no complete pressure recovery. Pressure recovery is measured as the pressure difference between inlet and the outlet. Our objective of this project is to realize a model that best achieves the pressure recovery. The experimental results were simulated in the software for convergence of results.
II. EXPERIMENT Table 1: Installed Venturimeter Specifications
IND – LAB EQUIPMENTS
No 85, 2nd main, 6th block, B S K, 3rd stage, 3rd phase, Bangalore-560085
INLET DIA 25mm
OUTLET DIA 12.5mm
AREA OF COLLECTING TANK 0.125mm2
MAX FLOW RATE 60LPM
MANOMETER LIQUID MERCURY
Here the experiment was conducted to measure the total and differential pressure drop across the existing Venturimeter which had the specifications as shown in the Table1.
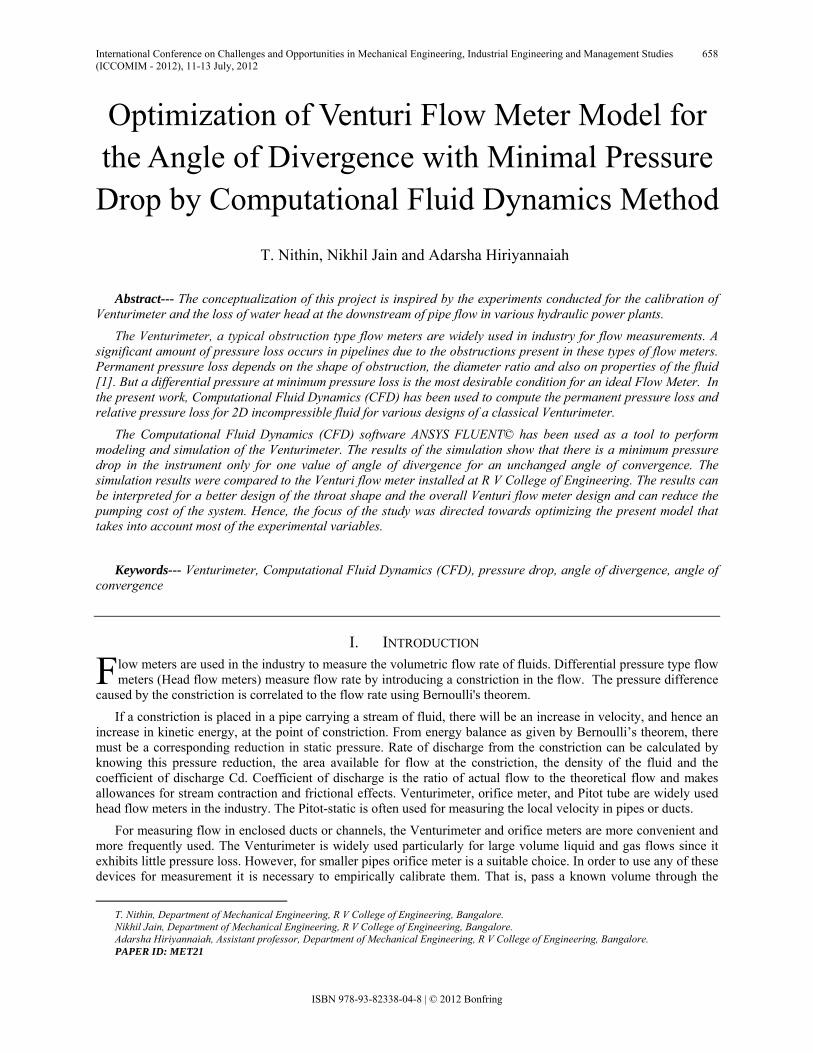
In the existing Venturimeter set up in RVCE: FM lab, the differential pressure drop across inlet and throat could be measured using mercury manometer for varying flow rates but total pressure drop across inlet and outlet could not be measured.As a solution we used the same set up that is existing in RVCE: FM lab and got an assembly modeled in CATIA that could be installed in the outlet by extending the pipe which could help in calculation of both
ρ

International Conference on Challenges and Opportunities in Mechanical Engineering, Industrial Engineering and Management Studies 660 (ICCOMIM - 2012), 11-13 July, 2012
ISBN 978-93-82338-04-8 | © 2012 Bonfring
differential and total pressure drop. We assembled the set up accordingly.
Component Used: The installed Venturimeter setup, fabricated attachment to measure total pressure drop as shown in Figure 2,
mercury manometer, power supply. Table 2 shown the list of components used for fabricating the attachment.
Figure 2: CATIA Model of the Fabricated Attachment
Table 2: List of Material Used for Fabricating the Attachment
Component Quantity Material Cost(in Rs) Flange 2 PVC 50 Gaskit 1 Rubber polymer 15 Nuts 8 Mild steel 16 Bolts 8 Mild steel 32
Washer 8 Mild steel 8 Tube(for extension) 1 PVC 20
Nipple 1 Brass 20 Assembling process 150
Total = 311 /-
Setup: The fabricated attachment was connected to the downstream of the existing Venturimeter as shown in Figure 3
Appendix A.
Procedure: The mercury manometer is connected across inlet and the throat of the Venturimeter. The water supply is turned
on. Water is allowed to flow into the collecting tank through the Venturimeter, the difference in the height of mercury in the two limbs of the manometer is noted. Time taken for 20cm rise in level of water in the collecting tank is noted down using a stopwatch, also the area of the tank is known, therefore the actual and the theoretical discharge is obtained. This pressure drop gives the differential pressure drop.
The mercury manometer is now connected between inlet and the outlet of Venturimeter which measures the total pressure drop.

International Conference on Challenges and Opportunities in Mechanical Engineering, Industrial Engineering and Management Studies 661 (ICCOMIM - 2012), 11-13 July, 2012
ISBN 978-93-82338-04-8 | © 2012 Bonfring
III. MODELING & SIMULATION With the experimental results in hand, the next step was to simulate the results using CFD, which was done using
the CFD simulation software, ANSYS FLUENT© and the following procedure was adopted:
The Venturi flow was simulated for incompressible 2D flow, which means the density of the fluid is assumed to be unchanged (1000 kg/m3) throughout its flow. And the geometry was an axisymmetric model of the Venturi design. Water was used as a fluid with a viscosity of 890.3 µPa s at 25o C. laminar flow was assumed as the Reynolds number was found to be less than 2300. With gauge pressure at outlet as 0 Pa the inlet velocities were varied for different profile with varying angles of divergence. Finally with the total pressure drop an optimized model was arrived at, and the range of velocity was also determined.
The simulation was conducted for the following velocities as given in Table 3 shown beside:
Table 3: Velocity Parameter for Simulation
S. No. Velocity at inlet(m/s)
Installed Venturi design
Angle of divergence (4.76)
Velocity 1 1.368
Velocity 2 1.736
Velocity 3 2.037
Angle of divergence (4.46)
Velocity 1 1.368
Velocity 2 1.736
Velocity 3 2.037
Angle of divergence (3.97)
Velocity 1 1.368
Velocity 2 1.736
Velocity 3 2.037
Smooth curve profile
Velocity 1 1.368
Velocity 2 1.736
Velocity 3 2.037
Throat length profile
Velocity 1 1.368
Velocity 2 1.736
Velocity 3 2.037

International Conference on Challenges and Opportunities in Mechanical Engineering, Industrial Engineering and Management Studies 662 (ICCOMIM - 2012), 11-13 July, 2012
ISBN 978-93-82338-04-8 | © 2012 Bonfring
IV. RESULTS & DISCUSSIONS Differential pressure loss and total pressure loss have been computed by using CFD code “ANSYS FLUENT”
for the existing venturi design and the results was compared to the experimental values for various flow rates. The study was later focused simulating the flow and measuring the total and differential pressure drops for various values of angle of divergence and inlet velocities for the different venturi profiles and arriving at the optimized design.
From the experiment on the existing Venturimeter i.e. angle of divergence being 4.76 degrees, the total pressure drop across the inlet and outlet of Venturimeter was determined for three different inlet velocities. For the same profile, total pressure loss was found to be less by simulation than experimentation. There could be various reasons for this, firstly the inner wall of the Venturimeter might not be clean and perfect after a prolonged use, and secondly, there can be pressure loss due to expansion and contraction in the attachment in the downstream of Venturimeter. By knowing the velocities at inlet and throat, the differential pressure drop was also found using Bernoulli’s equation. Table 4, Appendix C shows the values of pressures.
The angle of divergence was reduced for the same profile and it was simulated for the same set of inlet velocities. For the angle of divergence 4.46 degrees, the differential and total pressure drop was found to increase for all the set of inlet velocities, as per Table 4 Appendix C. It is noted that the increase in pressure drop is very small. For the angle of divergence 3.97 degrees, the nature of pressure drop was not found to be regular. For inlet velocities of 1.368 m/s and 1.736 m/s, the total pressure drop reduced substantially but there was no much difference in differential pressure drop. But when the inlet velocity was raised to 2.037 m/s, the total pressure drop increased to a significant Figure, not making very much difference in differential pressure drop.
Smooth curve profile was modeled for angle of divergence 4.76 degrees and simulated for same set of inlet velocities. The velocity at outlet was found to be at a very high value, a case of a typical convergent divergent nozzle used to increase the velocity at outlet. Due to which, he total and differential pressure drop increased to a large amount as compared to the existing design, not proving to be an optimum design. Hence no further simulation was carried out with the smooth curve profile.
With numerous design changes we arrived at an optimized design called the throat length design. Throat length profile was modeled for angle of divergence 4.2 degrees with a small throat length of 10mm at the throat and simulated for same set of inlet velocities. The total and differential pressure drop reduced to a small figure relatively. But the inlet velocity of 1.368 m/s showed minimum total pressure drop shown in Table 6 Appendix C. Figure 4 and Figure 5 in Appendix B shows the contours and graphs (velocity, static pressure, dynamic pressure, total pressure variation) for the angle of divergence 4.2 deg, inlet velocity 1.368m/s. Hence, with a minimum total pressure drop for the given differential pressure drop, it was considered to be an optimum design.
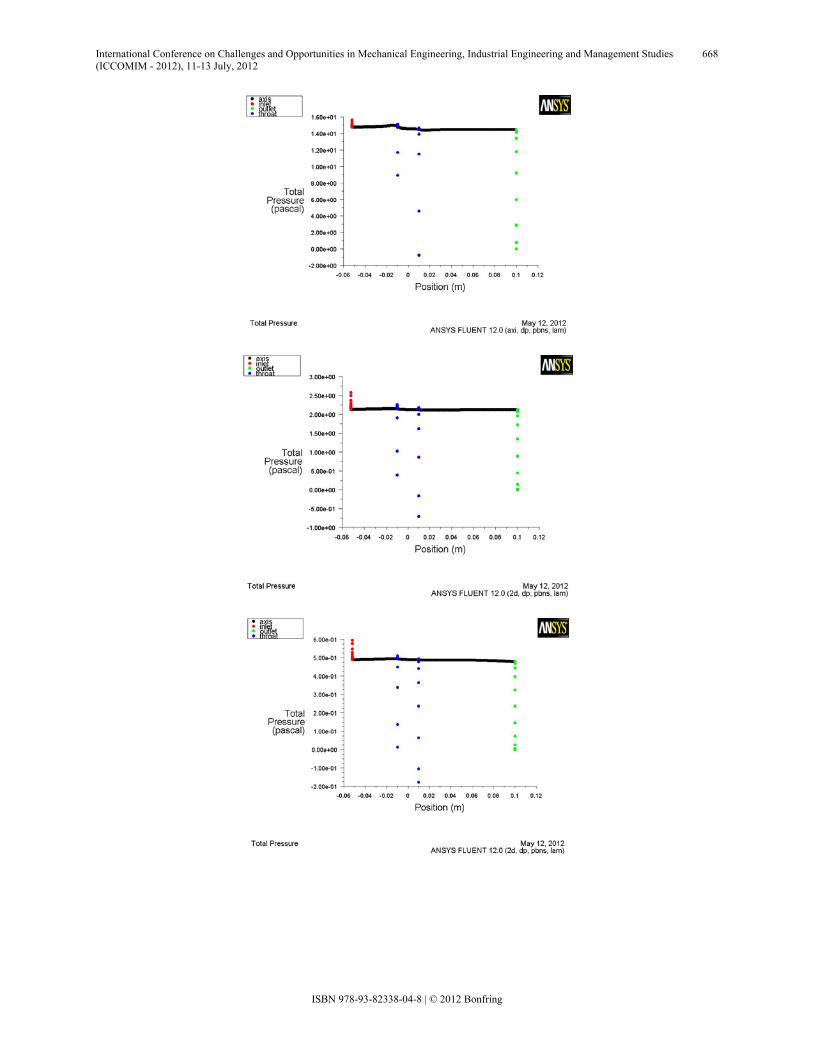
The next step was to compare the results various inlet velocities to obtain a range for which the throat length design is at its best. This was achieved by varying the inlet velocities ranging from 100 m/s to 0.01 m/s assuming the same flow condition, the results might be fault a very high velocity as it switches from laminar flow to turbulent flow. The results was found to give a minimum total pressure drop for the inlet velocity range of 0.4m/s to 5m/s for a maximum differential pressure drop. Graphs in Figure 6 Appendix B, shows the variation of Total pressure varying across the Venturimeter for different inlet velocities ranging from 0.45 m/s to 5 m/s.
V. CONCLUSION The simulation for the existing Venturimeter profile was found to be agreeing with the experiment, for low
values of velocity. The smooth curve profile can be used for any typical convergent divergent nozzle to get high velocity as the velocity is maintained at a high level. A small throat length with less angle of divergence was found to give the least pressure loss for max differential pressure loss. As a long-term study we’d like to extent the study to de Laval nozzle at compressible flow condition.
From the simulation we concluded that the throat length profile for the following specification and range of inlet velocity the optimal design we have arrived at.
Best design:
Inlet dia : 25mm
Outlet dia : 25mm
International Conference on Challenges and Opportunities in Mechanical Engineering, Industrial Engineering and Management Studies 663 (ICCOMIM - 2012), 11-13 July, 2012
ISBN 978-93-82338-04-8 | © 2012 Bonfring
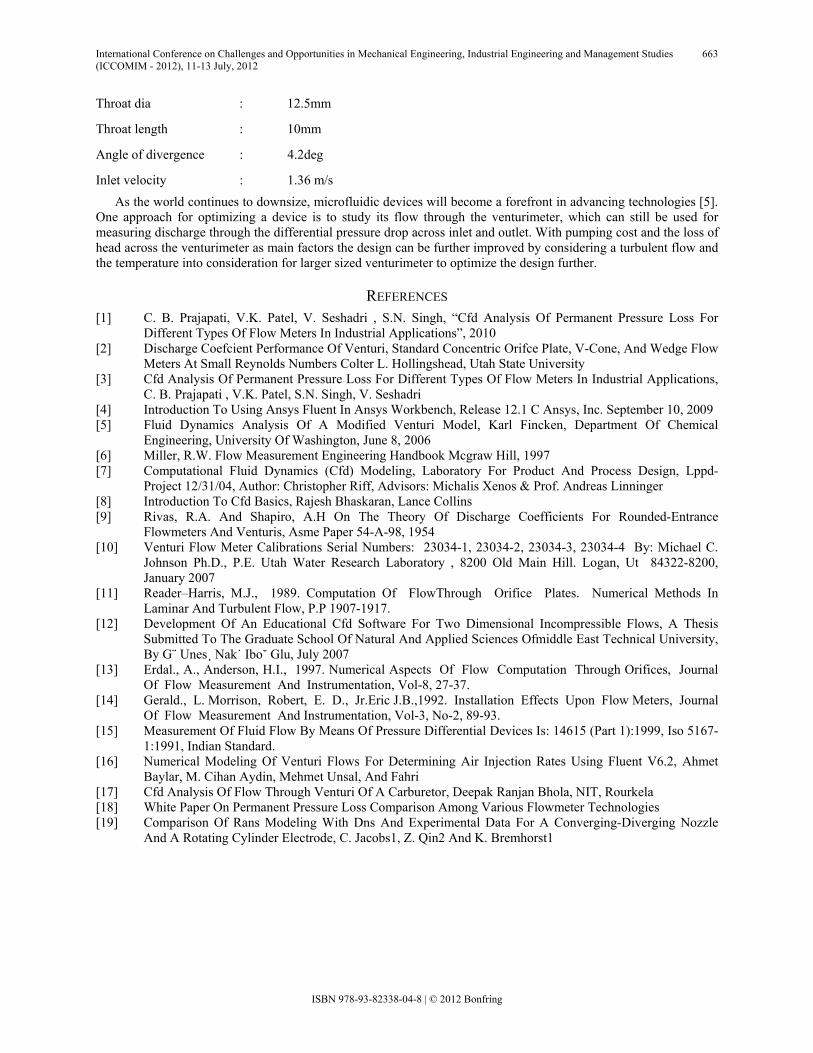
Throat dia : 12.5mm
Throat length : 10mm
Angle of divergence : 4.2deg
Inlet velocity : 1.36 m/s As the world continues to downsize, microfluidic devices will become a forefront in advancing technologies [5].
One approach for optimizing a device is to study its flow through the venturimeter, which can still be used for measuring discharge through the differential pressure drop across inlet and outlet. With pumping cost and the loss of head across the venturimeter as main factors the design can be further improved by considering a turbulent flow and the temperature into consideration for larger sized venturimeter to optimize the design further.
REFERENCES [1] C. B. Prajapati, V.K. Patel, V. Seshadri , S.N. Singh, “Cfd Analysis Of Permanent Pressure Loss For
Different Types Of Flow Meters In Industrial Applications”, 2010 [2] Discharge Coefcient Performance Of Venturi, Standard Concentric Orifce Plate, V-Cone, And Wedge Flow
Meters At Small Reynolds Numbers Colter L. Hollingshead, Utah State University [3] Cfd Analysis Of Permanent Pressure Loss For Different Types Of Flow Meters In Industrial Applications,
C. B. Prajapati , V.K. Patel, S.N. Singh, V. Seshadri [4] Introduction To Using Ansys Fluent In Ansys Workbench, Release 12.1 C Ansys, Inc. September 10, 2009 [5] Fluid Dynamics Analysis Of A Modified Venturi Model, Karl Fincken, Department Of Chemical
Engineering, University Of Washington, June 8, 2006 [6] Miller, R.W. Flow Measurement Engineering Handbook Mcgraw Hill, 1997 [7] Computational Fluid Dynamics (Cfd) Modeling, Laboratory For Product And Process Design, Lppd-
Project 12/31/04, Author: Christopher Riff, Advisors: Michalis Xenos & Prof. Andreas Linninger [8] Introduction To Cfd Basics, Rajesh Bhaskaran, Lance Collins [9] Rivas, R.A. And Shapiro, A.H On The Theory Of Discharge Coefficients For Rounded-Entrance
Flowmeters And Venturis, Asme Paper 54-A-98, 1954 [10] Venturi Flow Meter Calibrations Serial Numbers: 23034-1, 23034-2, 23034-3, 23034-4 By: Michael C.
Johnson Ph.D., P.E. Utah Water Research Laboratory , 8200 Old Main Hill. Logan, Ut 84322-8200, January 2007
[11] Reader–Harris, M.J., 1989. Computation Of FlowThrough Orifice Plates. Numerical Methods In Laminar And Turbulent Flow, P.P 1907-1917.
[12] Development Of An Educational Cfd Software For Two Dimensional Incompressible Flows, A Thesis Submitted To The Graduate School Of Natural And Applied Sciences Ofmiddle East Technical University, By G¨ Unes¸ Nak˙ Ibo˘ Glu, July 2007
[13] Erdal., A., Anderson, H.I., 1997. Numerical Aspects Of Flow Computation Through Orifices, Journal Of Flow Measurement And Instrumentation, Vol-8, 27-37.
[14] Gerald., L. Morrison, Robert, E. D., Jr.Eric J.B.,1992. Installation Effects Upon Flow Meters, Journal Of Flow Measurement And Instrumentation, Vol-3, No-2, 89-93.
[15] Measurement Of Fluid Flow By Means Of Pressure Differential Devices Is: 14615 (Part 1):1999, Iso 5167-1:1991, Indian Standard.
[16] Numerical Modeling Of Venturi Flows For Determining Air Injection Rates Using Fluent V6.2, Ahmet Baylar, M. Cihan Aydin, Mehmet Unsal, And Fahri
[17] Cfd Analysis Of Flow Through Venturi Of A Carburetor, Deepak Ranjan Bhola, NIT, Rourkela [18] White Paper On Permanent Pressure Loss Comparison Among Various Flowmeter Technologies [19] Comparison Of Rans Modeling With Dns And Experimental Data For A Converging-Diverging Nozzle
And A Rotating Cylinder Electrode, C. Jacobs1, Z. Qin2 And K. Bremhorst1

International Conference on Challenges and Opportunities in Mechanical Engineering, Industrial Engineering and Management Studies 664 (ICCOMIM - 2012), 11-13 July, 2012
ISBN 978-93-82338-04-8 | © 2012 Bonfring
APPENDIX A
EXPERIMENT
Figure 3: Experimental Setup for Measurement of Total and Differential Pressure Loss
APPENDIX B
CONTOURS AND GRAPHS Simulated Perfect Design (Throat Length Profile):

International Conference on Challenges and Opportunities in Mechanical Engineering, Industrial Engineering and Management Studies 665 (ICCOMIM - 2012), 11-13 July, 2012
ISBN 978-93-82338-04-8 | © 2012 Bonfring
Figure 4: Angle of Divergence 4.2 deg, Inlet Velocity 1.368m/s

International Conference on Challenges and Opportunities in Mechanical Engineering, Industrial Engineering and Management Studies 666 (ICCOMIM - 2012), 11-13 July, 2012
ISBN 978-93-82338-04-8 | © 2012 Bonfring
Figure 5: Angle of Divergence 4.2 deg, Inlet Velocity 1.368m/s

International Conference on Challenges and Opportunities in Mechanical Engineering, Industrial Engineering and Management Studies 667 (ICCOMIM - 2012), 11-13 July, 2012
ISBN 978-93-82338-04-8 | © 2012 Bonfring
Simulated Perfect Design (Throat Length Profile for Velocity Range [100m/s-.01m/s]):
International Conference on Challenges and Opportunities in Mechanical Engineering, Industrial Engineering and Management Studies 668 (ICCOMIM - 2012), 11-13 July, 2012
ISBN 978-93-82338-04-8 | © 2012 Bonfring

International Conference on Challenges and Opportunities in Mechanical Engineering, Industrial Engineering and Management Studies 669 (ICCOMIM - 2012), 11-13 July, 2012
ISBN 978-93-82338-04-8 | © 2012 Bonfring
Figure 6: Inlet velocities- 5, 1.736, 1.368, 1, 0.45, 0.4(m/s)
APPENDIX C
TABLES Table 4: Experimental and Simulated Pressure Drop Results for Installed Venturi Design
SL No Velocity at
inlet(m/s)
Velocity at
throat(m/s)
Velocity at
outlet(m/s)
Differential,
static pressure
loss(pa)
Total, static
pressure
loss(pa)
Experimental
pressure
values(Pa)
Angle of the divergence(4.76)
Velocity 1 1.368 5.26633 4.23449 12932 8030 9888.48
Velocity 2 1.736 6.62284 5.14677 20424 11738 13596.66
Velocity 3 2.037 7.73005 5.8453 27802 15009 19776.96
Angle of divergence (4.46)
Velocity 1 1.368 5.275 4.247 12977 8083
Velocity 2 1.736 6.634 5.169 20498 11852
Velocity 3 2.037 7.744 5.875 27910 15183
Angle of divergence (3.97)
Velocity 1 1.368 5.23633 3.82223 12774 6369
Velocity 2 1.736 6.5974 4.51913 20256 8705
Velocity 3 2.037 7.67497 6.42711 27378 18579

International Conference on Challenges and Opportunities in Mechanical Engineering, Industrial Engineering and Management Studies 670 (ICCOMIM - 2012), 11-13 July, 2012
ISBN 978-93-82338-04-8 | © 2012 Bonfring
Table 5: Smooth Curve Profile for 4.76deg Angle of Divergence
SL no Velocity at inlet(m/s)
Velocity at throat(m/s)
Velocity at outlet(m/s)
Differential ,static pressure loss(pa)
Total ,static pressure loss(pa)
Velocity 1 1.368 5.70709 6.19374 15350 18246
Velocity 2 1.736 7.16685 7.59114 24175 27306
Velocity 3 2.037 8.35727 8.66064 32847 35429
Table 6: Throat Length Profile for 4.2 Angle of Divergence
SL no Velocity at inlet(m/s)
Velocity at throat(m/s)
Velocity at outlet(m/s)
Differential ,static pressure loss(pa)
Total ,static pressure loss(pa)
Velocity 1 1.368 2.95446 2.51523 3429 2228
Velocity 2 1.736 3.68738 3.12749 5292 3384
Velocity 3 2.037 4.27919 3.60786 7081 4434
ACKNOWLEDGEMENT In our Humble Endeavour, we have been aided by the support and expertise of our Guide, Adarsha Hiriyannaiah.
Not only did we receive in-depth knowledge about the general outlook of Computational Fluid Dynamics (CFD), but we also gained knowledge on possible avenues of improving and consolidating our design of this project. His constant support and faith kept us hard-working and focused.
We would fail in our duty if we do not thank our professor C S Prasad for his timely constant guidance and moral support in every stage of our work, and inspiring us to proceed further in our project especially in the experimental arena.
We sincerely thank our Head of the Department, Dr, R S Kulkarni. We thank him for the opportunity presented to perform practical applications of the theoretical knowledge imparted to us. Also, the transparent system used to conduct our project activities ensured that most of us students were aware of the requirements and guidelines to be followed.
We humbly thank our Honorable Principal, Dr. Sathyanarayana. His guidance and continued support is evident through such important and beneficial activities, which are presented to us students.
We also thank our colleagues who not only helped us in our project, but also had fruitful exchanges of knowledge. This spirit of Camaraderie has helped one and all in the conduction of this brief practical effort.