Venturi Scrubbers
47
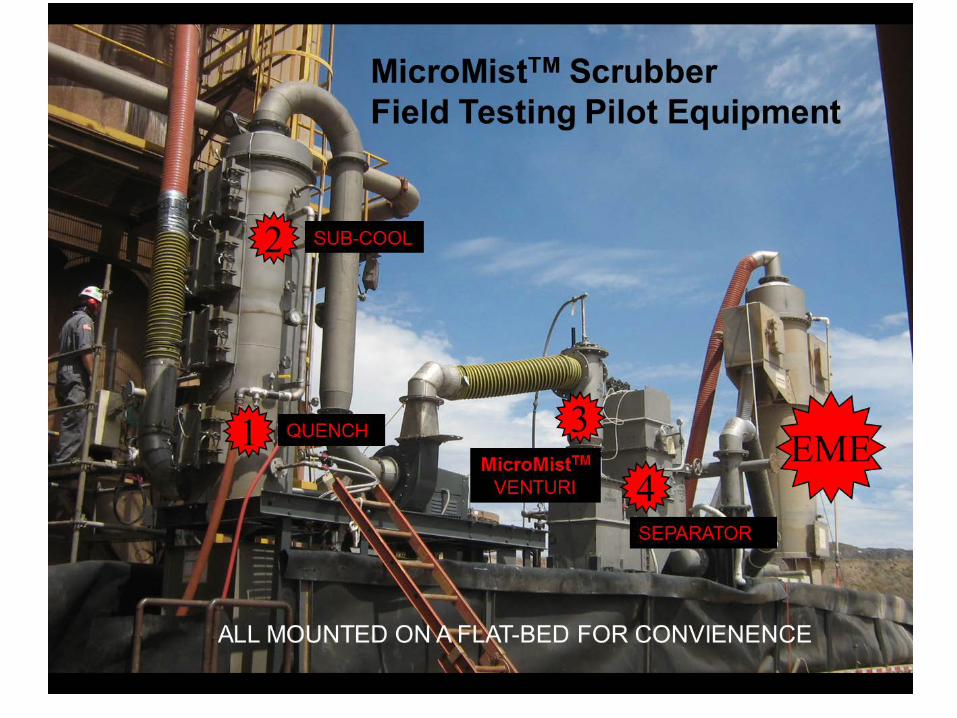
1 Venturi Scrubbers • Basics • Design Parameters • Pressure Drop • Particle Collection Efficiency • Example Design Calculations
-
Upload
anoop-sharma -
Category
Documents
-
view
1.470 -
download
179
description
detailed process description of venturi scrubber.
Transcript of Venturi Scrubbers
1
Venturi Scrubbers
• Basics • Design Parameters • Pressure Drop • Particle Collection Efficiency • Example Design Calculations
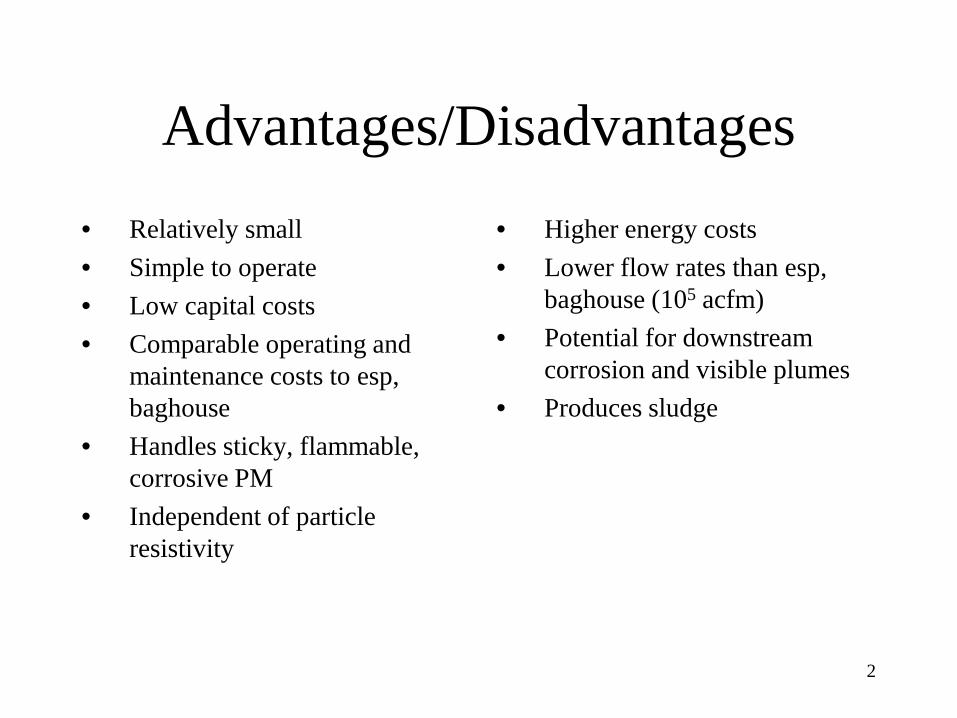
Advantages/Disadvantages • Relatively small • Simple to operate • Low capital costs • Comparable operating and
maintenance costs to esp, baghouse
• Handles sticky, flammable, corrosive PM
• Independent of particle resistivity
• Higher energy costs • Lower flow rates than esp,
baghouse (105 acfm) • Potential for downstream
corrosion and visible plumes • Produces sludge
2
3
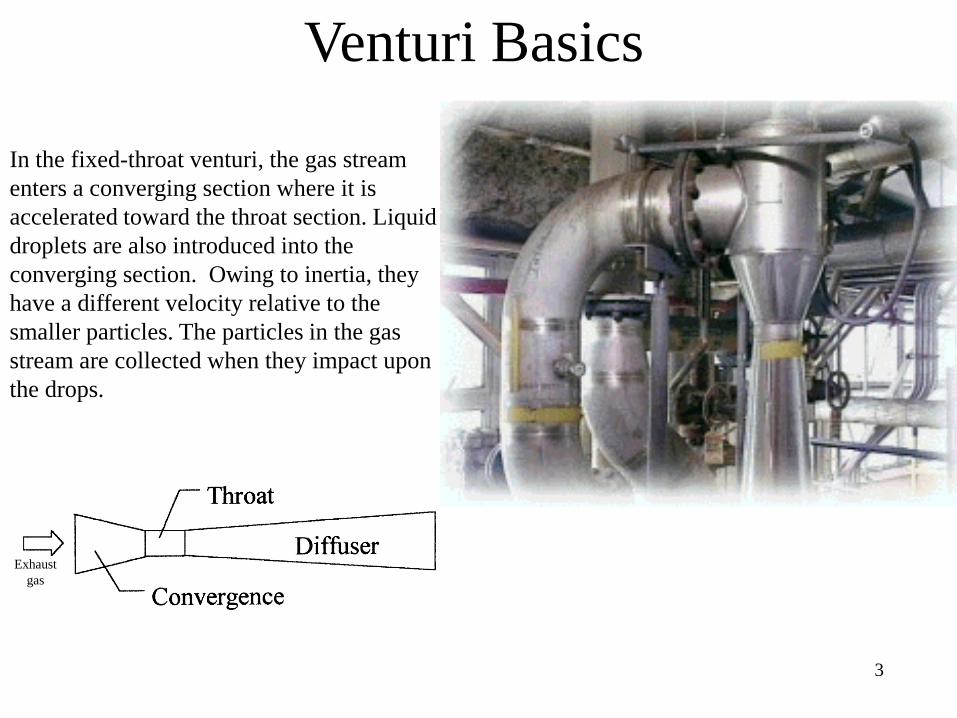
In the fixed-throat venturi, the gas stream enters a converging section where it is accelerated toward the throat section. Liquid droplets are also introduced into the converging section. Owing to inertia, they have a different velocity relative to the smaller particles. The particles in the gas stream are collected when they impact upon the drops.
Venturi Basics
Exhaust gas
4
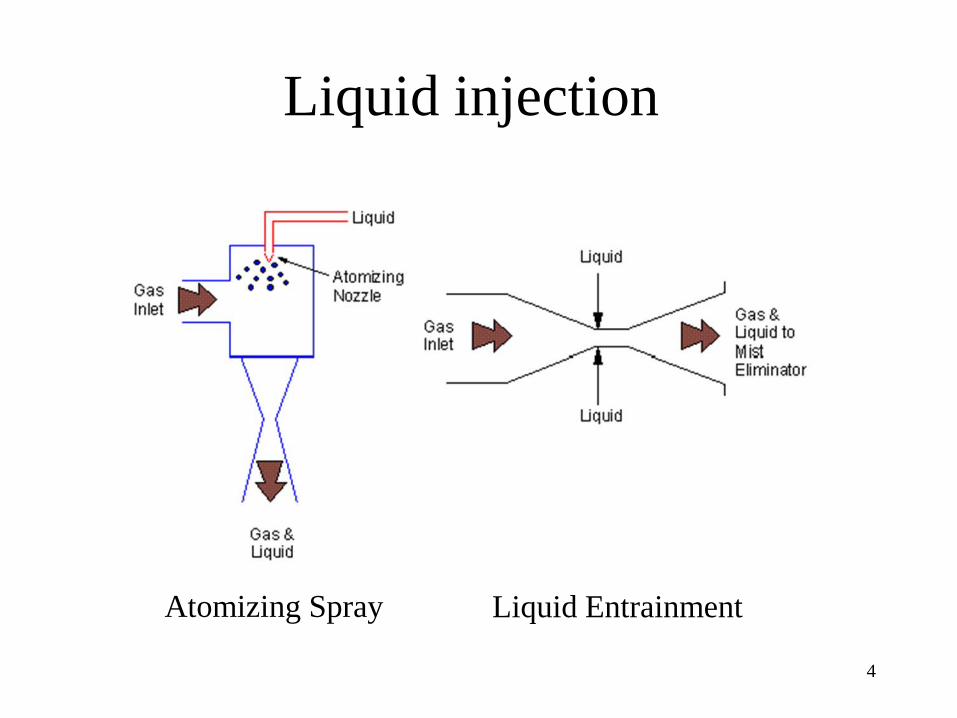
Liquid injection
Atomizing Spray Liquid Entrainment
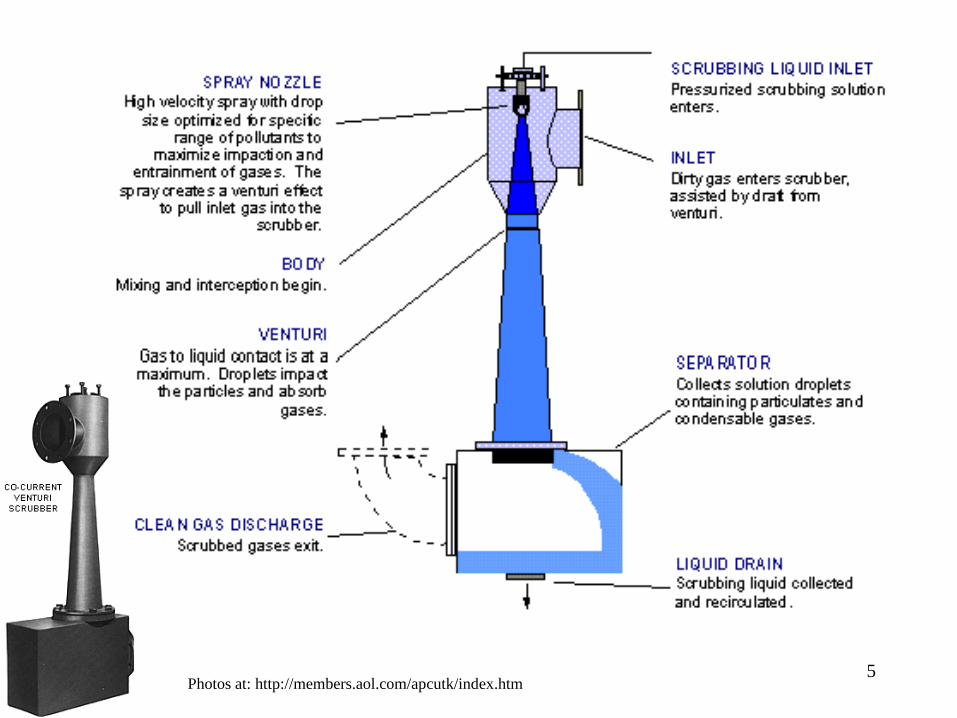
5 Photos at: http://members.aol.com/apcutk/index.htm
6
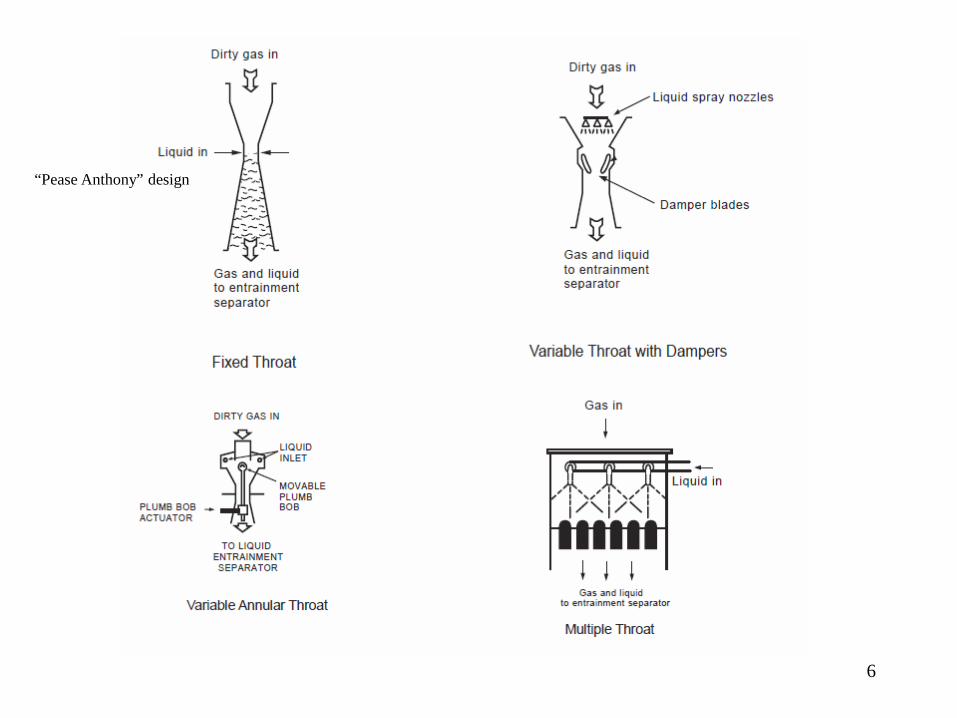
“Pease Anthony” design
7
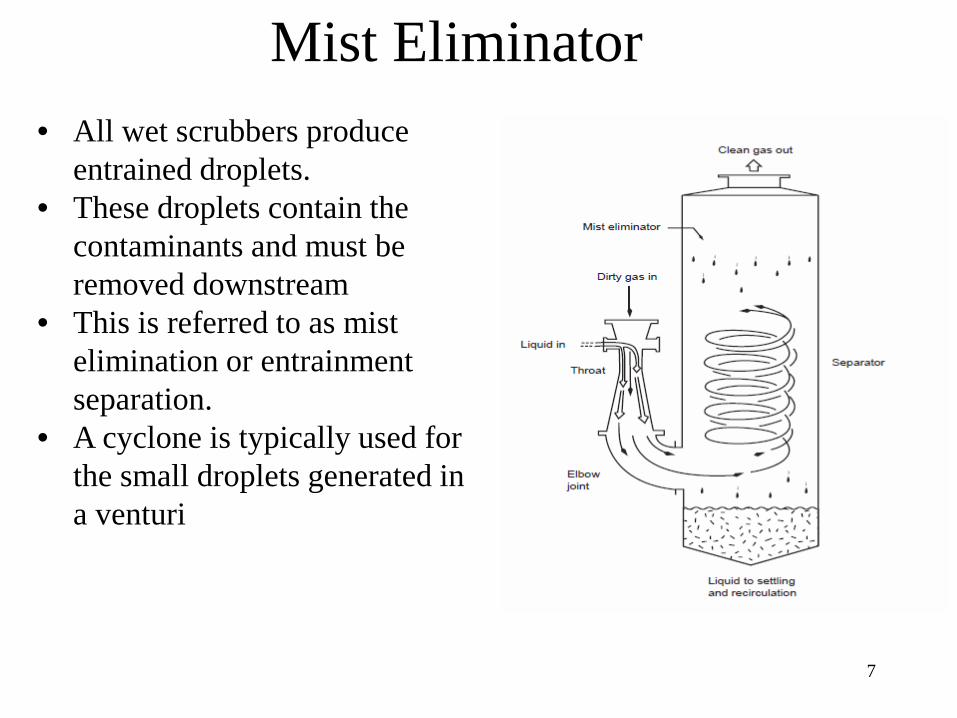
• All wet scrubbers produce entrained droplets.
• These droplets contain the contaminants and must be removed downstream
• This is referred to as mist elimination or entrainment separation.
• A cyclone is typically used for the small droplets generated in a venturi
Mist Eliminator
To determine if a wet scrubber system is working properly, field personnel should observe if possible: Outlet Gas Stream Opacity, but take into consideration the presence of water droplets, the Temperature Difference between the Gas Inlet and Outlet, the Liquid Flow Rate into the scrubber, and Pressure Drop changes in the wet scrubbers and mist eliminators. As with any inspection of an air pollution control device, attention must be given to the system’s: Records & Physical Condition, and Compliance with Applicable Rules. Wet scrubber systems used for air pollution control have many safety considerations including: Inhalation Hazards and Corrosive Liquids.
System Parameter Checklist
9
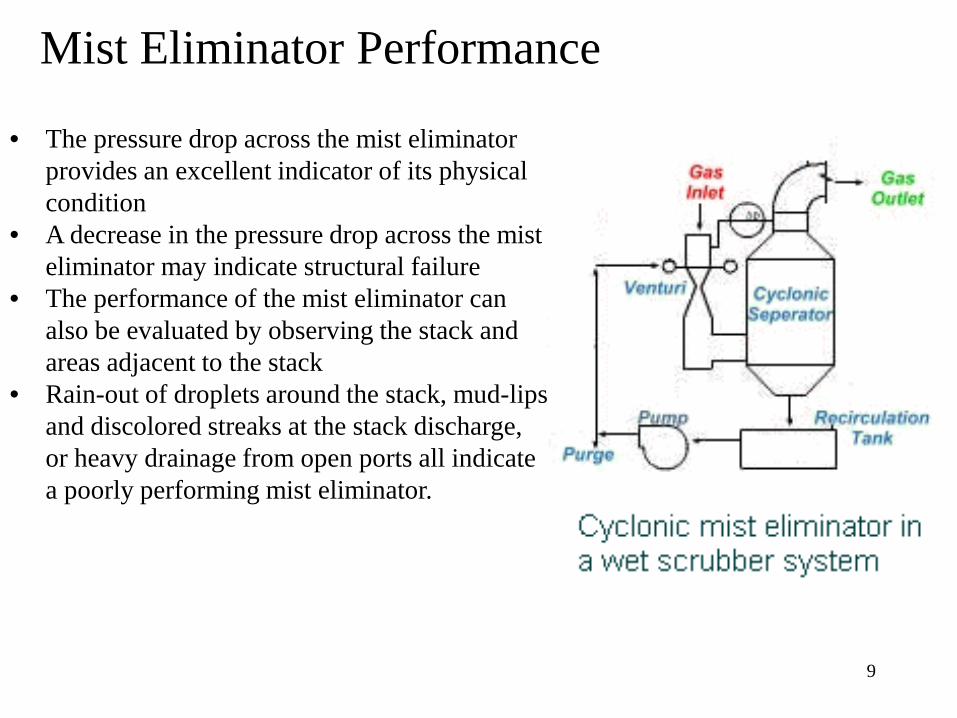
• The pressure drop across the mist eliminator provides an excellent indicator of its physical condition
• A decrease in the pressure drop across the mist eliminator may indicate structural failure
• The performance of the mist eliminator can also be evaluated by observing the stack and areas adjacent to the stack
• Rain-out of droplets around the stack, mud-lips and discolored streaks at the stack discharge, or heavy drainage from open ports all indicate a poorly performing mist eliminator.
Mist Eliminator Performance
10
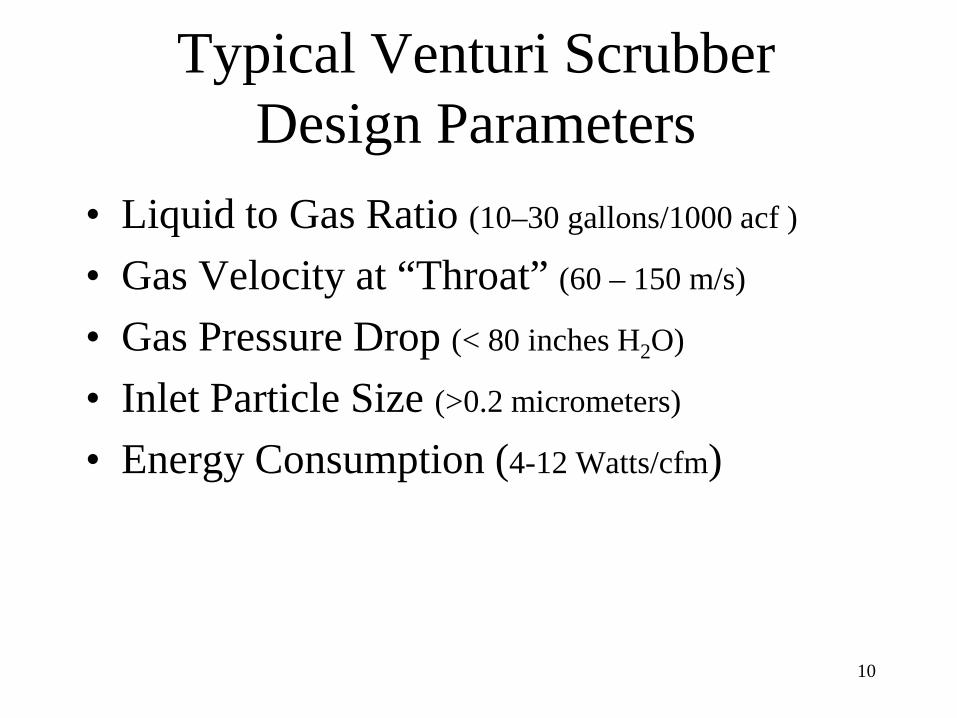
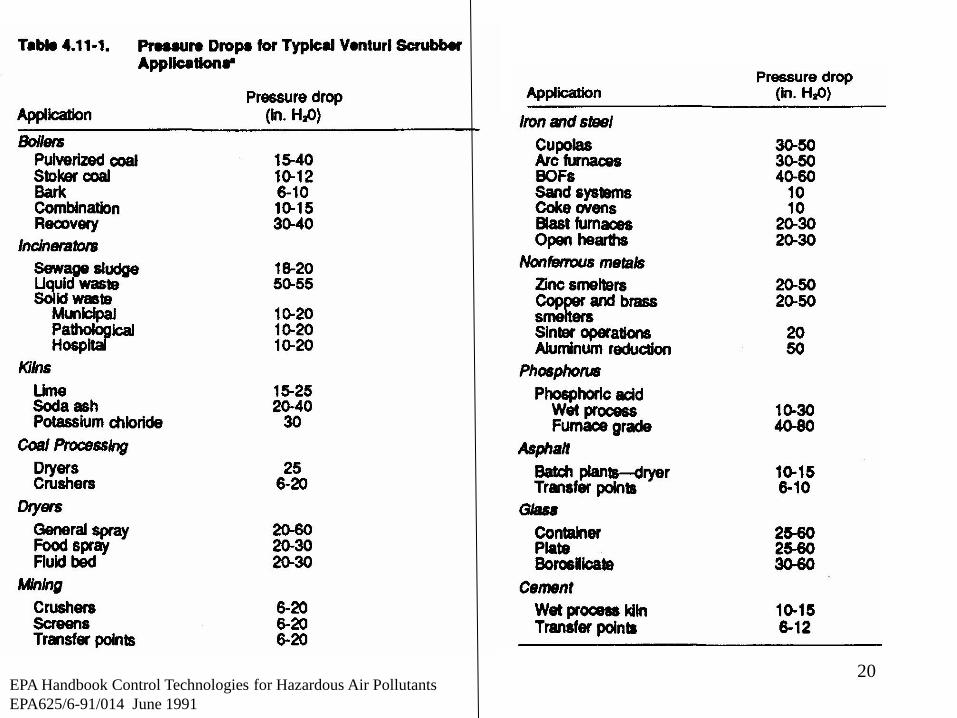
Typical Venturi Scrubber Design Parameters
• Liquid to Gas Ratio (10–30 gallons/1000 acf )
• Gas Velocity at “Throat” (60 – 150 m/s)
• Gas Pressure Drop (< 80 inches H2O)
• Inlet Particle Size (>0.2 micrometers)
• Energy Consumption (4-12 Watts/cfm)
Liquid-to-Gas Ratio
• Higher L/G, higher η • L/G optimal at 7–10 gal/1000ft3
• L/G > 10 increases ∆P and operating costs
11
12
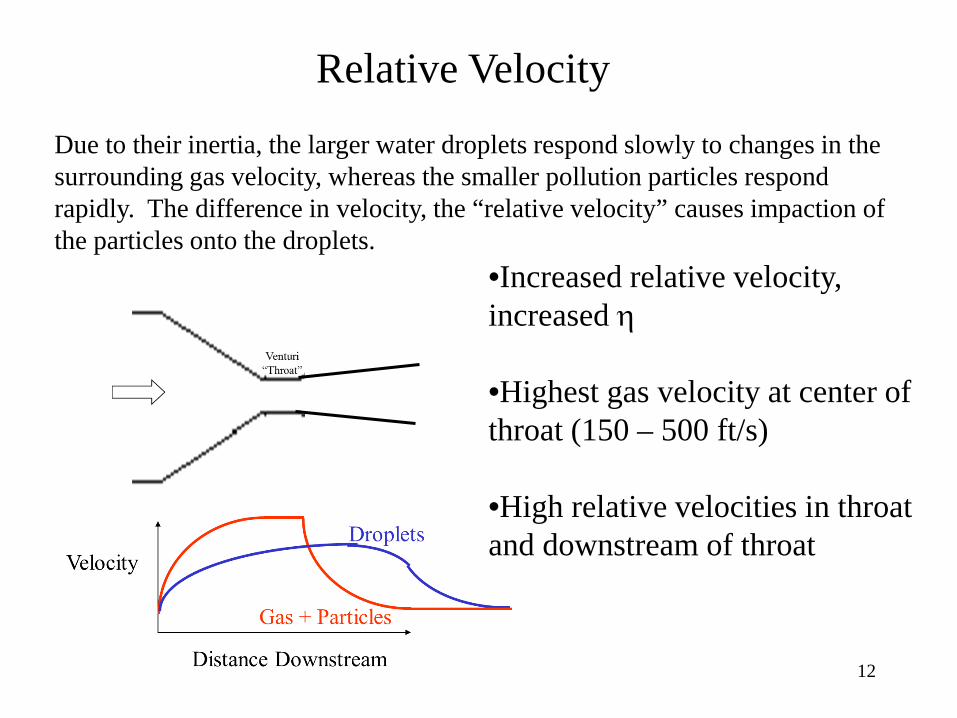
Due to their inertia, the larger water droplets respond slowly to changes in the surrounding gas velocity, whereas the smaller pollution particles respond rapidly. The difference in velocity, the “relative velocity” causes impaction of the particles onto the droplets.
Relative Velocity
•Increased relative velocity, increased η •Highest gas velocity at center of throat (150 – 500 ft/s)
•High relative velocities in throat and downstream of throat
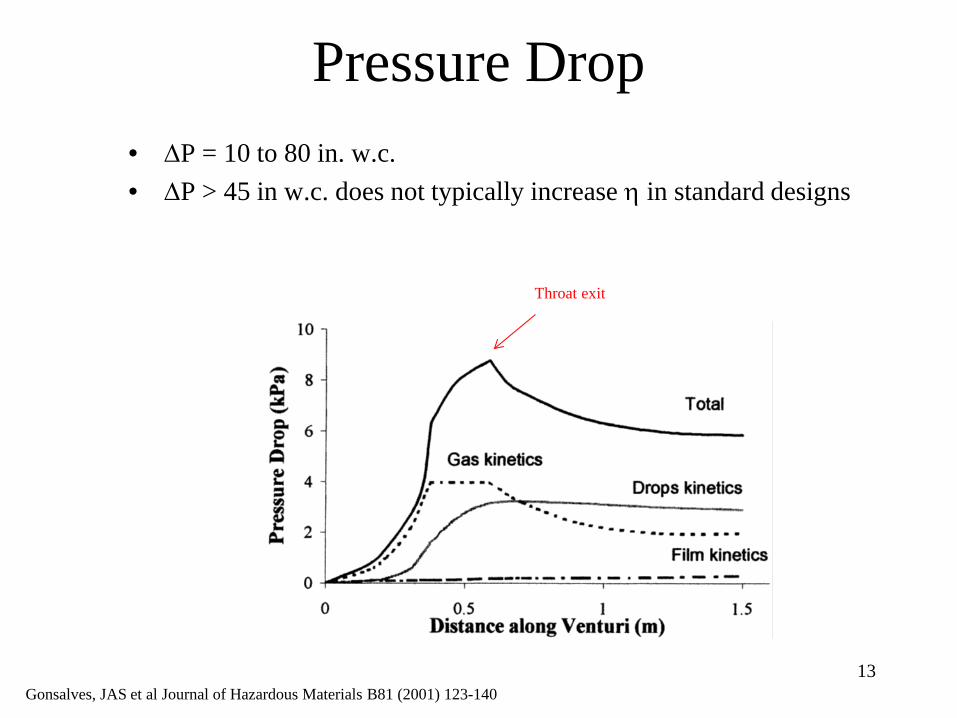
Pressure Drop • ∆P = 10 to 80 in. w.c. • ∆P > 45 in w.c. does not typically increase η in standard designs
13 Gonsalves, JAS et al Journal of Hazardous Materials B81 (2001) 123-140
Throat exit
Pressure Drop
14
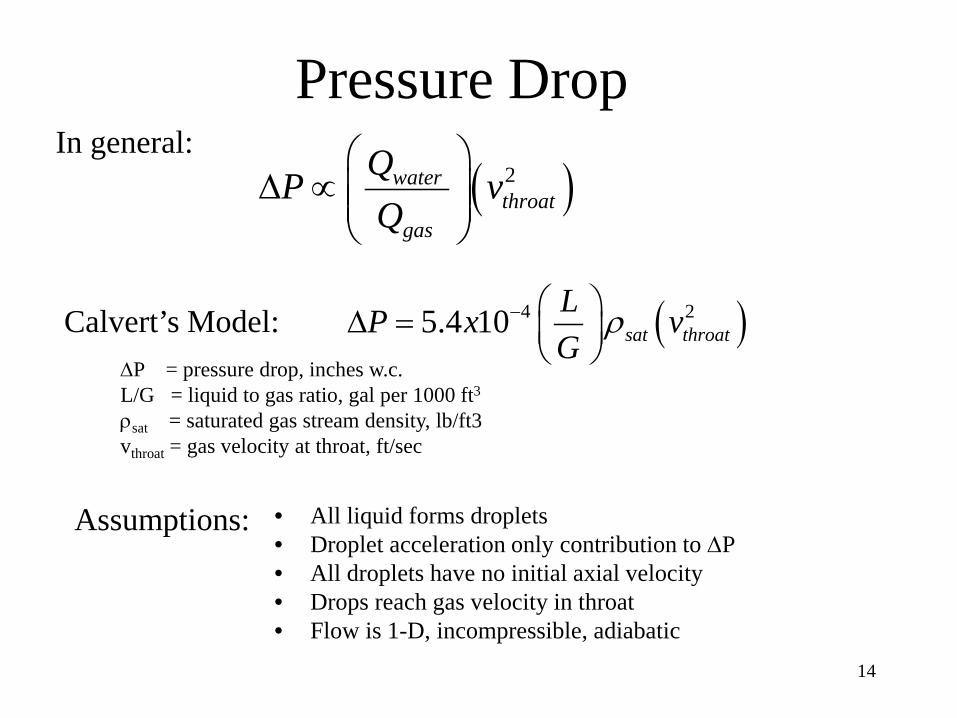
( )2waterthroat
gas
QP vQ
∆ ∝
Calvert’s Model: ( )4 25.4 10 sat throatLP x vG
ρ− ∆ =
∆P = pressure drop, inches w.c. L/G = liquid to gas ratio, gal per 1000 ft3 ρsat = saturated gas stream density, lb/ft3 vthroat = gas velocity at throat, ft/sec
In general:
Assumptions: • All liquid forms droplets • Droplet acceleration only contribution to ∆P • All droplets have no initial axial velocity • Drops reach gas velocity in throat • Flow is 1-D, incompressible, adiabatic
15
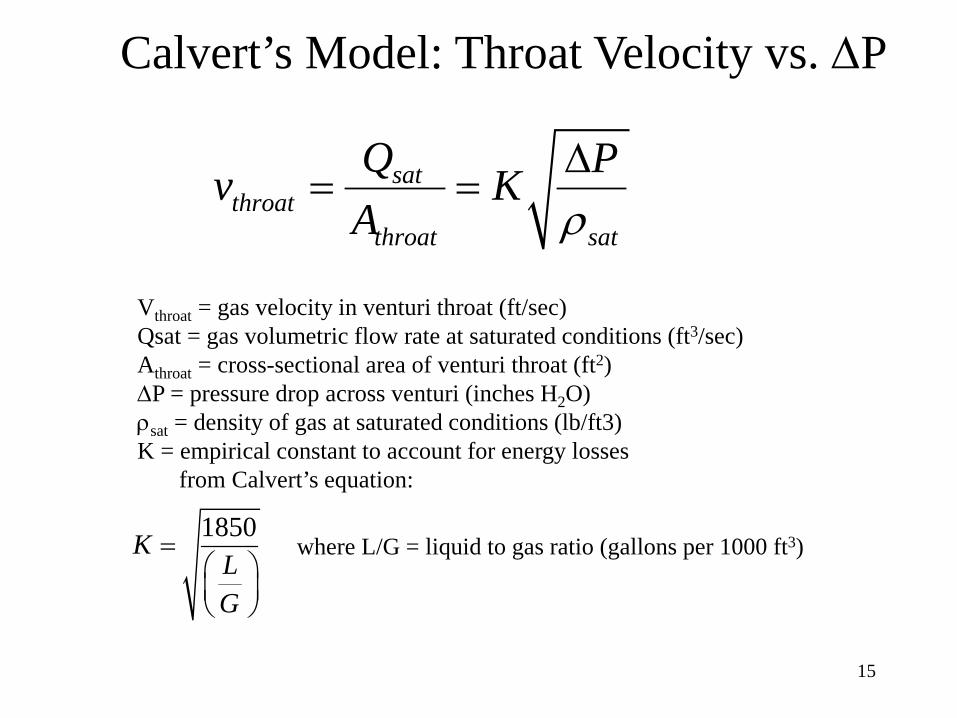
satthroat
throat sat
Q Pv KA ρ
∆= =
Vthroat = gas velocity in venturi throat (ft/sec) Qsat = gas volumetric flow rate at saturated conditions (ft3/sec) Athroat = cross-sectional area of venturi throat (ft2) ∆P = pressure drop across venturi (inches H2O) ρsat = density of gas at saturated conditions (lb/ft3) K = empirical constant to account for energy losses from Calvert’s equation:
1850KLG
=
where L/G = liquid to gas ratio (gallons per 1000 ft3)
Calvert’s Model: Throat Velocity vs. ∆P
16
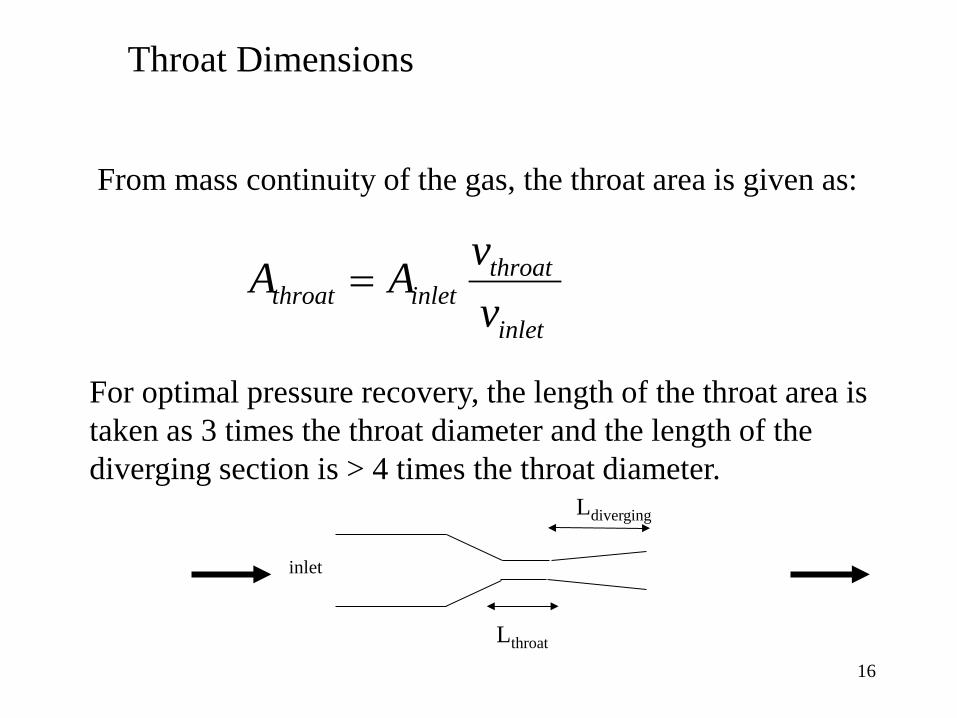
throatthroat inlet
inlet
vA Av
=
From mass continuity of the gas, the throat area is given as:
For optimal pressure recovery, the length of the throat area is taken as 3 times the throat diameter and the length of the diverging section is > 4 times the throat diameter.
Lthroat
Ldiverging
inlet
Throat Dimensions
17
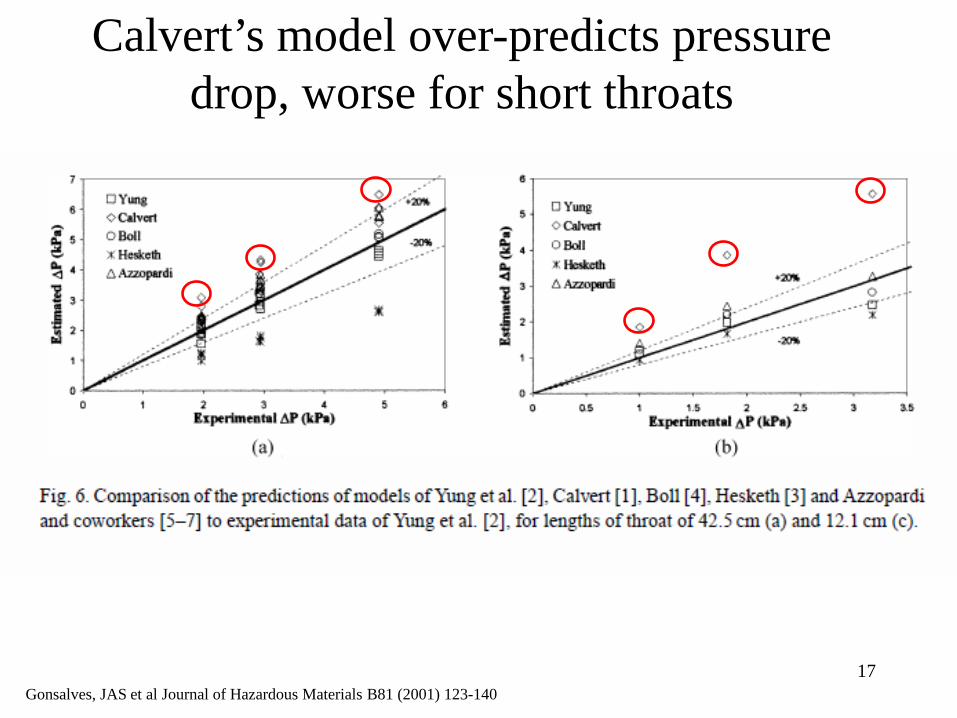
Calvert’s model over-predicts pressure drop, worse for short throats
Gonsalves, JAS et al Journal of Hazardous Materials B81 (2001) 123-140
18
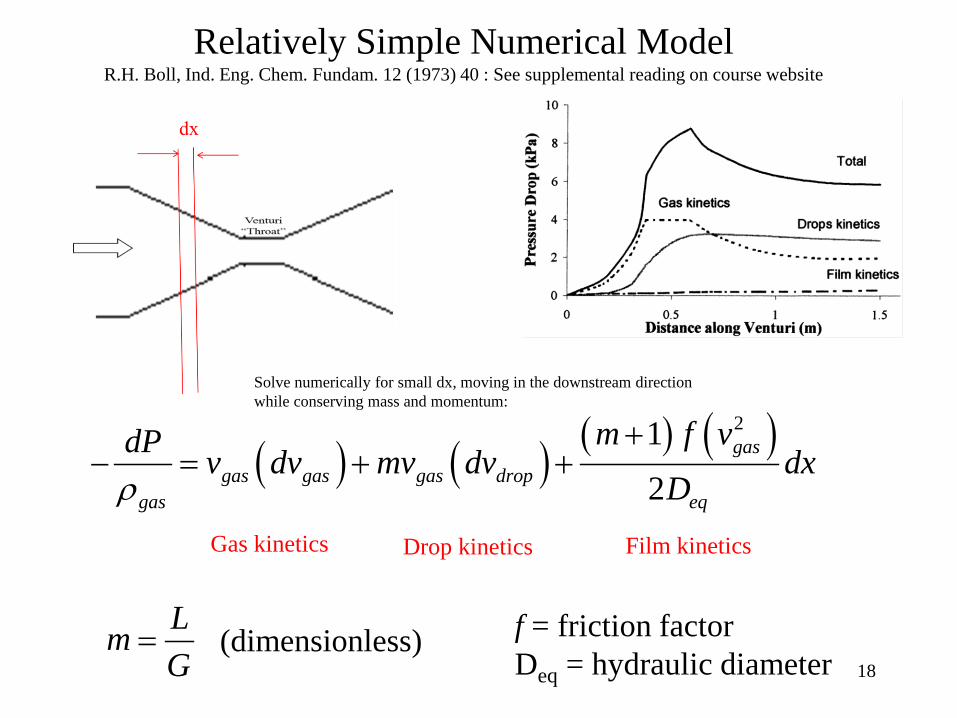
( ) ( ) ( ) ( )21
2gas
gas gas gas dropgas eq
m f vdP v dv mv dv dxDρ
+− = + +
Gas kinetics Drop kinetics Film kinetics
LmG
= (dimensionless)
Relatively Simple Numerical Model R.H. Boll, Ind. Eng. Chem. Fundam. 12 (1973) 40 : See supplemental reading on course website
f = friction factor Deq = hydraulic diameter
Solve numerically for small dx, moving in the downstream direction while conserving mass and momentum:
19
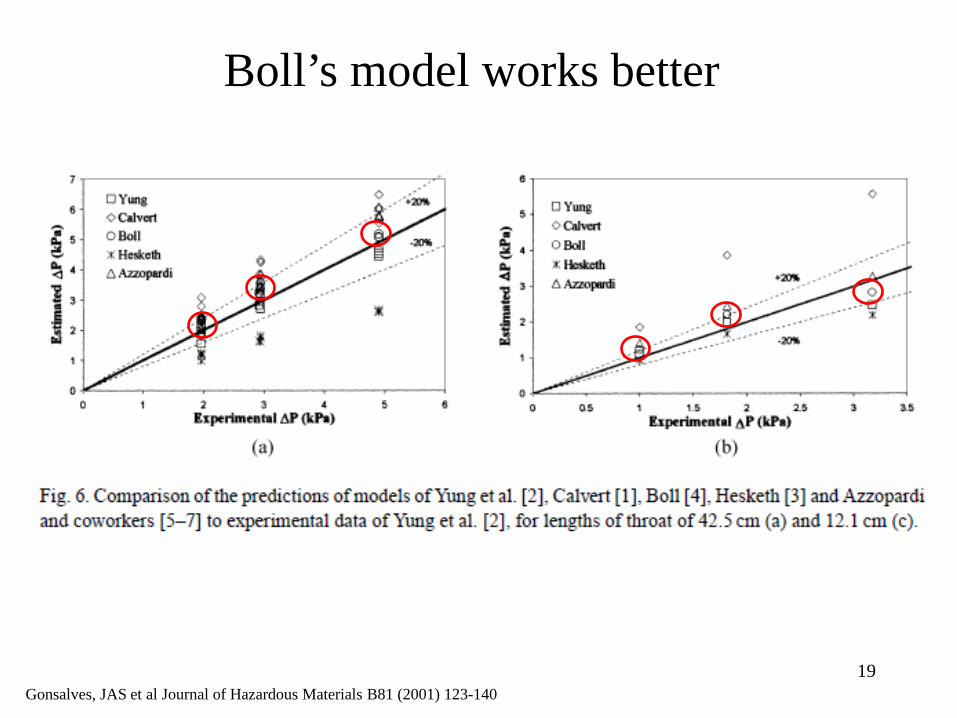
Boll’s model works better
Gonsalves, JAS et al Journal of Hazardous Materials B81 (2001) 123-140
20 EPA Handbook Control Technologies for Hazardous Air Pollutants EPA625/6-91/014 June 1991
Collection Efficiency • Main removal mechanism is impaction • Particles < 0.1 µm mainly diffusion • Efficiency decreases exponentially with
decreasing particle size
21
Predicting Collection Efficiency • Manufacturer Performance Curves • Contact Power Theory • Calvert Cut Diameter Method
22
23
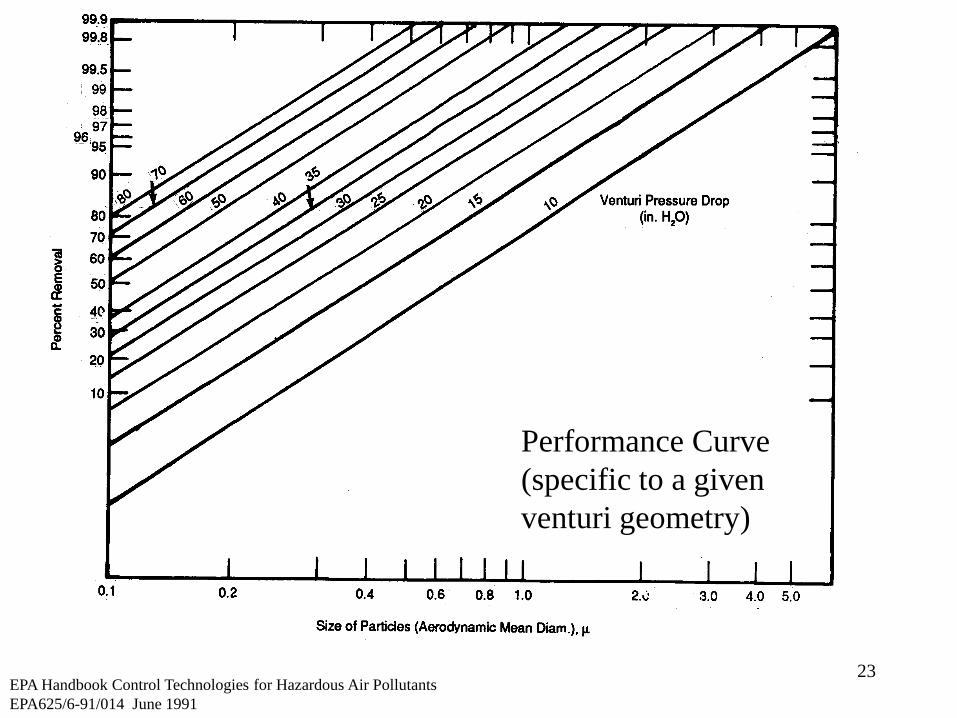
Performance Curve (specific to a given venturi geometry)
EPA Handbook Control Technologies for Hazardous Air Pollutants EPA625/6-91/014 June 1991
• Reported pressure drop across venturi • Performance curve applicable to venturi • Reported collection efficiency
24
Permit Application Information
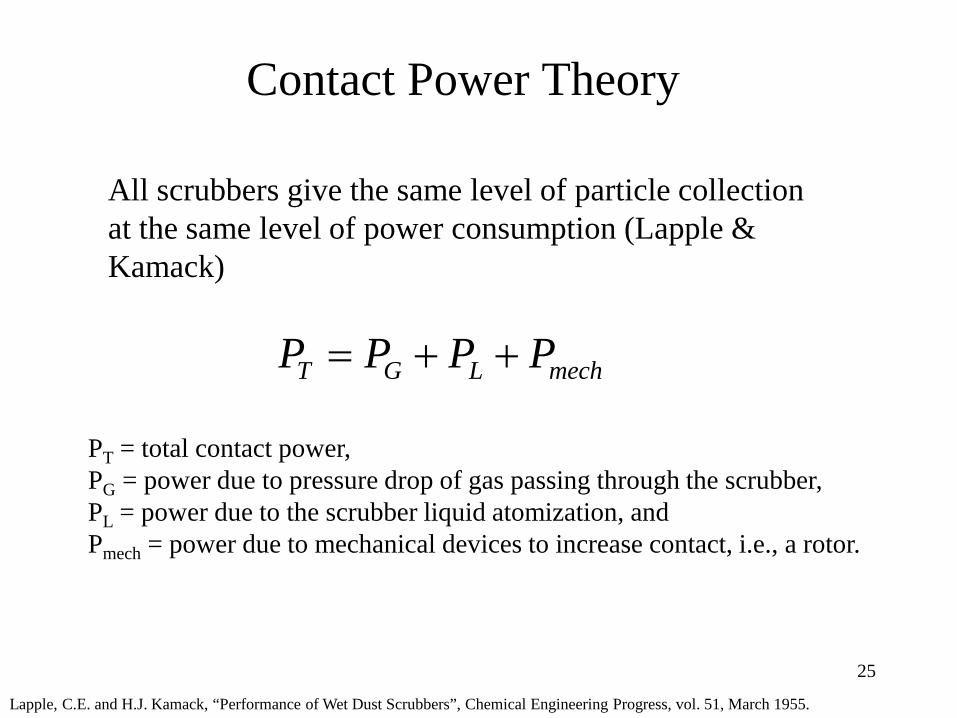
Contact Power Theory
All scrubbers give the same level of particle collection at the same level of power consumption (Lapple & Kamack)
25
T G L mechP P P P= + +
PT = total contact power, PG = power due to pressure drop of gas passing through the scrubber, PL = power due to the scrubber liquid atomization, and Pmech = power due to mechanical devices to increase contact, i.e., a rotor.
Lapple, C.E. and H.J. Kamack, “Performance of Wet Dust Scrubbers”, Chemical Engineering Progress, vol. 51, March 1955.
26
Contact Power Theory
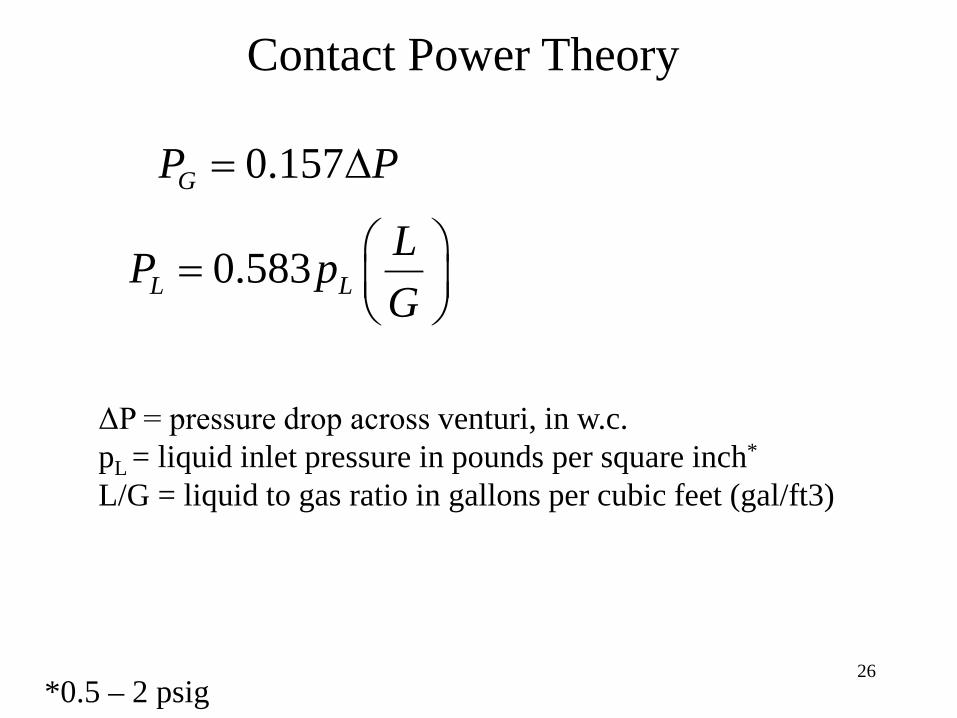
0.157GP P= ∆
0.583L LLP pG
=
ΔP = pressure drop across venturi, in w.c. pL = liquid inlet pressure in pounds per square inch*
L/G = liquid to gas ratio in gallons per cubic feet (gal/ft3)
*0.5 – 2 psig
27
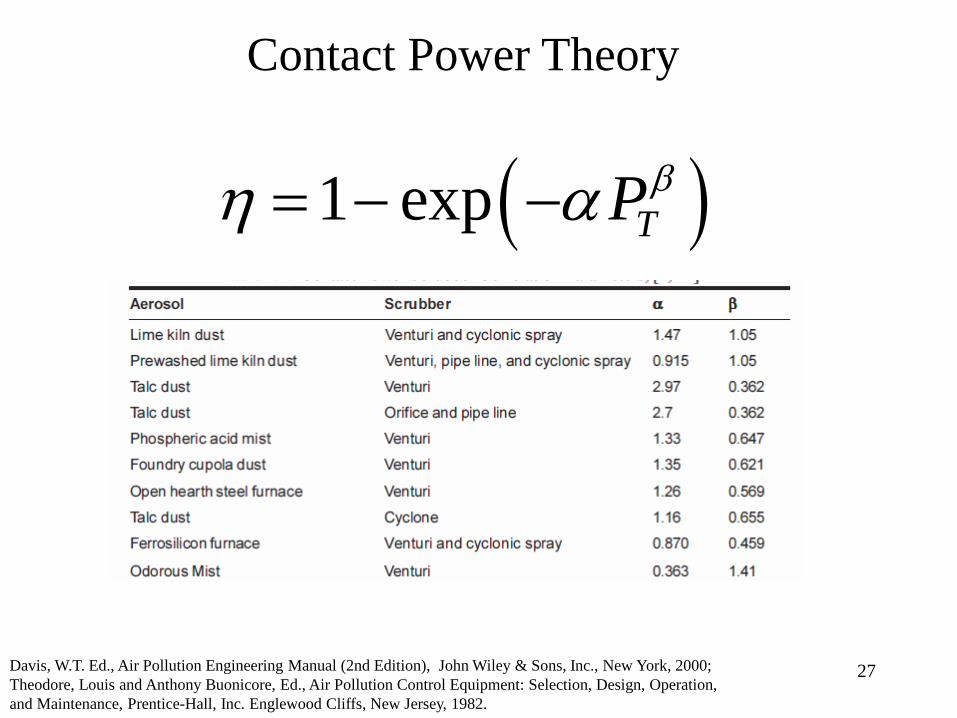
Contact Power Theory
( )1 exp TPβη α= − −
Davis, W.T. Ed., Air Pollution Engineering Manual (2nd Edition), John Wiley & Sons, Inc., New York, 2000; Theodore, Louis and Anthony Buonicore, Ed., Air Pollution Control Equipment: Selection, Design, Operation, and Maintenance, Prentice-Hall, Inc. Englewood Cliffs, New Jersey, 1982.
28
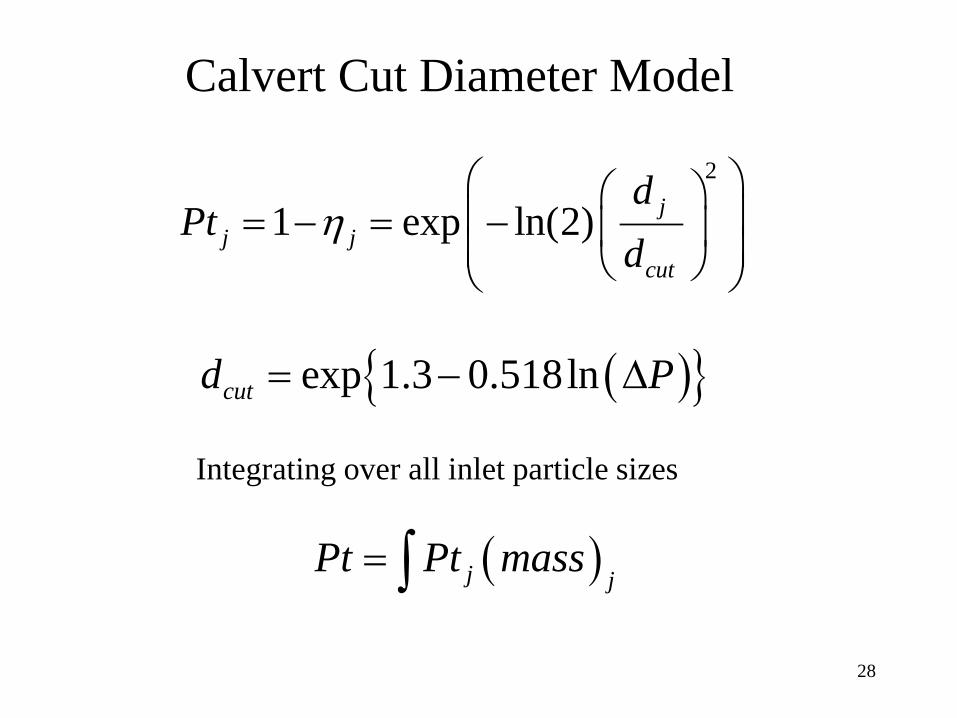
Calvert Cut Diameter Model
( ){ }exp 1.3 0.518lncutd P= − ∆
2
1 exp ln(2) jj j
cut
dPt
dη
= − = −
( )j jPt Pt mass= ∫
Integrating over all inlet particle sizes
29
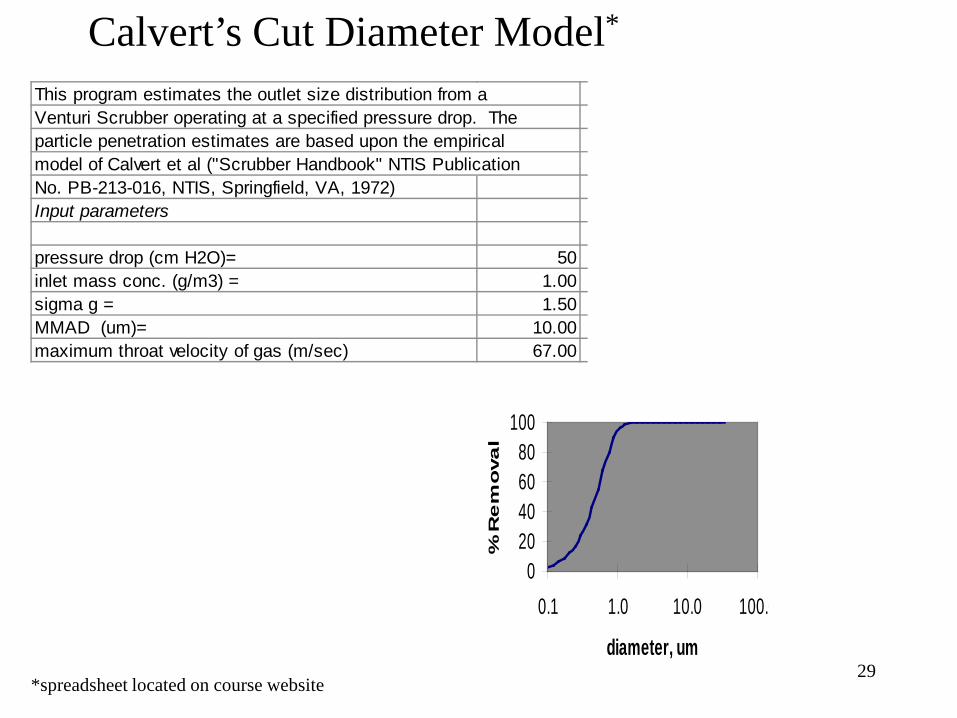
This program estimates the outlet size distribution from a Venturi Scrubber operating at a specified pressure drop. Theparticle penetration estimates are based upon the empiricalmodel of Calvert et al ("Scrubber Handbook" NTIS PublicationNo. PB-213-016, NTIS, Springfield, VA, 1972)Input parameters
pressure drop (cm H2O)= 50 inlet mass conc. (g/m3) = 1.00sigma g = 1.50 MMAD (um)= 10.00 maximum throat velocity of gas (m/sec) 67.00
020406080
100
0.1 1.0 10.0 100.0
diameter, um
% R
em
ova
l
Calvert’s Cut Diameter Model*
*spreadsheet located on course website
Example Design Calculations
30 EPA Handbook Control Technologies for Hazardous Air Pollutants EPA625/6-91/014 June 1991
31
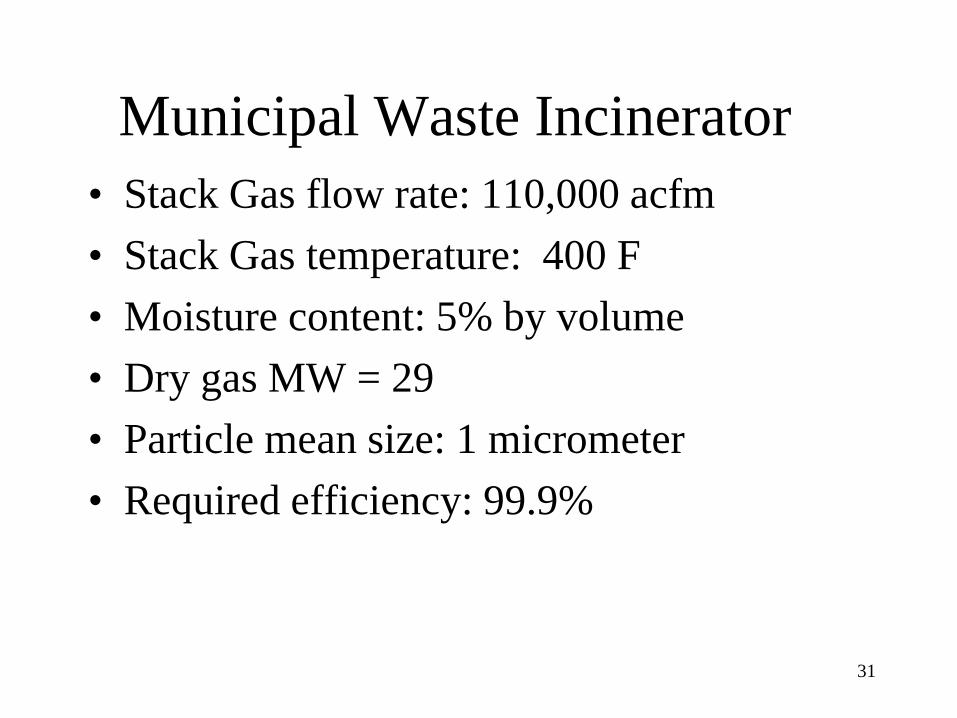
Municipal Waste Incinerator • Stack Gas flow rate: 110,000 acfm • Stack Gas temperature: 400 F • Moisture content: 5% by volume • Dry gas MW = 29 • Particle mean size: 1 micrometer • Required efficiency: 99.9%

32
Line of Maximum Possible
Humidity Value (saturated; both vapor &
liquid present)
Vapor Only Not possible
EPA Handbook Control Technologies for Hazardous Air Pollutants EPA625/6-91/014 June 1991
33
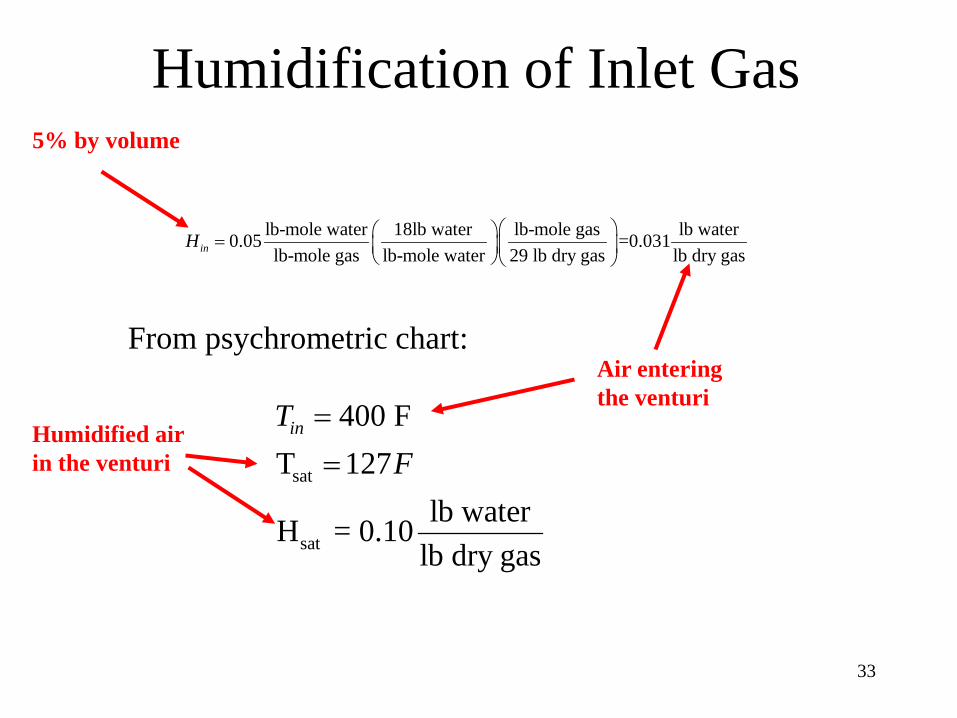
Humidification of Inlet Gas
lb-mole water 18lb water lb-mole gas lb water0.05 =0.031lb-mole gas lb-mole water 29 lb dry gas lb dry gasinH =
sat
sat
400 FT 127
lb waterH = 0.10lb dry gas
inTF
=
=
From psychrometric chart:
Humidified air in the venturi
Air entering the venturi
5% by volume
34
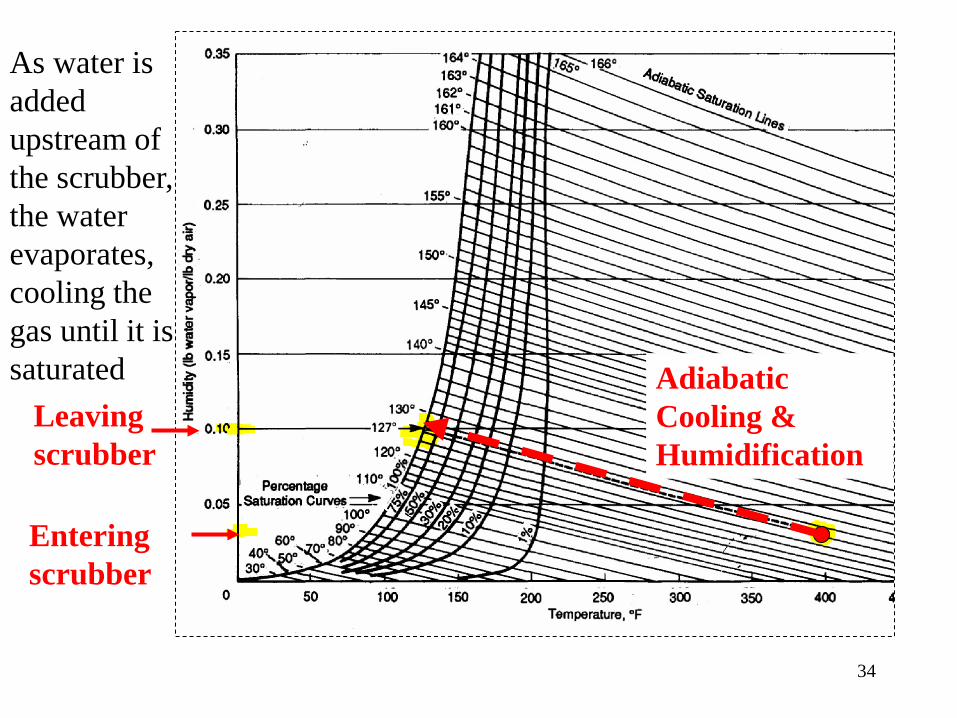
Entering scrubber
Leaving scrubber
Adiabatic Cooling & Humidification
As water is added upstream of the scrubber, the water evaporates, cooling the gas until it is saturated
35
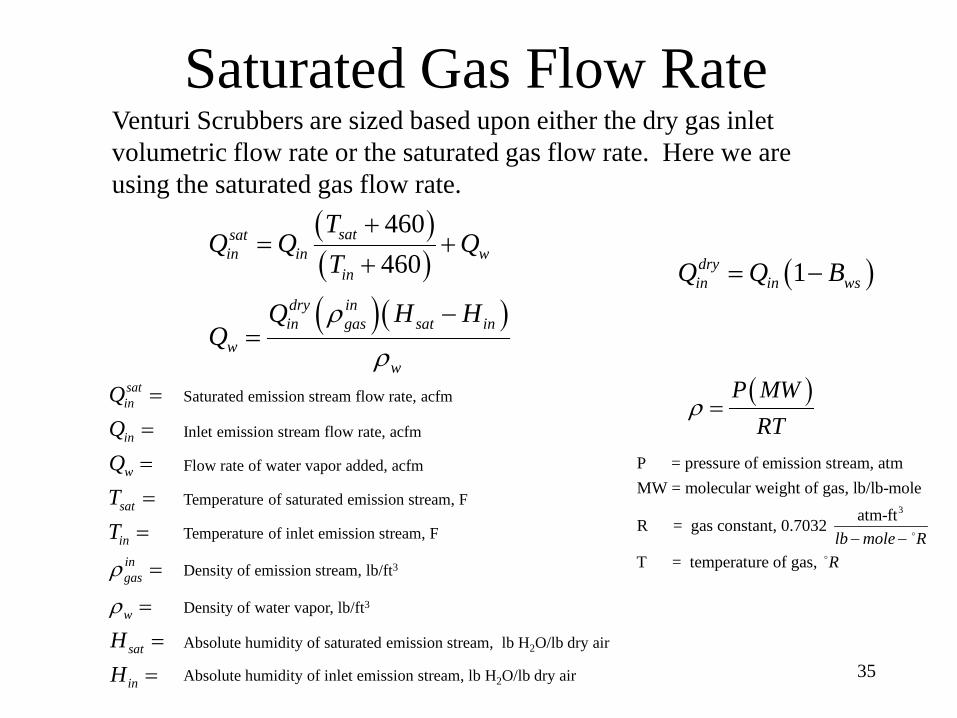
Venturi Scrubbers are sized based upon either the dry gas inlet volumetric flow rate or the saturated gas flow rate. Here we are using the saturated gas flow rate.
Saturated Gas Flow Rate
( )( )( )( )
460460
satsatin in w
in
dry inin gas sat in
ww
TQ Q Q
T
Q H HQ
ρ
ρ
+= +
+
−=
satin
in
w
sat
iningas
w
sat
in
QQQTT
HH
ρ
ρ
====
=
=
==
=
Saturated emission stream flow rate, acfm
Inlet emission stream flow rate, acfm
Flow rate of water vapor added, acfm
Temperature of saturated emission stream, F
Temperature of inlet emission stream, F
Density of emission stream, lb/ft3
Density of water vapor, lb/ft3
Absolute humidity of saturated emission stream, lb H2O/lb dry air
Absolute humidity of inlet emission stream, lb H2O/lb dry air
( )P MWRT
ρ =
3
P = pressure of emission stream, atmMW = molecular weight of gas, lb/lb-mole
atm-ftR = gas constant, 0.7032
T = temperature of gas, lb mole R
R− −
( )1dryin in wsQ Q B= −
36
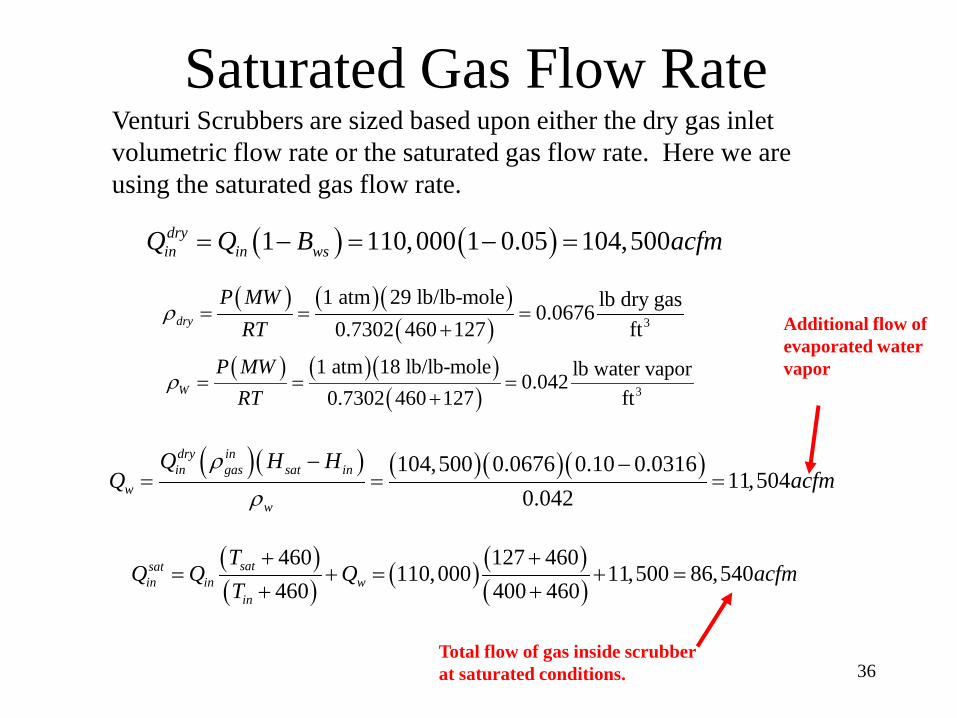
Venturi Scrubbers are sized based upon either the dry gas inlet volumetric flow rate or the saturated gas flow rate. Here we are using the saturated gas flow rate.
Saturated Gas Flow Rate
( )( ) ( ) ( )
( )460 127 460
110,000 11,500 86,540460 400 460
satsatin in w
in
TQ Q Q acfm
T+ +
= + = + =+ +
( ) ( )( )( ) 3
1 atm 29 lb/lb-mole lb dry gas0.06760.7302 460 127 ftdry
P MWRT
ρ = = =+
( ) ( )1 110,000 1 0.05 104,500dryin in wsQ Q B acfm= − = − =
( )( ) ( )( )( )104,500 0.0676 0.10 0.031611,504
0.042
dry inin gas sat in
ww
Q H HQ acfm
ρ
ρ
− −= = =
( ) ( )( )( ) 3
1 atm 18 lb/lb-mole lb water vapor0.0420.7302 460 127 ftW
P MWRT
ρ = = =+
Additional flow of evaporated water vapor
Total flow of gas inside scrubber at saturated conditions.
37
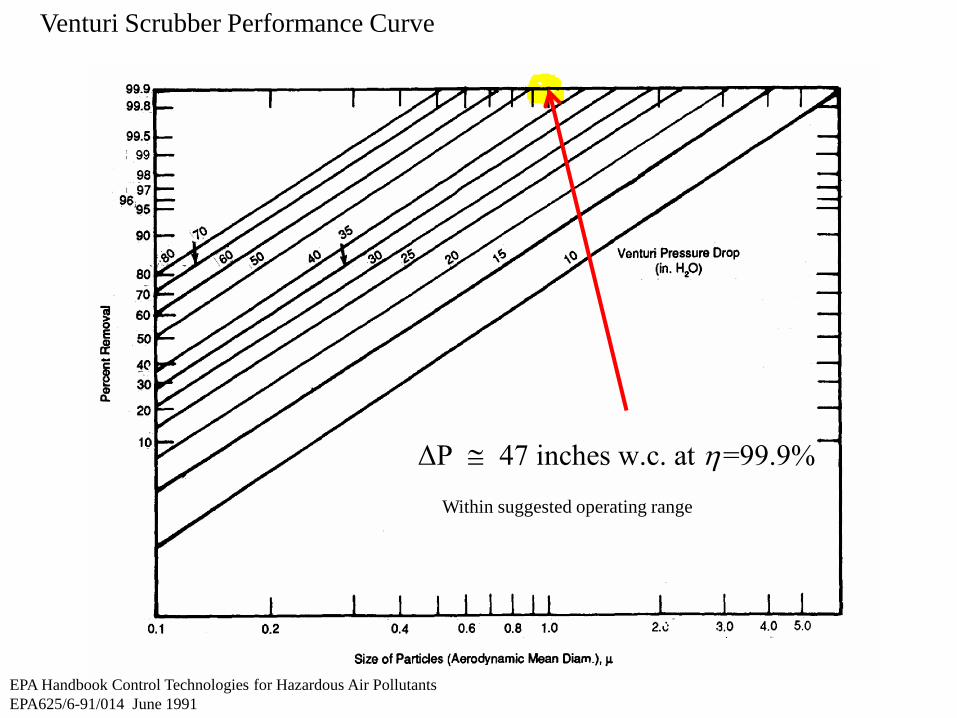
Venturi Scrubber Performance Curve
ΔP 47 inches w.c. at =99.9%η≅
Within suggested operating range
EPA Handbook Control Technologies for Hazardous Air Pollutants EPA625/6-91/014 June 1991

38 EPA Handbook Control Technologies for Hazardous Air Pollutants EPA625/6-91/014 June 1991
Although a ∆P of 47” w.c. is not typical for municipal incinerators, it is still < 80” w.c. and should work.
39
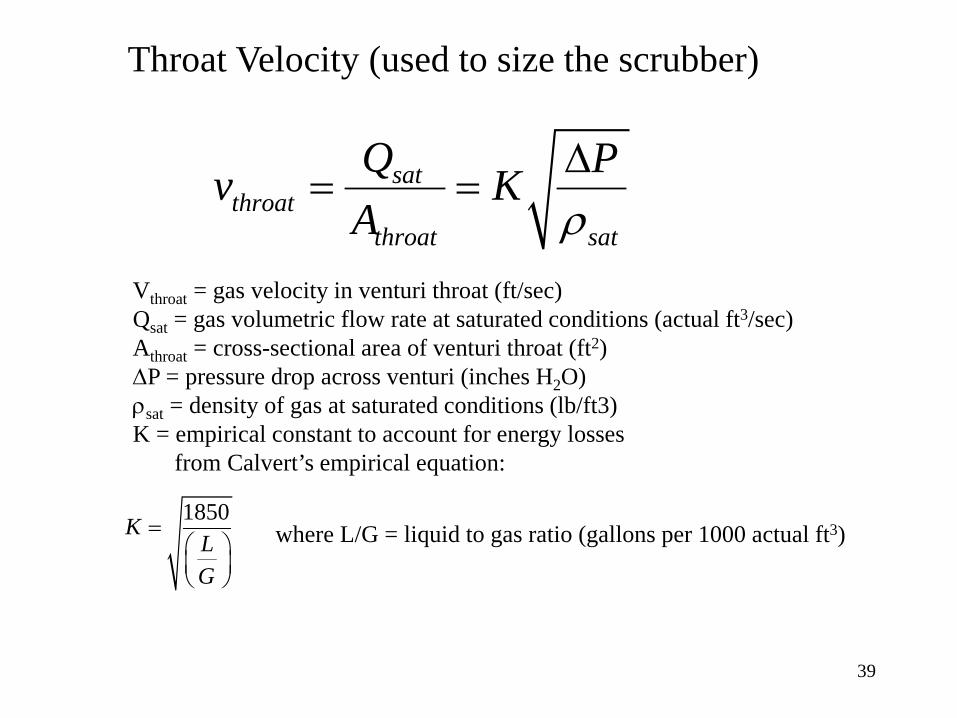
satthroat
throat sat
Q Pv KA ρ
∆= =
Vthroat = gas velocity in venturi throat (ft/sec) Qsat = gas volumetric flow rate at saturated conditions (actual ft3/sec) Athroat = cross-sectional area of venturi throat (ft2) ∆P = pressure drop across venturi (inches H2O) ρsat = density of gas at saturated conditions (lb/ft3) K = empirical constant to account for energy losses from Calvert’s empirical equation:
1850KLG
=
where L/G = liquid to gas ratio (gallons per 1000 actual ft3)
Throat Velocity (used to size the scrubber)
40
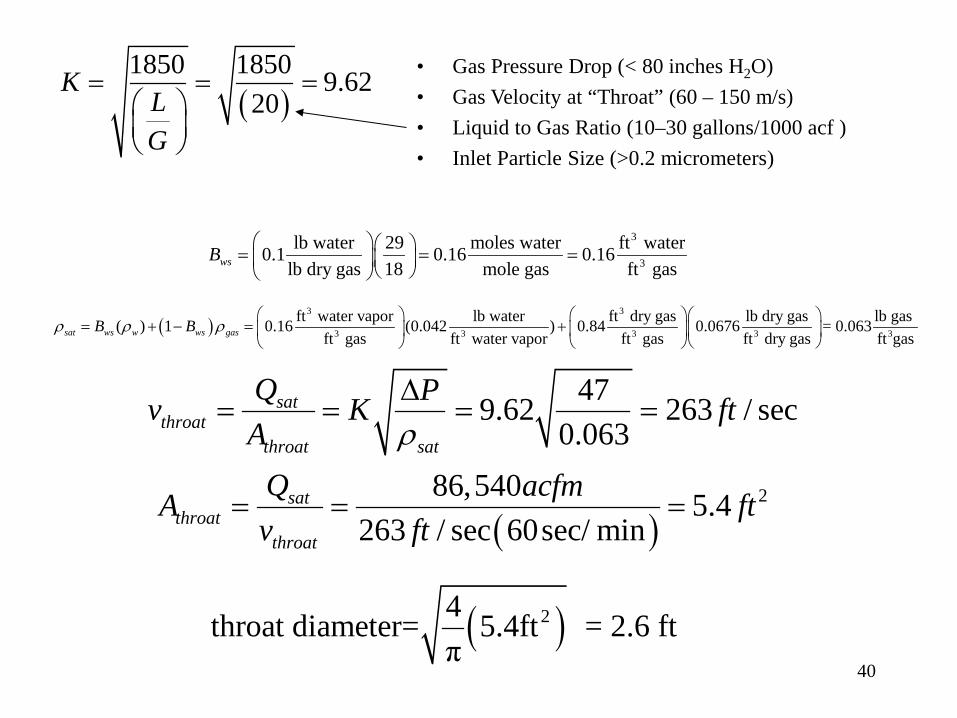
( )1850 1850 9.62
20K
LG
= = =
• Gas Pressure Drop (< 80 inches H2O) • Gas Velocity at “Throat” (60 – 150 m/s) • Liquid to Gas Ratio (10–30 gallons/1000 acf ) • Inlet Particle Size (>0.2 micrometers)
479.62 263 / sec0.063
satthroat
throat sat
Q Pv K ftA ρ
∆= = = =
( )286,540 5.4
263 / sec 60sec/ minsat
throatthroat
Q acfmA ftv ft
= = =
( )24throat diameter= 5.4ft = 2.6 ftπ
3
3
lb water 29 moles water ft water0.1 0.16 0.16lb dry gas 18 mole gas ft gaswsB = = =
( )3 3
3 3 3 3 3
ft water vapor lb water ft dry gas lb dry gas lb gas ( ) 1 0.16 (0.042 ) 0.84 0.0676 = 0.063ft gas ft water vapor ft gas ft dry gas ft gassat ws w ws gasB Bρ ρ ρ
= + − = +
41
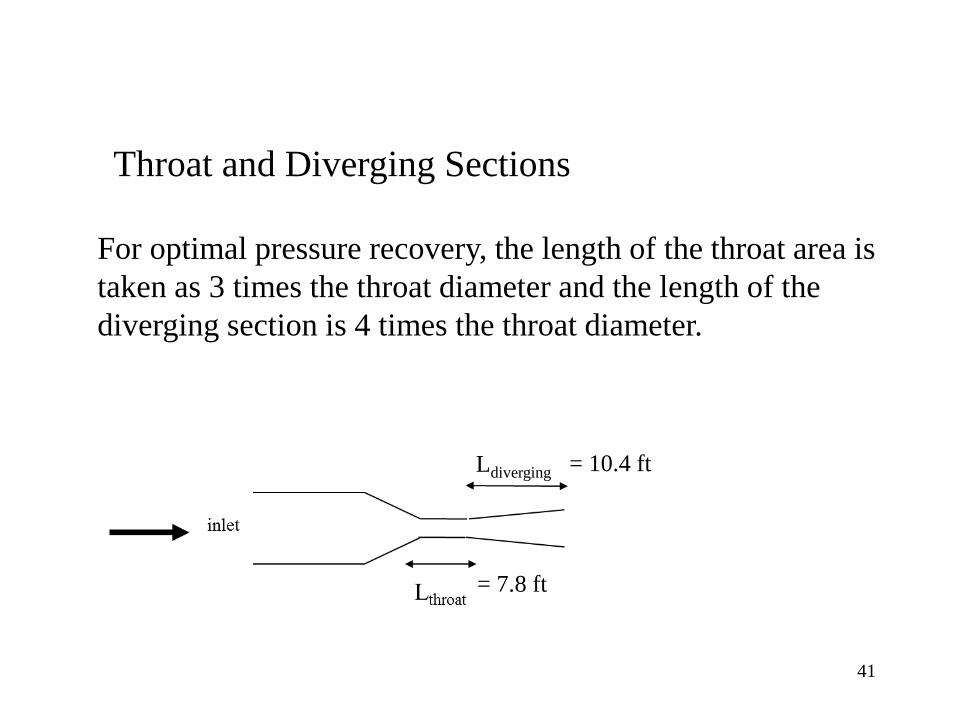
For optimal pressure recovery, the length of the throat area is taken as 3 times the throat diameter and the length of the diverging section is 4 times the throat diameter.
Throat and Diverging Sections
= 7.8 ft
= 10.4 ft Ldiverging
Condensation/Venturi Scrubber
42