Aerodynamic Optimization of Horizontal Axis Wind Turbines ...
EasyChair Preprint№ 6675
Optimization of the Guiding Stability of aHorizontal Axis HTS ZFC Radial LevitationBearing
António José Arsénio, Francisco Ferreira Silva,João Filipe Pereira Fernandes and Paulo José da Costa Branco
EasyChair preprints are intended for rapiddissemination of research results and areintegrated with the rest of EasyChair.
September 23, 2021
1
Optimization of the Guiding Stability of a
Horizontal Axis HTS ZFC Radial Levitation
Bearing
António J. Arsénio, F. Ferreira da Silva, João F. P. Fernandes, and P. J.
Costa Branco 1 Instituto de Engenharia Mecânica (IDMEC), Instituto Superior Técnico (IST), Universidade de
Lisboa, Portugal [email protected], [email protected]
Abstract
This document presents a study on the optimization of the 3D geometry of a horizontal
axis radial levitation superconducting magnetic bearing with zero-field cooled (ZFC)
high-temperature superconductor (HTS) bulks in the stator and radially magnetized
permanent magnet (PM) rings in the rotor. A previous study on optimizing the 3D
geometry for minimization of volume or cost considering variable dimensions of
components and variable spacing was done. This initial optimization concerned only the
maximization of the levitation force with a given restriction for the minimum levitation
force.
Although the used geometry promotes the creation of guidance with ZFC, guiding
forces depend on the spacings between PM rings in the rotor and between the rings of
HTS bulks in the stator. This new optimization study aims to find the optimum spacings
that maximize the guiding force for specific HTS bulk and PM ring dimensions while
maintaining the minimum required levitation force. All the optimizations are based on
using the non-dominated sorting genetic algorithm (NSGA-II) over 3D finite element
analysis (FEA). A simplified electromagnetic model of equivalent relative permeability,
calibrated with experimental measurement of magnetic levitation forces, is used on 3D
FEA to reduce significantly numerical processing and optimization time.
Specifically optimized geometries for the experimental prototype were tested to
validate optimization results. The experimental prototype is made of a stator of high-
density polyurethane walls containing chambers where yttrium boron copper oxide
(YBCO) bulks are immersed in liquid nitrogen (LN2). To hold the neodymium iron boron
(NdFeB) PM rings, the rotor structure is made of polylactic acid plastic printed by a 3D
computer numeric control (CNC) printer. An analysis of stable and unstable geometries
domains depending on the spacings between HTS rings and PM rings is also done for
two HTS bulk sizes.

2
1 Introduction
The studied horizontal axis radial levitation high-temperature superconductor (HTS) magnetic
bearing comprises a stator with two cryostat chambers housing two discontinuous rings of zero-field
cooled HTS bulks and a permanent magnet (PM) rotor with three radially magnetized PM rings with
alternating polarization. Each HTS ring is positioned in the zone between adjacent PM rings.
With a uniform distribution of HTS bulks around the stator chambers, the obtained levitation force
is zero with no vertical deviation of the rotor. Due to its weight, it is not possible to keep the rotor
levitating at the center position. To maximize the available net force (difference between levitation
force and the rotor weight), making possible the experimental measurement of levitation forces to
validate electromagnetic model parameters, a topology with only 6 HTSs on the bottom of the stator
was considered in experimental measurements. Figure 1(a) shows a geometry of the studied bearing,
Figure 1(b) an exploded 3D view of the experimental prototype design, and Figure 1(c) a 3D perspective
of its assembly.
(a) (b) (c)
Figure 1: (a) Geometry of the studied bearing, (b) 3D exploded view design, and (c) assembly design of the
experimental prototype.
In the experimental prototypes built and tested, the stator has two chambers of rigid high-density
polyurethane walls, each one housing one discontinuous ring of HTS bulks. The stator walls were built
by a computer numeric control (CNC) milling machine. The rotor structure in polylactic acid plastic
(PLA) was printed by a 3D computer-aided design (CAD) printer (Arsénio, A.J., 2016).
Initially, a first stator named Stator I, for housing 33 × 33 × 14 mm3 size bulks was built. This
stator and two rotors with 5 mm and 20mm spacings between PM rings, named respectively as rotors
D5 and D20, were used to measure magnetic levitation and guidance forces and validate
electromagnetic model parameters (Arsénio, A.J., 2018). Studies on the LN2 consumption and YBCO
bulk temperature evolution for different thermal processes in the initial ZFC and operation of the
experimental bearing prototype were presented in (Arsénio, A.J., 2018) and (Arsénio, A.J., 2021). Work
on optimizing the superconducting linear magnetic bearing of a maglev vehicle was presented (Quéval,
L., 2016). A study on multi-objective multi-constraint optimization of the 3D geometry to minimize the
bearing cost or volume was also performed (Fernandes, J.F.P, 2020). Optimizations using the non-
dominated sorting genetic decision algorithm NSGA-II over 3D finite element analysis (FEA) were
applied to obtain the optimized levitation forces. An equivalent relative permeability model was adopted
for the 3D FEA to reduce the time consumption on the numerical processing significantly. This initial
optimization study was based on maximizing levitation forces, not looking to guarantee and maximize
the guiding stability. The optimizations are considered a restriction to guarantee a minimum levitation
force equal to the one obtained with the geometry defined by 6 HTS bulks at the bottom of Stator I and
HTSs
PMs
HTSs
PMs
LN2
3
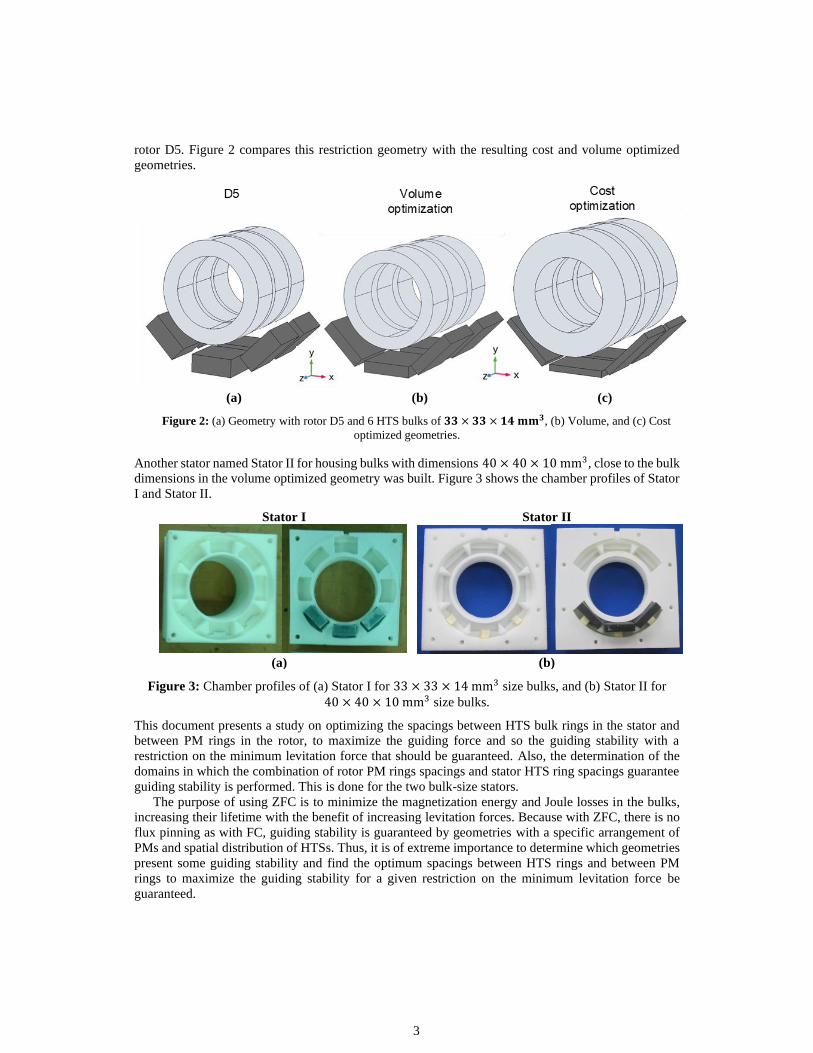
rotor D5. Figure 2 compares this restriction geometry with the resulting cost and volume optimized
geometries.
(a) (b) (c)
Figure 2: (a) Geometry with rotor D5 and 6 HTS bulks of 𝟑𝟑 × 𝟑𝟑 × 𝟏𝟒 𝐦𝐦𝟑, (b) Volume, and (c) Cost
optimized geometries.
Another stator named Stator II for housing bulks with dimensions 40 × 40 × 10 mm3, close to the bulk
dimensions in the volume optimized geometry was built. Figure 3 shows the chamber profiles of Stator
I and Stator II.
Stator I
Stator II
(a) (b)
Figure 3: Chamber profiles of (a) Stator I for 33 × 33 × 14 mm3 size bulks, and (b) Stator II for
40 × 40 × 10 mm3 size bulks.
This document presents a study on optimizing the spacings between HTS bulk rings in the stator and
between PM rings in the rotor, to maximize the guiding force and so the guiding stability with a
restriction on the minimum levitation force that should be guaranteed. Also, the determination of the
domains in which the combination of rotor PM rings spacings and stator HTS ring spacings guarantee
guiding stability is performed. This is done for the two bulk-size stators.
The purpose of using ZFC is to minimize the magnetization energy and Joule losses in the bulks,
increasing their lifetime with the benefit of increasing levitation forces. Because with ZFC, there is no
flux pinning as with FC, guiding stability is guaranteed by geometries with a specific arrangement of
PMs and spatial distribution of HTSs. Thus, it is of extreme importance to determine which geometries
present some guiding stability and find the optimum spacings between HTS rings and between PM
rings to maximize the guiding stability for a given restriction on the minimum levitation force be
guaranteed.

4
2 Electromagnetic models and parameters
The E-J model described below should be used for a detailed prediction and characterization of the
induced current distribution in HTS bulks. This model implies the resolution of non-linear and partial
differential equations in the superconductor domain, requiring a lot of numerical processing in the FEA.
A simplified model with a calibrated value of equivalent relative permeability was used to significantly
reduce the FEA processing time, especially during the optimization of the bearing 3D geometry.
2.1 E-J model
When after ZFC, a magnetic field 𝐇𝒂 is applied to a superconductor bulk, an electric field 𝐄 is
induced from the variation of the penetrating magnetic field 𝐇, according to Faraday’s law.
𝛁 × 𝐄 = −𝜇0
d𝐇
dt (1)
According to the model in (Hong. Z., 2007), type II superconductors present a non-linear electric
conductivity characteristic given by the power-law (2),
𝐸 = 𝐸0 (𝐽
𝐽𝑐
)𝑛
(2)
where 𝐸 and 𝐽 are the magnitudes respectively of induced electric field and current density, 𝐽𝑐 the
critical current density and 𝐸0 is the electrical field at which the current density reaches 𝐽𝑐. Exponent 𝑛
is a positive integer higher than 1 . The induced current density 𝐉 creates, by Ampere’s law, a
magnetization field 𝐌.
𝐉 = ∇ × 𝐌 (3)
The penetrating magnetic field is given by the sum of the applied magnetic field and the magnetization
field.
𝐇 = 𝐇𝒂 + 𝐌 (4)
According to the Kim-Anderson model in (Yamamoto, K., 1993) and (Fujishiro, H., 2010), the
critical-current density 𝐽𝑐 depends on the absolute value of the penetrating magnetic-flux density |𝐵|,
𝐽𝑐(𝐵) = 𝐽𝑐0 𝐵0
𝐵0 + |𝐵| (5)
where 𝐽𝑐0 is the zero-field critical current density that depends on the temperature 𝑇 (Koo, J., 2004),
and 𝐵0 the magnitude of the penetrating magnetic flux density for which the critical current density is
half the zero-field critical current density. For the case of yttrium barium copper oxide (YBCO), 𝐸0 =1 × 10⁻⁴ Vm−1, 𝐵0 = 0.1 T and 𝑛 = 21 (Zhang, M, 2012). Appropriate values of the parameter 𝐽𝑐0
can be validated by comparing the magnetic forces predicted by FEA using the E-J model with the ones
obtained by experimental measurement.
2.2 Equivalent relative permeability model
The relative permeability 𝜇𝑟 is defined by the relation between the magnitude of the penetrating
field 𝐻 and the magnitude of the applied magnetic field 𝐻𝑎, being calculated by (6).
5
𝜇𝑟 =𝐻
𝐻𝑎
= 1 +𝑀
𝐻𝑎
= 1 + 𝜒 (6)
where 𝜒 is the magnetic susceptibility. Perfect diamagnetism is traduced by 𝜒 equal to −1 and 𝜇𝑟
equal to 0.
In this model, an average value of relative permeability 𝜇𝑟̅̅ ̅ designated by the equivalent relative
permeability is considered. A methodology to compute the value of 𝜇𝑟̅̅ ̅ for the total bulk volume was
initially proposed in (Arsénio, A. J., 2018) and (Fernandes, J.F.P, 2020). Based on the first
methodology, a more generic methodology to compute values of 𝜇𝑟̅̅ ̅ in several partitions of the bulk was
then proposed in (Inês, P., 2021).
Appropriate values of 𝜇𝑟̅̅ ̅ can be validated by comparing the magnetic forces predicted by FEA with
the ones obtained by experimental measurement. The use of this model significantly reduces the FEA
numerical processing.
3 Validation of electromagnetic model parameters
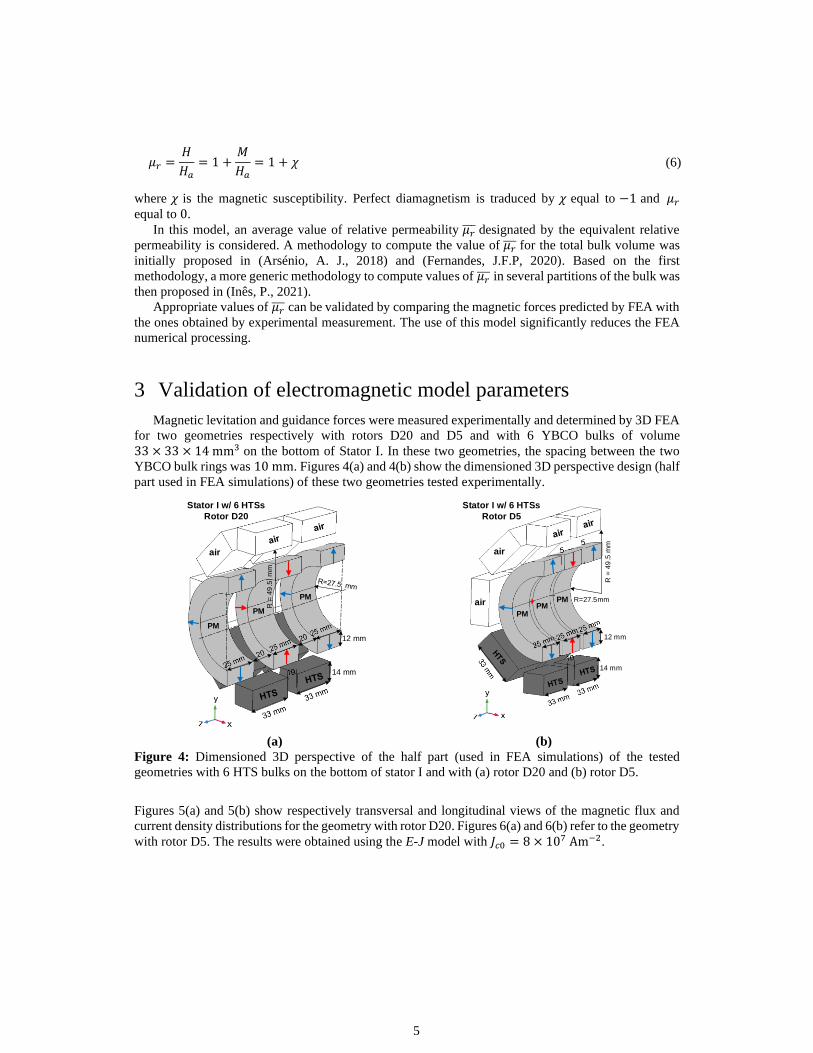
Magnetic levitation and guidance forces were measured experimentally and determined by 3D FEA
for two geometries respectively with rotors D20 and D5 and with 6 YBCO bulks of volume
33 × 33 × 14 mm3 on the bottom of Stator I. In these two geometries, the spacing between the two
YBCO bulk rings was 10 mm. Figures 4(a) and 4(b) show the dimensioned 3D perspective design (half
part used in FEA simulations) of these two geometries tested experimentally.
(a) (b)
Figure 4: Dimensioned 3D perspective of the half part (used in FEA simulations) of the tested
geometries with 6 HTS bulks on the bottom of stator I and with (a) rotor D20 and (b) rotor D5.
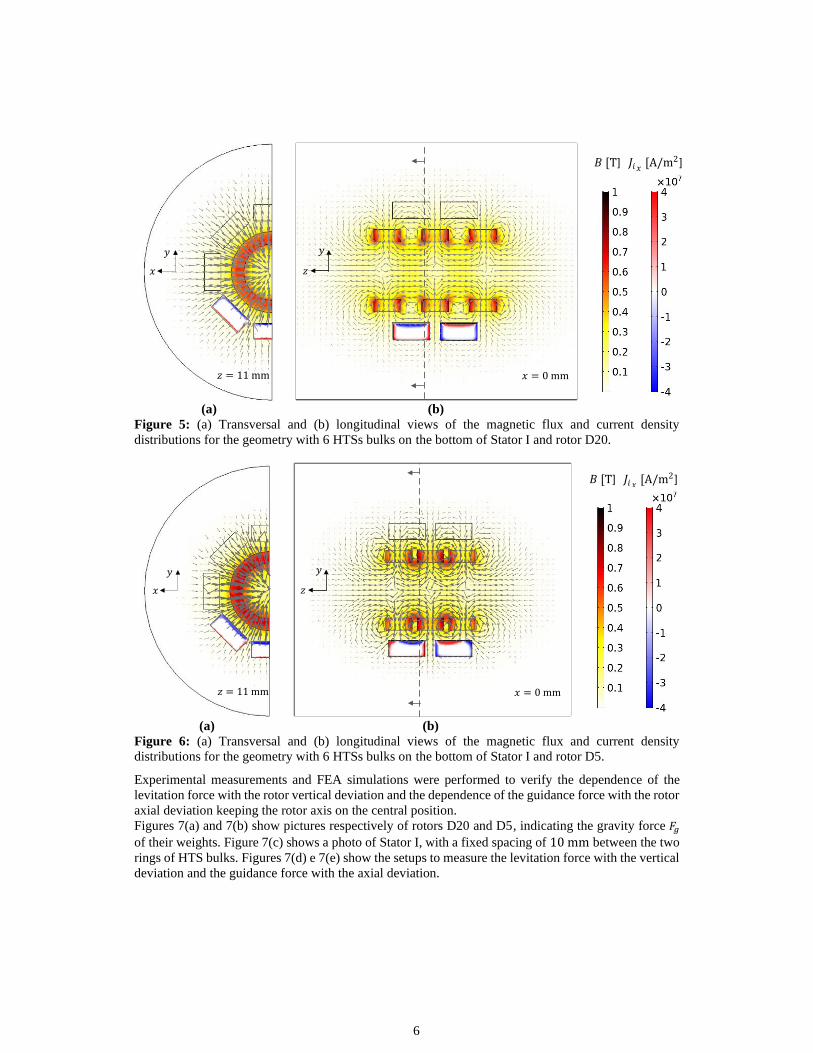
Figures 5(a) and 5(b) show respectively transversal and longitudinal views of the magnetic flux and
current density distributions for the geometry with rotor D20. Figures 6(a) and 6(b) refer to the geometry
with rotor D5. The results were obtained using the E-J model with 𝐽𝑐0 = 8 × 10⁷ Am−2.
12 mm
PM
PM
PM
14 mm
Stator I w/ 6 HTSs
Rotor D20
air
R =
49
.5
mm
PM
12 mm
14 mm
R=27.5mm R
= 4
9.5
mm
Stator I w/ 6 HTSs
Rotor D5
air
air
PM PM
6
(a) (b)
Figure 5: (a) Transversal and (b) longitudinal views of the magnetic flux and current density
distributions for the geometry with 6 HTSs bulks on the bottom of Stator I and rotor D20.
(a) (b)
Figure 6: (a) Transversal and (b) longitudinal views of the magnetic flux and current density
distributions for the geometry with 6 HTSs bulks on the bottom of Stator I and rotor D5.
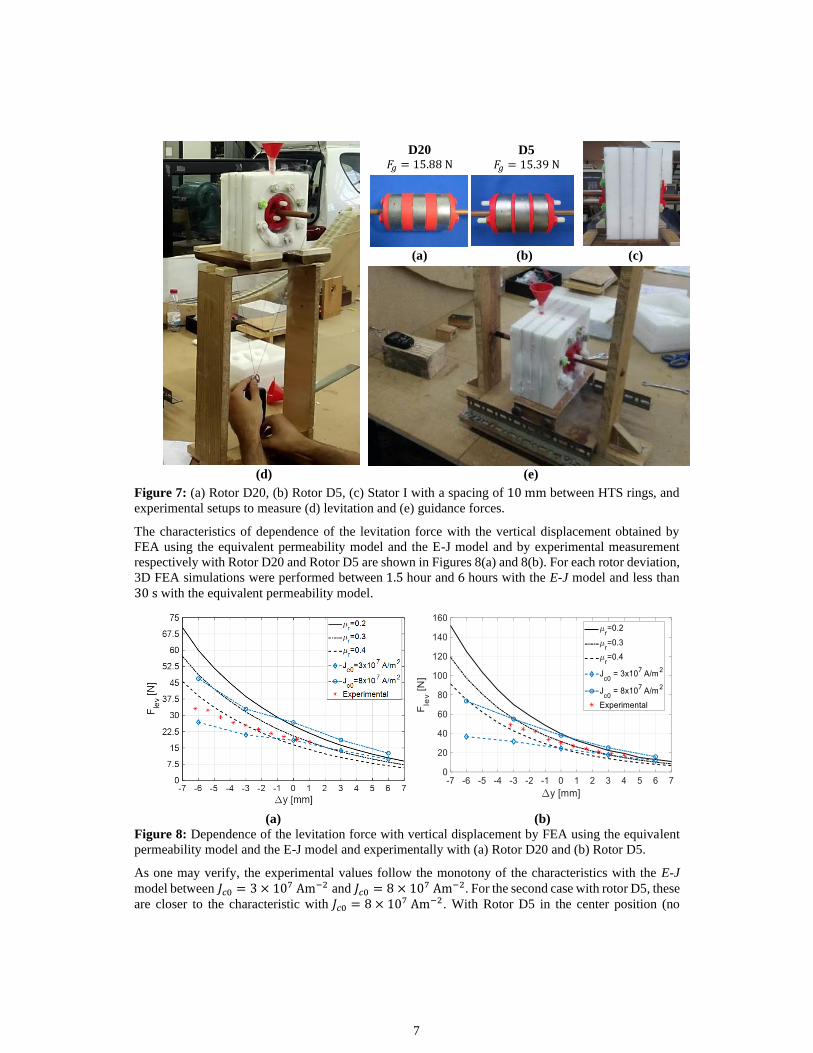
Experimental measurements and FEA simulations were performed to verify the dependence of the
levitation force with the rotor vertical deviation and the dependence of the guidance force with the rotor
axial deviation keeping the rotor axis on the central position.
Figures 7(a) and 7(b) show pictures respectively of rotors D20 and D5, indicating the gravity force 𝐹𝑔
of their weights. Figure 7(c) shows a photo of Stator I, with a fixed spacing of 10 mm between the two
rings of HTS bulks. Figures 7(d) e 7(e) show the setups to measure the levitation force with the vertical
deviation and the guidance force with the axial deviation.
𝑦
𝑥
𝑧 = 11 mm
𝑦
𝑧
𝑥 = 0 mm
𝐽𝑖 𝑥 [A/m2] 𝐵 [T]
𝑧 = 11 mm
𝑦
𝑥
𝑦
𝑧
𝑥 = 0 mm
𝐽𝑖 𝑥 [A/m2] 𝐵 [T]
7
D20 𝐹𝑔 = 15.88 N
D5 𝐹𝑔 = 15.39 N
(a) (b) (c)
(d) (e)
Figure 7: (a) Rotor D20, (b) Rotor D5, (c) Stator I with a spacing of 10 mm between HTS rings, and
experimental setups to measure (d) levitation and (e) guidance forces.
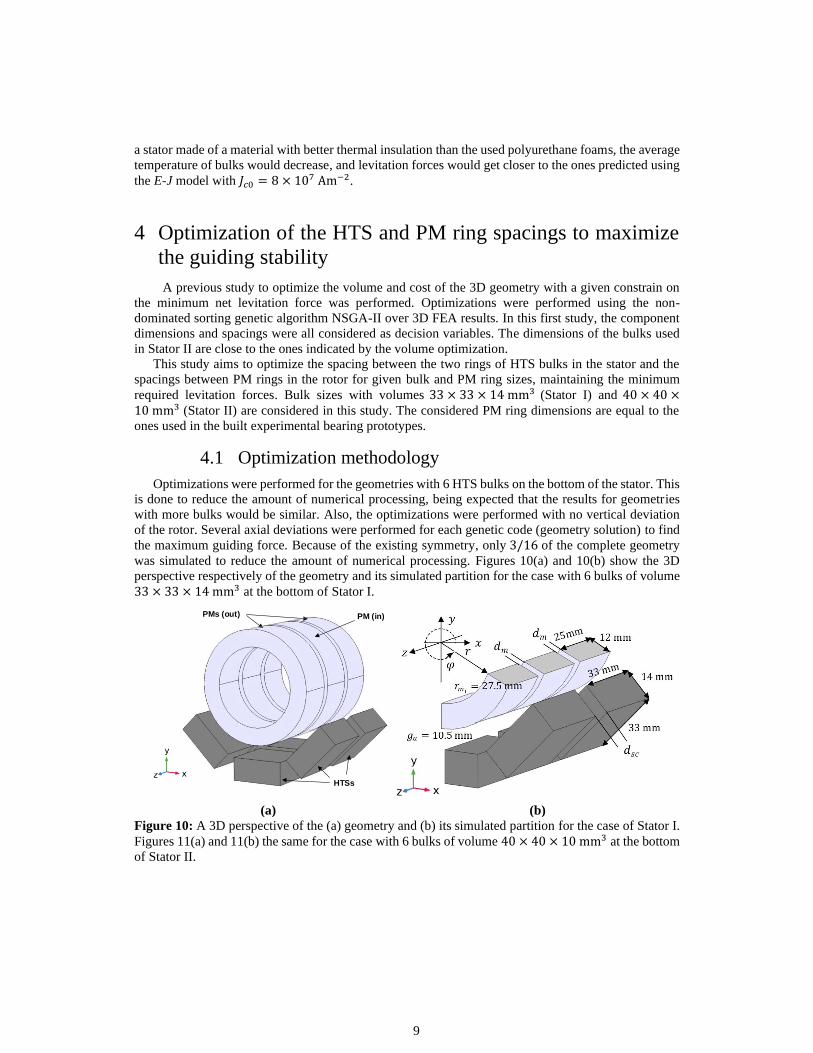
The characteristics of dependence of the levitation force with the vertical displacement obtained by
FEA using the equivalent permeability model and the E-J model and by experimental measurement
respectively with Rotor D20 and Rotor D5 are shown in Figures 8(a) and 8(b). For each rotor deviation,
3D FEA simulations were performed between 1.5 hour and 6 hours with the E-J model and less than
30 s with the equivalent permeability model.
(a) (b)
Figure 8: Dependence of the levitation force with vertical displacement by FEA using the equivalent
permeability model and the E-J model and experimentally with (a) Rotor D20 and (b) Rotor D5.
As one may verify, the experimental values follow the monotony of the characteristics with the E-J
model between 𝐽𝑐0 = 3 × 10⁷ Am−2 and 𝐽𝑐0 = 8 × 10⁷ Am−2. For the second case with rotor D5, these
are closer to the characteristic with 𝐽𝑐0 = 8 × 10⁷ Am−2. With Rotor D5 in the center position (no

8
vertical deviation), the levitation force with 𝐽𝑐0 = 8 × 10⁷ Am−2 is between the ones predicted with
𝜇𝑟̅̅ ̅ = 0.2 and 𝜇𝑟̅̅ ̅ = 0.3, close to the one that would be predicted with 𝜇𝑟̅̅ ̅ = 0.25. For a lower distance
𝑔𝑎 between the HTSs to the PMs, the higher is the value of equivalent relative permeability for which
the predicted levitation forces approximates experimental values. This is because the closer the PMs
are to the HTSs, the higher the penetrating field.
Figures 9(a) and 9(b) show the characteristics of dependence of the levitation force with the vertical
displacement obtained by FEA using the equivalent permeability model and the E-J model and
experimental measurement, respectively with Rotor D20 and Rotor D5.
(a) (b)
Figure 9: Dependence of the guidance force with axial displacement by FEA using the equivalent
permeability model and the E-J model and experimentally with (a) Rotor D20 and (b) Rotor D5.
As one may verify, the sensitivity of the guidance force to the value of 𝜇𝑟̅̅ ̅ is much less than the one
verified for the case of the levitation force. With the rotor at the center position, the applied magnetic
field did not change notably in the range of axial deviations applied.
Table I resumes the values of levitation force 𝐹𝑙𝑒𝑣 with the rotor at the center position, predicted by FEA
and obtained by experimental measurement. The last column presents the net force 𝐹𝑛 (difference
between levitation force 𝐹𝑙𝑒𝑣 and the gravity force 𝐹𝑔 of the rotor weight) relatively to the experimental
measurement.
Table I: Experimental and FEA values of 𝐹𝑙𝑒𝑣 with Rotor D20 and D5 at the center position.
∆𝑥 = ∆𝑦= 0 mm
∆𝑧 = 0 mm
𝐹𝑙𝑒𝑣 [N]
𝐹𝑛 [N] Exp. 𝜇𝑟 =
0.2
𝜇𝑟 =
0.25
𝜇𝑟 =
0.3
𝜇𝑟 =
0.4
𝐽𝑐0 =
3 × 10⁷ Am−2
𝐽𝑐0 =
8 × 10⁷
Am−2
Exp.
Rotor D20
𝐹𝑔 = 15.88 N
𝑔𝑎 = 10.5 mm 25.15 22.72 𝟐𝟎. 𝟒𝟕 16.40 𝟏𝟖. 𝟒𝟕 23.73 𝟏𝟗. 𝟏𝟗 3.31
Rotor D5
𝐹𝑔 = 15.39 N
𝑔𝑎 = 10.5 mm 37.62 𝟑𝟏. 𝟑𝟗 26.17 21.44 22.42 𝟑𝟐. 𝟑𝟏 𝟑𝟎. 𝟐𝟔 14.87
With the rotors at the center position, the levitation force predicted with 𝐽𝑐0 = 8 × 10⁷ Am−2 is close to
the one predicted with 𝜇𝑟̅̅ ̅ = 0.25. The experimental are between the ones with 𝐽𝑐0 = 3 × 10⁷ Am−2 and
𝐽𝑐0 = 8 × 10⁷ Am−2, being closer to the one with 𝐽𝑐0 = 8 × 10⁷ Am−2 on the case of Rotor D5. With
9
a stator made of a material with better thermal insulation than the used polyurethane foams, the average
temperature of bulks would decrease, and levitation forces would get closer to the ones predicted using
the E-J model with 𝐽𝑐0 = 8 × 10⁷ Am−2.
4 Optimization of the HTS and PM ring spacings to maximize
the guiding stability
A previous study to optimize the volume and cost of the 3D geometry with a given constrain on
the minimum net levitation force was performed. Optimizations were performed using the non-
dominated sorting genetic algorithm NSGA-II over 3D FEA results. In this first study, the component
dimensions and spacings were all considered as decision variables. The dimensions of the bulks used
in Stator II are close to the ones indicated by the volume optimization.
This study aims to optimize the spacing between the two rings of HTS bulks in the stator and the
spacings between PM rings in the rotor for given bulk and PM ring sizes, maintaining the minimum
required levitation forces. Bulk sizes with volumes 33 × 33 × 14 mm3 (Stator I) and 40 × 40 ×10 mm3 (Stator II) are considered in this study. The considered PM ring dimensions are equal to the
ones used in the built experimental bearing prototypes.
4.1 Optimization methodology
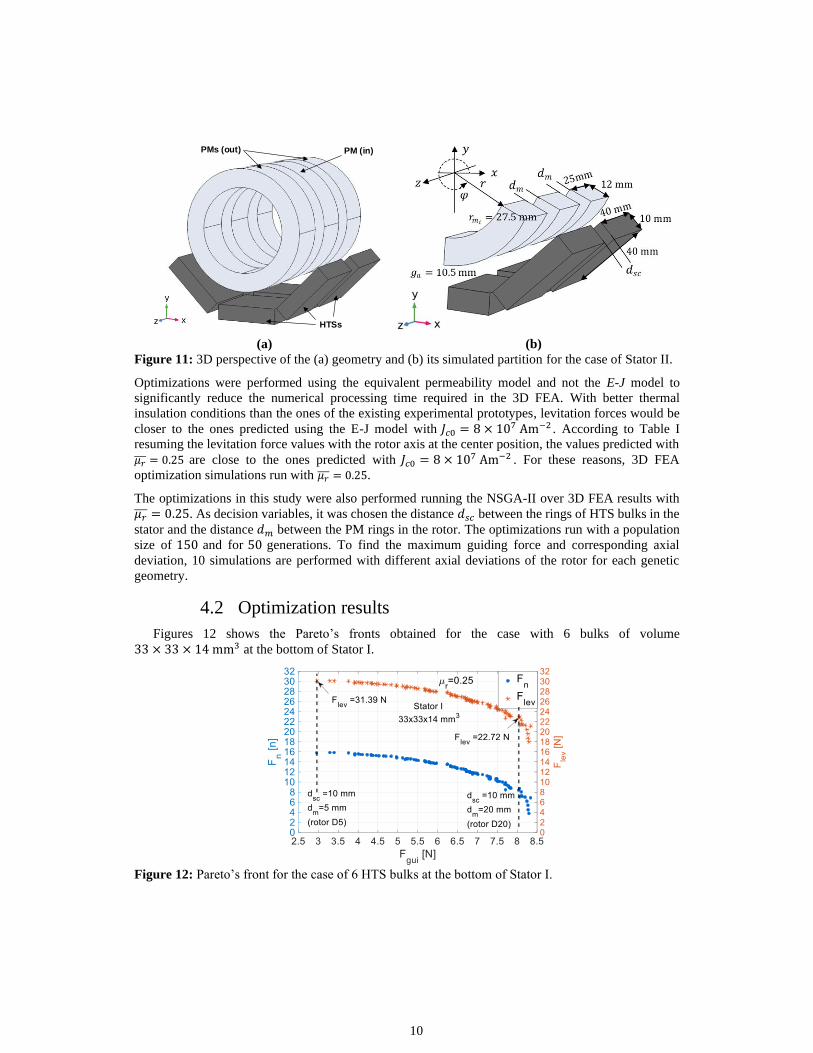
Optimizations were performed for the geometries with 6 HTS bulks on the bottom of the stator. This
is done to reduce the amount of numerical processing, being expected that the results for geometries
with more bulks would be similar. Also, the optimizations were performed with no vertical deviation
of the rotor. Several axial deviations were performed for each genetic code (geometry solution) to find
the maximum guiding force. Because of the existing symmetry, only 3/16 of the complete geometry
was simulated to reduce the amount of numerical processing. Figures 10(a) and 10(b) show the 3D
perspective respectively of the geometry and its simulated partition for the case with 6 bulks of volume
33 × 33 × 14 mm3 at the bottom of Stator I.
(a) (b)
Figure 10: A 3D perspective of the (a) geometry and (b) its simulated partition for the case of Stator I.
Figures 11(a) and 11(b) the same for the case with 6 bulks of volume 40 × 40 × 10 mm3 at the bottom
of Stator II.
PMs (out) PM (in)
HTSs
10
(a) (b)
Figure 11: 3D perspective of the (a) geometry and (b) its simulated partition for the case of Stator II.
Optimizations were performed using the equivalent permeability model and not the E-J model to
significantly reduce the numerical processing time required in the 3D FEA. With better thermal
insulation conditions than the ones of the existing experimental prototypes, levitation forces would be
closer to the ones predicted using the E-J model with 𝐽𝑐0 = 8 × 10⁷ Am−2 . According to Table I
resuming the levitation force values with the rotor axis at the center position, the values predicted with
𝜇𝑟̅̅ ̅ = 0.25 are close to the ones predicted with 𝐽𝑐0 = 8 × 10⁷ Am−2 . For these reasons, 3D FEA
optimization simulations run with 𝜇𝑟̅̅ ̅ = 0.25.
The optimizations in this study were also performed running the NSGA-II over 3D FEA results with
𝜇𝑟̅̅ ̅ = 0.25. As decision variables, it was chosen the distance 𝑑𝑠𝑐 between the rings of HTS bulks in the
stator and the distance 𝑑𝑚 between the PM rings in the rotor. The optimizations run with a population
size of 150 and for 50 generations. To find the maximum guiding force and corresponding axial
deviation, 10 simulations are performed with different axial deviations of the rotor for each genetic
geometry.
4.2 Optimization results
Figures 12 shows the Pareto’s fronts obtained for the case with 6 bulks of volume
33 × 33 × 14 mm3 at the bottom of Stator I.
Figure 12: Pareto’s front for the case of 6 HTS bulks at the bottom of Stator I.
PMs (out) PM (in)
HTSs
11
As expected, the maximum levitation force is verified for the genetic code with 𝑑𝑚 = 5 mm (rotor D5)
and 𝑑𝑠𝑐 = 10 mm, corresponding to one of the two geometries with the levitation and guidance force
characteristics presented in section 3. The two vertical dashed lines correspond to the two geometries
presented in section 3.
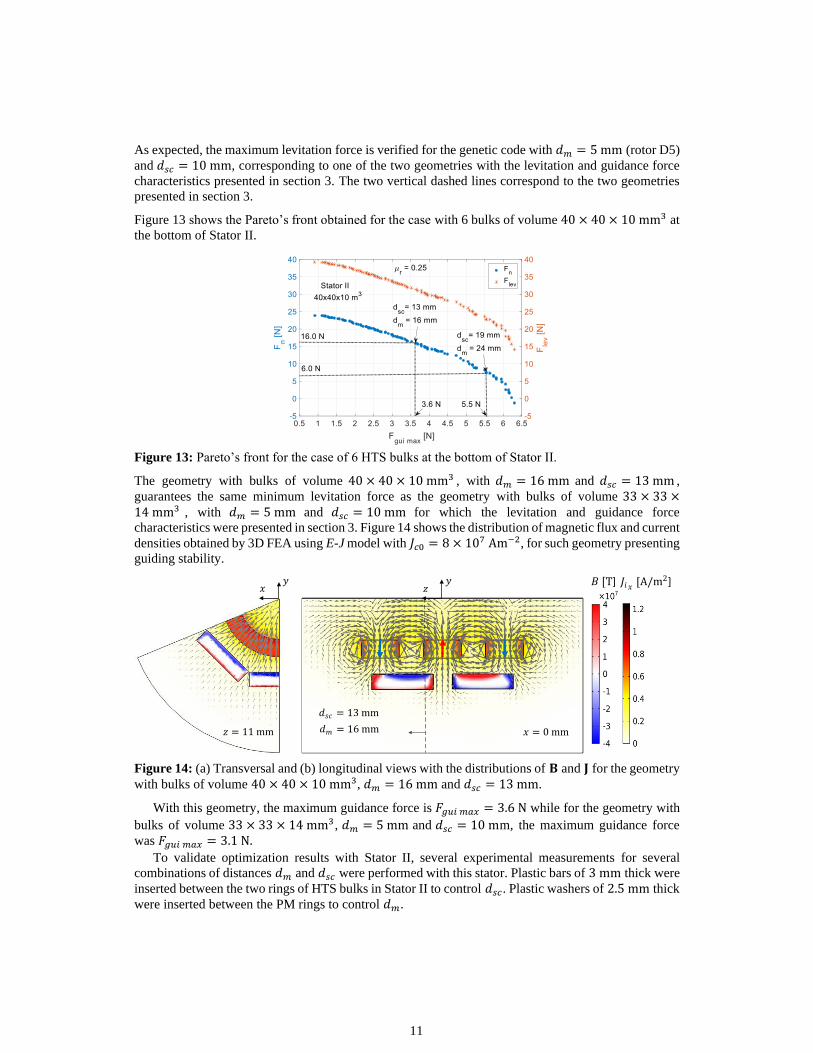
Figure 13 shows the Pareto’s front obtained for the case with 6 bulks of volume 40 × 40 × 10 mm3 at
the bottom of Stator II.
Figure 13: Pareto’s front for the case of 6 HTS bulks at the bottom of Stator II.
The geometry with bulks of volume 40 × 40 × 10 mm3 , with 𝑑𝑚 = 16 mm and 𝑑𝑠𝑐 = 13 mm ,
guarantees the same minimum levitation force as the geometry with bulks of volume 33 × 33 ×14 mm3 , with 𝑑𝑚 = 5 mm and 𝑑𝑠𝑐 = 10 mm for which the levitation and guidance force
characteristics were presented in section 3. Figure 14 shows the distribution of magnetic flux and current
densities obtained by 3D FEA using E-J model with 𝐽𝑐0 = 8 × 10⁷ Am−2, for such geometry presenting
guiding stability.
Figure 14: (a) Transversal and (b) longitudinal views with the distributions of 𝐁 and 𝐉 for the geometry
with bulks of volume 40 × 40 × 10 mm3, 𝑑𝑚 = 16 mm and 𝑑𝑠𝑐 = 13 mm.
With this geometry, the maximum guidance force is 𝐹𝑔𝑢𝑖 𝑚𝑎𝑥 = 3.6 N while for the geometry with
bulks of volume 33 × 33 × 14 mm3 , 𝑑𝑚 = 5 mm and 𝑑𝑠𝑐 = 10 mm, the maximum guidance force
was 𝐹𝑔𝑢𝑖 𝑚𝑎𝑥 = 3.1 N.
To validate optimization results with Stator II, several experimental measurements for several
combinations of distances 𝑑𝑚 and 𝑑𝑠𝑐 were performed with this stator. Plastic bars of 3 mm thick were
inserted between the two rings of HTS bulks in Stator II to control 𝑑𝑠𝑐. Plastic washers of 2.5 mm thick
were inserted between the PM rings to control 𝑑𝑚.
𝑧 = 11 mm
𝑦 𝑥
𝑥 = 0 mm
𝑦 𝑧
𝑑𝑠𝑐 = 13 mm
𝑑𝑚 = 16 mm
𝐵 [T] 𝐽𝑖 𝑥 [A/m2]
12
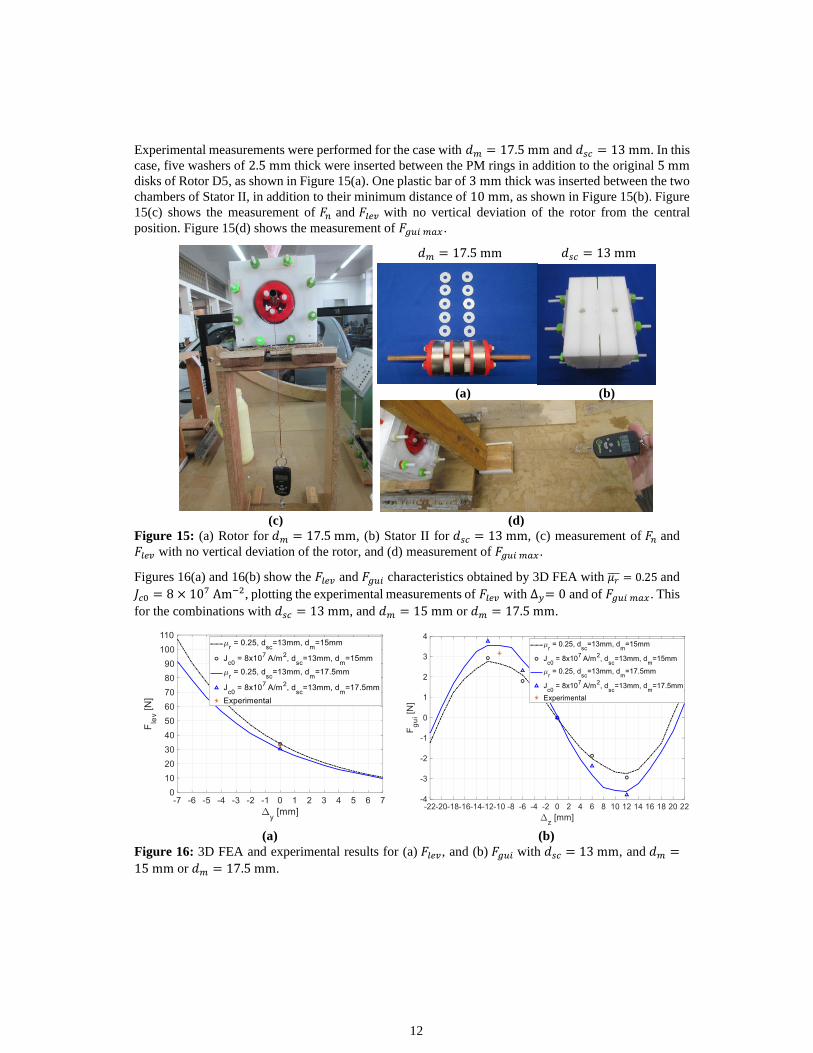
Experimental measurements were performed for the case with 𝑑𝑚 = 17.5 mm and 𝑑𝑠𝑐 = 13 mm. In this
case, five washers of 2.5 mm thick were inserted between the PM rings in addition to the original 5 mm
disks of Rotor D5, as shown in Figure 15(a). One plastic bar of 3 mm thick was inserted between the two
chambers of Stator II, in addition to their minimum distance of 10 mm, as shown in Figure 15(b). Figure
15(c) shows the measurement of 𝐹𝑛 and 𝐹𝑙𝑒𝑣 with no vertical deviation of the rotor from the central
position. Figure 15(d) shows the measurement of 𝐹𝑔𝑢𝑖 𝑚𝑎𝑥 .
𝑑𝑚 = 17.5 mm
𝑑𝑠𝑐 = 13 mm
(a) (b)
(c) (d)
Figure 15: (a) Rotor for 𝑑𝑚 = 17.5 mm, (b) Stator II for 𝑑𝑠𝑐 = 13 mm, (c) measurement of 𝐹𝑛 and
𝐹𝑙𝑒𝑣 with no vertical deviation of the rotor, and (d) measurement of 𝐹𝑔𝑢𝑖 𝑚𝑎𝑥 .
Figures 16(a) and 16(b) show the 𝐹𝑙𝑒𝑣 and 𝐹𝑔𝑢𝑖 characteristics obtained by 3D FEA with 𝜇𝑟̅̅ ̅ = 0.25 and
𝐽𝑐0 = 8 × 10⁷ Am−2, plotting the experimental measurements of 𝐹𝑙𝑒𝑣 with ∆𝑦= 0 and of 𝐹𝑔𝑢𝑖 𝑚𝑎𝑥 . This
for the combinations with 𝑑𝑠𝑐 = 13 mm, and 𝑑𝑚 = 15 mm or 𝑑𝑚 = 17.5 mm.
(a) (b)
Figure 16: 3D FEA and experimental results for (a) 𝐹𝑙𝑒𝑣 , and (b) 𝐹𝑔𝑢𝑖 with 𝑑𝑠𝑐 = 13 mm, and 𝑑𝑚 =
15 mm or 𝑑𝑚 = 17.5 mm.
13
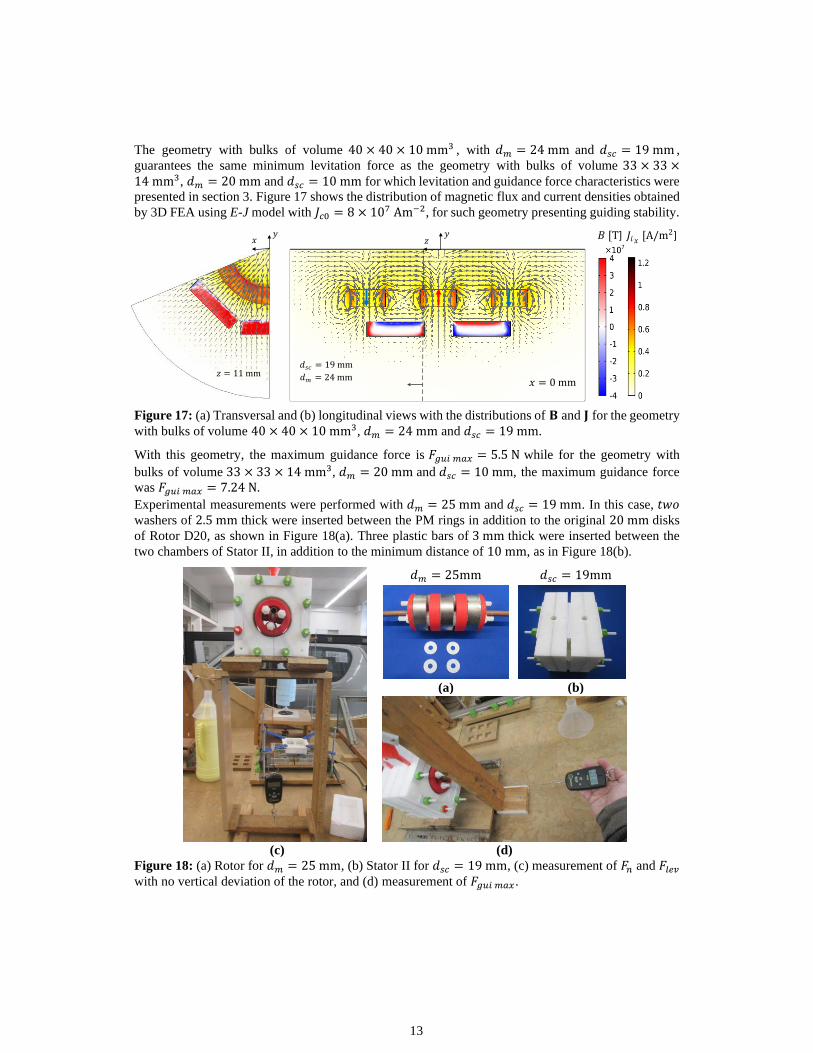
The geometry with bulks of volume 40 × 40 × 10 mm3 , with 𝑑𝑚 = 24 mm and 𝑑𝑠𝑐 = 19 mm ,
guarantees the same minimum levitation force as the geometry with bulks of volume 33 × 33 ×14 mm3, 𝑑𝑚 = 20 mm and 𝑑𝑠𝑐 = 10 mm for which levitation and guidance force characteristics were
presented in section 3. Figure 17 shows the distribution of magnetic flux and current densities obtained
by 3D FEA using E-J model with 𝐽𝑐0 = 8 × 10⁷ Am−2, for such geometry presenting guiding stability.
Figure 17: (a) Transversal and (b) longitudinal views with the distributions of 𝐁 and 𝐉 for the geometry
with bulks of volume 40 × 40 × 10 mm3, 𝑑𝑚 = 24 mm and 𝑑𝑠𝑐 = 19 mm.
With this geometry, the maximum guidance force is 𝐹𝑔𝑢𝑖 𝑚𝑎𝑥 = 5.5 N while for the geometry with
bulks of volume 33 × 33 × 14 mm3, 𝑑𝑚 = 20 mm and 𝑑𝑠𝑐 = 10 mm, the maximum guidance force
was 𝐹𝑔𝑢𝑖 𝑚𝑎𝑥 = 7.24 N.
Experimental measurements were performed with 𝑑𝑚 = 25 mm and 𝑑𝑠𝑐 = 19 mm. In this case, 𝑡𝑤𝑜
washers of 2.5 mm thick were inserted between the PM rings in addition to the original 20 mm disks
of Rotor D20, as shown in Figure 18(a). Three plastic bars of 3 mm thick were inserted between the
two chambers of Stator II, in addition to the minimum distance of 10 mm, as in Figure 18(b).
𝑑𝑚 = 25mm
(a)
𝑑𝑠𝑐 = 19mm
(b)
(c) (d)
Figure 18: (a) Rotor for 𝑑𝑚 = 25 mm, (b) Stator II for 𝑑𝑠𝑐 = 19 mm, (c) measurement of 𝐹𝑛 and 𝐹𝑙𝑒𝑣
with no vertical deviation of the rotor, and (d) measurement of 𝐹𝑔𝑢𝑖 𝑚𝑎𝑥 .
𝑧 = 11 mm
𝑦 𝑥
𝑥 = 0 mm
𝑦 𝑧
𝑑𝑠𝑐 = 19 mm
𝑑𝑚 = 24 mm
𝐵 [T] 𝐽𝑖 𝑥 [A/m2]
14
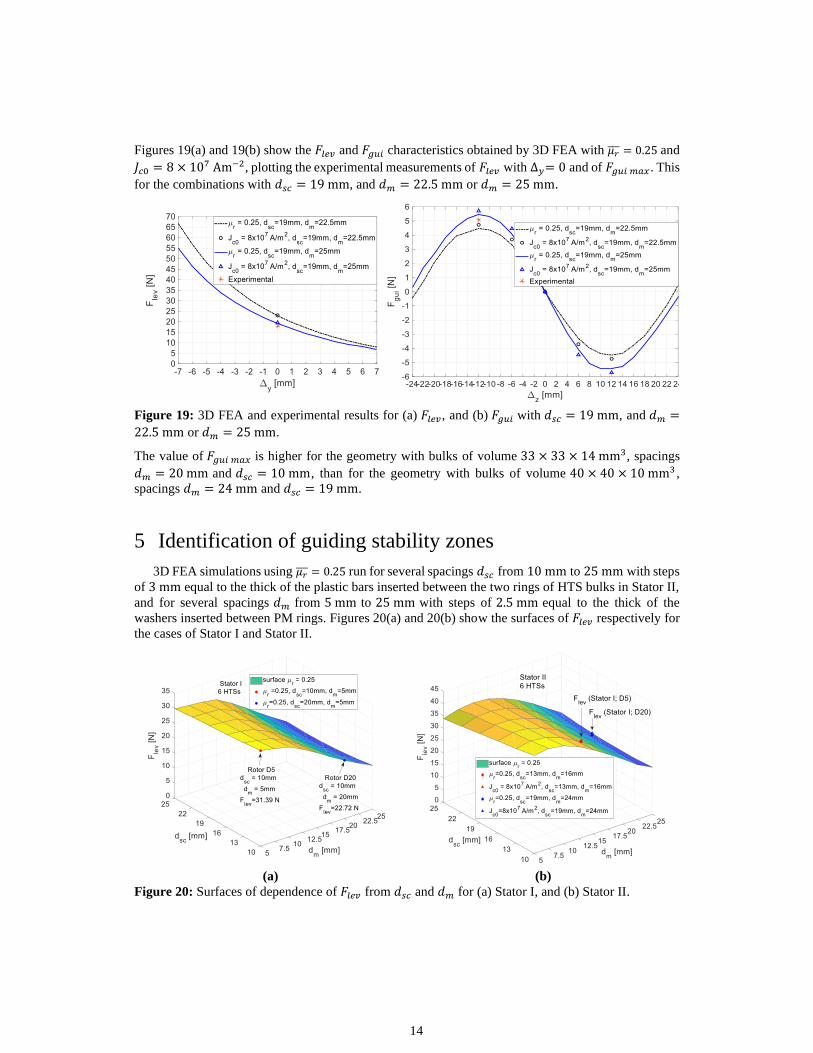
Figures 19(a) and 19(b) show the 𝐹𝑙𝑒𝑣 and 𝐹𝑔𝑢𝑖 characteristics obtained by 3D FEA with 𝜇𝑟̅̅ ̅ = 0.25 and
𝐽𝑐0 = 8 × 10⁷ Am−2, plotting the experimental measurements of 𝐹𝑙𝑒𝑣 with ∆𝑦= 0 and of 𝐹𝑔𝑢𝑖 𝑚𝑎𝑥 . This
for the combinations with 𝑑𝑠𝑐 = 19 mm, and 𝑑𝑚 = 22.5 mm or 𝑑𝑚 = 25 mm.
Figure 19: 3D FEA and experimental results for (a) 𝐹𝑙𝑒𝑣 , and (b) 𝐹𝑔𝑢𝑖 with 𝑑𝑠𝑐 = 19 mm, and 𝑑𝑚 =
22.5 mm or 𝑑𝑚 = 25 mm.
The value of 𝐹𝑔𝑢𝑖 𝑚𝑎𝑥 is higher for the geometry with bulks of volume 33 × 33 × 14 mm3, spacings
𝑑𝑚 = 20 mm and 𝑑𝑠𝑐 = 10 mm, than for the geometry with bulks of volume 40 × 40 × 10 mm3 ,
spacings 𝑑𝑚 = 24 mm and 𝑑𝑠𝑐 = 19 mm.
5 Identification of guiding stability zones
3D FEA simulations using 𝜇𝑟̅̅ ̅ = 0.25 run for several spacings 𝑑𝑠𝑐 from 10 mm to 25 mm with steps
of 3 mm equal to the thick of the plastic bars inserted between the two rings of HTS bulks in Stator II,
and for several spacings 𝑑𝑚 from 5 mm to 25 mm with steps of 2.5 mm equal to the thick of the
washers inserted between PM rings. Figures 20(a) and 20(b) show the surfaces of 𝐹𝑙𝑒𝑣 respectively for
the cases of Stator I and Stator II.
Figure 20: Surfaces of dependence of 𝐹𝑙𝑒𝑣 from 𝑑𝑠𝑐 and 𝑑𝑚 for (a) Stator I, and (b) Stator II.
(a) (b)
15
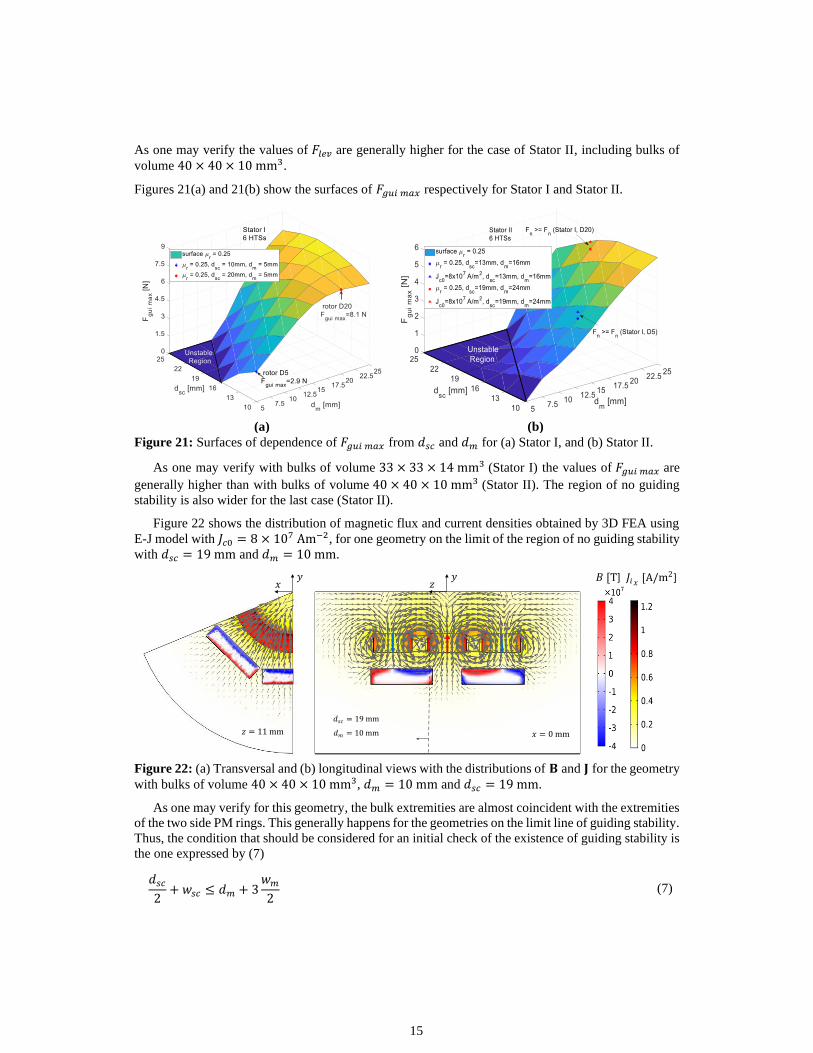
As one may verify the values of 𝐹𝑙𝑒𝑣 are generally higher for the case of Stator II, including bulks of
volume 40 × 40 × 10 mm3.
Figures 21(a) and 21(b) show the surfaces of 𝐹𝑔𝑢𝑖 𝑚𝑎𝑥 respectively for Stator I and Stator II.
(a) (b)
Figure 21: Surfaces of dependence of 𝐹𝑔𝑢𝑖 𝑚𝑎𝑥 from 𝑑𝑠𝑐 and 𝑑𝑚 for (a) Stator I, and (b) Stator II.
As one may verify with bulks of volume 33 × 33 × 14 mm3 (Stator I) the values of 𝐹𝑔𝑢𝑖 𝑚𝑎𝑥 are
generally higher than with bulks of volume 40 × 40 × 10 mm3 (Stator II). The region of no guiding
stability is also wider for the last case (Stator II).
Figure 22 shows the distribution of magnetic flux and current densities obtained by 3D FEA using
E-J model with 𝐽𝑐0 = 8 × 10⁷ Am−2, for one geometry on the limit of the region of no guiding stability
with 𝑑𝑠𝑐 = 19 mm and 𝑑𝑚 = 10 mm.
Figure 22: (a) Transversal and (b) longitudinal views with the distributions of 𝐁 and 𝐉 for the geometry
with bulks of volume 40 × 40 × 10 mm3, 𝑑𝑚 = 10 mm and 𝑑𝑠𝑐 = 19 mm.
As one may verify for this geometry, the bulk extremities are almost coincident with the extremities
of the two side PM rings. This generally happens for the geometries on the limit line of guiding stability.
Thus, the condition that should be considered for an initial check of the existence of guiding stability is
the one expressed by (7)
𝑑𝑠𝑐
2+ 𝑤𝑠𝑐 ≤ 𝑑𝑚 + 3
𝑤𝑚
2 (7)
𝑧 = 11 mm
𝑦 𝑥
𝑥 = 0 mm
𝑦 𝑧
𝑑𝑚 = 10 mm
𝑑𝑠𝑐 = 19 mm
𝐵 [T] 𝐽𝑖 𝑥 [A/m2]

16
from which may be deduced the minimum limit for 𝑑𝑚 given by (8)
𝑑𝑚 ≥𝑑𝑠𝑐
2− 3
𝑤𝑚
2+ 𝑤𝑠𝑐 (8)
Table II presents minimum values of 𝑑𝑚 for several values of 𝑑𝑠𝑐, on the cases of Stator I and Stator II,
calculated using (8).
Table II: Minimum values of 𝑑𝑚 (8) for several values of 𝑑𝑠𝑐, on the cases of Stator I and Stator II.
Minimum 𝑑𝑚 [mm]
𝑑𝑠𝑐 [mm] Stator I Stator II
10 0.5 7.5
13 2 9
16 3.5 10.5
19 5 12
22 6.5 13.5
25 8 15
The values in Table II follow with good approximation the lines on the limit of the guiding stability
regions on Figures 21(a) and 21(b).
6 Conclusion
This study aims to present methodologies to determine geometries that maximize the guiding
stability of a horizontal axis radial levitation bearing with HTS bulks cooled by ZFC. The guiding
stability on the cases of two possible Stators with two different bulk sizes (33 × 33 × 14 mm3and
40 × 40 × 10 mm3) for bearing experimental prototypes was studied. The regions of combinations of
spacings where there is guiding stability were determined for the two Stator cases. An expression that
may be used to identify the limit of the stability region was identified at first sight. The region of
combinations of the spacing 𝑑𝑠𝑐 between the two HTS bulk rings and spacing 𝑑𝑚 between PM rings,
for which the guiding stability is lower for the case of 40 × 40 × 10 mm3 size bulks in Stator II than
for the case of 33 × 33 × 14 mm3 size bulks in Stator I. The maximum guiding force 𝐹𝑔𝑢𝑖 𝑚𝑎𝑥 for each
combination of spacings is generally also higher on the second case. The optimization of spacings
performed for the two Stator cases resulted in Pareto’s curves from where one can obtain the maximum
possible value of 𝐹𝑔𝑢𝑖 𝑚𝑎𝑥 , for a given restriction on the minimum levitation force 𝐹 𝑙𝑒𝑣 that should be
guaranteed.
7 Acknowledgements
Work supported by FCT funds, to projects UID/EMS/50022/2013 and PTDC/EEEIEEL/4693/2014
– HTSISTELEC under LAETA\IDMEC, by FCT fellowship SFRH/BD/117921/2016 to A.J. Arsénio
as a Ph.D. student in IST, the help of fablab from EDP and Lisbon’s City Hall, in CNC milling machine
works.
17
References
Arsénio, A. J., Carvalho, M. V., Cardeira, C., Branco, P.J. C., and Melício, R. (2016) Conception
of a YBCO superconducting ZFC-magnetic bearing virtual prototype. IEEE International Power
Electronics and Motion Control Conference (PEMC), 25-28 September 2016.
Arsénio, A. J., Roque, M., Cardeira, C., Branco, P. J. C., and Melicio, R. (2018). Prototype of a
Zero-Field-Cooled YBCO Bearing with Continuous Ring Permanent Magnets. IEEE Transactions on
Applied Superconductivity, 28(4).
Fernandes, J. F. P., Costa, A.J. Arsénio and Arnaud, J. (2020). Optimization of a Horizontal Axis
HTS ZFC Levitation Bearing Using Genetic Decision Algorithms Over Finite Element Results. IEEE
Transactions on Applied Superconductivity, 30(2).
Quéval, L., Sotelo, G. G., Kharmiz, Y., Dias, D. H. N., Sass F., Zermeño, V. M. R. and
Gottkehaskamp, R. (2016). Optimization of the Superconducting Linear Magnetic Bearing of a Maglev
Vehicle. IEEE Transactions on Applied Superconductivity, 26(3).
Arsénio, A.J., Melicio, R., Cardeira, C., and Branco, P.J. Costa (2018). The Critic Liquid-gas Phase
Transition between Liquid Nitrogen and YBCO HTS bulks: from FEM Modeling to Its Experimental
Study for ZFC Levitation Devices. IEEE Transactions on Applied Superconductivity, 28(4).
Arsénio, Antonio J. Costa, and Branco, Paulo J. Costa (2021). Thermo-Hydraulic Analysis of a
Horizontal HTS ZFC Levitating Bearing Concerning Its Autonomy Safety Service Time. IEEE
Transactions on applied superconductivity 31, (5).
Hong, Z., Campbell, H. M. and Coombs T.A. (2007). Computer Modeling of Magnetisation in High
Temperature Superconductors. IEEE Transactions on applied superconductivity, 17(2), (pp. 3761-
3764).
Zhang M., and Coombs T.A. (2012). 3D modeling of high-Tc superconductors by finite element
software. Superconductor Science and Technology, vol. 25.
Koo, J. H. and Cho G. (2004). Magnetic field dependence on transition temperature Tc in cuprate
superconductors. Solid State Communications, 129, (pp. 191-193).
Yamamoto, K., Mazaki, H. and Yasuoka, H. (1993). Magnetization of type-II superconductors in
the Kim-Anderson model. Physical Review B, 47(2).
Fujishiro, H., and Naito, T. (2010). Simulation of temperature and magnetic field distribution in
superconducting bulk during pulsed field magnetization. Superconductor Science and Technology, 23,
105021.
Peixoto, Inês S. P., Ferreira da Silva, F., Fernandes, João F. P., and Branco, P. J. da Costa (2021).
3D Equivalent Space-Varying Permeability Model of HTS Bulks for Computation of Electromagnetic
Forces. IEEE Transactions on applied superconductivity 31, (5).