Optimization of spray quenching for aluminum extrusion ... Publications/18.pdf · Optimization of...
10
J. Heat Treat. (1989) 7:9-18 1989 Springer-Verlag New York Inc. Optimization of Spray Quenching for Aluminum Extrusion, Forging, or Continuous Casting T.A. Deiters and I. Mudawar Abstract. A review of the current understanding of heat transfer from quenched alloy products to water sprays is presented. A numerical example is described to demonstrate how controlled spray cooling of products containing sections of differing thicknesses significantly reduces thermal gradients. A semi-expert computer-aided design (CAD) system is proposed for optimizing the process of spray quenching following extrusion, forging, or continuous casting. A systematic experimental approach to the problem of providing a universal heat transfer data base for the proposed CAD system is presented. INTRODUCTION Mechanical and metallurgical requirements impose limits on the rates at which aluminum alloys can be quenched by water sprays. The upper limit is set by the occurrence of plastic deformation which causes warping of the product and the lower limit is set by an inability to develop the required metallurgical properties in subsequent heat treatment operations. In addition, if a product contains sections of differing thicknesses, it is unlikely that the optimum properties can be obtained throughout the entire cross section using a single spray density. At present a method for determining the nozzle configuration and spray den- sity required for the spray cooling of a given alloy of given geometry is not available and this causes much guesswork and trial and error in establishing an ac- ceptable configuration for a production run. The transformation of bulk liquid into sprays and other physical dispersions of small particles in a gas- eous atmosphere has importance in several industrial processes such as the application of chemicals to ag- ricultural crops, paint spraying, spray drying of wet solids, food processing, cooling of nuclear cores, and dispersions of liquid fuels for combustion [1]. Of spe- cific interest in the present work is the application of water sprays to the quenching of aluminum alloys. T.A. Deiters is Graduate Research Assistant and I. Mudawar is Assistant Professor and Director of the Boiling and Two-Phase Flow Laboratory, School of Mechanical Engineering, Purdue Uni- versity, West Lafayette, IN 47907, USA. Accurate control of the cooling rates during quenching requires a careful characterization of the spray. One means of characterizing the effectiveness of sprays is the boiling curve shown in Figure 1 as a log-log plot of the variation of the heat flux from a hot surface, q, with the difference between the tem- perature of the hot surface and the saturation temper- ature of the cooling fluid, ATs. If, in a spray quench- ing process, the initial value of ATs is high enough, the liquid droplets in the spray do not make contact with the surface. The phenomenon occurs in the film boiling regime of the boiling curve, corresponding to the location of point 1 in Figure 1. In this regime heat transfer to the spray is relatively poor because of the insulating properties of the thin blanket of vapor which is produced on the hot surface. With continued cool- ing both the heat flux and the surface temperature de- crease until a minimum in the former is reached at the Leidenfrost point, located at position 2 in Figure 1. At this point liquid droplets in the spray begin to pen- etrate to the metal surface and a transition to nucleate boiling within the drops commences. With further de- crease in ATs the heat flux increases as the regime of nucleate boiling is entered, and at the onset of full nucleate boiling the heat flux from the surface reaches a maximum value, called the critical heat flux, at point 3 in Figure 1. With further cooling of the surface, nucleate boiling ceases and heat transfer occurs by single-phase convection to the cooling water flowing over the surface. Consequently, in this regime of forced convection, a decrease in ATs causes a decrease in the heat flux, as shown at location 4 in Figure 1. J. Heat Treating, Voi. 7, No. 1, 1989 9
Transcript of Optimization of spray quenching for aluminum extrusion ... Publications/18.pdf · Optimization of...
J. Heat Treat. (1989) 7:9-18 �9 1989 Springer-Verlag New York Inc.
Optimization of Spray Quenching for Aluminum Extrusion, Forging, or
Continuous Casting
T.A. Deiters and I. M u d a w a r
A b s t r a c t . A review of the current understanding of heat transfer from quenched alloy products to water sprays is presented. A numerical example is described to demonstrate how controlled spray cooling of products containing sections of differing thicknesses significantly reduces thermal gradients. A semi-expert computer-aided design (CAD) system is proposed for optimizing the process of spray quenching following extrusion, forging, or continuous casting. A systematic experimental approach to the problem of providing a universal heat transfer data base for the proposed CAD system is presented.
I N T R O D U C T I O N
Mechanical and metallurgical requirements impose limits on the rates at which aluminum alloys can be quenched by water sprays. The upper limit is set by the occurrence of plastic deformation which causes warping of the product and the lower limit is set by an inability to develop the required metallurgical properties in subsequent heat treatment operations. In addition, if a product contains sections of differing thicknesses, it is unlikely that the optimum properties can be obtained throughout the entire cross section using a single spray density. At present a method for determining the nozzle configuration and spray den- sity required for the spray cooling of a given alloy of given geometry is not available and this causes much guesswork and trial and error in establishing an ac- ceptable configuration for a production run.
The transformation of bulk liquid into sprays and other physical dispersions of small particles in a gas- eous atmosphere has importance in several industrial processes such as the application of chemicals to ag- ricultural crops, paint spraying, spray drying of wet solids, food processing, cooling of nuclear cores, and dispersions of liquid fuels for combustion [1]. Of spe- cific interest in the present work is the application of water sprays to the quenching of aluminum alloys.
T.A. Deiters is Graduate Research Assistant and I. Mudawar is Assistant Professor and Director of the Boiling and Two-Phase Flow Laboratory, School of Mechanical Engineering, Purdue Uni- versity, West Lafayette, IN 47907, USA.
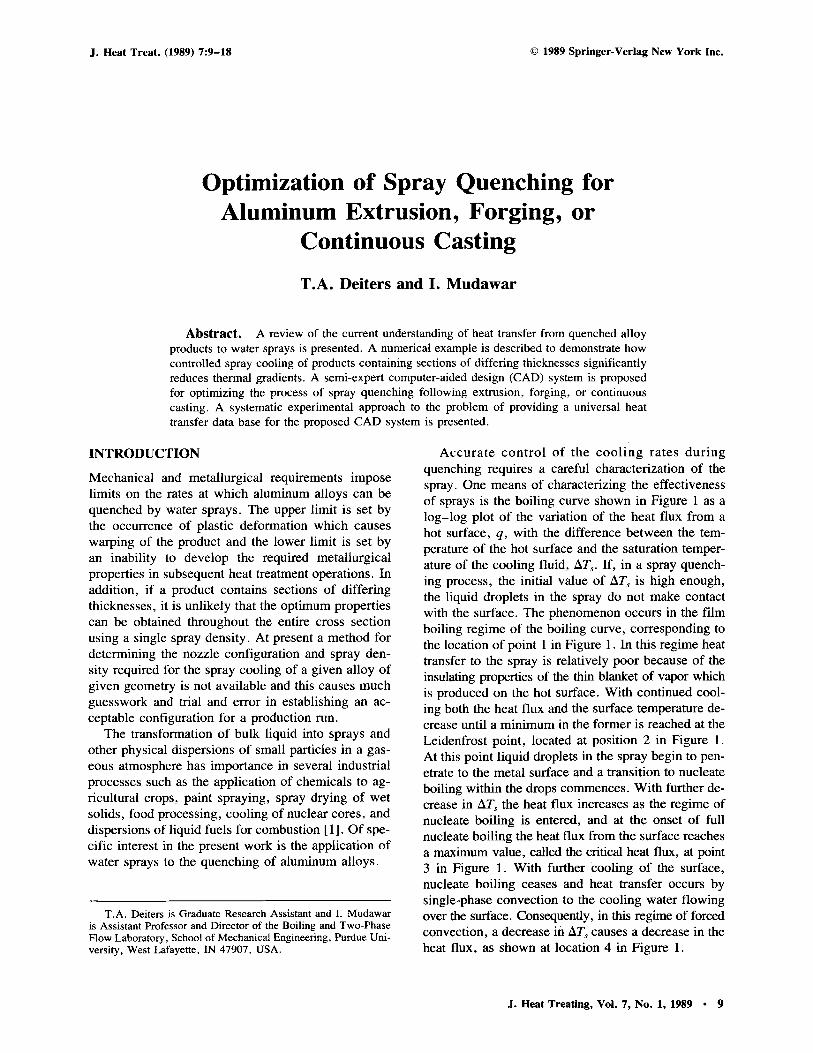
Accu ra t e con t ro l o f the coo l i ng rates dur ing quenching requires a careful characterization of the spray. One means of characterizing the effectiveness of sprays is the boiling curve shown in Figure 1 as a log- log plot of the variation of the heat flux from a hot surface, q, with the difference between the tem- perature of the hot surface and the saturation temper- ature of the cooling fluid, ATs. If, in a spray quench- ing process, the initial value of ATs is high enough, the liquid droplets in the spray do not make contact with the surface. The phenomenon occurs in the film boiling regime of the boiling curve, corresponding to the location of point 1 in Figure 1. In this regime heat transfer to the spray is relatively poor because of the insulating properties of the thin blanket of vapor which is produced on the hot surface. With continued cool- ing both the heat flux and the surface temperature de- crease until a minimum in the former is reached at the Leidenfrost point, located at position 2 in Figure 1. At this point liquid droplets in the spray begin to pen- etrate to the metal surface and a transition to nucleate boiling within the drops commences. With further de- crease in ATs the heat flux increases as the regime of nucleate boiling is entered, and at the onset of full nucleate boiling the heat flux from the surface reaches a maximum value, called the critical heat flux, at point 3 in Figure 1. With further cooling of the surface, nucleate boiling ceases and heat transfer occurs by single-phase convection to the cooling water flowing over the surface. Consequently, in this regime of forced convection, a decrease in ATs causes a decrease in the heat flux, as shown at location 4 in Figure 1.
J. Heat Treating, Voi. 7, No. 1, 1989 �9 9
T.A. Deiters & I. M u d a w a r �9 O p t i m i z i n g Spray Quench ing Process
o" o~
o
X
IT "6
Forced Nucleote Tronsition Film Convection Boiling Boiling Boiling Regime Regime Regime Regime
-- Critical Heat Flux
I ' . / 2 j / ~ Onset of NuOeateB:::: enfr~ P~
Wall Superheat log AT s
Fig. 1. Boiling curve.
Although the quench curve has been studied by many investigators, the criteria governing the posi- tions of the critical heat flux and the Leidenfrost tem- perature are not well understood. Since, for any given cooling medium, the Leidenfrost temperature is that below which the quench rate of the surface begins to increase rapidly, knowledge of the Leidenfrost tem- perature is critical to accurate control of cooling rates during quenching.
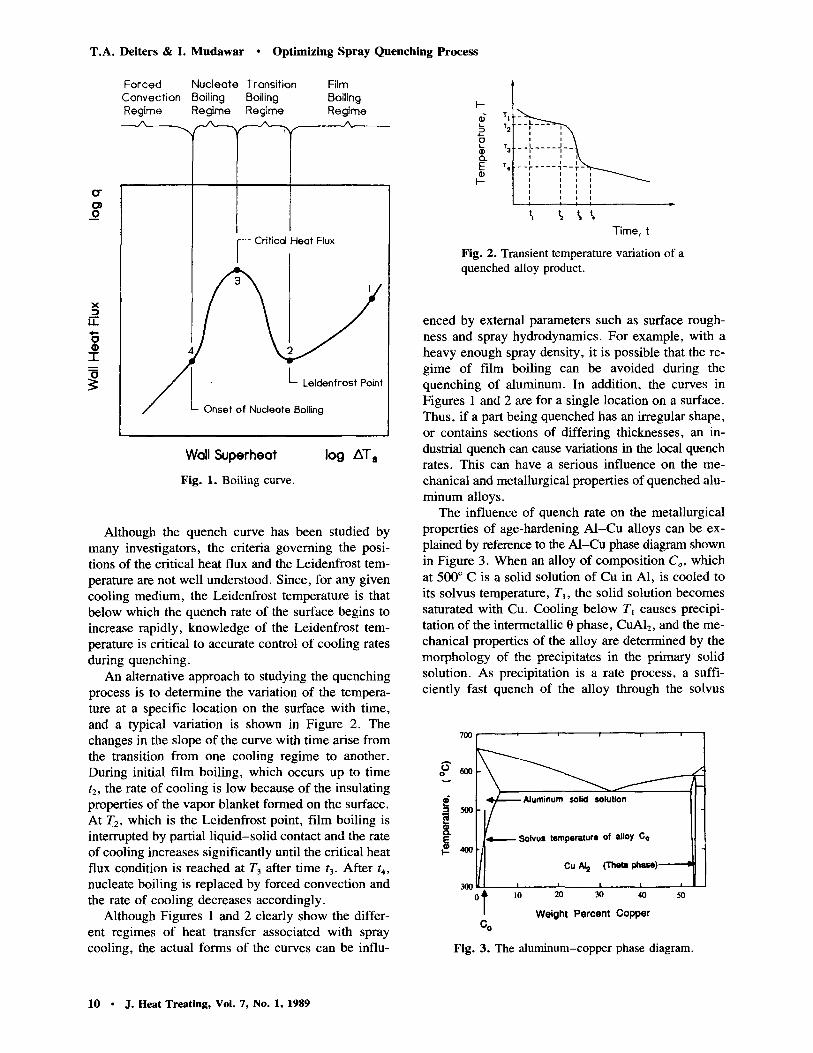
An alternative approach to studying the quenching process is to determine the variation of the tempera- ture at a specific location on the surface with time, and a typical variation is shown in Figure 2. The changes in the slope of the curve with time arise from the transition from one cooling regime to another. During initial film boiling, which occurs up to time t2, the rate of cooling is low because of the insulating properties of the vapor blanket formed on the surface. At T2, which is the Leidenfrost point, film boiling is interrupted by partial liquid-solid contact and the rate of cooling increases significantly until the critical heat flux condition is reached at T3 after time t3. After t4, nucleate boiling is replaced by forced convection and the rate of cooling decreases accordingly.
Although Figures 1 and 2 clearly show the differ- ent regimes of heat transfer associated with spray cooling, the actual forms of the curves can be influ-
t-
! E ' , --F . . . . "-- i l l
~} T4 i ' i
I-- ," i ,, ,
p t
Time, t Fig. 2. Transient temperature variation of a quenched alloy product.
enced by external parameters such as surface rough- ness and spray hydrodynamics. For example, with a heavy enough spray density, it is possible that the re- gime of film boiling can be avoided during the quenching of aluminum. In addition, the curves in Figures 1 and 2 are for a single location on a surface. Thus, if a part being quenched has an irregular shape, or contains sections of differing thicknesses, an in- dustrial quench can cause variations in the local quench rates. This can have a serious influence on the me- chanical and metallurgical properties of quenched alu- minum alloys.
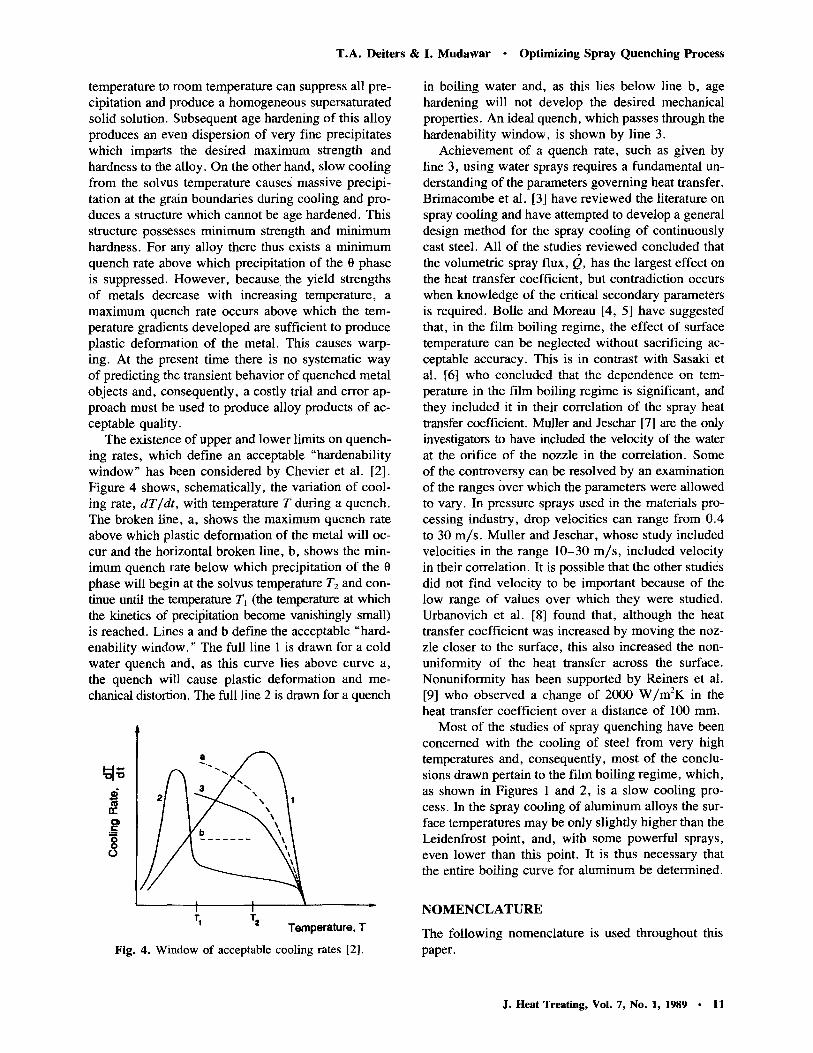
The influence of quench rate on the metallurgical properties of age-hardening A1-Cu alloys can be ex- plained by reference to the A1-Cu phase diagram shown in Figure 3. When an alloy of composition Co, which at 500 ~ C is a solid solution of Cu in A1, is cooled to its solvus temperature, T1, the solid solution becomes saturated with Cu. Cooling below T1 causes precipi- tation of the intermetallic 0 phase, CuA12, and the me- chanical properties of the alloy are determined by the morphology of the precipitates in the primary solid solution. As precipitation is a rate process, a suffi- ciently fast quench of the alloy through the solvus
A
500
400
0 ~ I0 20 30 40 50
Weight Percent Copper Co
Fig. 3. The aluminum-copper phase diagram.
10 �9 J. Heat Treating, Vol. 7, No. 1, 1989
T . A . Deiters & I. M u d a w a r �9 O p t i m i z i n g Spray Q u e n c h i n g Process
temperature to room temperature can suppress all pre- cipitation and produce a homogeneous supersaturated solid solution. Subsequent age hardening of this alloy produces an even dispersion of very fine precipitates which imparts the desired maximum strength and hardness to the alloy. On the other hand, slow cooling from the solvus temperature causes massive precipi- tation at the grain boundaries during cooling and pro- duces a structure which cannot be age hardened. This structure possesses minimum strength and minimum hardness. For any alloy there thus exists a minimum quench rate above which precipitation of the 0 phase is suppressed. However, because the yield strengths of metals decrease with increasing temperature, a maximum quench rate occurs above which the tem- perature gradients developed are sufficient to produce plastic deformation of the metal. This causes warp- ing. At the present time there is no systematic way of predicting the transient behavior of quenched metal objects and, consequently, a costly trial and error ap- proach must be used to produce alloy products of ac- ceptable quality.
The existence of upper and lower limits on quench- ing rates, which define an acceptable "hardenability window" has been considered by Chevier et al. [2]. Figure 4 shows, schematically, the variation of cool- ing rate, dT/dt, with temperature T during a quench. The broken line, a, shows the maximum quench rate above which plastic deformation of the metal will oc- cur and the horizontal broken line, b, shows the min- imum quench rate below which precipitation of the 0 phase will begin at the solvus temperature T2 and con- tinue until the temperature T1 (the temperature at which the kinetics of precipitation become vanishingly small) is reached. Lines a and b define the acceptable "hard- enability window." The full line 1 is drawn for a cold water quench and, as this curve lies above curve a, the quench will cause plastic deformation and me- chanical distortion. The full line 2 is drawn for a quench
q;
n"
e -
o o
2
I I Temperature, T
Fig. 4. Window of acceptable cooling rates [2].
in boiling water and, as this lies below line b, age hardening will not develop the desired mechanical properties. An ideal quench, which passes through the hardenability window, is shown by line 3.
Achievement of a quench rate, such as given by line 3, using water sprays requires a fundamental un- derstanding of the parameters governing heat transfer. Brimacombe et al. [3] have reviewed the literature on spray cooling and have attempted to develop a general design method for the spray cooling of continuously cast steel. All of the studies reviewed concluded that the volumetric spray flux, Q, has the largest effect on the heat transfer coefficient, but contradiction occurs when knowledge of the critical secondary parameters is required. Bolle and Moreau [4, 5] have suggested that, in the film boiling regime, the effect of surface temperature can be neglected without sacrificing ac- ceptable accuracy. This is in contrast with Sasaki et al. [6] who concluded that the dependence on tem- perature in the film boiling regime is significant, and they included it in their correlation of the spray heat transfer coefficient. Muller and Jeschar [7] are the only investigators to have included the velocity of the water at the orifice of the nozzle in the correlation. Some of the controversy can be resolved by an examination of the ranges over which the parameters were allowed to vary. In pressure sprays used in the materials pro- cessing industry, drop velocities can range from 0.4 to 30 m/s . Muller and Jeschar, whose study included velocities in the range 10-30 m/s , included velocity in their correlation. It is possible that the other studies did not find velocity to be important because of the low range of values over which they were studied. Urbanovich et al. [8] found that, although the heat transfer coefficient was increased by moving the noz- zle closer to the surface, this also increased the non- uniformity of the heat transfer across the surface. Nonuniformity has been supported by Reiners et al. [9] who observed a change of 2000 W/m2K in the heat transfer coefficient over a distance of 100 ram.
Most of the studies of spray quenching have been concerned with the cooling of steel from very high temperatures and, consequently, most of the conclu- sions drawn pertain to the film boiling regime, which, as shown in Figures 1 and 2, is a slow cooling pro- cess. In the spray cooling of aluminum alloys the sur- face temperatures may be only slightly higher than the Leidenfrost point, and, with some powerful sprays, even lower than this point. It is thus necessary that the entire boiling curve for aluminum be determined.
N O M E N C L A T U R E
The following nomenclature is used throughout this paper.
J. Heat Treating, Vol. 7, No. 1, 1989 �9 11

T.A. Deiters & I. Mudawar �9 Optimizing Spray Q u e n c h i n g P r o c e s s
Cp
d = h = k = p : q =
0 = t =
T = A T , =
u m
p-=
specific heat of alloy at constant pressure (J/kg K) drop diameter (mm) convection coefficient (W/m2K) thermal conductivity of alloy (W /m K) pressure (kPa) local heat flux (W/m 2) local volumetric spray flux (m3s-1/m 2) time (s) temperature (~ Ts - T,a, (~ drop velocity at impingement (m/s) density of alloy (kg/m 3)
S u b s c r i p t s
f = inlet water conditions i --- initial s -= metal surface
sat -= saturation
C O N T R O L L E D SPRAY C O O L I N G C ONC EP T
Using the limited results of previous studies, numer- ical simulation of the spray quenching of an alumi- num product can clearly illustrate the feasibility of improving product quality by controlling the quench boundary between the product and the spray. A sim- ple, yet inclusive, geometry was selected to simulate an aluminum extrusion during the quenching process. A schematic of the shape, and all relevant informa- tion, are shown in Figure 5. This specific profile was chosen because its thick thin ratio makes it an excel-
over the temperature range considered (482 ~ C-50 ~ C). The water spray was specified to be at a constant tem- perature of 20 ~ C and the aluminum cross section was initially at a uniform temperature of 482 ~ C. Heat loss due to radiation and axial conduction were neglected in this simplified two-dimensional analysis. The gov- erning equation for this problem is:
o/,o t 0 o k +
and the boundary conditions are:
(1)
OT k - - = q = h(T~- Ty) (2)
Ox
OT k - = q = h(T~ - T/) (3)
0y
The heat flux results obtained by Bratuta and Krav- tsov [10] and shown in Figure 6 were used to provide an estimate of the boundary conditions to be encoun- tered with water sprays. The surface heat flux was measured as a function of surface temperature for three different spray fluxes (heavy, medium, and light). The figure shows that the heat flux (and thus the heat transfer coefficient) increases with an increase in vol- umetric spray flux. The heat flux values were con- verted to convection coefficient data by the definition:
q = h (T~ - 7"/) ( 4 )
lent candidate for deformation if it is quenched with 5 , 0 ~ , . , , ] a uniform bank of sprays. ~pr,y F~-x " ' " - 7 \ I
It was assumed that the work piece was homoge- 1) 0.076 / ' ~ i \ | 2) o.o4s / - ~ \ /
neous and that the material properties remain constant ~ , 4 " 0 - 3 ) ~ 1 7 6 1 7 6 ~ 1
T f - 20~ I I t',
. ~ .::'.:]1 Cn~m ~ Ol
o o , " , , , , �9 80 160 240 320 400
T s l o C I
Fig. 6. Dependence of heat flux on spray density [10]. Fig. 5. Aluminum extrusion geometry utilized in the nu- merical verification of the controlled quenching system.
12 �9 J. Heat Treat ing, Vol . 7, No. 1, 1989

T . A . Deiters & I. M u d a w a r �9 O p t i m i z i n g Spray Q u e n c h i n g Process
A finite difference program was used to calculate the transient temperature distribution in the cross sec- tion. A nonuniform grid, consisting of 200 nodes, was designed to give a high resolution of the temperature field in the area where the two legs joined as it was anticipated that the most severe thermal gradients would exist at this location.
The first numerical example shows the effects of a fast quench in which the highest spray density was used at each of the six surfaces, and Figure 7(a) shows a plot of the transient temperature at various locations in the cross section. The curves labeled C1, C2, and C3 show the temperatures along the thin leg and the other curves are for the thick leg. Using this uniform spray boundary, the cooling envelope encompasses a 325 ~ C temperature variation at one particular instant in time.
The large gap exhibited by the cooling envelope in Figure 7(a) indicates the temperature gradients which are developed in the part during the fast quench. The extruded angle has the dimension 10 cm by 7.5 cm and thus the predicted 325~ temperature gradient across this small part is destructive because it can cause residual stresses which, in turn, can cause warpage or
surface cracks. It is also important to note that the thin leg cools faster than the thick leg. To improve cooling uniformity, it is necessary to either increase the cool- ing rate of the thick leg to match that of the thin one or decrease the quench of the thin leg to that of the thick one. In practice this decision would be made using the window of acceptable cooling rates (Fig. 4) as a guideline. In the simulation, the quench rate of the thin leg was decreased because the boundary data from Bratuta and Kravtsov [10] were only available for lower spray fluxes.
A comparative simulation was run representing the "optimum" quench rate. The lowest spray flux den- sity was used along the sides of the thin leg and on the end of the thick leg and the highest spray flux density was used along the top and bottom surfaces of the thicker one. The result of these boundary con- ditions, shown in Figure 7(b), was to shrink the cool- ing envelope from 325 ~ C to 75 ~ C. I f the available data base had included higher density sprays the sim- ulation could have included the case in which both legs were cooled at the same rate. A faster quench (provided it did not exceed the upper limit) would en- sure the required hardness and the controlled cooling
Fig. 7. Cooling history for an extrusion quenched with (a) uniform spray and (b) controlled spray.
J. Heat Treating, Vol. 7, No. 1, 1989 �9 13

T.A. Deiters & I. M u d a w a r �9 O p t i m i z i n g Spray Quench ing Process
would still protect the product from any surface cracks or deformation.
The results of the numerical simulation might be made even more accurate by including axial conduc- tion effects. In addition, it is known that the heat transfer coefficient associated with sprays is a func- tion of such independent parameters as spray flux, drop diameter, drop velocity, surface temperature, and liq- uid temperature and it is also known that these pa- rameters may exhibit significant spatial variation within the spray field. Therefore it must be concluded that the heat transfer coefficient will vary spatially within the spray field. An accurate simulation should take into account this variation and not assume that the convection coefficient has the same relationship with temperature everywhere in the spray field. Although numerical simulation has shown that it is possible to adequately (and accurately) control the quenching process, insufficient heat transfer data for water sprays is a major obstacle to realizing this objective.
P R O P O S E D C O N T R O L L E D Q U E N C H
T E C H N O L O G Y
To improve quality and consistency between produc- tion runs and reduce costs, a method for optimizing the cooling rate for a particular shape and material is needed. The proposed approach involves the synthe- sis via CAD/CAM of heat transfer and materials en- gineering. As shown in Figure 8, an operator would input to a CAD system the geometry and desired properties of the product. The intelligent system would consult its materials data base to determine the cool- ing rate needed to produce parts with the desired met- allurgical properties. It would then numerically solve for the transient temperature distribution in the metal piece using the heat transfer data base to provide the boundary conditions. The CAD system would iterate here several times until a set of boundary conditions
Nozz le N4 ~ -p. ~ .p,~g
. N2 ~
�9 \ ~ , / z - ~ I / /
CAD SYSTEM
I I /
J Heat Transfer Data Base Material Specification
Fig, 8. Schematic of the proposed intelligent spray quench- ing system.
were found that provide a uniformly quenched prod- uct. These boundary conditions would be related to specific nozzle locations and pressures. The CAD system would then output these results to the operator who would prepare the quench chamber in accordance with the optimized recommendation. Possibly a mi- croprocessor could robotically control the spray noz- zle position and flow rate to further enhance the heat treatment process.
Even without the robot control this process is ideal for economizing the metal quenching industry. Ini- tially, it will significantly decrease the costly set-up time and reduce the scrap material involved with the trial and error method of finding the correct quench rate. During production it provides consistent material properties by inhibiting the variability of product properties associated with day-to-day human deci- sions. Finally the post-treatment of the part to correct any distortions that may have occurred during the quench has virtually been eliminated. Additionally this process method is particularly well suited for small batch operations where pre- and post-production costs are not as easily recovered in the volume of parts pro- duced.
The proposed controlled spray cooling system de- scribed in Figure 8 lacks a universal heat transfer data base that is needed to provide accurate boundary con- ditions for the numerical model utilized in the CAD software. It is known that the heat transfer coefficient can vary significantly within a spray field. The ap- proach currently employed at Purdue's Boiling and Two-Phase Flow Laboratory is to investigate the local spray parameters such as volumetric spray flux, Q, the drop velocity, u, and drop diameter, d, to deter- mine what effects these parameters have on h, the lo- cal heat transfer coefficient. The next step will be to mathematically model the two-dimensional spatial variation of Q, u, d, and h. As shown in schematic form in Figure 9, it is anticipated that the highest val- ues of these parameters will be directly below the nozzle and then possibly follow a Gaussian distribu- tion out to the spray boundaries. This formulation in addition to being a function of the X and Y coordinates is also dependent on the surface-to-nozzle distance and nozzle pressure. The advantage of having a mathe- matical model is that it greatly reduces the discrete data points that need to be taken in order to charac- terize the. spray field. The nozzle manufacturer could make discrete measurements of Q, u, and d at the locations shown in Figure 9 for specified nozzle pres- sures and heights above the sprayed surface�9 Using the mathematical model these measurements could be extrapolated to define the entire spray field in terms of Q, u, and d�9 Then using the universal cor- relation of h with Q, u, and d, the full spray field can
14 �9 J. Heat Treating, Vol. 7, No. 1, 1989
T . A . Deiters & I. M u d a w a r �9 O p t i m i z i n g Spray Q u e n c h i n g Process
'Q, u, or d
y Field
Fig. 9. Spatial variation of hydrodynamic spray parameters.
be characterized in terms of h, which boundary condition for the numerical problem.
defines the conduction
E X P E R I M E N T A L A P P R O A C H
A research facility has been designed and installed in the Boiling and Two-Phase Flow Laboratory. The fa- cility consists of a unique and effective system for
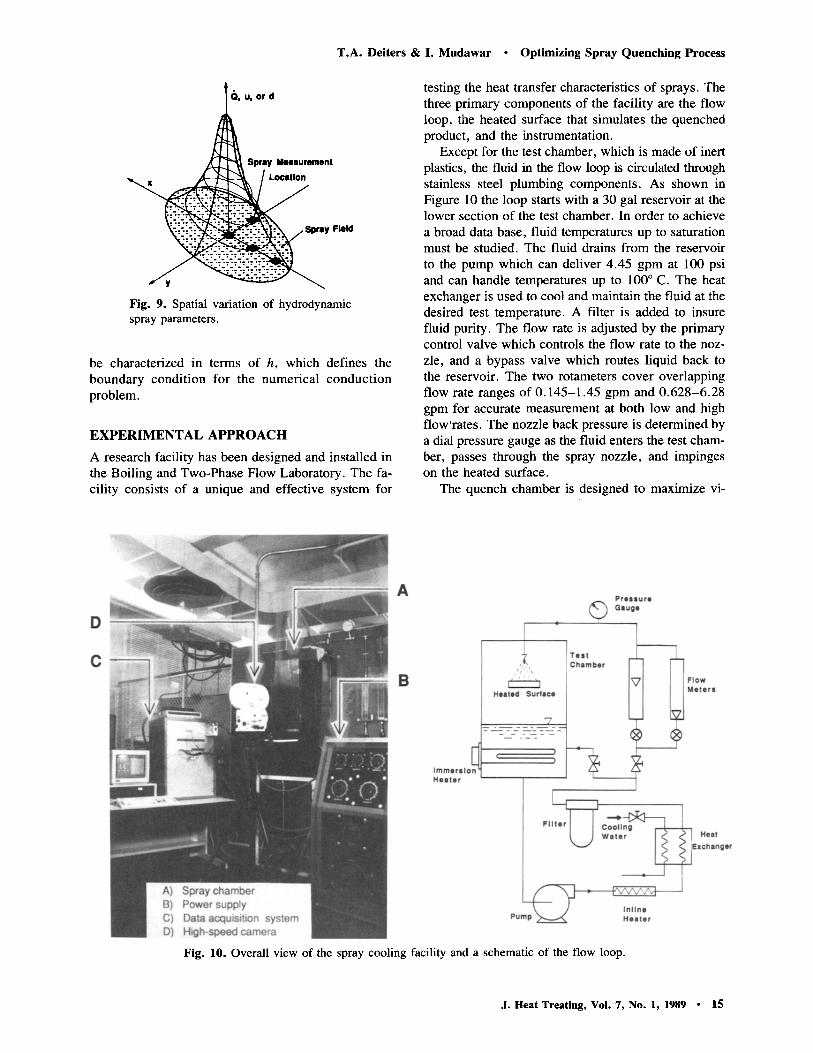
testing the heat transfer characteristics of sprays. The three primary components of the facility are the flow loop, the heated surface that simulates the quenched product, and the instrumentation.
Except for the test chamber, which is made of inert plastics, the fluid in the flow loop is circulated through stainless steel plumbing components. As shown in Figure 10 the loop starts with a 30 gal reservoir at the lower section of the test chamber. In order to achieve a broad data base, fluid temperatures up to saturation must be studied. The fluid drains f rom the reservoir to the pump which can deliver 4.45 gpm at 100 psi and can handle temperatures up to 100 ~ C. The heat exchanger is used to cool and maintain the fluid at the desired test temperature. A filter is added to insure fluid purity. The flow rate is adjusted by the primary control valve which controls the flow rate to the noz- zle, and a bypass valve which routes liquid back to the reservoir. The two rotameters cover overlapping flow rate ranges of 0.145-1.45 gpm and 0.628-6.28 gpm for accurate measurement at both low and high flow'rates. The nozzle back pressure is determined by a dial pressure gauge as the fluid enters the test cham- ber, passes through the spray nozzle, and impinges on the heated surface.
The quench chamber is designed to maximize vi-
Fig. 10. Overall view of the spray cooling facility and a schematic of the flow loop.
J. Heat Treating, Vol. 7, No. 1, 1989 �9 15

T . A . Dei ters & I. M u d a w a r �9 O p t i m i z i n g S p r a y Q u e n c h i n g P r o c e s s
sual access to the spray via three polycarbonate win- dows. Two photographic systems are used to aid in the understanding of spray interaction with the hot surface. The first is a low speed video system used for monitoring global spray characteristics. The sec- ond is an (NAC) high speed film based camera ca- pable of exposure speeds of 40,000 partial frames per second. The NAC system is equipped with a long range Questar microscopic lens for close-up viewing of the deformation of single droplets as small as 2 p,m in diameter upon impingement onto the surface.
A local, steady-state heat flux measurement tech- nique was adopted in the present study. This allows for a detailed mapping of the heat flux distribution within the spray field. This technique was preferred to quenching a large preheated sample of alloy and obtaining an average heat transfer coefficient for the spray since the transient technique compromises ac- curacy in measuring the instantaneous surface heat flux during the transient and in detecting spatial variation in heat flux. As shown in Figure 11, the simulated test sample is machined into a circular calorimeter bar with one surface exposed to the spray while the back section is heated by three cartridge heaters. Four equally spaced chromel-alumel thermocouples made from 0.075 mm wire are embedded along the axis of the calorimeter bar. The design of the test sample was numerically optimized to ensure one-dimensional heat flow to the 50 mm 2 quenched surface area. Heat flux is determined from the linear temperature gradient be- tween the four thermocouples, while the surface tem- perature is determined by extrapolating the tempera- ture distribution along the axis. The test sample is mounted in a large insulating module designed to re- duce heat loss from the heated sample.
A Compaq Deskpro 386 microcomputer is used in conjunction with a Keithley 500 data acquisition sys- tem to monitor temperatures in the heater and flow
loop. The data acquisition system also keeps track of the voltage and current input to the heater core.
As shown in Figure 12, the quench chamber is fit- ted with a three degree of freedom translation stage on which the spray nozzle is mounted. The simulated heater is placed at the geometric center of the spray chamber while the nozzle is positioned at any desired point relative to the heater in the X - Y - Z coordinate system to facilitate local measurements of the heat transfer coefficient throughout the spray field.
Figure 13 shows a three-dimensional plot of the
Fig. 12. Schematic of the quench chamber.
Fig. 11. Heater construction.
16 �9 J. Heat Treating, Vol. 7, No. 1, 1989

T . A . De i t ers & I. M u d a w a r �9 O p t i m i z i n g S p r a y Q u e n c h i n g Process
I ~ 276 X
~ E 184
92
0
0
T = 110 C
= 2 3 ~
' V \ V y (c,.) o
x ( c m ) 6 -14
Fig. 13, Measured heat transfer coefficient as a function of position on the hot surface.
spatial variation of the measured heat transfer coef- ficient, h, with the spray field for fixed values of Q, u, d, Ts, and T/. These measurements confirm ear- lier findings by Urbanovich et al. [8] and Reiners et al. [9] concerning the nonuniformity of the heat trans- fer coefficient across the surface and the need for careful mapping of this behavior in predicting tran- sient temperature variations in alloys during quench- ing, forging, or continuous casting.
Figure 14 shows a sample of the heat transfer data required for the CAD software. By selecting different spray nozzles, nozzle pressures, or nozzle-to-surface distances, it is possible to correlate the variation of surface heat flux (from which the convection heat transfer coefficient can be deduced) with respect to each of the primary parameters associated with the quenching process. A universal data base is then gen- erated by combining all these parametric correlations. Since these correlations are based on local measure-
1000
1 0 0
n-
I
i | I , i , f l I , 1 | , , , , ,
(~ (~1/m2) m "If = 23 oC A 1.0x 10 "3 ~ d = 1.8 rnm = 5 . 0 x l f f 3 ud= 1.5m/s o 10.0 x 1ff3
0 , , t t i t i | l t i i i | , i
10 100 1000 T , - T,, oC
]Fig. ] 4 . Measured heat f l ux versus surface superheat for three spray fluxes.
ments, they could then be applied to any type of spray for which the variations of Q, u, and d have been established.
A C K N O W L E D G M E N T
Financial support of this work by a grant from the Computer Integrated Design, Manufacturing and Au- tomation Center (CIDMAC) of Purdue University is gratefully acknowledged. The authors also thank Messrs. Gerry Dail and William Arthur of ALCOA and Mr. Jerry Hagers of Spraying Systems Co. for their technical assistance.
R E F E R E N C E S
1. A.L. Lefebvre, 1988, Atomization and Sprays, Hemi- sphere Pub. Corp., New York.
2. J. Chevier, A. Simon, and G. Beck, 1981, "Optimal Cooling Rate and Process Control in Metallic Parts Heat Treatment," In Heat and Mass Transfer in Metallur- gical Systems, B. Spalding, ed., Hemisphere Pub. Corp., New York.
3. J.K. Brimacombe, P.K. Agarawal, L..A. Baptista, S. Hibbins, and B. Prabhakar, 1980, "Spray Cooling in the Continuous Casting of Steel," 63rd National Open Hearth and Basic Oxygen Steel Conf. Proc., Vol. 63, Washington, DC, pp. 235-252.
4. L. Bolle, and J.C. Moureau, 1976, "Spray Cooling of Hot Surfaces: A Description of the Dispersed Phase and a Parametric Study of Heat Transfer Results," Proc. of Two Phase Flows and Heat Transfer, Vol. UI, NATO Advanced Study Institute, pp. 1327-1346.
5. L. Bolle and J.C. Moureau, 1979, "Experimental Study of Heat Transfer by Spray Cooling," Proc. of Int. Conf. on Heat and Mass Transfer Metallurgical Processes, Dubrovnik, Yugoslavia, pp. 527-534.
6. K. Sasaki, Y. Sugitani, and M. Kawasaki, 1979, "Heat Transfer in Spray Cooling on Hot Surface," Testu-To- Hagane, Vol. 65, pp. 90-96.
7. H. Muller and R. Jeschar, 1973, "Untersuchung des Warmeubergangs an einer simulierten Sekundarkulh-
J. Heat Treating, Vol. 7, No. 1, 1989 �9 17

T . A . Dei ters & I. M u d a w a r �9 O p t i m i z i n g S p r a y Q u e n c h i n g P r o c e s s
zone beim Stronggiessverfahrer," Arch. Eisenhut- tenwes, Vol. 44, pp. 589-594.
8. L.I. Urbanovich, V. Goryainov, V. Sevost'ynov, Y. Boev, V. Niskovskikh, A. Grachev, A. Sevost'yanov, and V. Gur'ev, 1981, "Spray Cooling of High-Tem- perature Metal Surfaces with High Water Pressures," Steel in the USSR, Vol. 11, pp. 184-186.
9. U. Reiners, R. Jeschar, R. Scholz, D. Zebrowski, and
W. Reichelt, 1985, "A Measuring Method for Quick Determination of Local Heat Transfer Coefficients in Spray Cooling Within the Range of Stable Film Boil- ing, ~ Steel Research, Vol. 56, pp. 239-246.
10. E.F. Bratuta and S.F. Kravtsov, 1986, "The Effect of Subcooling of Dispersed Liquid on Critical Heat Flux with Cooling of a Plane Surface," Thermal Engineer- ing, Vol. 33, pp. 674-676.
18 �9 J. Heat Treating, Voi. 7, No. 1, 1989