
Optimization of Minimum Quantity Lubricant … · Optimization of Minimum Quantity Lubricant ... is...
11
applied sciences Article Optimization of Minimum Quantity Lubricant Conditions and Cutting Parameters in Hard Milling of AISI H13 Steel The-Vinh Do and Quang-Cherng Hsu * Department of Mechanical Engineering, National Kaohsiung University of Applied Sciences, 415 Chien Kung Road, Sanmin District, Kaohsiung 80778, Taiwan; [email protected] * Correspondence: [email protected]; Tel.: +886-7-381-4526 (ext. 5338) Academic Editors: Chien-Hung Liu and Huei-Chu Weng Received: 3 January 2016; Accepted: 8 March 2016; Published: 16 March 2016 Abstract: As a successful solution applied to hard machining, the minimum quantity lubricant (MQL) has already been established as an alternative to flood coolant processing. The optimization of MQL parameters and cutting parameters under MQL condition are essential and pressing. The study was divided into two parts. In the first part of this study, the Taguchi method was applied to find the optimal values of MQL condition in the hard milling of AISI H13 with consideration of reduced surface roughness. The L9 orthogonal array, the signal-to-noise (S/N) ratio and analysis of variance (ANOVA) were employed to analyze the effect of the performance characteristics of MQL parameters (i.e., cutting fluid type, pressure, and fluid flow) on good surface finish. In the results section, lubricant and pressure of MQL condition are determined to be the most influential factors which give a statistically significant effect on machined surfaces. A verifiable experiment was conducted to demonstrate the reliability of the results. In the second section, the optimized MQL parameters were applied in a series of experiments to find out cutting parameters of hard milling. The Taguchi method was also used to optimize the cutting parameters in order to obtain the best surface roughness. The design of the experiment (DOE) was implemented by using the L27 orthogonal array. Based on an analysis of the signal-to-noise response and ANOVA, the optimal values of cutting parameters (i.e., cutting speed, feed rate, depth-of-cut and hardness of workpiece) were introduced. The results of the present work indicate feed rate is the factor having the most effect on surface roughness. Keywords: optimization; MQL; hard milling; Taguchi method; ANOVA 1. Introduction Hard machining has been widely applied in mechanical processing due to the many advantages included. The advantages of hard machining were indicated to be geometric accuracy, improved quality of the finished surface, the reduction of the labor expenditures [1] and also a reduction in burr formation, better chip disposal, higher stability, simplified tooling [2] and flexible process design [3,4]. However, hard machining also has its disadvantages, such as high tool wear rate, reduction in tool life due to the effect of high hardness of workpiece material and cutting temperature [2,4]. The application of flood coolant in hard milling has not been satisfied, especially in the matter of environmental and health-related issues regarding workers. As a successful solution applied to hard machining, MQL is an effective, environmentally-friendly solution and has been widely used in the machining processes (i.e., turning, drilling and milling). According to Phafat et al. [5], machining with MQL is a process in which a small amount lubricant utilized at a flow rate less than 250 mL/h is mixed with compressed air and sprayed onto the cutting zone. MQL helps to increase the quality of the surface Appl. Sci. 2016, 6, 83; doi:10.3390/app6030083 www.mdpi.com/journal/applsci
Transcript of Optimization of Minimum Quantity Lubricant … · Optimization of Minimum Quantity Lubricant ... is...
applied sciences
Article
Optimization of Minimum Quantity LubricantConditions and Cutting Parameters in Hard Millingof AISI H13 SteelThe-Vinh Do and Quang-Cherng Hsu *
Department of Mechanical Engineering, National Kaohsiung University of Applied Sciences,415 Chien Kung Road, Sanmin District, Kaohsiung 80778, Taiwan; [email protected]* Correspondence: [email protected]; Tel.: +886-7-381-4526 (ext. 5338)
Academic Editors: Chien-Hung Liu and Huei-Chu WengReceived: 3 January 2016; Accepted: 8 March 2016; Published: 16 March 2016
Abstract: As a successful solution applied to hard machining, the minimum quantity lubricant (MQL)has already been established as an alternative to flood coolant processing. The optimization of MQLparameters and cutting parameters under MQL condition are essential and pressing. The studywas divided into two parts. In the first part of this study, the Taguchi method was applied tofind the optimal values of MQL condition in the hard milling of AISI H13 with consideration ofreduced surface roughness. The L9 orthogonal array, the signal-to-noise (S/N) ratio and analysisof variance (ANOVA) were employed to analyze the effect of the performance characteristics ofMQL parameters (i.e., cutting fluid type, pressure, and fluid flow) on good surface finish. In theresults section, lubricant and pressure of MQL condition are determined to be the most influentialfactors which give a statistically significant effect on machined surfaces. A verifiable experimentwas conducted to demonstrate the reliability of the results. In the second section, the optimizedMQL parameters were applied in a series of experiments to find out cutting parameters of hardmilling. The Taguchi method was also used to optimize the cutting parameters in order to obtainthe best surface roughness. The design of the experiment (DOE) was implemented by using the L27orthogonal array. Based on an analysis of the signal-to-noise response and ANOVA, the optimalvalues of cutting parameters (i.e., cutting speed, feed rate, depth-of-cut and hardness of workpiece)were introduced. The results of the present work indicate feed rate is the factor having the most effecton surface roughness.
Keywords: optimization; MQL; hard milling; Taguchi method; ANOVA
1. Introduction
Hard machining has been widely applied in mechanical processing due to the many advantagesincluded. The advantages of hard machining were indicated to be geometric accuracy, improvedquality of the finished surface, the reduction of the labor expenditures [1] and also a reduction in burrformation, better chip disposal, higher stability, simplified tooling [2] and flexible process design [3,4].However, hard machining also has its disadvantages, such as high tool wear rate, reduction in tool lifedue to the effect of high hardness of workpiece material and cutting temperature [2,4]. The applicationof flood coolant in hard milling has not been satisfied, especially in the matter of environmentaland health-related issues regarding workers. As a successful solution applied to hard machining,MQL is an effective, environmentally-friendly solution and has been widely used in the machiningprocesses (i.e., turning, drilling and milling). According to Phafat et al. [5], machining with MQL is aprocess in which a small amount lubricant utilized at a flow rate less than 250 mL/h is mixed withcompressed air and sprayed onto the cutting zone. MQL helps to increase the quality of the surface
Appl. Sci. 2016, 6, 83; doi:10.3390/app6030083 www.mdpi.com/journal/applsci

Appl. Sci. 2016, 6, 83 2 of 11
finish [6–8], improve tool life, reduce tool wear, decrease cutting temperature and reduce the cost oflubrication [6–12]. The effectiveness of MQL has already been demonstrated in many studies andapplication of turning and milling processes. In machining with MQL, lubricant, air pressure and fluidflow are the main parameters. They will decide the effectiveness of MQL cutting. Applied lubricants inmachining are ubiquitous, such as mineral oil, synthetic esters, fatty alcohols, etc. [8]. Even vegetableoil has been used and proven to be effective in machining [7,8]. Several authors optimized MQLparameters and achieved positive results. Thakur et al. [13] conducted optimization of MQL parametersto get minimum tool wear in the high-speed turning of super-alloy Inconel 718. Simultaneously, thecutting parameters, including cutting speed and feed rate, were also optimized. Nevertheless, theoptimization of MQL parameters does not consist of a cutting fluid being an important factor of MQL.The result showed that the optimal cutting parameters for tool flank wear are lower cutting speed,lower feed rate, higher delivery pressure, higher quantity of lubrication, lower frequency of pulses andan inclined direction of the cutting fluid. In the study of Gandhe et al. [14], experiments were carriedout to optimize the MQL parameters in the turning of EN-8 steel. It showed that the cutting fluid usedis the most significant factor affecting tool wear. J. Barnabas et al. [15] have done a comparative analysisof particle swarm optimization and simulated annealing algorithm in the optimization of the MQLparameters for flank tool wear. The author presented a simulated annealing algorithm technique thatis comparatively better than other techniques in use. However, the studies conducted on the effectsand optimization of the parameters in MQL, such as flow rate, air pressure and type of lubricant used,still remain open.
Surface roughness is an important index used to estimate product quality in mechanical products.The parameters that influence surface roughness include cutting tool properties (i.e., tool material, toolshape, run-out error, nose radius), workpiece properties (i.e., workpiece diameter, workpiece hardness,workpiece length), cutting phenomena (i.e., acceleration, vibrations, chip formation, friction in thecutting zone, cutting force variation) and machining parameters (i.e., process kinematics, cooling fluid,step over, tool angle, depth-of-cut, feed rate, cutting speed) [16]. In any machining process, the primarykey point for insuring the quality of the manufacturing processes is the selection of suitable cuttingparameters for the corresponding material of the workpieces. With a designed experiments approach,the Taguchi technique for the design of experimentation is a method extensively used in optimizingthe cutting parameters and predicting surface roughness. There has been some notable researchproduced related to the effects of cutting parameters on surface roughness in which the Taguchimethod was applied. Ahmet et al. [17], Ilhan et al. [18] applied the Taguchi method to optimizing thetuning parameters in hard turning. The authors concluded that feed rate contributes mostly to surfaceroughness. The Taguchi method and ANOVA were also employed in the study of Gopalsamy et al. [19].The authors found optimum process parameters during hard machining of hardened steel. In theresults of this research, the cutting speed is the most influential factor on surface roughness. The AISIH13 steel selected in this study constituted a workpiece material which has been widely used inmanufacturing, especially in high pressure die-casting and extrusion molding, cutting blades, andhot dies due to good toughness levels and resistance to abrasion. AISI H13 steel has been studied inmany types of research. Ding et al. [20] used the Taguchi method and ANOVA to establish and analyzean empirical model for establishing surface roughness. This model indicates a relationship betweensurface roughness and four factors of cutting parameters: cutting speed, feed, radial depth of cut,and the axial depth of cut. The results showed that axial depth of cut is the main influential factor onsurface roughness. In the research of Outeiro [21], the DOE method in Taguchi was used to designthe experiment. The model of the residual stress and the optimization of cutting parameters wasestablished by applying Artificial Neural Network (ANN) and a Genetic Algorithm (GA). The resultsindicated that the cutting parameters, which cause lower residual stress and contribute to better surfaceroughness. Ghani et al. [22] concluded that high cutting speed, low feed rate and lower depth of cutprovided the best results for surface roughness in machining hardened steel AISI H13.
Appl. Sci. 2016, 6, 83 3 of 11
In the present study, the Taguchi method and ANOVA were applied to optimize MQL conditionsfor surface roughness. The best cutting parameters of hard milling of AISI H13, such as cuttingspeed, feed rate, depth-of-cut, and hardness of workpiece were found out in order to get the bettersurface roughness under MQL conditions optimized. A regression model for surface roughness wastherefore established.
2. Optimization of MQL Parameters
2.1. Experimental Procedure
In the first part of the research, the air pressure, the fluid flow, and a different lubricant of MQLconditions were optimized to obtain improved cutting performances in the hard milling process withconsideration of surface roughness.
The Taguchi method is widely used because it is a simple and robust method used tooptimize the parameters of the process involving a significant reduction in cost and processingtime [23]. In the experimental design, the Taguchi method uses the orthogonal arrays to obtainthe best results with a minimum number of experiments. A signal to noise (S/N) ratio is used tomeasure the performance characteristics and to calculate the percent contribution of each processparameter by analysis of variance. The S/N ratio represents the amount of variation present in thequality characteristic in which the term S represents the mean value for the output characteristic,and the N represents the undesirable value for the output characteristic. The analysis of theS/N ratio could be classified into 3 types: the-bigger-is-the-better, the-smaller-is-the-better, andthe-nominal-is-the-better [23,24]. Thus, the appropriate type is selected for each specific case.The purpose of this study is to optimize the parameters of the MQL condition to get the bettersurface roughness available. Therefore, the-smaller-is-the-better type was selected. It is calculatedaccording to the following formula:
SN“ ´10log
1np
nÿ
i“1
y2i q (1)
where: yi is the observed data, n is the number of experiments which are repeated.With three parameters at three levels, Taguchi1s L9 orthogonal array was used to organize the
experiments. The parameters with three levels of the MQL as the fluid flow, pressure, and lubricant areshown in Table 1. The lubricant factor includes straight cutting oil, vegetable oil, and water-soluble oil.Straight cutting oil and water soluble oil have been proved highly effective in industrial production.Vegetable oil has been used and proven to be effective in a number of recent studies [7,8]. The airpressure factor includes 3, 4, 5 kg/cm2. This range has been commonly applied in industry. The rangeof fluid flow factor is from 10 to 50 mL/h. The selected range of fluid flow is near dry condition.The milling process information is shown in Table 2. The details of the milling tool are given in Table 3.
Table 1. Parameters and levels.
Parameters Level 1 Level 2 Level 3
Lubricant Straight Cutting Oil Vegetable Oil Water-Soluble OilFluid flow (mL/h) 10 30 50Pressure (kg/cm2) 3 4 5

Appl. Sci. 2016, 6, 83 4 of 11
Table 2. Milling process information.
Item Description
Machining Operation Slot MillingMachine tool CNC 3 axis vertical
Tool Φ10 TiAlN coated end millWorkpiece AISI H13 steel 50HRC hardnessMQL spray MC 1700 of Noga
Surf-test instrument Model SJ–401 of MitutoyoCutting parameters v = 55 m/min, f = 0.02 mm/tooth, d = 0.6 mm
CAD/CAM software Mastercam X
Table 3. Technical information of milling tool.
Geometrical Parameters Description
Overall length (mm) 75Cutting length (mm) 25Shank diameter (mm) 10Tool diameter (mm) 10
Number of flutes 4Helix angle (˝) 35
Axial rake angle (˝) 12
The milling process of the AISI H13 steel was performed by a Victor V-Center-4 Vertical MachiningCenter (Victor Taichung Machinery Works Co., Ltd., Taichung, Taiwan). The hardness of the workpieceis 50 HRC. The tool used is a φ10 TiAlN coated end mill of the CMTec Company (Tainan, Taiwan).All the tests were conducted under a cutting condition fixed as cutting speed v = 55 m/min, feedrate f = 0.02 mm/tooth and depth of cut d = 0.6 mm. The cutting parameters were selected basedon workpiece material, tool material, hardness of workpiece, and the CMTec cutting tool company1srecommendation. The NC code was created for the CNC machine by use of Mastercam X software(Version 10, CNC Software, Inc., Tolland, CT, USA, 2005). The details of the experiment performedwith a nozzle position in relief face of the tool as fixed for all experiments is illustrated in Figure 1.This position has high lubrication performance due to the lubricant1s facile penetration of thecutting zone.
Appl. Sci. 2016, 6, 83 4 of 11
MQL spray MC 1700 of Noga
Surf‐test instrument Model SJ–401 of Mitutoyo
Cutting parameters v = 55 m/min, f = 0.02 mm/tooth, d = 0.6 mm
CAD/CAM software Mastercam X
Table 3. Technical information of milling tool.
Geometrical Parameters Description
Overall length (mm) 75
Cutting length (mm) 25
Shank diameter (mm) 10
Tool diameter (mm) 10
Number of flutes 4
Helix angle (°) 35
Axial rake angle (°) 12
The milling process of the AISI H13 steel was performed by a Victor V‐Center‐4 Vertical
Machining Center (Victor Taichung Machinery Works Co., Ltd., Taichung, Taiwan). The hardness of
the workpiece is 50 HRC. The tool used is a ϕ10 TiAlN coated end mill of the CMTec Company
(Tainan, Taiwan). All the tests were conducted under a cutting condition fixed as cutting speed v =
55 m/min, feed rate f = 0.02 mm/tooth and depth of cut d = 0.6 mm. The cutting parameters were
selected based on workpiece material, tool material, hardness of workpiece, and the CMTec cutting
tool company′s recommendation. The NC code was created for the CNC machine by use of
Mastercam X software (Version 10, CNC Software, Inc., Tolland, CT, USA, 2005). The details of the
experiment performed with a nozzle position in relief face of the tool as fixed for all experiments is
illustrated in Figure 1. This position has high lubrication performance due to the lubricant′s facile
penetration of the cutting zone.
Figure 1. Experimental set‐up with a fixed position of the minimum quantity lubricant (MQL) nozzle.
The surface roughness was measured by use of the SJ‐401 surf‐test instrument manufactured by
the Mitutoyo Corporation (Kawasaki, Japan). This device allows the measurement of Ra (Based on
the ISO standard, surface roughness average Ra was calculated as the arithmetic average of the
absolute values of roughness profile). The MQL spray attached to the CNC machine is applied by
the MC 1700 cooling system manufactured by the Noga Engineering Ltd. (Shlomi, Israel). Each
experiment was repeated five times to reduce the possibility for experimental error to occur.
2.2. Results and Discussion
An analysis was carried out to determine the effect of MQL parameters (i.e., fluid flow,
pressure, and lubricant) on surface roughness. The statistical analysis was performed by using
Minitab software, Version 16, (Minitab, Inc., Philadelphia, PA, USA, 2010). The S/N ratio obtained
from Equation (1) and the result of Ra is shown in Table 4. The three factors observed were lubricant,
fluid flow, and pressure, respectively. Three levels of each factor were represented by “1”, “2”, and “3”.
Figure 1. Experimental set-up with a fixed position of the minimum quantity lubricant (MQL) nozzle.
The surface roughness was measured by use of the SJ-401 surf-test instrument manufactured bythe Mitutoyo Corporation (Kawasaki, Japan). This device allows the measurement of Ra (Based on theISO standard, surface roughness average Ra was calculated as the arithmetic average of the absolutevalues of roughness profile). The MQL spray attached to the CNC machine is applied by the MC 1700cooling system manufactured by the Noga Engineering Ltd. (Shlomi, Israel). Each experiment wasrepeated five times to reduce the possibility for experimental error to occur.

Appl. Sci. 2016, 6, 83 5 of 11
2.2. Results and Discussion
An analysis was carried out to determine the effect of MQL parameters (i.e., fluid flow, pressure,and lubricant) on surface roughness. The statistical analysis was performed by using Minitab software,Version 16, (Minitab, Inc., Philadelphia, PA, USA, 2010). The S/N ratio obtained from Equation (1) andthe result of Ra is shown in Table 4. The three factors observed were lubricant, fluid flow, and pressure,respectively. Three levels of each factor were represented by “1”, “2”, and “3”.
Table 4. The surface roughness result and S/N ratio.
Experiment Number Lubricant Fluid Flow Pressure Ra (µm) S/N Ratio
1 1 1 1 0.332 9.5772 1 2 2 0.355 8.9953 1 3 3 0.456 6.8214 2 1 2 0.351 9.0945 2 2 3 0.447 6.9946 2 3 1 0.289 10.7827 3 1 3 0.376 8.4968 3 2 1 0.239 12.4329 3 3 2 0.252 11.972
The mean of S/N response for surface roughness of each level of parameters is shown in Table 5.Table 5 shows that the third level of lubricant, the third level of fluid flow, and the first level of pressureare ranked highest. Consequently, optimal MQL conditions for the experiment will be (3-3-1). The rankmeans that pressure is the most influential factor to surface roughness and the second influential factoris the lubricant introduced.
Table 5. Mean of S/N response for surface roughness.
Level Lubricant Fluid Flow Pressure
1 8.464 9.056 10.9302 8.957 9.474 10.0203 10.967 9.858 7.437
Delta 2.502 0.802 3.494Rank 2 3 1
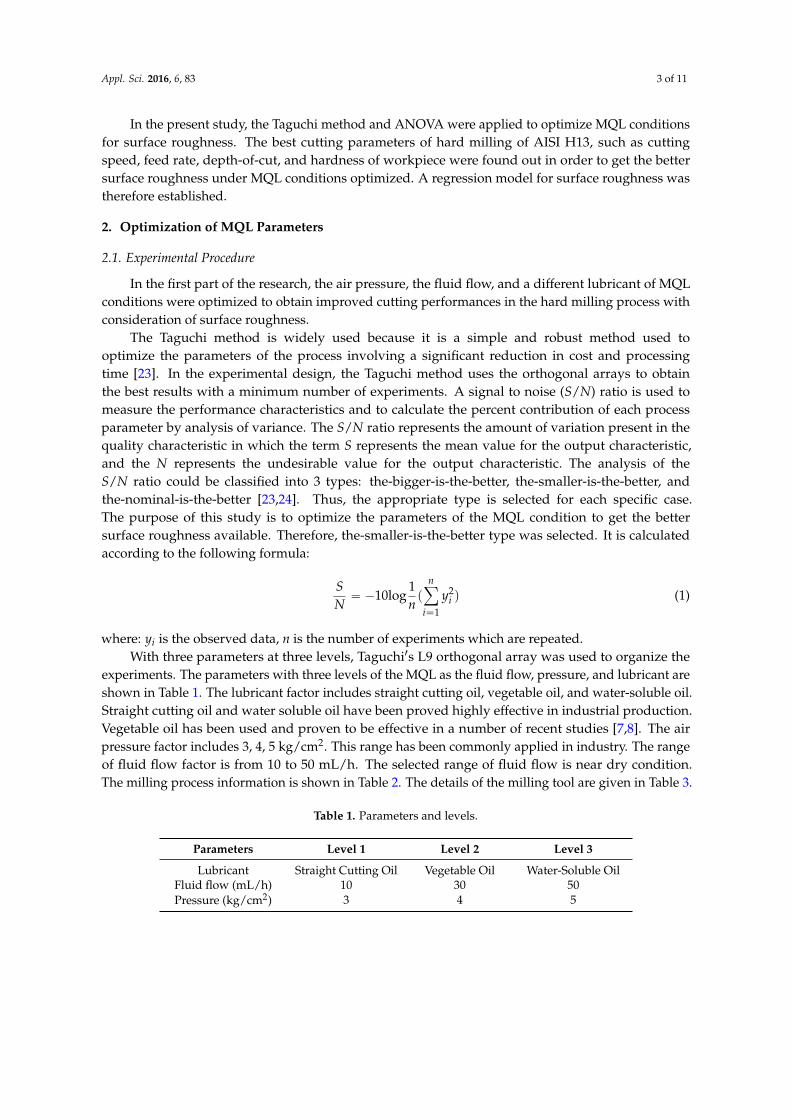
Figure 2 indicated the S/N response graph. From the S/N response analysis, in order to get thebest Ra, the optimum MQL parameters were water soluble oil used for the lubricant, 50 mL/h forthe flow rate, and 3 kg/cm2 for the pressure. This result in the study is reasonably close to those inthe related researches about optimization of MQL conditions to reduce tool wear such as the studyof Thakur et al. [13] and the study of Gandhe et al. [14]. Water soluble oil is considered to be the bestlubricant available due to the inclusion of its non-flammable, good cooling, low viscosity and adequatewetting qualities. The flow rate of 50 mL/h and the pressure of 3 kg/cm2 are suitable to mix lubricantand compressed air. Under this condition, an appropriate amount of mixture is sprayed into thecutting zone.
Appl. Sci. 2016, 6, 83 6 of 11
Appl. Sci. 2016, 6, 83 5 of 11
The mean of S/N response for surface roughness of each level of parameters is shown in
Table 5. Table 5 shows that the third level of lubricant, the third level of fluid flow, and the first level
of pressure are ranked highest. Consequently, optimal MQL conditions for the experiment will be
(3‐3‐1). The rank means that pressure is the most influential factor to surface roughness and the
second influential factor is the lubricant introduced.
Table 4. The surface roughness result and S/N ratio.
Experiment Number Lubricant Fluid Flow Pressure Ra (μm) S/N Ratio
1 1 1 1 0.332 9.577
2 1 2 2 0.355 8.995
3 1 3 3 0.456 6.821
4 2 1 2 0.351 9.094
5 2 2 3 0.447 6.994
6 2 3 1 0.289 10.782
7 3 1 3 0.376 8.496
8 3 2 1 0.239 12.432
9 3 3 2 0.252 11.972
Table 5. Mean of S/N response for surface roughness.
Level Lubricant Fluid Flow Pressure
1 8.464 9.056 10.930
2 8.957 9.474 10.020
3 10.967 9.858 7.437
Delta 2.502 0.802 3.494
Rank 2 3 1
Figure 2 indicated the S/N response graph. From the S/N response analysis, in order to get the
best Ra, the optimum MQL parameters were water soluble oil used for the lubricant, 50 mL/h for the
flow rate, and 3 kg/cm2 for the pressure. This result in the study is reasonably close to those in the
related researches about optimization of MQL conditions to reduce tool wear such as the study of
Thakur et al. [13] and the study of Gandhe et al. [14]. Water soluble oil is considered to be the best
lubricant available due to the inclusion of its non‐flammable, good cooling, low viscosity and
adequate wetting qualities. The flow rate of 50 mL/h and the pressure of 3 kg/cm2 are suitable to mix
lubricant and compressed air. Under this condition, an appropriate amount of mixture is sprayed
into the cutting zone.
Figure 2. The effect of MQL parameters on surface roughness. Figure 2. The effect of MQL parameters on surface roughness.
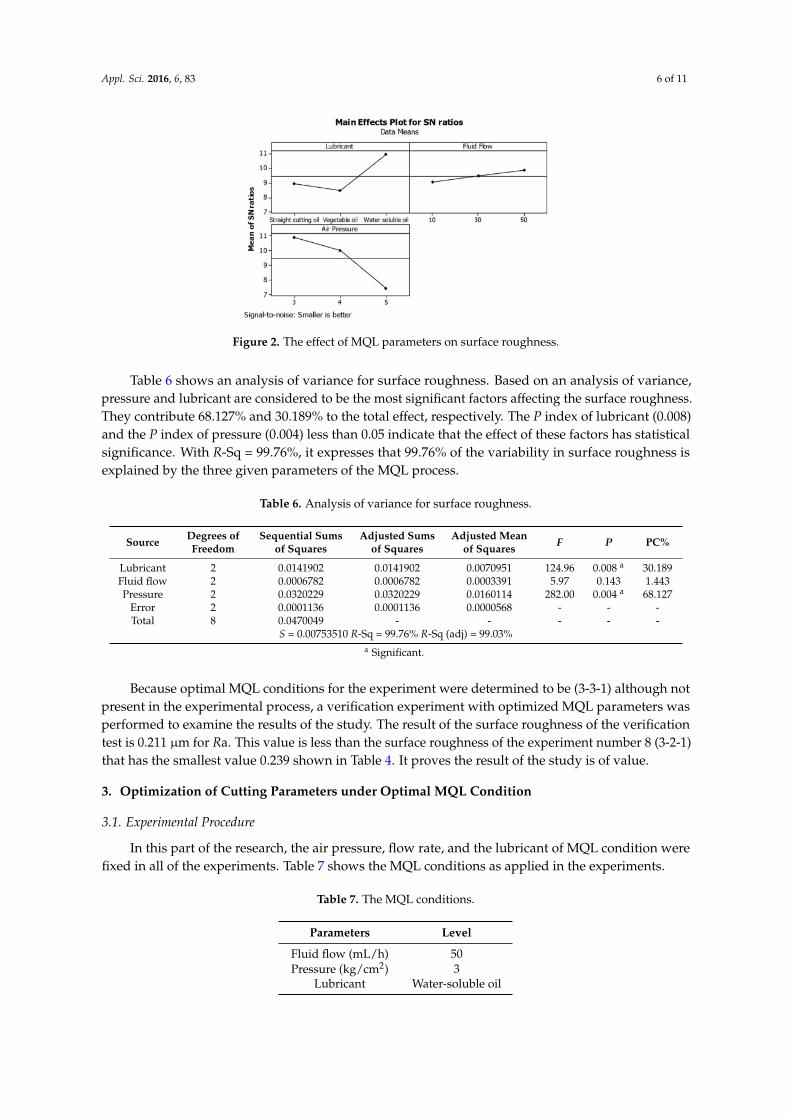
Table 6 shows an analysis of variance for surface roughness. Based on an analysis of variance,pressure and lubricant are considered to be the most significant factors affecting the surface roughness.They contribute 68.127% and 30.189% to the total effect, respectively. The P index of lubricant (0.008)and the P index of pressure (0.004) less than 0.05 indicate that the effect of these factors has statisticalsignificance. With R-Sq = 99.76%, it expresses that 99.76% of the variability in surface roughness isexplained by the three given parameters of the MQL process.
Table 6. Analysis of variance for surface roughness.
Source Degrees ofFreedom
Sequential Sumsof Squares
Adjusted Sumsof Squares
Adjusted Meanof Squares F P PC%
Lubricant 2 0.0141902 0.0141902 0.0070951 124.96 0.008 a 30.189Fluid flow 2 0.0006782 0.0006782 0.0003391 5.97 0.143 1.443Pressure 2 0.0320229 0.0320229 0.0160114 282.00 0.004 a 68.127
Error 2 0.0001136 0.0001136 0.0000568 - - -Total 8 0.0470049 - - - - -
S = 0.00753510 R-Sq = 99.76% R-Sq (adj) = 99.03%a Significant.
Because optimal MQL conditions for the experiment were determined to be (3-3-1) although notpresent in the experimental process, a verification experiment with optimized MQL parameters wasperformed to examine the results of the study. The result of the surface roughness of the verificationtest is 0.211 µm for Ra. This value is less than the surface roughness of the experiment number 8 (3-2-1)that has the smallest value 0.239 shown in Table 4. It proves the result of the study is of value.
3. Optimization of Cutting Parameters under Optimal MQL Condition
3.1. Experimental Procedure
In this part of the research, the air pressure, flow rate, and the lubricant of MQL condition werefixed in all of the experiments. Table 7 shows the MQL conditions as applied in the experiments.
Table 7. The MQL conditions.
Parameters Level
Fluid flow (mL/h) 50Pressure (kg/cm2) 3
Lubricant Water-soluble oil
Appl. Sci. 2016, 6, 83 7 of 11
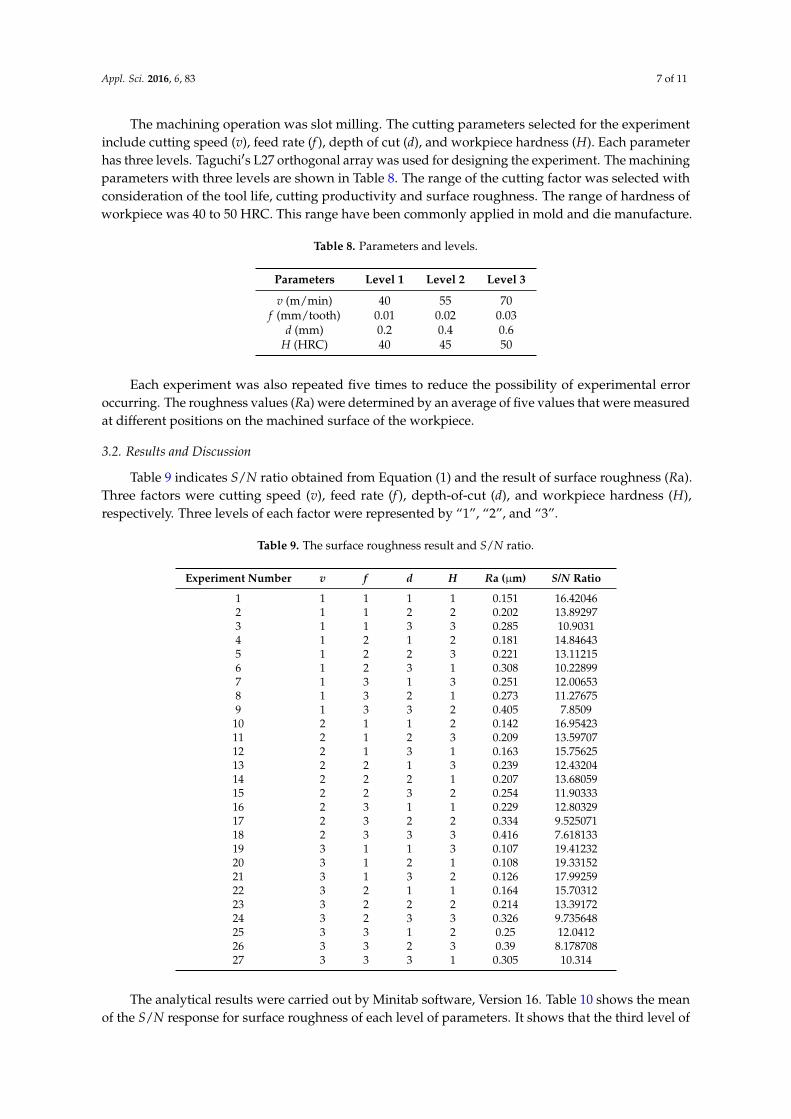
The machining operation was slot milling. The cutting parameters selected for the experimentinclude cutting speed (v), feed rate (f ), depth of cut (d), and workpiece hardness (H). Each parameterhas three levels. Taguchi1s L27 orthogonal array was used for designing the experiment. The machiningparameters with three levels are shown in Table 8. The range of the cutting factor was selected withconsideration of the tool life, cutting productivity and surface roughness. The range of hardness ofworkpiece was 40 to 50 HRC. This range have been commonly applied in mold and die manufacture.
Table 8. Parameters and levels.
Parameters Level 1 Level 2 Level 3
v (m/min) 40 55 70f (mm/tooth) 0.01 0.02 0.03
d (mm) 0.2 0.4 0.6H (HRC) 40 45 50
Each experiment was also repeated five times to reduce the possibility of experimental erroroccurring. The roughness values (Ra) were determined by an average of five values that were measuredat different positions on the machined surface of the workpiece.
3.2. Results and Discussion
Table 9 indicates S/N ratio obtained from Equation (1) and the result of surface roughness (Ra).Three factors were cutting speed (v), feed rate (f ), depth-of-cut (d), and workpiece hardness (H),respectively. Three levels of each factor were represented by “1”, “2”, and “3”.
Table 9. The surface roughness result and S/N ratio.
Experiment Number v f d H Ra (µm) S/N Ratio
1 1 1 1 1 0.151 16.420462 1 1 2 2 0.202 13.892973 1 1 3 3 0.285 10.90314 1 2 1 2 0.181 14.846435 1 2 2 3 0.221 13.112156 1 2 3 1 0.308 10.228997 1 3 1 3 0.251 12.006538 1 3 2 1 0.273 11.276759 1 3 3 2 0.405 7.8509
10 2 1 1 2 0.142 16.9542311 2 1 2 3 0.209 13.5970712 2 1 3 1 0.163 15.7562513 2 2 1 3 0.239 12.4320414 2 2 2 1 0.207 13.6805915 2 2 3 2 0.254 11.9033316 2 3 1 1 0.229 12.8032917 2 3 2 2 0.334 9.52507118 2 3 3 3 0.416 7.61813319 3 1 1 3 0.107 19.4123220 3 1 2 1 0.108 19.3315221 3 1 3 2 0.126 17.9925922 3 2 1 1 0.164 15.7031223 3 2 2 2 0.214 13.3917224 3 2 3 3 0.326 9.73564825 3 3 1 2 0.25 12.041226 3 3 2 3 0.39 8.17870827 3 3 3 1 0.305 10.314
The analytical results were carried out by Minitab software, Version 16. Table 10 shows the meanof the S/N response for surface roughness of each level of parameters. It shows that the third level of

Appl. Sci. 2016, 6, 83 8 of 11
cutting speed, the first level of feed rate, the first level of depth of cut, and the first level of hardnessare highest. Therefore, under the MQL condition, optimal cutting conditions for the experiment willbe (3-1-1-1). The ranking means that feed rate is the most influential factor to surface roughness andthe second most influential factor is the depth-of-cut.
Table 10. Mean of S/N response for surface roughness.
Level v f d H
1 12.28 16.03 14.74 13.952 12.70 12.78 12.89 13.163 14.01 10.18 11.37 11.89
Delta 1.73 5.85 3.37 2.06Rank 4 1 2 3
Figure 3 indicated the S/N response graph for surface roughness. The analytical results of the S/Nresponse express that, in order to get the best Ra, the optimum cutting parameters are 70 m/min forthe cutting speed, 0.01 mm/tooth for the feed rate, 0.2 mm in depth of cut, and 40 HRC for workpiecehardness. Generally, a higher cutting speed, lower feed rate, lower depth of cut, and lower workpiecehardness will lead to good surface roughness under an MQL condition. This result is consistent to theconclusions of Ghani et al. [22] although the study of Ghani et al. was conducted in dry conditions.
Appl. Sci. 2016, 6, 83 8 of 11
Figure 3 indicated the S/N response graph for surface roughness. The analytical results of the
S/N response express that, in order to get the best Ra, the optimum cutting parameters are 70 m/min
for the cutting speed, 0.01 mm/tooth for the feed rate, 0.2 mm in depth of cut, and 40 HRC for
workpiece hardness. Generally, a higher cutting speed, lower feed rate, lower depth of cut, and
lower workpiece hardness will lead to good surface roughness under an MQL condition. This result
is consistent to the conclusions of Ghani et al. [22] although the study of Ghani et al. was conducted in
dry conditions.
Table 10. Mean of S/N response for surface roughness.
Level v f d H
1 12.28 16.03 14.74 13.95
2 12.70 12.78 12.89 13.16
3 14.01 10.18 11.37 11.89
Delta 1.73 5.85 3.37 2.06
Rank 4 1 2 3
Figure 3. The effect of cutting parameters on surface roughness.
An analysis of variance for surface roughness is shown in Table 11. Based on analysis of
variance, feed rate and depth‐of‐cut are the most influential factors regarding surface roughness.
They contribute 55.067% and 18.244% to the total effect, respectively. The P index of feed rate (0.000),
the P index of depth of cut (0.001), and the P index of workpiece hardness (0.03) less than 0.05
indicate that the effect of these factors has statistical significance.
Table 11. Analysis of variance for surface roughness.
Source
Degrees
of
Freedom
Sequential
Sums of
Squares
Adjusted
Sums of
Squares
Adjusted
Mean of
Squares
F P PC%
v 2 14.67 14.67 7.335 3.23 0.063 5.225
f 2 154.60 154.60 77.301 34.05 0.000 a 55.067
d 2 51.22 51.22 25.611 11.28 0.001 a 18.244
H 2 19.39 19.39 9.697 4.27 0.03 a 6.907
Error 18 40.86 40.86 2.27 ‐ ‐ ‐
Total 26 280.75 ‐ ‐ ‐ ‐ ‐ a Significant.
Because optimal MQL conditions for the experiment were determined to be (3‐1‐1‐1) although
not present in the experimental process, a verification experiment with optimized MQL parameters
was performed to examine the results of the study. The result of surface roughness of the verification
Figure 3. The effect of cutting parameters on surface roughness.
An analysis of variance for surface roughness is shown in Table 11. Based on analysis of variance,feed rate and depth-of-cut are the most influential factors regarding surface roughness. They contribute55.067% and 18.244% to the total effect, respectively. The P index of feed rate (0.000), the P index ofdepth of cut (0.001), and the P index of workpiece hardness (0.03) less than 0.05 indicate that the effectof these factors has statistical significance.
Table 11. Analysis of variance for surface roughness.
Source Degrees ofFreedom
Sequential Sumsof Squares
Adjusted Sumsof Squares
Adjusted Meanof Squares F P PC%
v 2 14.67 14.67 7.335 3.23 0.063 5.225f 2 154.60 154.60 77.301 34.05 0.000 a 55.067d 2 51.22 51.22 25.611 11.28 0.001 a 18.244H 2 19.39 19.39 9.697 4.27 0.03 a 6.907
Error 18 40.86 40.86 2.27 - - -Total 26 280.75 - - - - -
a Significant.
Appl. Sci. 2016, 6, 83 9 of 11
Because optimal MQL conditions for the experiment were determined to be (3-1-1-1) although notpresent in the experimental process, a verification experiment with optimized MQL parameters wasperformed to examine the results of the study. The result of surface roughness of the verification test is0.098 µm for Ra. The verification experiment is still conducted under MQL conditions. This value isless than the surface roughness of the experiment number 19 (3-1-1-3) that has the smallest value 0.107shown in Table 9. It proves that the result of the study is of value.
According to the analytical procedure employed, the linear regression model for prediction ofsurface roughness under MQL condition is obtained as follows:
Ra-mql “ ´0.2185´ 0.00106296v ` 7.55556f ` 0.242778d ` 0.00595556H (2)
where: Ra-mql is surface roughness under MQL conditions. v, f, d, and H are cutting speed, feed rate,depth-of-cut, and workpiece hardness, respectively.
Table 12 shows an analysis of variance for the linear regression model. It identifies that feed rateand depth of cut are the most influential factors related to surface roughness in the linear regressionmodel. The P values (<0.05) feed rate, depth-of-cut, and workpiece hardness mean that the effect ofthese factors has statistical significance. When the P value of the model is less than 0.05, the linearregression model is considered to be statistically significant. With R-Sq = 85.09%, it expresses that85.09% of the variability in surface roughness is explained by the factors of cutting conditions.
Table 12. Analysis of variance for the linear regression model.
Source Degrees ofFreedom
Sequential Sumsof Squares
Adjusted Sumsof Squares
Adjusted Meanof Squares F P PC%
Regression 4 0.165730 0.165730 0.041433 31.3870 0.000 a -v 1 0.004576 0.004576 0.004576 3.4666 0.076 2.349f 1 0.102756 0.102756 0.102756 77.8421 0.000 a 52.757d 1 0.042438 0.042438 0.042438 32.1484 0.000 a 21.789H 1 0.015961 0.015961 0.015961 12.0911 0.002 a 8.195
Error 22 0.029041 0.029041 0.001320 - - -Total 26 0.194771 - - - - -
S = 0.0363325 R-Sq = 85.09% R-Sq(adj) = 82.38%a Significant.
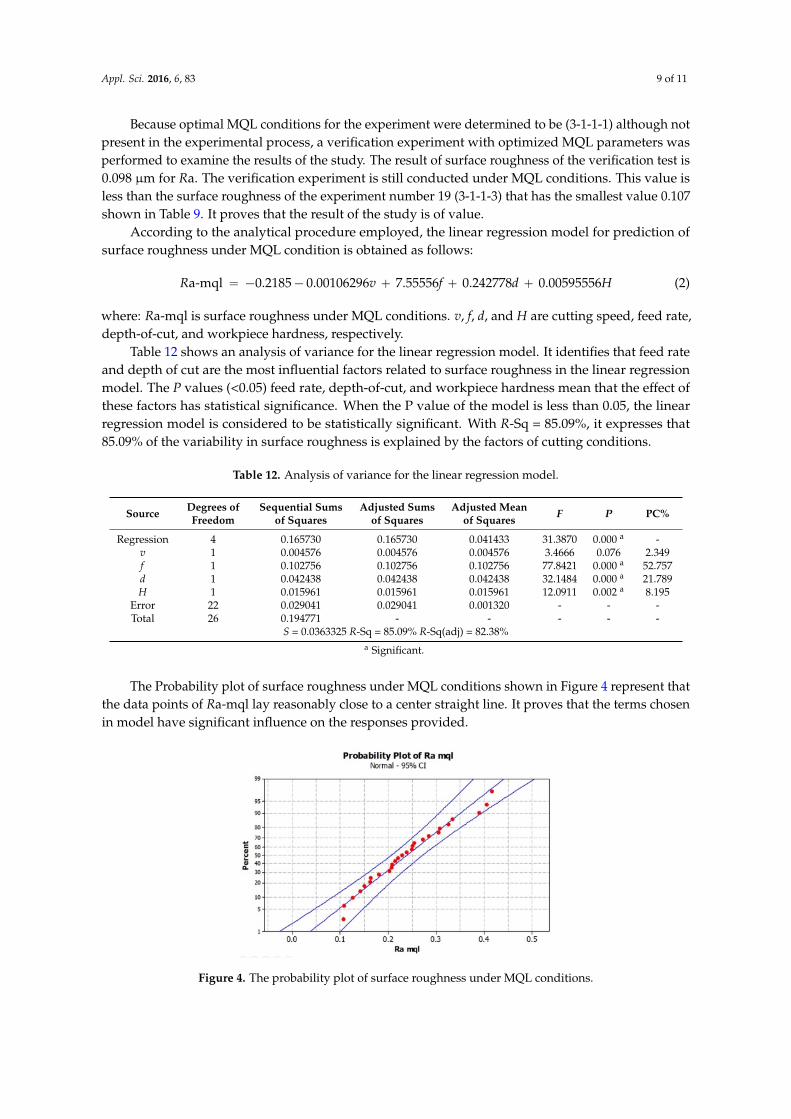
The Probability plot of surface roughness under MQL conditions shown in Figure 4 represent thatthe data points of Ra-mql lay reasonably close to a center straight line. It proves that the terms chosenin model have significant influence on the responses provided.
Appl. Sci. 2016, 6, 83 9 of 11
test is 0.098 μm for Ra. The verification experiment is still conducted under MQL conditions. This
value is less than the surface roughness of the experiment number 19 (3‐1‐1‐3) that has the smallest
value 0.107 shown in Table 9. It proves that the result of the study is of value.
According to the analytical procedure employed, the linear regression model for prediction of
surface roughness under MQL condition is obtained as follows:
Ra‐mql = −0.2185 − 0.00106296v + 7.55556f + 0.242778d + 0.00595556H (2)
where: Ra‐mql is surface roughness under MQL conditions. v, f, d, and H are cutting speed, feed rate,
depth‐of‐cut, and workpiece hardness, respectively.
Table 12 shows an analysis of variance for the linear regression model. It identifies that feed rate
and depth of cut are the most influential factors related to surface roughness in the linear regression
model. The P values (<0.05) feed rate, depth‐of‐cut, and workpiece hardness mean that the effect of
these factors has statistical significance. When the P value of the model is less than 0.05, the linear
regression model is considered to be statistically significant. With R‐Sq = 85.09%, it expresses that
85.09% of the variability in surface roughness is explained by the factors of cutting conditions.
Table 12. Analysis of variance for the linear regression model.
Source
Degrees
of
Freedom
Sequential
Sums of
Squares
Adjusted
Sums of
Squares
Adjusted
Mean of
Squares
F P PC%
Regression 4 0.165730 0.165730 0.041433 31.3870 0.000 a ‐
v 1 0.004576 0.004576 0.004576 3.4666 0.076 2.349
f 1 0.102756 0.102756 0.102756 77.8421 0.000 a 52.757
d 1 0.042438 0.042438 0.042438 32.1484 0.000 a 21.789
H 1 0.015961 0.015961 0.015961 12.0911 0.002 a 8.195
Error 22 0.029041 0.029041 0.001320 ‐ ‐ ‐
Total 26 0.194771 ‐ ‐ ‐ ‐ ‐
S = 0.0363325 R‐Sq = 85.09% R‐Sq(adj) = 82.38% a Significant.
The Probability plot of surface roughness under MQL conditions shown in Figure 4 represent
that the data points of Ra‐mql lay reasonably close to a center straight line. It proves that the terms
chosen in model have significant influence on the responses provided.
Figure 4. The probability plot of surface roughness under MQL conditions.
A series validation experiments were carried out to examine the accuracy of the linear
regression model. The validation experiment is different from the initial experiment. The result of
validation experiments is shown in the Table 13.
Figure 4. The probability plot of surface roughness under MQL conditions.

Appl. Sci. 2016, 6, 83 10 of 11
A series validation experiments were carried out to examine the accuracy of the linear regressionmodel. The validation experiment is different from the initial experiment. The result of validationexperiments is shown in the Table 13.
Table 13. The result of validation experiments.
ExperimentNumber
v f d H Ra of theExperiment
Ra of theModel
PercentageDifference
(m/min) (mm/Tooth) (mm) (HRC) (µm) (µm) (%)
1 40 0.03 0.6 50 0.428 0.409 4.62 50 0.02 0.2 40 0.152 0.166 8.43 55 0.02 0.4 45 0.226 0.239 5.44 60 0.01 0.3 45 0.145 0.134 8.25 70 0.03 0.5 50 0.383 0.352 8.8
Comparing the surface roughness of the experiment and surface roughness of the model, thepercentage differences are less than 10%. It proved that the accuracy of the model is of value.
4. Conclusions
In this study, the Taguchi method and ANOVA were applied to optimize MQL conditions forsurface roughness. The best cutting parameters of hard milling of AISI H13 determined as cuttingspeed, feed rate, depth of cut, and hardness of workpiece were obtained in order to get improve thesurface roughness under MQL conditions1 optimization. A regression model for surface roughnesswas established. The results of the study are as follows:
1. In MQL conditions, the water-soluble oil lubricant, the 50 mL/h fluid flow and the 3 kg/cm2
pressures provided the best results for surface roughness in hard-milling of SKD 61.2. Lubricant and pressure are two factors most affecting the surface roughness. The pressure factor
contributed 68.127% and the lubricant factor contributed 30.189% of the total effect. The effect ofthem carried statistical significance. The three parameters of MQL conditions explained 99.76%of variability in surface roughness.
3. Under MQL conditions, the optimum cutting parameters are 70 m/min for the cutting speed,0.01 mm/tooth for the feed rate, 0.2 mm in depth of cut, and 40 HRC for workpiece hardness.Generally, higher cutting speed, lower feed rate, lower depth of cut, and lower workpiecehardness lead to good surface roughness under the MQL condition.
4. Feed rate and depth of cut are the most influential factors related to surface roughness in thelinear regression model. The effect of these factors (i.e., feed rate, depth-of-cut, and workpiecehardness) have statistical significance.
5. The linear regression model is considered to be statistically significant. The four parameters ofcutting conditions explained 85.09% of variability in surface roughness.
Acknowledgments: The author would like to thank Wei-Lin Chen, Wen-Hsiung Li and Jhan-Hong Ye in Precisionand Nano Engineering Laboratory, Department of Mechanical Engineering (ME) at the National KaohsiungUniversity of Applied Sciences (KUAS) for their important helping and useful discussion in the experiments ofthe study.
Author Contributions: The-Vinh Do conducted the theoretical analysis and experiments and prepared themanuscript. Quang-Cherng Hsu provided the guidance and improved the quality of the work.
Conflicts of Interest: The authors declare no conflict of interest.
References
1. Lobanov, A. Technological advantages of hard milling. Russ. Eng. Res. 2007, 27, 396–397. [CrossRef]2. Schulz, H.; Moriwaki, T. High-speed machining. CIRP Ann. Manuf. Technol. 1992, 41, 637–643. [CrossRef]

Appl. Sci. 2016, 6, 83 11 of 11
3. An, Q.; Wang, C.; Xu, J.; Liu, P.; Chen, M. Experimental investigation on hard milling of high strength steelusing PVD-AlTiN coated cemented carbide tool. Int. J. Refract. Met. Hard Mater. 2014, 43, 94–101. [CrossRef]
4. Denkena, B.; Köhler, J.; Bergmann, B. Development of cutting edge geometries for hard milling operations.CIRP J. Manuf. Sci. Technol. 2015, 8, 43–52. [CrossRef]
5. Phafat, N.G.; Deshmukh, R.R.; Deshmukh, S.D. Study of Cutting Parameters Effects in MQL-EmployedHard-Milling Process for AISI H13 for Tool Life. In Applied Mechanics and Materials; Trans Tech Publ.: Zurich,Switzerland, 2013; pp. 240–245.
6. Dhar, N.; Kamruzzaman, M.; Ahmed, M. Effect of minimum quantity lubrication (MQL) on tool wear andsurface roughness in turning AISI-4340 steel. J. Mater. Process. Technol. 2006, 172, 299–304. [CrossRef]
7. Khan, M.; Mithu, M.; Dhar, N. Effects of minimum quantity lubrication on turning AISI 9310 alloy steelusing vegetable oil-based cutting fluid. J. Mater. Process. Technol. 2009, 209, 5573–5583. [CrossRef]
8. Weinert, K.; Inasaki, I.; Sutherland, J.W.; Wakabayashi, T. Dry machining and minimum quantity lubrication.CIRP Ann. Manuf. Technol. 2004, 53, 511–537. [CrossRef]
9. Dhar, N.R.; Islam, M.W.; Islam, S.; Mithu, M.A.H. The influence of minimum quantity of lubrication (MQL)on cutting temperature, chip and dimensional accuracy in turning AISI-1040 steel. J. Mater. Process. Technol.2006, 171, 93–99. [CrossRef]
10. Kang, M.C.; Kim, K.H.; Shin, S.H.; Jang, S.H.; Park, J.H.; Kim, C. Effect of the minimum quantity lubrication inhigh-speed end-milling of AISI D2 cold-worked die steel (62 HRC) by coated carbide tools. Surf. Coat. Technol.2008, 202, 5621–5624. [CrossRef]
11. Liang, S.Y.; Ronan, A. Minimum Quantity Lubrication in Finish Hard Turning; Georgia Institute of Technology:Atlanta, GA, USA, 2003.
12. Iqbal, A.; He, N.; Li, L. Empirical modeling the effects of cutting parameters in high-speed end milling ofhardened AISI D2 under MQL environment. In Proceedings of the World Congress on Engineering, London,UK, 6–8 July 2011.
13. Thakur, D.; Ramamoorthy, B.; Vijayaraghavan, L. Optimization of minimum quantity lubrication parametersin high speed turning of superalloy Inconel 718 for sustainable development. Signal 2009, 20, 224–226.
14. Gandhe, V.; Jadhav, V. Optimization of minimum quantity lubrication parameters in turning of EN-8 steel.Int. J. Eng. Tech. Res. 2013, 1, 11–14.
15. Barnabas, J.; Tamizharasan, T. Optimization of MQL parameters during turning for the minimization offlank wear using DoE, PSO and SAA. J. Inst. Eng. India Ser. C 2012, 93, 133–139. [CrossRef]
16. Benardos, P.; Vosniakos, G.C. Predicting surface roughness in machining: A review. Int. J. Mach. Tools Manuf.2003, 43, 833–844. [CrossRef]
17. Hasçalık, A.; Çaydas, U. Optimization of turning parameters for surface roughness and tool life based onthe Taguchi method. Int. J. Adv. Manuf. Technol. 2008, 38, 896–903. [CrossRef]
18. Asiltürk, I.; Akkus, H. Determining the effect of cutting parameters on surface roughness in hard turningusing the Taguchi method. Measurement 2011, 44, 1697–1704. [CrossRef]
19. Gopalsamy, B.M.; Mondal, B.; Ghosh, S. Taguchi method and ANOVA: An approach for process parametersoptimization of hard machining while machining hardened steel. J. Sci. Ind. Res. 2009, 68, 686–695.
20. Ding, T.; Zhang, S.; Wang, Y.; Zhu, X. Empirical models and optimal cutting parameters for cutting forces andsurface roughness in hard milling of AISI H13 steel. Int. J. Adv. Manuf. Technol. 2010, 51, 45–55. [CrossRef]
21. Outeiro, J. Optimization of Machining Parameters for improved Surface Integrity of AISI H13 ToolSteel. In Proceedings of the Machines et Usinage a Grande Vitesse (MUGV), Saint-Etienne, France,16–18 October 2012; pp. 1–10.
22. Ghani, J.; Choudhury, I.; Hassan, H. Application of Taguchi method in the optimization of end millingparameters. J. Mater. Process. Technol. 2004, 145, 84–92. [CrossRef]
23. Phadke, M.S. Quality engineering using design of experiments. In Quality Control, Robust Design, and theTaguchi Method; Springer: Berlin, Germany; Heidelberg, Germany, 1989; pp. 31–50.
24. Fratila, D.; Caizar, C. Application of Taguchi method to selection of optimal lubrication and cutting conditionsin face milling of AlMg3. J. Clean. Prod. 2011, 19, 640–645. [CrossRef]
© 2016 by the authors; licensee MDPI, Basel, Switzerland. This article is an open accessarticle distributed under the terms and conditions of the Creative Commons by Attribution(CC-BY) license (http://creativecommons.org/licenses/by/4.0/).