Optimization of a New Array Noise Tool; Analysis ...
50
United Arab Emirates University Scholarworks@UAEU eses Electronic eses and Dissertations 3-2018 Optimization of a New Array Noise Tool; Analysis & Interpretation of Case Studies of Down- Hole Leak Detection Moustafa Mahmoud Hassan Ismail Follow this and additional works at: hps://scholarworks.uaeu.ac.ae/all_theses Part of the Petroleum Engineering Commons is esis is brought to you for free and open access by the Electronic eses and Dissertations at Scholarworks@UAEU. It has been accepted for inclusion in eses by an authorized administrator of Scholarworks@UAEU. For more information, please contact [email protected]. Recommended Citation Hassan Ismail, Moustafa Mahmoud, "Optimization of a New Array Noise Tool; Analysis & Interpretation of Case Studies of Down- Hole Leak Detection" (2018). eses. 739. hps://scholarworks.uaeu.ac.ae/all_theses/739
Transcript of Optimization of a New Array Noise Tool; Analysis ...

United Arab Emirates UniversityScholarworks@UAEU
Theses Electronic Theses and Dissertations
3-2018
Optimization of a New Array Noise Tool; Analysis& Interpretation of Case Studies of Down- HoleLeak DetectionMoustafa Mahmoud Hassan Ismail
Follow this and additional works at: https://scholarworks.uaeu.ac.ae/all_thesesPart of the Petroleum Engineering Commons
This Thesis is brought to you for free and open access by the Electronic Theses and Dissertations at Scholarworks@UAEU. It has been accepted forinclusion in Theses by an authorized administrator of Scholarworks@UAEU. For more information, please contact [email protected].
Recommended CitationHassan Ismail, Moustafa Mahmoud, "Optimization of a New Array Noise Tool; Analysis & Interpretation of Case Studies of Down-Hole Leak Detection" (2018). Theses. 739.https://scholarworks.uaeu.ac.ae/all_theses/739


iii
Copyright
Copyright © 2019 Moustafa Mahmoud Hassan Ismail
All Rights Reserved
vi
Abstract
This thesis is concerned with optimization and analysis of new array noise tool.
Various lab and field case studies are analyzed to test the capabilities and determine
the optimum operation conditions of the new tool for leak detection purposes. The
purpose of this study is to optimize the logging procedure of real time array noise tool,
selecting adequate gain parameters and frequency band in processing phase, and to
analyze the data acquired through multiple lab and field tests. The study methodology
involved the following steps:
1. Performing lab and field tests for the tool in a range of different scenarios.
2. Carrying out multiple real-life case studies and provide interpretation using
commercial software.
Gain setting was optimized to obtain best results through logging and adding additional
auxiliary logging accessories was proven to enhance the acquisition process.
Moreover, implementing proper logging procedure that suits the tool capabilities aid
the analysis process and the objective was met successfully. The tool was tested and
proved consistent results which can be commercialized and used as real time noise
tool. The new array noise tool overcomes the limitations of the memory noise tool in
which it will save both time and money on the oil companies and will be able to provide
in situ answer for leak detection purposes.
Keywords: Array noise tool, analysis, leak detection, optimization, down hole
logging.

vii
Title and Abstract (in Arabic)
داة الكشف عن الضوضاء الجديدة ك تحليل امثله عمليه من الكشف عن أتعظيم الاستفادة من
بارالتسريب في الآ
صالملخ
تعنى هذه الأطروحة بدراسة الاستفادة القصوى من معدات تسجيل الضوضاء المصفوفة
يد أوضاع الجديدة وتحليلها. وقد جرى تحليل دراسات حالة مختلفة من المختبر ومن الحقل لتحد
الهدف من هذه التشغيل المثلى للمعدات الجديدة واختبار قدراتها وذلك بهدف كشف التسرب. إن
الدراسة هو تحسين إجراءات القياس للزمن الفعلي لمعدات تسجيل الضوضاء المصفوفة التي
ة، تظهر نتائج لحظية، عبر تحديد مؤشرات التضخم الكافية والنطاق الترددي في مرحلة المعالج
ذه الدراسة وتحليل البيانات الناتجة من خلال عدة اختبارات في المختبر والحقل. تضمنت منهجية ه
الخطوات التالية:
أداء تجارب في المختبر والحقل للمعدات بسيناريوهات متعددة. .1
القيام بعدة دراسات حالة واقعية وتقديم تحليل للبيانات باستخدام برامج تجارية. .2
النحو الأمثل للحصول على أفضل النتائج من خلال دات المضخم علىجرى تحسين إعدا
أدوات قياس تكميلية مساعدة وقد أثبت ذلك تحسين عملية القياس. وإضافة إلى ذلك القياس وإضافة
فإن تطبيق إجراءات قياس ملائمة تناسب إمكانات المعدات يساعد في عملية التحليل وقد تم تحقيق
ة المعدات وأظهرت نتائج موثوقة يمكن استخدامها تجاريا واستخدامها الهدف بنجاح. تم تجرب
ل ضوضاء تظهر نتائج لحظية.كمعدات تسجي
تتجاوز المعدات المصفوفة لتسجيل الضوضاء الجديدة القيود الموجودة في معدات تسجيل
كن الضوضاء المعتمدة على الذاكرة وسيوفر ذلك الوقت والمال لشركات النفط والغاز وستتم
الشركات من تقديم رد فوري لأغراض كشف التسرب.
كشف التسرب، ت تسجيل الضوضاء المصفوفة، التحليل،: معدامفاهيم البحث الرئيسية
.الضغط والحرارة الجوفية الاستفادة القصوى، قياس

viii
Acknowledgements
My thanks go to Professor Abdulrazag Y. Zekri whose enthusiasm about
going after new innovative new studies which got me started. I am especially grateful
to Mongi Abdelmoula & Marvin Rourke on behalf of GoWell Oil field technologies
for acceptance to share the results and use it for my thesis dissertation. I am grateful
to Mahmoud Saada for technical support and guidance throughout the project.
I would like to thank my committee for their guidance, support, and assistance
throughout my preparation of this thesis, especially my advisor Professor Abdulrazag
Y. Zekri. I would like to thank the chair and all members of the Department of
Chemical and Petroleum Engineering at the United Arab Emirates University for
assisting me all over my studies and research. My special thanks are extended to the
Library Research Desk for providing me with the relevant reference material.
Special thanks go to my mother, brothers, and sisters who helped me along the
way. I am sure they suspected it was endless.

ix
Dedication
To my beloved mother and family

x
Table of Contents
Title ............................................................................................................................... i
Declaration of Original Work ...................................................................................... ii
Copyright ....................................................................................................................iii
Approval of the Master Thesis .................................................................................... iv
Abstract ....................................................................................................................... vi
Title and Abstract (in Arabic) .................................................................................... vii
Acknowledgements ...................................................................................................viii
Dedication ................................................................................................................... ix
Table of Contents ......................................................................................................... x
List of Figures ............................................................................................................. xi
List of Abbreviations.................................................................................................xiii
Chapter 1: Introduction ................................................................................................ 1
1.1 Overview .................................................................................................... 1
1.2 Statement of the Problem ........................................................................... 1
1.3 Tool Physics and Relevant Literature ........................................................ 2
1.3.1 Tool Design ........................................................................................ 2
1.3.2 Tool Recording Principle .................................................................... 5
Chapter 2: Data Analysis and Processing .................................................................... 7
2.1 Advanced Processing Technique ............................................................... 7
2.2 Software Processing Workflow................................................................ 10
Chapter 3: Optimization of Array Noise Tool ........................................................... 12
3.1 Surface Test .............................................................................................. 12
3.2 Field Tests ................................................................................................ 17
3.3 Case Studies ............................................................................................. 25
3.3.1 Case Study No.1 ............................................................................... 25
3.3.2 Case Study No.2 ............................................................................... 28
3.3.3 Case Study No.3 ............................................................................... 32
Chapter 4: Conclusion ................................................................................................ 35
References .................................................................................................................. 36

xi
List of Figures
Figure 1: Sensor onfiguration of array noise tool ...................................................... 3
Figure 2: Monopole and quadrupole sensors ............................................................. 3
Figure 3: Dipole measurements ................................................................................. 4
Figure 4: Road noise propagating in the tool arrives with the same
phase and amplitude which will cancel out................................................ 5
Figure 5: Defect source will have large differential signal ........................................ 5
Figure 6: Represents the stationary leak source vs. the moving road
noise ........................................................................................................... 6
Figure 7: Different type of noise signals .................................................................... 7
Figure 8: Steps for advanced processing workflow ................................................... 8
Figure 9: Identifying leak point.................................................................................. 9
Figure 10: Wave propagation analysis ......................................................................... 9
Figure 11: Commercial software interface with the processing tab ........................... 10
Figure 12: End result of basic and advanced processing ........................................... 11
Figure 13: Steps to optimize and validate array noise tool ........................................ 12
Figure 14: Test for channels reading in sensors at 0-0-0 gain setup .......................... 13
Figure 15: Test for channels reading in sensors at 1-1-1 gain setup .......................... 13
Figure 16: Test for channels reading in sensors at 2-2-0 gain setup .......................... 14
Figure 17: Effect of different gain setting on the data ............................................... 15
Figure 18: Test well and the injection line to simulate a leak .................................... 16
Figure 19: Simulated active leak recorded by array noise tool .................................. 17
Figure 20: Centralizers used in down-hole logging ................................................... 18
Figure 21: Array noise tool survey under A-Annulus injection ................................. 19
Figure 22: Array noise tool survey under B-Annulus injection ................................. 20
Figure 23: Design of wire line peak standoff . ........................................................... 21
Figure 24: Array noise tool survey under shut in condition....................................... 22
Figure 25: Effect of speed on array noise tool ........................................................... 24
Figure 26: Array noise tool recorded noise at packer setting depth
in interval A.............................................................................................. 26
Figure 27: Array noise tool data at packer in Interval B ............................................ 27
Figure 28: Noise tool data over the whole interval .................................................... 29
Figure 29: Noise tool recorded data over GLM-1 interval ........................................ 30
Figure 30: Noise tool recorded data over GLM-2 interval ........................................ 30
Figure 31: Array noise tool and stationary tool data comparison
at GLM-1 .................................................................................................. 31
Figure 32: Array noise tool and stationary tool data comparison
at GLM-2 .................................................................................................. 31
Figure 33: Array noise log under bleed off condition at the packer
interval...................................................................................................... 32

xii
Figure 34: Array noise log under injection with open A-Annulus
condition at the packer interval ................................................................ 33
Figure 35: Array noise log under injection with closed A-Annulus
condition at the packer interval ................................................................ 33

xiii
List of Abbreviations
ADP Advanced Data Processing
BAP Basic Array Processing
F153 Energy in 15-30 kHz Frequency Band
F345 Energy in 30-45 kHz Frequency Band
F515 Energy in 5-15 kHz Frequency Band

1
Chapter 1: Introduction
1.1 Overview
Noise leak detection tools have been in high demand in the past few decades.
The recent failures in wells have led oil service companies to constantly design and
enhance new technologies for leak detection, as monitoring the well by various logging
tools proved to be the best way to plan a work-over and help to maintain the asset and
cost management. Microphone was first used in wells to identify casing leaks (Enright,
1955). Later on, McKinley introduced a multi sensor noise tool, in which the basic
principle is to record noise in different frequency bands (McKinley et al., 1973) and
used also for locating cross flow behind casing (McKinley, 1994) Recent
advancements in the noise-logging technique have made it a valuable tool for dealing
with problem wells (Robinson, 1976). New technologies of spectral noise tools were
used in wider applications such as generating high sensitivity boards which can be
used to monitor and improve reservoir characterization (Suarez et al., 2013). Noise
logging is applicable whenever fluid flow, either in the borehole or in the casing
formation annulus, produces a detectable noise (Bateman & Richard, 2015).
1.2 Statement of the Problem
One of the main limitations of Stationary noise tools is the lengthy operation
time to identify the leak source throughout the well. In such cases, the memory noise
tool will have to stop for stations down hole, and without prior estimation where the
leak source, this process might take hours or even days before the whole well would
be logged. Another limitation is that all noise tools work at memory mode, which
means that you have to finish logging, retrieve the memory from the tool to view the

2
data, while if it was accessible to view the data on surface while logging would have
gave the engineer the chance to focus more on a suspected interval. This workflow
could be inefficient in terms of urgent well interventions and immediate action is
required. Moreover, when the leak source noise signal is not strong enough (less than
30 dB), the process of stationary measurements might miss the leak source as the
activation of the leak source wouldn’t last long enough to be recorded by the tool. All
of these limitations lead the Oil industry to find another innovative, more practical and
efficient methods to overcome such challenges. One of them is to design a real time
noise tool in which measurements would be continuous and the data can be analyzed
on spot for a faster remedial action if needed. Recently, a well-known manufacturer
has released an array spectral high frequency noise tool which can record continuously
and provide real time data while logging (Zhao. J & Yang. Q, 2017).
The new technology of noise tools comes with challenges and for that it
requires a lot of lab and field testing to optimize the logging procedure, mode and gain
settings, proper logging speed for the best data quality, how to overcome the
background road noise generated by continuous logging, and related interpretation and
analysis workflow in order to be implemented in oil industry.
1.3 Tool Physics and Relevant Literature
1.3.1 Tool Design
A well manufacturer designed and produced the Array noise tool (Zhao.J &
Yang.Q, 2017). The array noise tool consists of 38 hydrophones, 3 set of monopole
and 6 sets of dipole sensors and azimuthal sensors to record acoustic measurements in
four different directions (Figure 1). Sensors are defined as monopoles, dipoles or
quadruples based on the number of sensor surfaces (Figure 2) to be able to measure

3
detailed acoustic noise and further away from the sensor, they must achieve large
aperture, it can be achieved using more sensor surface and/ or combining sensor
surface to produce a larger aperture.
Figure 1: Sensor onfiguration of array noise tool
Figure 2: Monopole and quadrupole sensors

4
Moreover, a phased control method can be used to generate a larger aperture
as shown below:
Pa (Ø) =∑ 𝑛𝑖=1
Wi ej (K
0 (i-1) dsin (Ø)+ θi )
Wi and θi are the weighted factors for the i-th component, d is the distance between
sensors, N is number of sensors and K is wave number.
d can be optimized using the following equation;
d< λ/2
where λ is the wavelength of the signal.
Sensor surfaces are made of pizoceramic materials which can record noise
generated within a wellbore.
Differential sensor principle of work is that, each sensor (sensor x and sensor
y) has two sensor faces, in which acoustic noise is recorded in different directions and
then compared to each other (Figure 3).
Figure 3: Dipole measurements

5
1.3.2 Tool Recording Principle
The array noise tool works in integration of data acquisition and data
processing. As the tool goes down hole, it records different noise in well bore, along
with acoustic noise properties which could be frequency, amplitude, acoustic mode,
propagation direction, azimuthal location and distribution from a noise source where
data is stored in memory mode and is transferred to the surface for real time analysis
(Zhao. J & Yang. Q, 2017). Moving down-hole, a road noise is picked up by the tool;
this noise is generated due to centralizers or due to the tool movement in wellbore.
Road noise will generate a signal and picked up by the tool, as the signal recorded by
the differential sensors one in the y direction and another in x direction. These signals
are identical in shape and by comparing signal from opposite sensors, the tool may
cancel out as shown in Figure 4.
Figure 4: Road noise propagating in the tool arrives with the same phase and
amplitude which will cancel out
As for the defect signal (Figure 5), it will not be affected by the interference
and thus cancels out, as that signal will not have the same amplitude and wavelength.
Figure 5: Defect source will have large differential signal
6
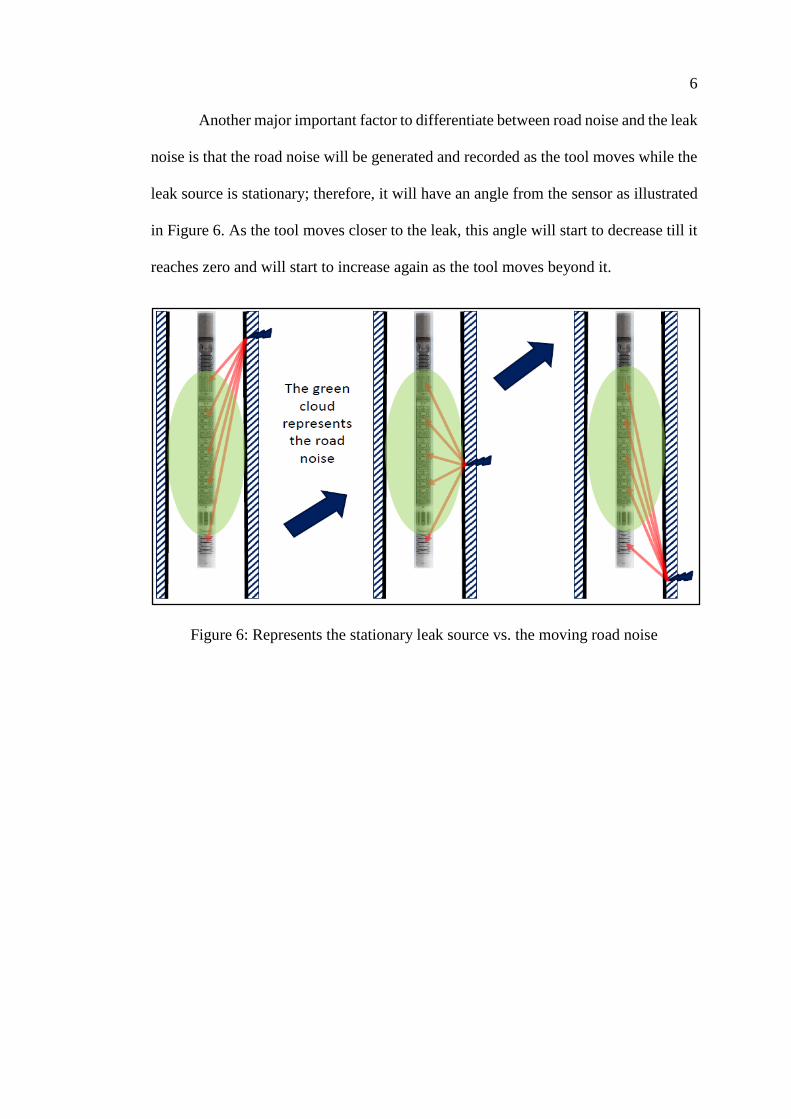
Another major important factor to differentiate between road noise and the leak
noise is that the road noise will be generated and recorded as the tool moves while the
leak source is stationary; therefore, it will have an angle from the sensor as illustrated
in Figure 6. As the tool moves closer to the leak, this angle will start to decrease till it
reaches zero and will start to increase again as the tool moves beyond it.
Figure 6: Represents the stationary leak source vs. the moving road noise

7
Chapter 2: Data Analysis and Processing
2.1 Advanced Processing Technique
When the tool is recording, it captures three types of data; Road noise,
background noise along with leakage noise if found. The three types of signals
illustrated in Figure 7, are mixed and interfered with each other over the range from 5-
40 kHz as follows:
• Road noise – 5k-40 kHz
• Background noise 1k-40 kHz
• Leakage noise 25 k-40 kHz
Figure 7: Different type of noise signals
One of the main issues is that the leak noise is mixed with the unsymmetrical
road noise. In the interval where is no leak, the tool is recording only road noise until
it reaches the leak source, there will be interference between the signals where the leak
noise will suppress the road noise and will have a different signal phase and amplitude
that differentiate it from the other unwanted noise. The following procedure will

8
present how the tool, through Advanced processing, will capture the leak source and
remove the unwanted other noises (Figure 8). Hence, dispersion analysis is needed.
Dispersion analysis is technique consists of acquiring waveforms from an array of
receivers distributed along the tool. The method depends on processing in the
frequency domain and exploiting phase information to measure the travel time for each
frequency component.
Figure 8: Steps for advanced processing workflow
The main idea of dispersion is to differentiate between different signals based
on the arrival time, however we still in need to find out which is a real response of the
leak and which is still a road or background noise. In this matter, the concept that leak
source is stationary unlike the other road noise will be a decisive step in which the data
will on go integration analysis (Figure 9).

9
Integration analysis or propagation analysis concept is based on that the leak
source is stationary and when the tool propagates downwards and comes near the leak
source, angle θ, which is the angle of leak source to the sensor, will starts to decreases
until it reaches zero, and after the tool passes it the angle θ will start to increase again
as the tool propagates upwards (Figure 10).
Figure 9: Identifying leak point
Figure 10 : Wave propagation analysis

10
2.2 Software Processing Workflow
Using commercial software designed for the array noise tool, data will be
processed and displayed. The data is loaded to software in the form of PLF file. Next
step is to go to data editor tab and implement different types of processing mainly are
basic processing and advanced processing (Figure 11).
Figure 11 : Commercial software interface with the processing tab
Figure 12 shows the end results of basic and advanced processing. Basic
processing will produce spectrum, which is raw frequency spectrum from all the
differential sensors and BAP spectrum which is the advanced spectrum to enhance
leak point detection. Advanced processing is where the propagation analysis occurs
and it produces ADP spectrum along with the frequency curves as follows:
• F515 is 5-15 kHz frequency band
• F153 is energy in 15-30 kHz frequency band
• F345 is energy in 30-45 kHz frequency band
• Energy curve
• Baseline curve

11
Figure 12: End result of basic and advanced processing

12
Chapter 3: Optimization of Array Noise Tool
It is crucial to validate data recorded and optimize related operational
procedures such as gain settings, adequate logging speed and related accessories
attached to tool string (centralizers). These steps are important to maintain and enhance
the data quality and to understand more about the tool limitations and where it could
have more improvements. The process was done in three stages as it is shown in Figure
13.
Figure 13: Steps to optimize and validate array noise tool
3.1 Surface Test
In order to obtain the highest signal to noise ratio and maximize the amount of
data recorded during logging, some tests were applied on the sensors readings to find
out the optimum values in which adequate data is recorded. Gain is a logarithmic mode
which is used to amplify the data and enhance signal to noise ratio.
Data validation
Surface test Field testsCommercial case
studies
13
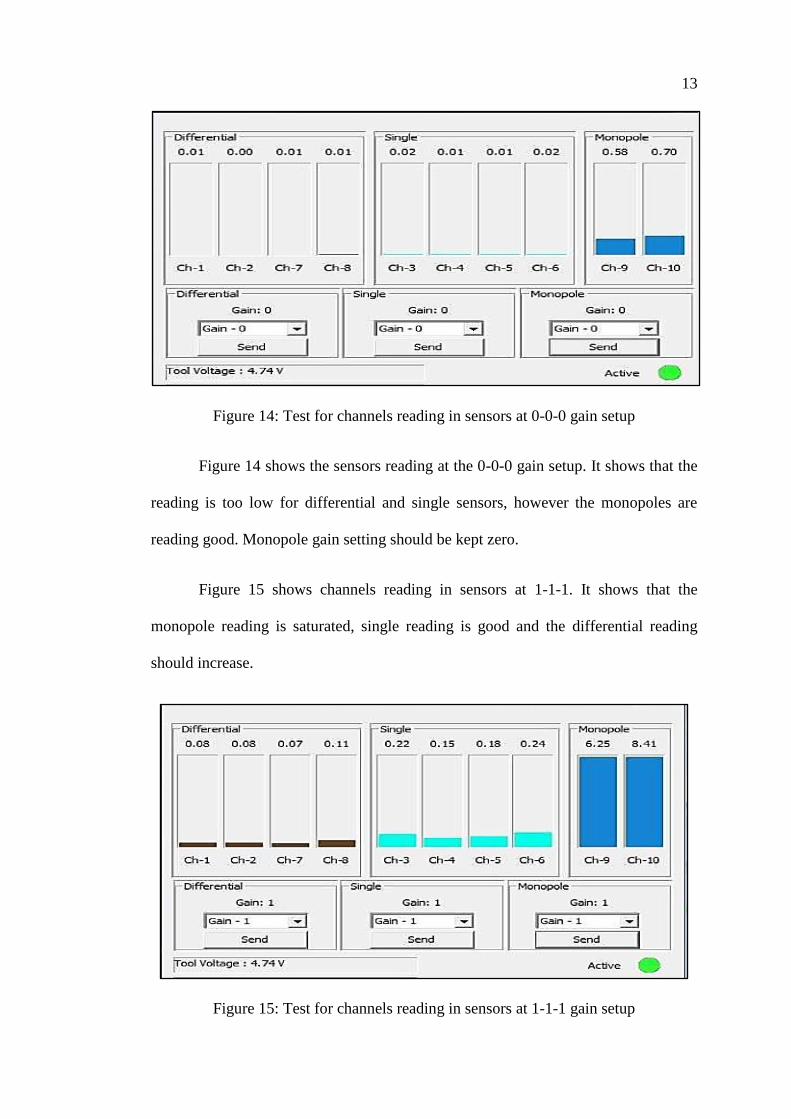
Figure 14: Test for channels reading in sensors at 0-0-0 gain setup
Figure 14 shows the sensors reading at the 0-0-0 gain setup. It shows that the
reading is too low for differential and single sensors, however the monopoles are
reading good. Monopole gain setting should be kept zero.
Figure 15 shows channels reading in sensors at 1-1-1. It shows that the
monopole reading is saturated, single reading is good and the differential reading
should increase.
Figure 15: Test for channels reading in sensors at 1-1-1 gain setup

14
That means we need to reduce the monopole reading as it got saturated and
increase single to have better response and differential sensors as well. In Figure 16, it
shows that we applied gain setting in the form of 2-2-0. The monopoles reading are
showing high values even if it was at the lowest gain possible, suggesting that the
reading are affected with gain from another sensors. Single channels are quite saturated
however differential sensors are reading normal values which can be increased. It is
also recommended to plan the surface test each time prior to logging to quick QC tool
response on surface before commencing to log down hole.
Figure 16: Test for channels reading in sensors at 2-2-0 gain setup
Applying different gain settings, we can conclude that around 1/3 of the height
of the bar for each channel reading is adequate for the best response, and the
recommended gain setting would be 2-1-0 or 2-2-0 depending on how the tool will
respond down hole.

15
One of the surface tests was conducted to show the implications of using
inadequate gain setting on the data. Figure 17 illustrate a noise log from a surface test
pipe, with the top section using gain setting of 2-2-0 and the bottom section using gain
setting of 3-1-1. The gain setting of the top interval shows good quality data and the
noise signal are in range, while the bottom section shows that the data was excessively
“boosted” which result in masking the actual noise signal and hence decreasing the
signal to noise ratio instead of increasing it.
Figure 17: Effect of different gain setting on the data
In order to make sure the gain settings that were tested are working properly, a
test was conducted on a test well, with water injection line that will simulate a casing
leak (Figure 18). Two runs were done; one was done when the well was in shut in
condition and the other run, where the other run water was injected in one of the water
lines while the other is closed. The tool was recorded in both runs using gain setting
of 2-2-0 as mentioned above.

16
Figure 18: Test well and the injection line to simulate a leak

17
Figure 19: Simulated active leak recorded by array noise tool
As shown in Figure 19, the array noise tool was able to record fluid movement
through the water entry point, which confirms the gain setting of 2-2-0 is working
properly.
3.2 Field Tests
Running the array noise tool in actual wells may face some challenges in terms
of assessing the optimum logging speed that the tool should be logging with down
hole, also to assess the effect of having centralizers along with the tool down hole.
Figure 20 shows centralizers used in down-hole logging tool. Moreover, the idea is

18
also to decide the adequate logging procedure for implementing, as the array noise tool
measurements is quite different than the ordinary and stationary logging tools. Some
field tests were implemented in order to investigate the above points and for the analyst
to get more hands on experience and anticipate how the tool response with the
environments around.
Figure 20: Centralizers used in down-hole logging
Array noise log was recorded in well under A-Annulus injection (Figure 21)
and another run under B-Annulus injection (Figure 22). The tool string had centralizers
in order to maintain the tool movement in the well to be properly centralized. The
proposed logging speed was 16 ft/min.

19
Figure 21: Array noise tool survey under A-Annulus injection

20
Figure 22: Array noise tool survey under B-Annulus injection

21
It is noticed that throughout the entire log up normal spikes where popping up
at repeated intervals. These spikes are not due to Background or road noise, as in the
basic processing step, these are already eliminated. Therefore, the noise is coming
from a stationary source inside the well. Having them repeatedly all over the entire
logging intervals could not be interpreted as noise coming from either casing leak.
Analysis is that one of the tool string accessories are causing noise with the well
equipment and therefore generating the same noise source that the tool captures and
masks the actual noise coming due to leak source. Having that the tool was logging
inside the tubing (less than 4 ½”), it is possible that the centralizer arms are colliding
with the tubing collars and creating such a noise.
To overcome this issue, a centralizer will be replaced by rubber peak standoff.
The standoff will still help in centralizing the tool down hole and will have less friction
with the tubing collars.
Figure 23 : Design of wire line peak standoff (G.Weather, Lee Paterson, Ben Kidd et
al. 2015).

22
Another field test was done to check the effect of stand offs to reduce collision
with tubing collars.
Figure 24: Array noise tool survey under shut in condition
The effect of using standoff was clearly shown in Figure 23, as throughout the
entire logging survey, the tool response showed no up normal spikes which confirms
that it was a centralizer issue and the rubber standoff was effective to reduce the
unwanted noise and enhance the tool response quality.

23
The conclusion from the above cases is that whenever we log in tubing (4 ½”
or less), centralizers should be replaced by a peak standoff, as the centralizers are
making unwanted noise with the tubing collars. However, if the tool is running in the
inner pipe and it is greater than 4 ½” OD, then it is preferred to use centralizers. The
use of centralizers in this case will not have much impact with the collars as the
centralizer arms will be having less friction with the pipe collars (larger pipe would
make the centralizer arm opens more and hence its tension and impact will be lower
which will generate a lower sound print and will be easily eliminated by the processing
software as road or background noise.
Figure 24 highlights the effect of speed. The higher noisy unwanted data was
at speed of 16-20 ft/min however the speed in the below interval was reduced to 10-
12 ft/min.

24
Figure 25: Effect of speed on array noise tool

25
From Figure 25, it is observed that the resolution of the noise spectrum was not
as high as it should be; suggesting either the gain settings or the speed was not
adequate. Therefore, the recommended speed should be as follows:
• In case of the down pass, go 10-12 ft/min and observe on surface if there are
any indications on a leak down –hole.
• In case of the up pass, either if the depth was suspected before or found by
during the down pass, go with the speed of 6 ft/min.
3.3 Case Studies
The Array noise tool was subjected to field and surface tests in order to
optimize main parameters such as speed, mode and gain settings and tool accessories
within the string. Array noise tool was nominated to investigate various leak detection
candidate wells in order to point out where the leak source is coming from.
3.3.1 Case Study No.1
Array noise log was recorded in XX well under A Annulus injection survey. The
objective is to locate the source of A-Annulus pressure buildup. The objective was to
check for possible leak source coming from the packer at interval B and the Packer at
interval A is holding.
Logging procedure was proposed as follows:
• Log at speed of 10-12 ft/min with gain setting 2-0-0.
• Interval A and Interval B, log at speed of 6 ft/min.
As shown in Figure 26, the ANT recorded noise throughout the whole
frequency domain spectrum (0-30 kHz) across the packer setting in interval A. It is

26
also shown in the temperature curve where we can observe a break, suggesting a fluid
entry through that interval. Figure 27 shows the noise log at packer depth in interval
B. As observed from the data, there is no noise recorded or any temperature
perturbation at the packer depth, which concludes that the leak source is not from that
interval.
Figure 26: Array noise tool recorded noise at packer setting depth in interval A

27
Figure 27 : Array noise tool data at packer in Interval B

28
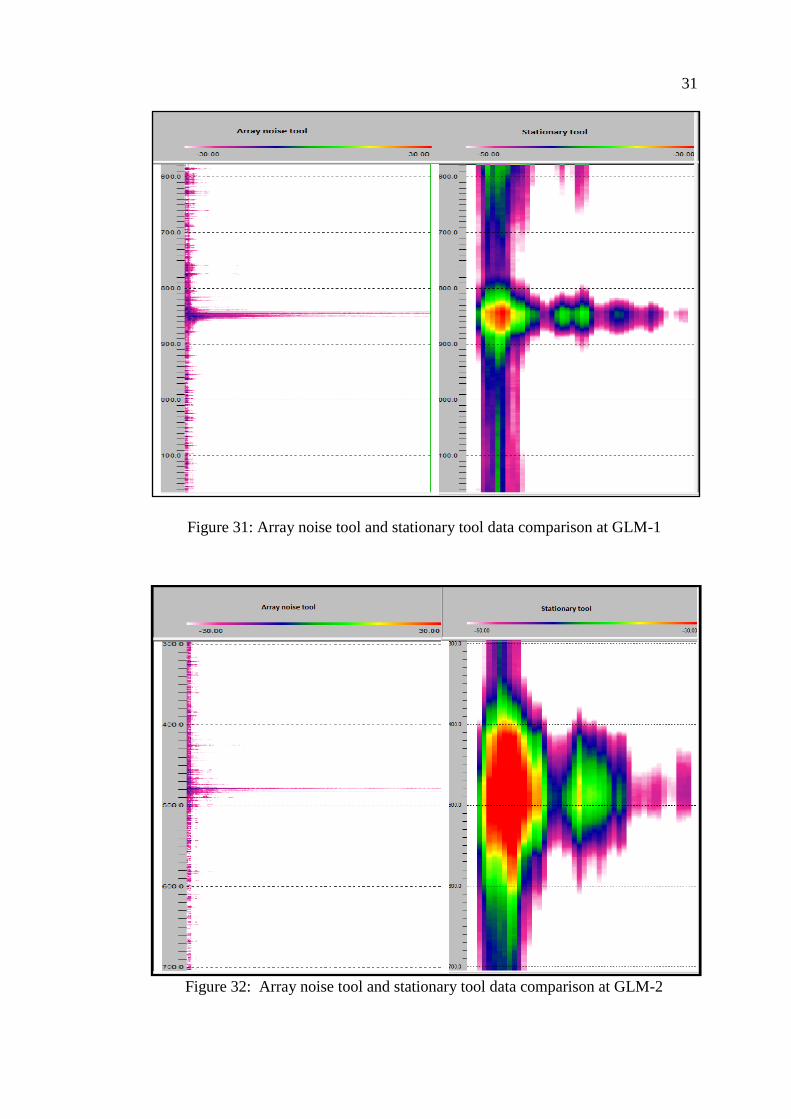
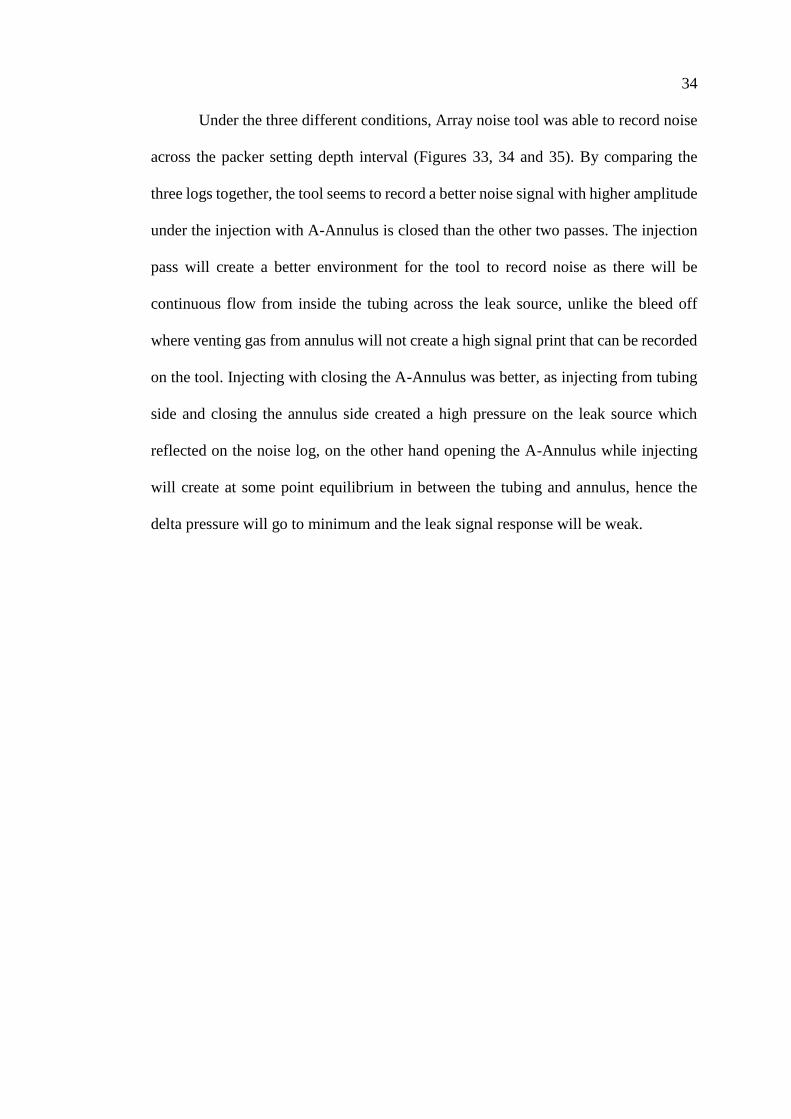
3.3.2 Case Study No.2
The objective of the array noise tool is to identify any tubing leak and to check
the integrity of Gas lift mandrels. There will be another run using a well-known
stationary noise tool to compare and validate results of the new technology. Logging
was done under A –Annulus bleed off and logging plan was as follows:
• Log at speed of 16 ft/min.
• Gain setting should be 2-0-0.
In Figure 28, it shows the full interval log and at the GLM intervals, there is
noise recorded over gas lift mandrel 1 and 2.Tool recorded noise at the depth range of
the first gas lift mandrel which suggests that the lift is leaking and it is not fully closed
(Figure 29) Noise was recorded In all frequency range up to 30 kHz and it is showing
at energy curves as well. Although it was not the optimum speed to log using the noise
tool, it showed very precise results and was able to capture the leak despite some high
background noise due to the speed. Figure 30 shows that tool recorded noise at the
GLM-2 interval. Comparing both array noise tool and the stationary noise tool, it
shows good match, as the stationary tool detected noise coming from the leak source
in GLM-1 and GLM-2 (Figure 31 and 32).

29
Figure 28: Noise tool data over the whole interval
GLM-1
GLM-2

30
Figure 29: Noise tool recorded data over GLM-1 interval
Figure 30: Noise tool recorded data over GLM-2 interval
31
Figure 31: Array noise tool and stationary tool data comparison at GLM-1
Figure 32: Array noise tool and stationary tool data comparison at GLM-2

32
3.3.3 Case Study No.3
Objective of the job was to find out communication between A- Annulus and
tubing, therefore the Array noise log was recorded under three different conditions; A-
Annulus bleed off, injection with opening A-Annulus and Injection with closing A-
Annulus. The other secondary objective for this well is to optimize which of the
following 3 conditions could be classified as the best logging procedure for the Array
noise tool and which will yield the best results in terms of leak detection.
Figure 33: Array noise log under bleed off condition at the packer interval

33
Figure 34: Array noise log under injection with open A-Annulus condition at the
packer interval
Figure 35 : Array noise log under injection with closed A-Annulus condition at the
packer interval
34
Under the three different conditions, Array noise tool was able to record noise
across the packer setting depth interval (Figures 33, 34 and 35). By comparing the
three logs together, the tool seems to record a better noise signal with higher amplitude
under the injection with A-Annulus is closed than the other two passes. The injection
pass will create a better environment for the tool to record noise as there will be
continuous flow from inside the tubing across the leak source, unlike the bleed off
where venting gas from annulus will not create a high signal print that can be recorded
on the tool. Injecting with closing the A-Annulus was better, as injecting from tubing
side and closing the annulus side created a high pressure on the leak source which
reflected on the noise log, on the other hand opening the A-Annulus while injecting
will create at some point equilibrium in between the tubing and annulus, hence the
delta pressure will go to minimum and the leak signal response will be weak.

35
Chapter 4: Conclusion
Optimizing the new array noise tool was done through several steps from lab
and surface test to actual field implementations and meeting the objective. The Array
noise tool was successfully able to analyze data and detect leak source precisely. By
the aid of the advanced software processing, the interference of road / background
noise with the actual leak source noise signal was minimized.
Throughout this process, few findings and observations were made to further
enhance and elaborate the applications of the tool.
• Adding extra differential sensors will boost the signal to noise ratio and
therefore focus more on the leak noise signal.
• Implement a beam forming analysis; a technique which will aid to identify
the distance of the leak from the vicinity of the well bore. The beam forming
technique depends on the wavelength propagation.
• Enhance the tool hardware material to accommodate harsh environments
(H2S compatible material).
• Further enhance the noise rejection from tool movement and tool accessories.
36
References
Bateman, M. (2015) Noise Logging. In: Cased-Hole Log Analysis and Reservoir
Performance Monitoring. Springer, New York, NY.
Enright, R.J. (1955) Sleuth for Down-Hole Leaks. Oil & Gas J. 11, 78–79.
McKinley, R. M. (1994). Temperature, Radioactive Tracer, and Noise Logging for
Well Integrity. R94, 112–156.
McKinley, R.M., Bower, F.M. and Rumble, R.C. (1973). The Structure and
Interpretation of Noise from Flow behind Cemented Casing. Journal of
Petroleum Technology 25(3), 3999-PA.
Robinson, W. S. (1976). Field Results From the Noise-Logging Technique. Society of
Petroleum Engineers. doi: 10.2118/5088-PA.
Suarez, N., Otubaga, A., Mehrotra, N., Aslanyan, A., Aslnyan, I. and Khabibullin, M.
(2013). Complementing Production logging with spectral Noise Analysis to
improve reservoir characterization and surveillance. SPWLA 54th annual
symposium 22-26 June, New Orleans. (Accessed 15-12-2018). Retrieved from:
https://www.onepetro.org/conference-paper/SPWLA-2013-TTT
Weather, G., Lee P. and Ben K. (2015). Using wireline standoff (WLSOs) to mitigate
cable sticking. SPE Western Regional Meeting, 27-30 April, Garden Grove,
California, USA. (Accessed 8-1-2018). Retrieved from:
https://www.onepetro.org/conference-paper/SPE-174068-MS
Patent
Zhao.J,Yang.Q (2017). US - Patent Application No. US 2017/0002642 A1 for
“Apparatus and method for Matrix array”.