Optimization and modeling of teff-maize-rice based ... · FOOD SCIENCE & TECHNOLOGY ... top &...
19
Page 1 of 19 FOOD SCIENCE & TECHNOLOGY | RESEARCH ARTICLE Optimization and modeling of teff-maize-rice based formulation by simplex lattice mixture design for the preparation of brighter and acceptable injera Zewdu Cherie, Gregory R. Ziegler, Habtamu Fekadu Gemede and Ashagrie Zewdu Woldegiorgis Cogent Food & Agriculture (2018), 4: 1443381
Transcript of Optimization and modeling of teff-maize-rice based ... · FOOD SCIENCE & TECHNOLOGY ... top &...

Page 1 of 19
FOOD SCIENCE & TECHNOLOGY | RESEARCH ARTICLE
Optimization and modeling of teff-maize-rice based formulation by simplex lattice mixture design for the preparation of brighter and acceptable injeraZewdu Cherie, Gregory R. Ziegler, Habtamu Fekadu Gemede and Ashagrie Zewdu Woldegiorgis
Cogent Food & Agriculture (2018), 4: 1443381
Cherie et al., Cogent Food & Agriculture (2018), 4: 1443381https://doi.org/10.1080/23311932.2018.1443381
FOOD SCIENCE & TECHNOLOGY | RESEARCH ARTICLE
Optimization and modeling of teff-maize-rice based formulation by simplex lattice mixture design for the preparation of brighter and acceptable injeraZewdu Cherie1, Gregory R. Ziegler2, Habtamu Fekadu Gemede3 and Ashagrie Zewdu Woldegiorgis1*
Abstract: Simplex lattice mixture design was utilized to optimize a brighter and acceptable injera (Ethiopian staple bread). Fourteen formulations of injera were pro-duced from constrained blends of teff (70–100%), maize (0–30%) and rice (0–30%). Investigated responses were proximate, mineral, sensory and lightness (L* value). Nutritional values (g/100 g) ranged from 59.3 to 62.8 (moisture), 1.74 to 2.76 (ash), 11.5 to 14.7 (protein), 2.1 to 2.6 (fat), 3.91 to 5.2 (fiber) and 75.9 to79.4 (carbohy-drate). Minerals (mg/100 g) varied from Fe: 17.7 to 25.1, Zn: 1.62–2.10, and Ca: 25.9 to 51.1. Sensory scores for color, taste, texture, number of eyes, eye size, eye distri-bution, top & bottom surface and overall acceptability were 5.63–7.72, 5.22–6.21, 4.83–7.70, 6.02–7.27, 4.12–5.82, 5.42–6.93, 5.97–7.02, and 5.32–7.25, respectively, while the L* value ranged from 54.9 to 63.1. Optimum formulations of injera in terms of color, overall acceptability and L* value consisted of 70% teff, 0% maize and 30% rice with a desirability of 0.909. Numerical optimization also indicated that better sensory, proximate and mineral qualities are directly related with the propor-tion of rice; maize and teff, respectively.
*Corresponding author: Ashagrie Zewdu Woldegiorgis, Center for Food Science and Nutrition, College of Natural Sciences, Addis Ababa University, P.O. Box 1176, Addis Ababa, EthiopiaE-mails: [email protected], [email protected]
Reviewing editor:Fatih Yildiz, Middle East Technical University, Turkey
Additional information is available at the end of the article
ABOUT THE AUTHORSDr Ashagrie Zewdu Woldegiorgis Research Group (DARG) is a research group comprised of graduate students (Msc and PhD) under the supervision of the senior faculty staff member Dr Ashagrie Zewdu Woldegiorgis. Dr Ashagrie is a full time assistant professor of Food Science and Nutrition at the Centre for Food Science and Nutrition, Addis Ababa University since September 2009. He has a Bachelor degree (Bsc) in chemistry in 2003 and a Master of Science (Msc) in Food Science and Nutrition in 2009 and Doctorate of Philosophy (PhD) in Food Science and Nutrition in 2013. DARG research interest areas are: Industrialization of traditional foods, Antioxidant properties, Food safety and quality (especially aflatoxins in foods), Product development and as well as nutrition related areas such as omega-3 fatty acids, fortification etc, Food and nutrition analysis.Under the research group so far 4 PhD and more than 30 Msc students have completed their research thesis/dissertation with good results and this will continue in the future also.
PUBLIC INTEREST STATEMENTConsidering the continuous increment of teff grain price in the local market, searching for a less expensive grain such as maize, rice and sorghum as a substitute to make injera is very important. Trials and errors were made by many researchers to promote the use of composite flour for the making of injera by partially substituting teff.
This study for the first time developed an acceptable injera from the composite flour of teff-rice-maize mixtures based on scientific approach to prepare injera that are nearly acceptable as pure teff injera with limited number of experimental runs. According to the research finding, using 70% tef and 30% rice to prepare an injera will result in injera bread that is acceptable in its major sensory attributes.
Thus, Ethiopian women and injera factories who bake and sale injera can now apply the optimum formulation for the preparation of nutritious traditional bread with minimal cost.
Received: 27 December 2017Accepted: 16 February 2018First Published: 27 February 2018
© 2018 The Author(s). This open access article is distributed under a Creative Commons Attribution (CC-BY) 4.0 license.
Page 2 of 19
Ashagrie Zewdu Woldegiorgis

Page 3 of 19
Cherie et al., Cogent Food & Agriculture (2018), 4: 1443381https://doi.org/10.1080/23311932.2018.1443381
Subjects: Food Additives & Ingredients; Food Chemistry; Food Laws & Regulations
Keywords: injera; teff; maize; rice; simplex lattice mixture design
1. IntroductionInjera (ingerra, enjera, enjerra), a spongy, sourdough, crepe-like flatbread is the staple of the Ethiopian meal accounting for approximately 70% of dietary calories (Gamboa & Ekris, 2008). In the northern Ethiopian highlands and around Addis Ababa injera is traditionally and preferentially made from the flour of teff (t’ef) (Eragrostis tef (Zucc.) Trotter), but regionally, wheat, barley, sorghum, mil-let, maize and rice are all incorporated (Ashenafi, 2006). Teff injera is getting popular in the devel-oped world as well because of its being a whole grain product and gluten free nature, the cause for celiac disease (Abiyu, Woldegiorgis, & Haki, 2013; Gamboa & Ekris, 2008).
There are different varieties of tef that vary in color from light to dark. The three most common tef colors are white, brown and red tef. Injera from white teff is most preferred due to its softer texture, preferred taste, its color and can be rolled without cracking. However, it is more widely consumed by the economically better off urban peoples than by rural households (Assefa, Demeke, & Lanos, 2015; Boka, Woldegiorgis, & Haki, 2013). As teff prices go up, even middle income households tend to mix teff flour with cheaper cereals such as sorghum maize or rice in preparing injera (Demeke & Di Marcantonio, 2013).
Injera is also considered as good sources of energy, fiber, iron, calcium and vitamins although the fermentation process during preparation results in significant reduction of most of the nutrients found in the cereals flour (Mezemir, 2015). Unfortunately, even white tef injera color darkens after baking and during storage. Moreover, the shelf life of white injera is only 3–4 days essentially due to mould spoilage (Ashagrie & Abate, 2012).
The effectiveness of response surface methodology (RSM) in optimization of ingredient levels, for-mulations and processing conditions in food recipes and formulations has been documented by dif-ferent food science researchers and nutritionists. It is a statistical mathematical method that uses quantitative data in an experimental design to determine and simultaneously solve multivariate equations, to optimize processes and products (Cox, 1971). RSM is also a useful tool to minimize the numbers of trials and provide multiple regression approach to achieve optimization (Seth & Rajamanickam, 2012).
Efforts have been made by many researchers to promote the use of composite flour for the mak-ing of injera by partially substituting teff with maize, barley, wheat, sorghum (Cherinet, 1988), with decorticated sorghum (Yetneberk, de Kock, Rooney, & Taylor, 2004; Yetneberk, Rooney, & Taylor, 2005), with Flaxseed (Girma, Bultosa, & Bussa, 2013) and with sorghum and maize (Legesse, 2015) to improve the nutrient density and sensory acceptability injera. However no study has reported on the blending of composite flours from different cereals to prepare injera using a response surface methodology. Observations have also shown that many Ethiopian women and organizations (who make and sale injera) prepare it from teff-maize-rice combinations with varying proportions majorly to make its color whiter as pure teff injera has a tendency to darken during storage.
Considering the high price of teff grain in the local market, its low yield potentialand darkening of teff injera after baking, searching for a less expensive grain such as maize, rice and sorghum as a substitute to make injera with comparable quality has become very important (Abraha, Uhlen, Abay, Sahlstrom, & Bjornstad, 2013). Thus, this study was conducted to develop and optimize injera made from flour composites of teff, maize and rice which is brighter and acceptable with regard to sensory using mixture response surface methodology. The finding of the study will provide a guide for com-mercial injera companies and household makers to produce a whiter and acceptable injera with lower production cost.

Page 4 of 19
Cherie et al., Cogent Food & Agriculture (2018), 4: 1443381https://doi.org/10.1080/23311932.2018.1443381
2. Materials and methods
2.1. Sample collection and preparationTeff DZ-Cr-387 (Kuncho), Maize (M-6Q) and Rice (X-Jegna) varieties were collected from Deber-zeit, Melkasa and Fogera Agricultural Research Centers. The samples were manually cleaned, sorted, sieved in a fine sieve and stored in polyethylene bags separately. Then they were grounded using a stainless steel laboratory mill (FW 100, China) and sieved through a fine sieve of size 0.50 mm. Flours packed in dry polyethylene bags and storage in dry place.
2.2. Simplex mixture designMaximum and minimum levels of independent variables were first investigated by doing a prelimi-nary analysis at various injera baking companies and households. It was found that a maximum of only 30% teff will be substituted with maize and rice. It was found out that substituting more than 30% teff with rice, maize and other cereals to make injera results in rough circumference, powdery, cracked top surface, and brittle when handled with hand. The augmented design (Table 1) was used to replicate vertices and binary blends at the edges to minimize residual errors.
Design- Expert ®, version 7.0 software was used for the generation of test formulations and analy-sis of the results. Simplex lattice design method was employed, to formulate recipes, study the main effect of parameters, create models between the variables, and determine the effect of these vari-ables to optimize the levels of ingredients. Fourteen treatments in random order are created and responses parameters like proximate, mineral, sensory and lightness (L* value) were evaluated (Table 2). The experimental data for each response variable were fitted to the quadratic model as Y = � = X1 + X2 + X3 + X
21 + X
22 + X
23 + X1X2 + X1X3 + X2X3, where, Y = responses; β = constant;
X1, X2, X3 = linear regression; X21 + X22 + X
23= quadratic regression X1X2, X1X3, X2X3 = interaction regres-
sion; X1, X2, X3 = independent variables.
2.3. Preparation of composite flourThe flour composite blends contained teff, maize and rice were prepared using a formula shown in Table 2. The dry material individually were blended uniformly to homogenize and then packed in tightly closed clean plastic container that kept at room temperature (25 ± 2°C) until used.
2.4. Preparation of fermented dough and baking of injeraAll ingredients (composite flour + water + ersho (starter culture)) were added accurately and the fermentations of the dough were conducted by following the traditional teff dough preparation pro-cedure as presented by Boka et al. (2013). Injera of the fourteen formulations were baked at NutrAfrica Food Processing and Agro-Industry Company located at Deber-zeit which is 40 km away from the capital city.
2.5. Proximate compositionProximate chemical analyses of all prepared injera were determined according to 2000 official methods and total carbohydrate was determined by difference. All proximate analyses were con-ducted in triplicates and are expressed as percentage in dry matter (% DM).
Table 1. Design constraints
Notes: B + C = 0.3; A + B + C = 1.
Low ≤Constraints ≤High0.7 ≤A: Teff ≤1
0 ≤B: Maize ≤0.3
0 ≤C: Rice ≤0.3

Page 5 of 19
Cherie et al., Cogent Food & Agriculture (2018), 4: 1443381https://doi.org/10.1080/23311932.2018.1443381
2.5.1. Moisture contentMoisture content of the samples were determined according to Association of Official Analytical Chemistry (AOAC) (2000) using the official method 925.09 by oven drying method. A crucible was cleaned and dried in an oven at 105°C for 1 h and placed in desiccators to cool. The weight of the crucible (W1) was determined. 5gm samples (in triplicate) was weighed in the dry crucible (W2) dried at 105°C for 3 h and after cooling in desiccators to room temperature it is again weighed (W3). The moisture content was determined using equation below.
2.5.2. Determination of crude proteinProtein content was determined according to AOAC (2000) using the official method 979.09 by the Kjeldahl method.
2.5.2.1. Digestion. Fresh samples of 0.5000 g (in duplicate) was taken in a tecator tube and 6 ml of acid mixture (5 parts of concentrated ortho-phosphoric acid and 100 parts of concentrated sulfuric acid) was added and mixed, and 3.5 ml of 30% hydrogen peroxide was added step by step. As soon as the violet reaction had ceased, the tubes was shaken and placed back to the rack. Three gram of catalyst mixture (ground 0.5000 g of selenium metal with 100 g of potassium sulfate) was added into each tube, and allowed to stand for about 10 min before digestion. When the temperature of the digester attained 370°C, the tubes were lowered into the digester. The digestion was allowed to continue until a clear solution was obtained, about 4 h. The tubes in the rack were cooled in a fume hood; 25 ml of de-ionized water was added, and shaken to avoid precipitation of sulfate in the solution.
2.5.2.2. Distillation. A 250 ml conical flask containing 25 ml of boric acid, 25 ml of distilled water and an indicator solution was placed under the condenser of the distiller with its tips immersed into the solution. The digested solution was transferred into the sample compartment of the distiller. Sodium hydroxide solution (35%) was added (40 ml) into the digested and diluted solution. The distillation
Moisture content%DM =W2 −W3
W2 −W1
× 100.
Table 2. Simplex lattice coded design for injera preparation from teff, maize and riceFormulations Component 1 A:
TeffComponent 2 B:
MaizeComponent 3 C:
RiceResponses: Proximate,
mineral and sensory
F1 0.850 0.150 0.000
F2 0.750 0.050 0.200
F3 0.850 0.150 0.000
F4 0.700 0.300 0.000
F5 0.700 0.150 0.150
F6 0.700 0.300 0.000
F7 0.900 0.050 0.150
F8 1.000 0.000 0.000
F9 0.800 0.100 0.100
F10 0.700 0.000 0.300
F11 0.750 0.200 0.050
F12 0.700 0.000 0.300
F13 0.850 0.000 0.150
F14 1.000 0.000 0.000

Page 6 of 19
Cherie et al., Cogent Food & Agriculture (2018), 4: 1443381https://doi.org/10.1080/23311932.2018.1443381
process was continued for 9 min until a total volume reached between 200 ml and 250 ml. The tip of the distiller was rinsed with a few milliliter of water before the receiver was removed.
2.5.2.3. Titration. The distillate was titrated using 0.1 N hydrochloric acid until reddish color appeared.
The crude protein was determined using the following formula below.
where V is the volume of HCl in liter consumed to the end point of titration, N is the normality of HCl (0.1 N was used), W0 is sample weight on dry matter basis and 14.00 is the molecular weight nitro-gen. The % of nitrogen is converted to % of protein by using appropriate conversion factor 6.25.
2.5.3. Determination of crude fatCrude fat was determined according to AOAC (2000) using the official method 4.5.01. About 2 g of flour (in duplicate) was extracted with 50 ml petroleum ether or diethyl ether for a minimum period of 4 h in the soxhlet extractor. The solvent was then evaporated and the extracted fat was dried in the oven and cooled in a desiccator. The crude fat was determined according to the following equation.
where W1 = weight of the extraction flask (g); W2 = weight of the extraction flask plus the dried crude fat (g); and W = weight of sample (g).
2.5.4. Determination of ash contentThe ash content was determined by AOAC (2000) using the official method 923.03. Porcelain dishes were placed in a muffle furnace for 30 min at 550°C. The dishes were cooled in desiccators (with granular silica gel) for about 30 min at room temperature and weighed to the nearest milligram (W1). About 2.5000 g of fresh sample (in triplicate) were placed in dish and weighed (W2). Dishes were placed on a hot plate under a fume-hood and the temperature was slowly increased until smoking ceases and the samples become thoroughly charred. The dishes with sample were placed inside the muffle furnace at 550°C for 5 h and cooled in desiccators for 1 h. The ash in each dish was clean and white in appearance. When cooled to room temperature, each dish with ash was re-weighed to the nearest milligram (W3).
where (W2−W1) is sample mass in g on dry base and (W3−W1) mass of ash in g.
2.5.5. Determination of crude fiberCrude fiber content of the injera samples was determined according to the method 962.09 of the AOAC (2000).
2.5.5.1. Digestion: Fresh samples of 1.7000 g (in triplicate) (W3) was placed into a 660 ml beaker; 200 ml of 1.25% sulfuric acid were added, and boiled gently for 30 min while watch glass were placed over the mouth of the beaker. During boiling, the level of the sample solution was kept
Nitrogen (%) in DM =VHCL for sample − VHCL for blank × NHCL
W0
× 14 × 100
Protein(%) = 6.25 ×% Nitrogen.
Crude fat, percent DM =W2 −W1
W× 100
Total ash (%) =W3 −W1
W2 −W1
× 100

Page 7 of 19
Cherie et al., Cogent Food & Agriculture (2018), 4: 1443381https://doi.org/10.1080/23311932.2018.1443381
constant with hot distilled water. After exactly 30 min heating, 20 ml of 28% KOH was added and boiled gently for further 30 min, with occasional stirring.
2.5.5.2. Filtration. The bottom of a sintered glass crucible was covered with 10 mm sand layer and wetted with distilled water. The solution was poured into sintered glass crucible and filtered with the aid of vacuum pump (High performance vacuum pump, Robin Air way, SPX Corporation, Monteplier, USA). The wall of the beaker was rinsed with hot distilled water several times; washings was trans-ferred to the crucible and filtered.
2.5.5.3. Washing. The residue in the crucible was washed with hot distilled water and filtered (re-peated twice). The residue was washed with 1% sulfuric acid and filtered, and then washed with hot distilled water and filtered; and again washed with 1% NaOH and filtered. The residue was washed with hot distilled water and filtered; and again washed with 1% sulfuric acid and filtered. Finally the residue was washed with water free acetone.
2.5.5.4. Drying and combustion. The crucible with its content was dried in a drying oven for 2 h at 130°C and cooled for 30 min in a desiccator (with granular silica gel), and then weighed (record as W1). The crucible was cooled in desiccators and weighed (recorded as W2).
where W1 = weight of crucible with sample after drying; W2 = weight of crucible with sample after ashing; W3 = fresh sample weight.
2.5.6. Determination of carbohydrateCarbohydrate content was determined by difference.
where CHO is carbohydrate content, P is protein content, F is fat content, Fb is fiber content and A is ash content.
2.6. Mineral determination (Fe, Zn & Ca)The concentrations of Iron, Zinc and Calcium in the samples were calculated from the absorbance obtained from the flame atomic absorption spectrophotometer (Shimazdu, Japan) of each samples as compared to the standard.
Ash was obtained from dry ashing of food sample by the procedure described above in the total ash analysis. The ash was wetted completely with 7 ml of 6 N HCl, and dried on a low temperature hot plate. Fifteen (15 ml) of 3 N HCl was added to the dried ash and heated on the hot plate until the solution boiled. The ash solution was cooled to room temperature in a hood and filtered into a 50 ml graduated flask using a filter paper (Whatman 45,125 mm). Fifteen (15 ml) of 3 N HCl was added into each crucible dishes and heated until the solution boiled, was then cooled and filtered into the flask. The crucible dishes were again washed three times with de-ionized water; the washing was filtered into a flask. 2.5 ml of lanthanum chloride was added for each sample. Then, the solution was cooled and diluted to 50 ml with de-ionized water. A blank solution was prepared in 50 ml volumet-ric flask with the same procedure for minerals reading. Sample reading was conducted using atomic absorption spectrophotometer.
2.6.1. Standard solutionsSix series of working standard metal solutions (0, 0.5, 2.0, 4.0 6.0 and 8.0 ppm for Ca, and 0.0, 0.5, 1.0, 2.0, 3.0 and 4.0 ppm for Fe & Zn) of the minerals were prepared by appropriate dilution of the
Crude fiber in % DM =W1 −W2
W3
× 100
% Carbohydrate in DM = 100 − [%P + %F + %Fb + %A]

Page 8 of 19
Cherie et al., Cogent Food & Agriculture (2018), 4: 1443381https://doi.org/10.1080/23311932.2018.1443381
metal stock solution (nitrate of the metal) with deionized water in 10 ml volumetric flask. Calibration curve (concentration vs. absorbance) for each element were Fe = 0.052x (R2 = 0.999) Ca = 0.126x + 0.011 (R2 = 0.998) and Zn = 0.249x + 0.024 (R2 = 0.995).
The absorbance of the samples was measured using flame atomic absorption spectrophotometer by aspirating de-ionized water. Sample blank solution was run with the sample solution. The concen-trations of the samples were calculated from the absorbance values of each samples using Beer-Lambert Law plot.
where, W = Weight (g) of sample, V = Volume of extract in liters, A = Concentration (mg/l) of sample solution, B = Concentration (mg/l) of blank solution and D = Dilution factor.
2.7. Sensory evaluationInjera prepared from the different composite flours were evaluated for its sensory acceptability and preference by using 30 consumer participants. The attributes assessed included: visual color, taste, texture, appearance (eye size, number of eyes, eye distribution, top and bottom surface) and over all acceptance. The nine point hedonic scale rated from 1 (extremely dislike), 5 (neither like nor dislike) to 9 (extremely like) for evaluating the degree of liking and disliking were employed. All the panelists were frequent consumers of injera. The age ranges of the participants were 22–45 years old, so that they could fill the score card properly. Twelve (12) of the participants were female while eighteen (18) of the participants were male.
2.8. Color measurement of injera by image analysis using Adobe Photo ShopTM softwareColor of the formulated injera was evaluated by the image analysis method according to Yam and Papadakis (2004). Images were captured using an image acquisition system for a digital color cam-era similar to the method developed by Yam and Papadakis (2004). CIE L *a*b* were measured on the digital image of the sample visualized on the monitor using a graphics software Adobe Photoshop CS3 by pointing the cursor on the surface area of the sample and by clicking on it. Three surface points from each injera sample were taken for the measurements.
2.9. Statistical analysis and optimizationDuncan’s Multiple Range test (SPSS version 21.0 for Windows, SPSS Inc, Illinois, USA) was carried out to determine level of significance within means. A p-value less than 0.05 was considered as signifi-cant. Both numerical optimization and graphical optimization technique were employed using the Design ExpertTM version7.0 software (State Ease Inc.) with a criterion of minimum teff while maize and rice were kept in ranges.
3. Results and discussion
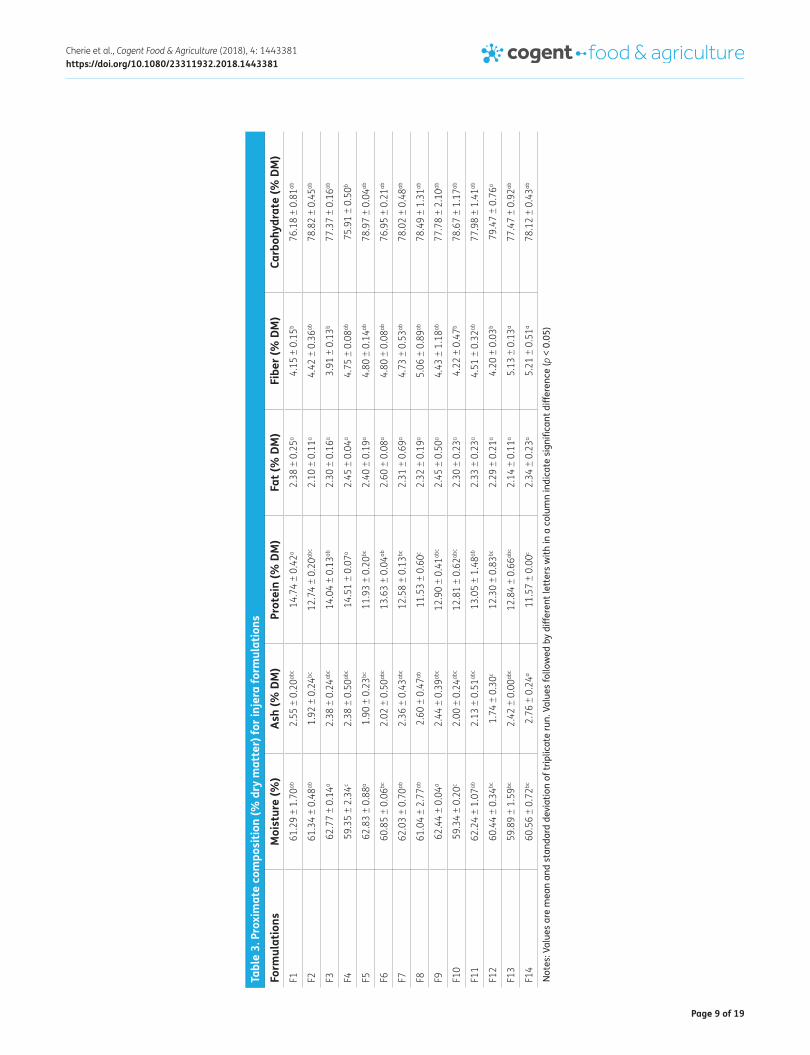
3.1. Proximate composition of the formulated injeraMoisture, total ash, crude protein, crude fat, crude fiber, carbohydrate content and dry matter of all formulated injera are presented in Table 3. All attributes other than moisture contents are expressed on dry basis (% DM).
The blending ratio had a significant effect (p < 0.05) on moisture content of the composite injera samples. The mean moisture content of the formulated injera ranged from 59.34 to 62.83%. Previous studies Gebrekidan and Gebrehiwot (1982), Yetneberk et al. (2004) reported that the moisture con-tent of injera made from different cereals is above 50%.
The mean total ash content of product is in the range of 1.74–2.76% DM (Table3). Injera made from composite flours with higher proportion of teff showed a higher ash content. This was
Metal content
(
mg
100g
)
=A − B
W× V × 100 × D
Page 9 of 19
Cherie et al., Cogent Food & Agriculture (2018), 4: 1443381https://doi.org/10.1080/23311932.2018.1443381
Tabl
e 3.
Pro
xim
ate
com
posi
tion
(% d
ry m
atte
r) fo
r inj
era
form
ulat
ions
Not
es: V
alue
s ar
e m
ean
and
stan
dard
dev
iatio
n of
trip
licat
e ru
n. V
alue
s fo
llow
ed b
y di
ffere
nt le
tter
s w
ith in
a c
olum
n in
dica
te s
igni
fican
t diff
eren
ce (p
< 0
.05)
Form
ulat
ions
Moi
stur
e (%
)As
h (%
DM
)Pr
otei
n (%
DM
)Fa
t (%
DM
)Fi
ber (
% D
M)
Carb
ohyd
rate
(% D
M)
F161
.29
± 1.
70ab
2.55
± 0
.20ab
c14
.74
± 0.
42a
2.38
± 0
.25a
4.15
± 0
.15b
76.1
8 ±
0.81
ab
F261
.34
± 0.
48ab
1.92
± 0
.24bc
12.7
4 ±
0.20
abc
2.10
± 0
.11a
4.42
± 0
.36ab
78.8
2 ±
0.45
ab
F362
.77
± 0.
14a
2.38
± 0
.24ab
c14
.04
± 0.
13ab
2.30
± 0
.16a
3.91
± 0
.13b
77.3
7 ±
0.16
ab
F459
.35
± 2.
34c
2.38
± 0
.50ab
c14
.51
± 0.
07a
2.45
± 0
.04a
4.75
± 0
.08ab
75.9
1 ±
0.50
b
F562
.83
± 0.
88a
1.90
± 0
.23bc
11.9
3 ±
0.20
bc2.
40 ±
0.1
9a4.
80 ±
0.1
4ab78
.97
± 0.
04ab
F660
.85
± 0.
06bc
2.02
± 0
.50ab
c13
.63
± 0.
04ab
2.60
± 0
.08a
4.80
± 0
.08ab
76.9
5 ±
0.21
ab
F762
.03
± 0.
70ab
2.36
± 0
.43ab
c12
.58
± 0.
13bc
2.31
± 0
.69a
4.73
± 0
.53ab
78.0
2 ±
0.48
ab
F861
.04
± 2.
77ab
2.60
± 0
.47ab
11.5
3 ±
0.60
c2.
32 ±
0.1
9a5.
06 ±
0.8
9ab78
.49
± 1.
31ab
F962
.44
± 0.
04a
2.44
± 0
.39ab
c12
.90
± 0.
41ab
c2.
45 ±
0.5
0a4.
43 ±
1.1
8ab77
.78
± 2.
10ab
F10
59.3
4 ±
0.20
c2.
00 ±
0.2
4abc
12.8
1 ±
0.62
abc
2.30
± 0
.23a
4.22
± 0
.47b
78.6
7 ±
1.17
ab
F11
62.2
4 ±
1.07
ab2.
13 ±
0.5
1abc
13.0
5 ±
1.48
ab2.
33 ±
0.2
3a4.
51 ±
0.3
2ab77
.98
± 1.
41ab
F12
60.4
4 ±
0.34
bc1.
74 ±
0.3
0c12
.30
± 0.
83bc
2.29
± 0
.21a
4.20
± 0
.03b
79.4
7 ±
0.76
a
F13
59.8
9 ±
1.59
bc2.
42 ±
0.0
0abc
12.8
4 ±
0.66
abc
2.14
± 0
.11a
5.13
± 0
.13a
77.4
7 ±
0.92
ab
F14
60.5
6 ±
0.72
bc2.
76 ±
0.2
4a11
.57
± 0.
00c
2.34
± 0
.23a
5.21
± 0
.51a
78.1
2 ±
0.43
ab

Page 10 of 19
Cherie et al., Cogent Food & Agriculture (2018), 4: 1443381https://doi.org/10.1080/23311932.2018.1443381
explained by the presence of ash in teff flour at higher amount (up to 3.16) (Bultosa, 2007) than in maize (1.20%) (Mesfin & Shimelis, 2013) and rice flour (1.7%) (Islam, Taneya, Shams-Ud-Din, Syduzzaman, & Hoque, 2012).
The mean protein values of all injera varied from 11.53 to 14.74% DM (Table 3) which is in close agreement with Legesse (2015) (9.4–13.3). Generally the protein content is high in injera made from composite flours containing high ratio of maize. However, the protein content of maize flour is 9.42% DM (Nuss & Tanumihardjo, 2010), while teff has 10.7%DM (Sadik, Demelash, & Gizaw, 2012). This discrepancy might be due to the synthesis of more enzyme proteins in case of maize fermentation. Lopez, Pereira, and Junqueira (2004) reported that compositing of flours to prepare gluten free bread affects fermentation patterns/kinetics and fermentation affects protein content resulting in a compositional change following the degradation of other constituents.
Crude fat content of injera samples did not significantly differ (p > 0.05) due to variations of ingre-dients. F6 (70%teff, 30% maize and 0% rice) has the highest crude fat value (2.60). Crude fat in-creases as the proportion of maize in the blend increases (Table 3). Since maize has a higher fat content than teff and rice. Mesfin and Shimelis (2013) reported that the crude fat of maize is 3.14% DM. Nuss and Tanumihardjo (2010) reported the crude fat content of rice is 0.58% DM. This is also in agreement with Bultosa, Hall, and Taylor (2002) who reported that the mean crude fat content of maize (4.45%) is more than doubles the crude fat content of teff (2%).
The crude fiber of the baked injera varied from 3.91 to 5.21% (Table 3). Injera made from 100% teff had the highest fiber content (5.21%) and injera containing 85% teff, and 15% maize with no rice has the least crude fiber content (3.91%). However, Ashenafi (2006) reported that the crude fiber of injera made from teff and maize were 1.00% DM and 0.8% DM,respectively.
The carbohydrate content of the baked injera ranged from 75.91 to 79.47%. Injera made from 70% teff, 0% maize and 30% rice had significantly high amount of CHO (79.47%) and injera pro-cessed from 70% teff, 30% maize and 0% rice had significantly low CHO content (75.91). However there were no significant variations among the rest of the samples in their carbohydrate content (Figure 1). Nuss and Tanumihardjo (2010) reported that the carbohydrate content of rice and maize is found to be 79.3 and 74.3% respectively.
3.2. Total mineral content of the baked injeraIn this study total iron, zinc and calcium contents of all formulated injera were analyzed and the results are shown in Table 4. Among the single component mixtures, teff produced the highest in-crease in total iron content followed by rice and maize, respectively. The interaction of rice and
Figure 1. Contour and 3D surface plots for carbohydrate obtained using actual-components.

Page 11 of 19
Cherie et al., Cogent Food & Agriculture (2018), 4: 1443381https://doi.org/10.1080/23311932.2018.1443381
maize produced an antagonistic effect on the iron content of the injera (Figure 2). The total iron contents of all composite injera vary from 17.73 to 25.13 mg/100 g. The iron content of injera pro-cessed from pure teff is significantly (p < 0.05) higher (25.13 mg/100 g) than the injera processed from other composite injera because grain teff has high iron contents (25.53 mg/100 g) (Baye,2014) than maize (2.71 mg/100 g) and rice (0.8 mg/100 g). A minimum value (17.73 mg/100 g) was ob-tained at 70% teff, 15% maize & 15% rice.
The total zinc content ranged from 1.62 to 2.10 mg/100 g). Injera prepared from pure teff had significantly (p < 0.05) higher zinc content (2.10 mg/100 g) than other formulations. This is explained by the higher content of zinc (2.4–6.8 mg/100 g) in teff grains than maize (2.6–4.6 mg/100 g) and rice (2.2 mg/100 g) (Baye, 2014).
The calcium contents of all composite injera varied from 25.99 to 51.11 mg/100 g. The highest value (51.11 mg/100 g) was obtained when the sample is processed from pure teff and the lowest
Table 4. Mineral content (total iron, zinc and calcium) of the composite injera
Notes: Values are mean and standard deviation of triplicate run. Values followed by different letters with in a column indicate significant difference (p < 0.05).
Formulations Iron (mg/100 g DM) Zinc (mg/100 g DM) Calcium (mg/100 g DM)F1 21.57 ± 0.93abc 2.03 ± 0.07ab 43.94 ± 1.89abc
F2 18.32 ± 0.19c 1.62 ± 0.01b 35.38 ± 0.38c
F3 20.21 ± 2.13abc 1.96 ± 0.37ab 41.21 ± 4.29abc
F4 18.43 ± 0.88bc 1.97 ± 0.06ab 37.62 ± 1.77c
F5 17.73 ± 0.18c 1.70 ± 0.03b 32.20 ± 0.36c
F6 19.37 ± 2.50abc 2.04 ± 0.05ab 40.83 ± 1.21abc
F7 21.94 ± 1.25abc 1.99 ± 0.09ab 44.69 ± 2.54abc
F8 25.13 ± 0.36a 2.09 ± 0.06a 51.11 ± 0.74a
F9 20.92 ± 0.16abc 1.75 ± 0.10ab 25.99 ± 0.32d
F10 20.28 ± 1.75abc 1.89 ± 0.04ab 41.34 ± 3.51abc
F11 17.94 ± 1.32c 1.88 ± 0.30ab 36.64 ± 1.70c
F12 19.31 ± 0.43abc 1.87 ± 0.07ab 39.39 ± 0.88bc
F13 22.31 ± 1.03abc 1.97 ± 0.12ab 45.42 ± 2.09abc
F14 24.13 ± 0.27ab 2.10 ± 0.01a 49.10 ± 0.53ab
Figure 2. Contour and 3D surface plots for iron content obtained using actual-components.

Page 12 of 19
Cherie et al., Cogent Food & Agriculture (2018), 4: 1443381https://doi.org/10.1080/23311932.2018.1443381
value (25.99 mg/100 g) was obtained when 80% teff, 10% maize and 10% rice were blended. Calcium content of injera increased when the proportion of teff in the blend increased. The observed high calcium content may be contributed by high calcium content of teff (165.2 mg/100 g) (Bultosa et al., 2002) than maize (7.0 mg/100 g) and rice (9 mg/100 g) (Nuss & Tanumihardjo, 2010).
3.3. Sensory acceptability of the formulated injeraThe sensory acceptability (color, taste, texture, appearance which includes no of eyes, eye size, eye distribution and top & bottom surfaces, and overall acceptability of all formulated injera is presented in Table 5. The multiple regression analysis (Table 6) of sensory scores also showed that the model terms are significant for prediction and the model presented no significant lack of fit. Therefore the model terms are adequate to create regression equation for prediction for these attributes.
3.3.1. ColorThe color of the baked injera ranged from 5.63 to 7.72. There is a significant difference (p < 0.05) in the preference of the panelists among the 14 experimental trials. However except F8 (injera made from 100% teff), all the formulations were accepted greater than 6 (like slightly) by the panelists. The contour plot (Figure 3) showed that those formulations having more maize and rice in the recipe had shown a relatively maximum color value which is in close agreement with the fact that maize and rice have good coloring effect for injera baking. Multiple regression for color was Y = 5.78X1 + 7.27X2 + 7.57X3 (R2 = 0.9051) also indicated that suggests that rice produced the highest increase for color score followed by maize and teff respectively.
3.3.2. TasteBlending ratios have no significant impact on the taste result of all formulated injera at p < 0.05 which ranged from 5.22 to 6.21. F13 injera made from 85% teff, 0% maize and 15% rice is the most preferred taste by the panelists. Minimum value was obtained in F1 (injera prepared from 85% teff, 15% maize and 0% rice). Multiple regression for taste was Y = 6.03X1 + 5.83X2 + 5.37X3−2.65X1X2 + 1.20X
1X3−0.79X2X3 (R2 = 0.7746) suggested that the addition of teff resulted in highest hedonic scores for taste followed by maize and rice respectively (Figure 4).
3.3.3. TextureThe texture value for the baked injera as reported by the panelists is found to be 4.83–7.70. Panelists texture response varies among the 14 formulations at p < 0.05 and maximum response (7.70) was obtained in injera made from ingredients containing 70% teff, 30% rice and with no maize. Minimum value for texture was obtained in F6 (70% teff, 30% maize and 0% rice). There is an increasing trend of liking the texture when the proportion of teff and rice are increased and texture score decreased when the proportion of maize is increased. This is in line with the findings of Yetneberk et al. (2004) who reported that teff injera is relatively soft compared to sorghum injera. The relative softness of teff injera could be related to starch granule size. Teff and rice starch have smaller granule sizes (2–6 μm) (Umeta & Parker, 1996) and (5 μm) (Jane, Shen, Wang, & Maningat, 1992) respectively compared with maize starch granule size 15 μm (Jane et al., 1992). The model obtained also for the texture of the samples was Y = 7.16X1 + 5.80X2 + 7.58X3 (R2 = 0.6141) indicated that the quantity of rice is the most dominant variable on the texture of injera samples followed by teff and maize re-spectively (Figure 5). Further investigation on effect of flour sieve size on the texture of injera should be evaluated in detail.
3.3.4. Number of eyesThere is no significant difference (p < 0.05) in the sensory acceptability test result for no of eyes in most of the formulations. The test result from counter plot showed that no of eyes are more pre-ferred relatively when the proportion of maize decreases in the recipes. The model obtained for the number of eyes the samples was Y = 6.75X1 + 6.13X2 + 7.01X3 (R2 = 0.5745) indicating that all the independent variables have increased the sensory scores for no of eyes. Yetneberk et al. (2004) and Gebrekidan and Gebrehiwot (1982) reported that injera from sorghum had poor sensory quality with less gas holes on the surface of the injera.

Page 13 of 19
Cherie et al., Cogent Food & Agriculture (2018), 4: 1443381https://doi.org/10.1080/23311932.2018.1443381
Tabl
e 5.
Sen
sory
acc
epta
bilit
y te
st re
sult
of th
e fo
rmul
ated
fres
h in
jera
usi
ng 9
poi
nt h
edon
ic s
cale
Not
es: V
alue
s ar
e m
ean
and
stan
dard
dev
iatio
n of
trip
licat
e ru
n. V
alue
s fo
llow
ed b
y di
ffere
nt le
tter
s w
ith in
a c
olum
n in
dica
te s
igni
fican
t diff
eren
ce (p
< 0
.05)
. Sco
res
are
base
d on
a 9
-poi
nt h
edon
ic s
cale
w
ith 1
= d
islik
e ex
trem
ely,
2 =
disl
ike
very
muc
h, 3
= d
islik
e m
oder
atel
y, 4
= di
slik
e sl
ight
ly, 5
= n
eith
er li
ke n
or d
islik
e, 6
= li
ke s
light
ly, 7
= li
ke m
oder
atel
y, 8
= lik
e ve
ry m
uch
and
9 =
like
extr
emel
y.
Form
ulat
ions
Colo
rTa
ste
Text
ure
No o
f eye
sEy
e si
zeEy
e di
strib
utio
nTo
p &
bott
om s
urfa
ceOv
eral
l acc
epta
bilit
yF1
6.43
± 1
.78cd
5.22
± 2
.06a
6.55
± 1
.97bc
d6.
02 ±
1.9
2b5.
38 ±
1.9
2a5.
60 ±
2.3
9bc7.
00 ±
1.7
3a6.
65 ±
1.9
1ab
F26.
72 ±
2.1
9abc
5.25
± 1
.98a
7.07
± 1
.96ab
cd6.
50 ±
2.2
4ab4.
75 ±
1.9
5ab5.
97 ±
2.3
1abc
6.47
± 2
.28ab
6.37
± 2
.08bc
F36.
75 ±
1.6
5abc
5.47
± 2
.21a
7.25
± 1
.57ab
c6.
72 ±
1.8
1ab4.
88 ±
1.9
2ab6.
13 ±
2.1
1abc
6.58
± 2
.12ab
6.03
± 1
.86bc
F47.
50 ±
1.6
8ab5.
82 ±
2.2
2a6.
70 ±
2.3
6abcd
6.13
± 2
.13ab
4.12
± 1
.96b
6.02
± 2
.23ab
c6.
27 ±
2.2
0ab5.
75 ±
2.2
6bc
F57.
25 ±
1.8
1ab5.
57 ±
2.2
2a6.
27 ±
2.1
4cd6.
53 ±
1.9
6ab5.
82 ±
2.1
1a6.
30 ±
2.1
8abc
6.25
± 2
.19ab
5.70
± 2
.09bc
F66.
97 ±
1.9
3abc
5.82
± 2
.14a
4.83
± 1
.85e
6.02
± 2
.38b
4.55
± 2
.01ab
5.42
± 2
.21c
6.10
± 2
.00ab
5.32
± 2
.00c
F76.
15 ±
1.7
8cd5.
48 ±
2.3
0a7.
07 ±
1.6
4abcd
6.67
± 1
.84ab
5.05
± 2
.20ab
6.53
± 2
.03ab
6.45
± 2
.04ab
6.43
± 2
.24ab
c
F85.
63 ±
2.2
5de6.
13 ±
2.1
6a7.
00 ±
1.9
9abcd
7.05
± 2
.02ab
4.81
± 2
.03ab
6.18
± 2
.26ab
c5.
97 ±
2.1
6b5.
67 ±
1.9
8bc
F96.
87 ±
1.9
5abc
5.55
± 2
.18a
6.90
± 1
.99ab
cd6.
73 ±
2.1
0ab4.
67 ±
2.3
4ab6.
00 ±
2.3
0abc
6.50
± 1
.88ab
5.92
± 2
.23bc
F10
7.72
± 1
.51a
5.25
± 2
.48a
7.70
± 1
.66a
7.27
± 1
.80a
4.77
± 2
.02ab
6.93
± 2
.12a
6.95
± 2
.31a
7.25
± 1
.87a
F11
7.32
± 1
.59ab
5.35
± 2
.23a
6.10
± 2
.09d
6.72
± 2
.14ab
4.70
± 1
.98ab
6.37
± 2
.07ab
6.73
± 1
.79ab
5.92
± 1
.83bc
F12
7.70
± 1
.86ab
5.52
± 2
.70a
7.70
± 1
.54a
6.85
± 1
.93ab
5.13
± 2
.16ab
6.55
± 2
.31ab
6.87
± 2
.06ab
6.73
± 2
.12ab
F13
6.60
± 2
.03bc
d6.
21 ±
2.0
8a7.
50 ±
1.8
4ab6.
97 ±
1.7
7ab5.
03 ±
2.0
3ab6.
38 ±
2.2
0ab7.
02 ±
2.0
2a6.
73 ±
2.0
5ab
F14
6.01
± 1
.94cd
5.95
± 2
.25a
6.82
± 1
.70ab
cd6.
45 ±
1.9
9ab5.
18 ±
2.0
0ab6.
17 ±
2.2
2abc
6.33
± 2
.11ab
5.83
± 2
.09bc

Page 14 of 19
Cherie et al., Cogent Food & Agriculture (2018), 4: 1443381https://doi.org/10.1080/23311932.2018.1443381
Tabl
e 6.
Coe
ffici
ent e
stim
ates
, mod
el s
igni
fican
ce, a
djus
ted
regr
essi
on c
oeffi
cien
t (ad
j R2 )
and
lack
of fi
t val
ues
for s
enso
ry a
ttrib
utes
of i
njer
a sa
mpl
es
Not
es: a
i = L
-pse
udo-
com
pone
nt v
alue
, (X 1)
= Te
ff, (X
2) =
Mai
ze, (
X 3) =
Rice
, * =
Sig
nific
ant a
t p <
0.0
5, (n
s) =
not
Sig
nific
ant.
Depe
nden
t var
iabl
es (Y
i)Pr
edic
tive
mod
els
Y i = a
1x1 +
a2x
2 + a
3x3 +
a4x
1x2 +
a5x
1x3 +
a6x
2x3 +
a7x
1x2x
3
Mod
el (P
rob
> F)
Adj R
2R2
Lack
of fi
t
a 1a 2
a 3a 4
a 5a 6
a 7
Colo
r5.
787.
27 7
.57
––
––
<0.0
001*
0.88
780.
9051
0.79
66 (n
s)
Tast
e6.
035.
835.
37−2
.65
1.20
−0.7
9–
0.01
73*
0.63
360.
7746
0.18
30 (n
s)
Text
ure
7.16
5.80
7.58
––
––
0.00
53*
0.54
390.
6141
0.95
93 (n
s)
No o
f eye
s6.
756.
137.
01–
––
–0.
0091
*0.
4971
0.57
450.
9291
(ns)
Eye
size
5.04
4.32
4.92
1.91
0.27
4.41
−23.
590.
0481
*0.
5750
0.77
110.
6982
(ns)
Eye
dist
ribut
ion
6.19
5.77
6.63
––
––
0.02
11*
0.41
390.
5041
0.61
60 (n
s)
Top
& b
otto
m s
urfa
ces
6.14
6.25
6.89
2.31
1.2
0−1
.50
–0.
0329
*0.
5628
0.73
090.
3891
(ns)
Ove
rall
acce
ptab
ility
5.85
5.54
7.05
2.61
–−2
.61
–0.
0017
*0.
7524
0.82
860.
8338
(ns)
L* v
alue
55.9
257
.37
61.9
4–
––
–0.
0010
*0.
6660
0.71
740.
2935
(ns)

Page 15 of 19
Cherie et al., Cogent Food & Agriculture (2018), 4: 1443381https://doi.org/10.1080/23311932.2018.1443381
3.3.5. Eye sizeEye size of the blended products ranged from 4.12 to 5.82. Maximum scores for eye size was ob-tained in F5 (70% teff, 15% maize, and 15% rice) and minimum scores was found in F4 (70% teff,
Figure 3. Contour and 3D surface plots for color obtained using actual-components.
Figure 4. Contour and 3D surface plots for taste obtained using actual-components.
Figure 5. Contour and 3D surface plots for texture obtained using actual-components.

Page 16 of 19
Cherie et al., Cogent Food & Agriculture (2018), 4: 1443381https://doi.org/10.1080/23311932.2018.1443381
30% maize and 0% rice). The sensory scores for eye size by judges are below 6 (slightly liked) which indicated that eye size was not liked by the consumers.
3.3.6. Eye distributionThe sensory response for eye distribution of the formulated injera varies from 5.42 to 6.93 and are significantly different (p < 0.05) in five groups. The eye distribution of F10 (70% teff, 0% maize and 30% rice) is most liked than other formulations and F6, injera baked from 70% teff, 30% maize and 0% rice is least liked by panelists. The contour plot (figure not shown here) showed that the eyes of injera were more evenly distributed when the proportion of rice increased while the acceptability with respect to eye distribution decreases when the proportions of maize increased. The model ob-tained for the eye distributions of the injera was Y = 6.19X2 + 5.77X2 + 6.63X3 (R2 = 0.5041).
3.3.7. Top and bottom surfacesThe top and bottom surfaces are not significantly (p < 0.05) different among the formulated injera. The values reported by the panelists for top & bottom surfaces ranged from 5.97 to 7.02. The top & bottom surfaces of F1 (85% teff, 15% maize and 0% rice) is more preferred to other composite for-mulations. The model obtained for the top and bottom surfaces of the samples was Y = 6.14X1 + 6.25X2 + 6.89X3 + 2.31X1X2 + 1.20X1X3−1.50X2X3 (R2 = 0.7309) indicating that interactions of maize and rice create an antagonistic effect on the top & bottom surfaces of the injera samples.
3.3.8. Overall acceptabilityThe overall acceptability of the 14 formulations is found to be in the ranges of 5.32 to 7.25. Injera made from 70% teff, 0% maize and 30% rice (F10) is the most liked formulation and F6 (70% teff, 30% maize and 0% rice) is the least liked injera of all formulations. Injera containing high proportion of rice is more liked than injera made from high proportion of maize by the panelists. The regression model obtained for the overall acceptability of the injera samples was Y = 5.85X1 + 5.54X2 + 7.05X3 + 2.61X1X2−2.61X2X3 (R2 = 0.8286) indicating that interaction of teff and maize produced an increased response on the overall acceptability of injera samples where as an antagonistic effect on the overall acceptability of injera samples were produced from the interaction of rice maize and rice.
3.4. Color (L* values) of the formulated injeraThere is a significant difference (p < 0.05) in L* values (lightness) between the composite injera sam-ples as the blending ratios varies. The mean L* values (lightness) ranged from 54.95 to 63.17. Generally a higher L* value means a lighter injera where as a lower L* value means a darker injera. Highest L* value (63.17) was found in formulations with a proportion of 70% teff, 0% maize and 30% rice and least L* value (54.65) was found in 100% pure teff mixture. From the counter plot it was observed that with higher proportion of teff included in the mixture, lower L* value was observed and formulations with higher proportion of rice showed a higher L* value. The liner equation for L-value was Y = 55.92X1 + 57.37X2 + 61.94X3 (R2 = 0.7174) suggests that the addition of teff produced the lowest increase in lightness of injera samples while the addition of rice produced highest increase in the L* values of the samples (Figure 6).
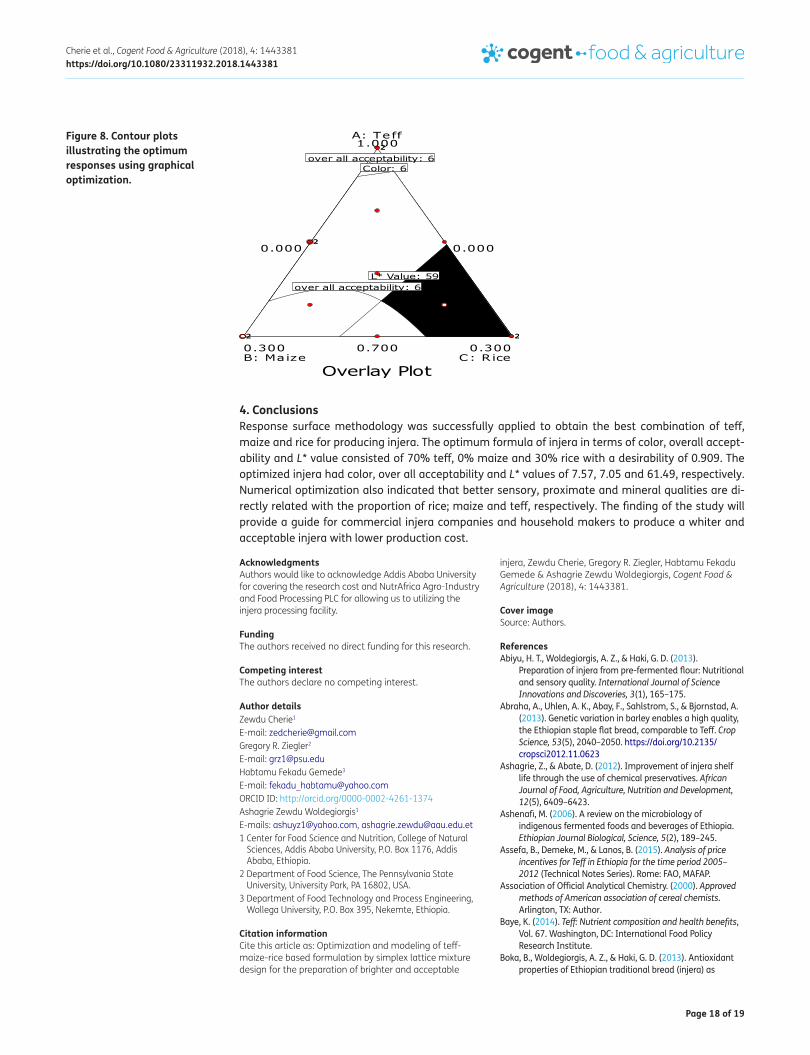
3.5. Optimum formulationPrimary objective of this study is to develop an injera having high qualities with regard to its color, L value, sensory scores for color and overall acceptability was considered for the optimization. Thus, during numerical optimization, an attempt was made to maximize the responses for sensory scores (color, and overall acceptability) and L* value. The ingredient teff was set to minimum while maize and rice was set in ranges. The high relative importance of “5”were assigned to color, and L* values. This is due to the fact that the appearance and color is the most important attributes that influence the consumers to buy a food product (Tipwichai & Sriwattana, 2012). The importance given to the overall acceptability was “3”. Optimization suggested that injera made with 70% teff, 0% maize and 30% rice achieved the best solution for this combination of variables with a desirability of 0.909 (Figure 7). The predicted response values obtained for this developed injera were 7.57, 7.05 & 61.94

Page 17 of 19
Cherie et al., Cogent Food & Agriculture (2018), 4: 1443381https://doi.org/10.1080/23311932.2018.1443381
for color, over all acceptability and L* value, respectively. Graphical optimization also indicated simi-lar results (Figure 8).
In case of graphical optimization for proximate composition, the most importance was assigned again to maximum responses for protein, total carbohydrate and crude fat while minimizing teff and keeping maize and rice in ranges. The overlay plot (figure not shown here) indicates the optimum factor variable levels are 70, 29.1 and 0.9% for teff, maize and rice respectively. The predicated re-sponses were 13.83 g/100 g, 2.48 g/100 g and 76.50% for crude protein, crude fiber and total carbo-hydrate, respectively. Proximate composition of injera for protein, fat and carbohydrate increases progressively as the proportion of maize in the recipe increases.
Graphical optimization with regard to iron content, zinc and calcium content were assigned maxi-mum value while the factor levels remains as above. The overlay plot (figure not shown here) indi-cates the optimum factor variable levels are 88.2, 0.00 and 11.8% for teff, maize and rice respectively. The optimum responses were 22.29 mg/100 g, 1.94 mg/100 g and 47.18 mg/100 g for iron, zinc and calcium contents respectively. Total mineral content of injera for iron, zinc and calcium increases progressively as the proportion of teff in the recipe increases.
Figure 6. Contour and 3D surface plots for L* value obtained using actual-components.
Figure 7. Contour plot of the desirability for multiple response function.
Page 18 of 19
Cherie et al., Cogent Food & Agriculture (2018), 4: 1443381https://doi.org/10.1080/23311932.2018.1443381
4. ConclusionsResponse surface methodology was successfully applied to obtain the best combination of teff, maize and rice for producing injera. The optimum formula of injera in terms of color, overall accept-ability and L* value consisted of 70% teff, 0% maize and 30% rice with a desirability of 0.909. The optimized injera had color, over all acceptability and L* values of 7.57, 7.05 and 61.49, respectively. Numerical optimization also indicated that better sensory, proximate and mineral qualities are di-rectly related with the proportion of rice; maize and teff, respectively. The finding of the study will provide a guide for commercial injera companies and household makers to produce a whiter and acceptable injera with lower production cost.
AcknowledgmentsAuthors would like to acknowledge Addis Ababa University for covering the research cost and NutrAfrica Agro-Industry and Food Processing PLC for allowing us to utilizing the injera processing facility.
FundingThe authors received no direct funding for this research.
Competing interestThe authors declare no competing interest.
Author detailsZewdu Cherie1
E-mail: [email protected] R. Ziegler2
E-mail: [email protected] Fekadu Gemede3
E-mail: [email protected] ID: http://orcid.org/0000-0002-4261-1374Ashagrie Zewdu Woldegiorgis1
E-mails: [email protected], [email protected] Center for Food Science and Nutrition, College of Natural
Sciences, Addis Ababa University, P.O. Box 1176, Addis Ababa, Ethiopia.
2 Department of Food Science, The Pennsylvania State University, University Park, PA 16802, USA.
3 Department of Food Technology and Process Engineering, Wollega University, P.O. Box 395, Nekemte, Ethiopia.
Citation informationCite this article as: Optimization and modeling of teff-maize-rice based formulation by simplex lattice mixture design for the preparation of brighter and acceptable
injera, Zewdu Cherie, Gregory R. Ziegler, Habtamu Fekadu Gemede & Ashagrie Zewdu Woldegiorgis, Cogent Food & Agriculture (2018), 4: 1443381.
Cover imageSource: Authors.
ReferencesAbiyu, H. T., Woldegiorgis, A. Z., & Haki, G. D. (2013).
Preparation of injera from pre-fermented flour: Nutritional and sensory quality. International Journal of Science Innovations and Discoveries, 3(1), 165–175.
Abraha, A., Uhlen, A. K., Abay, F., Sahlstrom, S., & Bjornstad, A. (2013). Genetic variation in barley enables a high quality, the Ethiopian staple flat bread, comparable to Teff. Crop Science, 53(5), 2040–2050. https://doi.org/10.2135/cropsci2012.11.0623
Ashagrie, Z., & Abate, D. (2012). Improvement of injera shelf life through the use of chemical preservatives. African Journal of Food, Agriculture, Nutrition and Development, 12(5), 6409–6423.
Ashenafi, M. (2006). A review on the microbiology of indigenous fermented foods and beverages of Ethiopia. Ethiopian Journal Biological, Science, 5(2), 189–245.
Assefa, B., Demeke, M., & Lanos, B. (2015). Analysis of price incentives for Teff in Ethiopia for the time period 2005–2012 (Technical Notes Series). Rome: FAO, MAFAP.
Association of Official Analytical Chemistry. (2000). Approved methods of American association of cereal chemists. Arlington, TX: Author.
Baye, K. (2014). Teff: Nutrient composition and health benefits, Vol. 67. Washington, DC: International Food Policy Research Institute.
Boka, B., Woldegiorgis, A. Z., & Haki, G. D. (2013). Antioxidant properties of Ethiopian traditional bread (injera) as
Figure 8. Contour plots illustrating the optimum responses using graphical optimization.

Page 19 of 19
Cherie et al., Cogent Food & Agriculture (2018), 4: 1443381https://doi.org/10.1080/23311932.2018.1443381
© 2018 The Author(s). This open access article is distributed under a Creative Commons Attribution (CC-BY) 4.0 license.You are free to: Share — copy and redistribute the material in any medium or format Adapt — remix, transform, and build upon the material for any purpose, even commercially.The licensor cannot revoke these freedoms as long as you follow the license terms.
Under the following terms:Attribution — You must give appropriate credit, provide a link to the license, and indicate if changes were made. You may do so in any reasonable manner, but not in any way that suggests the licensor endorses you or your use. No additional restrictions You may not apply legal terms or technological measures that legally restrict others from doing anything the license permits.
affected by processing techniques and teff grain [Eragrostis teff (Zucc.)Trotter] varieties. Canadian Chemical Transactions, 1, 7–24.
Bultosa, G. (2007). Physicochemical characteristics of grain and flour in 13 teff varieties. Journal of Applied science Research, 3(12), 2042–2051.
Bultosa, G., Hall, A. N., & Taylor, J. R. N. (2002). Physico-chemical characterizationof grain teff (Eragrostis tef (Zucc.)Trotter) starch. Starch/Starke, 54, 461–468. https://doi.org/10.1002/(ISSN)1521-379X
Cherinet, H. (1988). Development of flours using traditional food crops for making injera (FAO Report No. NU-EPTA 380 TA/253/S/12). Rome: FAO.
Cox, D. R. (1971). A note on polynomial response functions for mixtures. Biometrika, 58(1), 155–159. https://doi.org/10.1093/biomet/58.1.155
Demeke, M., & Di Marcantonio, F. (2013). Analysis of incentives and disincentives for teff in Ethiopia (Technical Notes Series). Rome: MAFAP, FAO.
Gamboa, P. A., & Ekris, L. V. (2008). Teff: Survey on the nutritional and health aspects of teff (Eragrostis tef) (pp. 319–367). Cartago: Instituto Tecnológico de Costa Rica.
Gebrekidan, B., & Gebrehiwot, B. (1982). Sorghum injera preparations and quality parameters. In L. W. Rooney and D. S. Murty (eds.), Proceedings of the International Symposium on Sorghum grain quality (pp. 55–66). Patancheru: ICRISAT.
Girma, T., Bultosa, G., & Bussa, N. (2013). Effect of grain teff (Eragrostis tef (Zucc.)Trotter) flour substitutions with flaxseed on mineral content, antioxidant activity, phytic acid content and microbial quality of injera. Science, Technology and Arts Research Journal, 2(3), 51–58. https://doi.org/10.4314/star.v2i3.98733
Islam, M. Z., Taneya, M. L. J., Shams-Ud-Din, M., Syduzzaman, M., & Hoque, M. M. (2012). Physicochemical and functional properties of brown rice (Oryza sativa) and wheat (Triticum aestivum) flour and quality of composite biscuit made thereof. The Agriculturists, 10(2), 20–28.
Jane, J., Shen, L., Wang, L., & Maningat, C. C. (1992). Preparation and properties of small-particle corn starch. Cereal Chemistry, 69(3), 280–283.
Legesse, S. (2015). Effect of Composite Flour Blend of Teff, Sorghum and Maize on Macro Nutritional Quality, Sensory Acceptability and pH Fermentation Kinetics in Preparation of Injera (Unpublished master’s thesis). Addis Ababa: Addis Ababa University.
Lopez, A. C. B., Pereira, A. J. G., & Junqueira, R. G. (2004). Flour mixture of rice flour, corn and cassava starch in the production of gluten-free white bread. Brazilian Archives of Biology and Technology, 47(1), 63–70. https://doi.org/10.1590/S1516-89132004000100009
Mesfin, W., & Shimelis, A. (2013). Effect of soybean/cassava flour blend in the proximate composition of Ethiopian traditional bread prepared from quality protein maize. African Journal of Food, Agriculture, Nutrition and Development, 13(4), 7985–8003.
Mezemir, S. (2015). Probiotic potential and nutritional importance of teff (Eragrostis tef (Zucc) Trotter) enjerra-a review. African Journal of Food, Agriculture, Nutrition and Development, 15(2), 9964–9981.
Nuss, E. T., & Tanumihardjo, S. A. (2010). Maize: A paramount staple crop in the context of global nutrition. Comprehensive Reviews in Food Science and Food Safety, 9, 417–436. https://doi.org/10.1111/j.1541-4337.2010.00117.x
Sadik, J. A., Demelash, B., & Gizaw, M. (2012). Hydration kinetics of teff grain. Agricultural Engineering International: CIGR Journal, 15(1), 124–130.
Seth, D., & Rajamanickam, G. (2012). Development of extruded snacks using soy, sorghum, millet and rice blend–A response surface methodology approach. International Journal of Food Science & Technology, 47(7), 1526–1531. https://doi.org/10.1111/j.1365-2621.2012.03001.x
Tipwichai, B., & Sriwattana, S. (2012). Optimization of strawberry-longan bar formulation using response surface methodology. Journal of Natural Sciences, 11(1), 171–180.
Umeta, M., & Parker, M. L. (1996). Microscopic studies of the major macro-components of seeds, dough and injera from Teff (Eragrostis tef). SINET: Ethiopian Journal of Sciences, 19(1), 141–148.
Yam, K. L., & Papadakis, S. E. (2004). A simple digital imaging method for measuring and analyzing color of food surfaces. Journal of Food Engineering, 61(1), 137–142. https://doi.org/10.1016/S0260-8774(03)00195-X
Yetneberk, S., de Kock, H. L., Rooney, L. W., & Taylor, J. R. (2004). Effects of sorghum cultivar on injera quality. Cereal Chemistry Journal, 81(3), 314–321. https://doi.org/10.1094/CCHEM.2004.81.3.314
Yetneberk, S., Rooney, L. W., & Taylor, J. R. N. (2005). Improving the quality of sorghum injera by decortication and compositing with teff. Journal of the Science of Food and Agriculture, 85(8), 1252–1258. https://doi.org/10.1002/(ISSN)1097-0010