Optimal Sets of Color Receptors and Color Opponent Systems ...chittkalab.sbcs.qmul.ac.uk › 1996...
18
J . theor . Biol . (1996) 181, 179–196 0022–5193/96/140179 + 18 $18.00/0 7 1996 Academic Press Limited Optimal Sets of Color Receptors and Color Opponent Systems for Coding of Natural Objects in Insect Vision L C† Institut fu¨r Neurobiologie , FU Berlin Ko¨nigin -Luise -Str . 28-30, 14195 Berlin , Germany and the Department of Ecology and Evolution , State University of New York, Stony Brook , NY 11794-5245, U.S.A. (Received on 31 August 1995, Accepted in revised form on 12 April 1996) Model calculations are used to find an optimal color vision system for the coding of natural objects. The criteria to assess the quality of color vision are (a) discriminability between all colors of a given set; (b) discriminability between nearest neighbors (only the most similar colors of a set); and (c) detectability (color difference between target and background). The colored objects investigated are several sets of flower colors, one set of green foliage colors, and one set of fruit colors. A large variety of hypothetical color vision systems was generated by varying both the wavelength positions of photoreceptors and the weights of color opponent processes used to evaluate the receptor inputs. It is shown that the set of spectral receptor types in flower visiting bees (lmax = 340, 430 and 540 nm) is close to optimal for the discrimination of several sets of sympatric and simultaneously blooming flower colors, as well as for discrimination of green foliage, but not for fruit coloration. For two sets of objects, the illuminant was varied, which changed the results only marginally. Detectability of flowers against background is likewise optimal. The optimal wavelength positions of photoreceptors are largely independent of the particular color opponent mechanisms used to evaluate the photoreceptor signals. Optimal color opponent systems are all those which comprise two opponent processes with weighting factors differing strongly from one another. The evolutionary implications of these findings are discussed against the background of a recent phylogenetic study which showed that wavelength tuning of insect photoreceptors likely predated the evolution of flower color. 7 1996 Academic Press Limited Introduction Different animal species often see the world in substantially different colors, and it is likely that some of these differences are adaptive for a given colored environment (Lythgoe & Partridge, 1989, 1991; Chittka & Menzel, 1992; Endler, 1992; Nagle & Osorio, 1993). It is often difficult to pin-point which components of the environment might drive the evolution of color vision, but in flower-visiting Hymenoptera, the evolutionarily significant objects are comparatively easily determined. Plants contain the major nutrition—pollen and nectar—for these insects, and they advertise these rewards by means of species-specific signals, the flowers (Feinsinger, 1987; Kevan & Baker, 1983; Menzel & Shmida, 1993; Chittka et al ., 1993; Waser et al ., 1996) The swift detection of such signals from their background is thus of vital interest. Furthermore, bees have to make economic choices within a multitude of different flower species with different colors and information contents about rewards and their accessibility (Giurfa et al ., 1995). Selection will thus favor flower-visitors that are able to learn the features of any plant species and distinguish it from others in a community. Accumulating confusions of floral signals may result in a decrease in foraging efficiency, and thus in a reduced fitness of the pollinator. Consequently, the ability to discriminate and detect floral colors is par- ticularly important for anthophilous Hymenoptera. Indeed, it was shown that the sets of spectral receptor types in Apidae (l max = 340, 430 and † Present address: Ecology & Evolution, State University of New York, Stony Brook, NY 11794-5245, U.S.A. Email: chit- tka.life.bio.sunysb.edu 179
Transcript of Optimal Sets of Color Receptors and Color Opponent Systems ...chittkalab.sbcs.qmul.ac.uk › 1996...

J. theor. Biol. (1996) 181, 179–196
0022–5193/96/140179+18 $18.00/0 7 1996 Academic Press Limited
Optimal Sets of Color Receptors and Color Opponent Systems for Coding of
Natural Objects in Insect Vision
L C†
Institut fur Neurobiologie, FU Berlin Konigin-Luise-Str. 28-30, 14195 Berlin, Germany andthe Department of Ecology and Evolution, State University of New York, Stony Brook,
NY 11794-5245, U.S.A.
(Received on 31 August 1995, Accepted in revised form on 12 April 1996)
Model calculations are used to find an optimal color vision system for the coding of natural objects.The criteria to assess the quality of color vision are (a) discriminability between all colors of a givenset; (b) discriminability between nearest neighbors (only the most similar colors of a set); and (c)detectability (color difference between target and background). The colored objects investigated areseveral sets of flower colors, one set of green foliage colors, and one set of fruit colors. A large varietyof hypothetical color vision systems was generated by varying both the wavelength positions ofphotoreceptors and the weights of color opponent processes used to evaluate the receptor inputs. It isshown that the set of spectral receptor types in flower visiting bees (lmax=340, 430 and 540 nm) isclose to optimal for the discrimination of several sets of sympatric and simultaneously blooming flowercolors, as well as for discrimination of green foliage, but not for fruit coloration. For two sets of objects,the illuminant was varied, which changed the results only marginally. Detectability of flowers againstbackground is likewise optimal. The optimal wavelength positions of photoreceptors are largelyindependent of the particular color opponent mechanisms used to evaluate the photoreceptor signals.Optimal color opponent systems are all those which comprise two opponent processes with weightingfactors differing strongly from one another. The evolutionary implications of these findings are discussedagainst the background of a recent phylogenetic study which showed that wavelength tuning of insectphotoreceptors likely predated the evolution of flower color.
7 1996 Academic Press Limited
Introduction
Different animal species often see the world insubstantially different colors, and it is likely that someof these differences are adaptive for a given coloredenvironment (Lythgoe & Partridge, 1989, 1991;Chittka & Menzel, 1992; Endler, 1992; Nagle &Osorio, 1993). It is often difficult to pin-point whichcomponents of the environment might drive theevolution of color vision, but in flower-visitingHymenoptera, the evolutionarily significant objectsare comparatively easily determined. Plants containthe major nutrition—pollen and nectar—for theseinsects, and they advertise these rewards by means ofspecies-specific signals, the flowers (Feinsinger, 1987;
Kevan & Baker, 1983; Menzel & Shmida, 1993;Chittka et al., 1993; Waser et al., 1996) The swiftdetection of such signals from their background isthus of vital interest. Furthermore, bees have to makeeconomic choices within a multitude of differentflower species with different colors and informationcontents about rewards and their accessibility (Giurfaet al., 1995). Selection will thus favor flower-visitorsthat are able to learn the features of any plantspecies and distinguish it from others in a community.Accumulating confusions of floral signals may resultin a decrease in foraging efficiency, and thus in areduced fitness of the pollinator. Consequently, theability to discriminate and detect floral colors is par-ticularly important for anthophilous Hymenoptera.
Indeed, it was shown that the sets of spectralreceptor types in Apidae (lmax=340, 430 and
† Present address: Ecology & Evolution, State University of NewYork, Stony Brook, NY 11794-5245, U.S.A. Email: chit-tka.life.bio.sunysb.edu
179

. 180
540 nm) are very close to optimal for distinguishingbetween floral hues of one particular set of 180Israeli flower colors (Chittka & Menzel, 1992). Thisconclusion must be further substantiated. First, it isconceivable that this result is obtained with only oneparticular set of flower colors, but fails in severalothers. Second, it is also important to distinguishflowers from the background, not only from signalsof other species in the same environment. Third, thephotoreceptors do not solely define the metrics of ananimal’s percept of color. It is also important toconsider the mechanisms of color coding with respectto the ecological demands of a species. Here I describenovel model calculations to find optimal solutionsfor all of these tasks. Finally, a recent phylogeneticanalysis revealed that bee color vision may be olderthan the emergence of angiosperm flowers (Chittka,1996). Thus, I will examine the possibility thatwavelength positions of insect UV-, blue and greenreceptors are adapted to code for objects in apre-angiosperm world, such as green leaves.
Methods
The reflectance spectra of flowers were measuredby means of a photodiode-array-spectrophotometer(SR01, Fa. Grobel; Ettlingen; Germany). The readeris referred to Chittka & Menzel (1992) for preparationof flowers and details of the measurement procedure.Several samples of natural colors are evaluated here.These include six sets of flower colors from specieswhich are all blooming sympatrically and simul-taneously, including a German dry grasslandmeadow, a Brazilian Cerrado, a Norwegian and oneAustrian Alpine valley, and a German continentalforest [Chittka (1993), all of these were measured inthe summer] the Hatzeva desert in Israel in spring(Menzel & Shmida, 1993). Further sets of naturalstimuli are a collection of 230 leaf reflectance spectra(Chittka et al., 1994) and a set of fruits from 35different species purchased in a Berlin departmentstore (Chittka, unpublished).
Spectral sensitivity of a photoreceptor with a givenlmax is calculated according to Stavenga et al.(1993). The relative amount of light absorbed by eachphotoreceptor color type is:
P=Rg700
300
IS (l)S(l)D(l)dl (1)
where IS (l) is the spectral reflectance function of thestimulus in question; S(l) is the spectral sensitivityfunction of the receptor in question and D(l) is theilluminating daylight spectrum. Normfunction D65(Wyszecki & Stiles, 1982) is employed wherever openhabitats are concerned (Fig. 1). For two sets of stimuli(the German continental forest habitat, and the set ofgreen leaves) the model calculations were alsoperformed using a forest shade spectrum [courtesy ofDr. John Endler, see Endler (1993)]. This measure-ment extends only down to 350 nm; however, allinsects so far tested have UV receptors which aremaximally sensitive at about this value (Chittka,1996), and whose sensitivity extends considerablybelow 350 nm. For this reason, the spectrum wasextrapolated to 300 nm in a gentle slope, followingleaf reflectance measurements which covered theentire range from 300–700 nm (Chittka et al., 1994).The resulting spectrum is shown in Fig. 1. Thesensitivity factor R in eqn. (1) is determined by theequation
R=1/g700
300
IB (l)S(l)D(l)dl (2)
IB (l) is the spectral reflection function of the back-ground to which the receptors are adapted. With thismodel, it is assumed that the photoreceptors displayhalf their maximal response when stimulated by thelight reflected from the adaptation background.While this assumption may fail when stronglychromatic backgrounds are used (Dittrich, 1995) itpredicts the relative sensitivities of the photoreceptorswell so long as the background has a roughlyequiproportionate reflectance over the visual spec-
F. 1. Illumination functions employed in the present study,normalized to a maximum of unity. The continuous line denotesthe normfunction D65 (Wyszecki & Stiles, 1982); the dashedline is a function measured in forest shade (courtesy of Dr JohnEndler).

181
trum (Brandt et al., 1993), as is the case for mostnatural background materials in the visual range oftrichromatic insects (Daumer, 1958; Lythgoe, 1979;Endler, 1992; Chittka et al., 1994). Only for receptorswith lmaxQ 350 nm, eqn (2) will produce unrealisti-cally high sensitivities relative to the other tworeceptor types (Chittka & Menzel, 1992). Helversen(1972) found that the honeybee’s UV receptor is notmore than 16.5 times more sensitive than the greenreceptors under illumination conditions practicallywithout UV. Hence it is assumed that receptors withlmaxQ 350 nm are maximally 16.5 times moresensitive than a green receptor at 550 nm. For furtherdetail, see Chittka & Menzel (1992).
The quantum catch in the photoreceptors P[eqn (1)] is the input to the photoreceptors, notthe input to the insect brain. On a neural level, thebrain performs ‘‘calculations’’ with graded poten-tials generated by receptor cells. These signals arenot linearly related to the logarithm of thequantum flux that forms the input to the receptor(Naka & Rushton, 1966). When the maximumexcitation Emax of the photoreceptors is set to one,the nonlinear phototransduction process is welldescribed by
E=P/(P+1) (3)
where P is the stimulus strength [eqn (1)], in unitssuch that for P=1, E=0.5 [i.e. half the maxi-mum potential; Naka & Rushton (1966)]. With thetransduction process modeled in this fashion, veryprecise predictions of both electrophysiological(Lipetz, 1971; Laughlin, 1989) and behavioral(Valberg, 1986; Backhaus, 1992) data are possible,even when stimulus intensity is varied over several logunits. The three excitation values in the bee’s UV,blue and green receptors can be depicted in athree-dimensional receptor excitation space [Fig. 2(c)]or in the color hexagon [Fig. 2(d)]. The geometry ofthe color hexagon has been described elsewhere indetail (Chittka, 1992). Since, however, this color spaceforms a conceptual axis in the present paper, linkinggraphically the photoreceptor signals and varioussystems of opponent coding, I will outline its basicphilosophy here. The color hexagon may beunderstood as a two-dimensional projection of thethree-dimensional receptor space [Fig. 2(d)]. Thisprojection is legitimate because Hymenoptera ofseveral genera do not evaluate the brightnesscomponent of color signals at the feeding site(Chittka et al., 1992). With the three receptorexcitation values now plotted at angles of 120°
[Fig. 2(d, e)], the x and y coordinates in the colorplane are given by:
x=cos 30°*(EL −ES)
\ x=z3/2*(EL −ES) (4)
and
y=EM −0.5*(EL +ES) (5)
where ES, EM and EL are the inputs from the short,middle and long wave receptors [according to eqn (3)].Since the wavelength positions of receptors will bevaried in the model calculations to be describedbelow, we will use these more general indices ratherthan EU, EB and EG.
The excitation A of a color opponent mechanism isdefined by
A= aES + bEM + cEL. (6)
a, b, c are the weighting factors. We define thata+ b+ c=0; this is necessary on theoreticalgrounds for an intensity-independent perception ofwhite (Chittka et al., 1992; Abramov & Gordon,1994). Moreover, this condition has been explicitlyshown to hold in the honeybee (Backhaus, 1991).Thus,
A= aES + bEM −(a+ b)EL. (7)
From (2) and (3), it follows that:
ES =EL −2/z3*x
and
EM = y+EL − x/z3
Thus, replacing ES and EM in eqn (7), we obtain:
A= a*(EL −2/z3*x)
+ b*(y+EL − x/z3)(a+ b)*EL
\ A= − x/z3*(2a+ b)+ b*y. (8)
Thus, the excitation value for any opponentmechanism with known weighting factors a and b canbe derived from the hexagon coordinates x and y,provided that a+ b+ c=0. To read the excitationvalue for such an opponent mechanism directly fromthe hexagon coordinates determined by a givencolored stimulus with receptor excitation values ES,EM and EL, it is useful to draw a color opponent axisthrough the color plane. For this purpose, we mustfind the linear equation y=mx+ n that correspondsto an opponent axis with known weighting factors.

182
F. 2. From object spectral reflectance to a locus in the color hexagon, and further to a point in an opponent color space. (a) showsthe reflection function of Lotus corniculatus, a flower which appears yellow to humans and green to bees. (b) Receptor excitations EU,EB and EG are calculated according to eqns (1–3). Excitation values are given relative to the maximum possible excitation in each receptortype. c) EU, EB and EG plotted as vectors in a three-dimensional receptor excitation space. Dashed lines denote the back side of the cube.The vectors originate in the point marked ‘‘0’’. The brightness dimension corresponds to an axis linking the point marked ‘‘0’’ and theupper frontal corner. The tip of the EG-vector indicates the point generated by Lotus in color space. (d) The color hexagon is atwo-dimensional projection of the three dimensional color space. Consider the cube in (c) with the brightness dimension removed—theprojected plane of the cube is a hexagon. Vectors EU, EB and EG then come to lie at equal angles of 120°. (e) These three vectors can beeasily converted into orthogonal X/Y coordinates trigonometrically. In the Y direction, the weight of EB is +1, whereas those of EU andEG are −0.5. On the X axis, the weights for EU and EG are −cos 30° and +cos 30°, respectively. The triangle marks the color point occupiedby Lotus as determined by the three vectors EU, EB and EG in Fig. 1(d). (f) Any two-dimensional color opponent space defined by twoof the three eqns (12–14) is a linear transformation of the color hexagon. For simplicity, the example given is a plane whose dimensions(blue vs. UV-green, and UV vs. green) correspond directly to the X/Y coordinates in the color hexagon. In general, the color opponentspace is constructed using two scales corresponding to two different formulae of the kind A= aEU + bEB + cEG (where a+ b+ c=0)and plotting these scales orthogonally.

183
For simplicity reasons, I will start out by constructingan axis which runs through the origin (the center ofthe hexagon), i.e. n=0. In this case, the slope m isdetermined by m= y/x. Replacing the receptorexcitations ES, EM and EL in the equation by theirweights a, b and c, we obtain:
m=b−0.5*(a+ c)z3/2*(c− a)
\ m=z3b
−2a− b,
since a+ b+ c=0. Thus, the linear equation for anopponent axis with known weighting factors a and bis:
y=z3b× x−2a− b
(9)
when the axis runs through the origin. For somepurposes, it may be convenient to displace the axisparallely, so that it retains the same orientation, butno longer runs through the center of the hexagon(Chittka et al., 1992). For this reason, the y-interceptn in the linear equation y=mx+ n must bedetermined. If we know the coordinates x1 and y1
which we want to be intercepted by the opponent axis,n is determined by n= y1 −mx1. Thus,
n= y1 −z3b
−2a− bx1. (10)
Adding the y intercept [according to eqn (10)] toeqn (9), the entire linear equation for a coloropponent axis with weighting factors a and b, whichruns through a point x1, y1, is as follows
y=z3b
−2a− b× x+ y1 −
z×3−2a− b
x1
\ y=z3b/(−2a− b)(x− x1)+ y1 (11)
In some of the model calculations to be describedbelow, different pairs of color opponent mechanismswill be generated, to see how opponent coding affectscolor discriminability. There are three possible coloropponent mechanisms that follow eqn (6). These are:
S vs. ML
A= aES + bEM + cEL where a=1(12)
M vs. SL
B= aES + bEM + cEL where b=1(13)
L vs. SM
C= aES + bEM + cEL where c=1(14)
and a+ b+ c=0 in all these three (see above).
One of the variable factors in each of theseequations will be varied from 0 to 1 in steps of 0.25,so that five versions of each color opponentmechanism (12–14) are generated. Figure 3 showshow the five sets of weighting factors for the S vs. MLmechanism relate to color opponent axes in thehexagon. I have chosen the convention that all axesassigned to the mechanisms (12–14) should runthrough one of the corners of the color hexagon. Forexample, for the S vs. ML mechanism (Fig. 3), all axesintercept the lower left (labeled U) corner of the
F. 3. Relationship of color opponent axes in the hexagon andweighting factors of five color opponent mechanisms according toeqns (11) and (12). Mechanisms with mirror image inputscorrespond to the same axis (Chittka et al., 1992). All axes interceptthe ‘‘U’’ corner of the hexagon, to make explicit the fact that in allopponent processes illustrated here, the weighting factor for EU is1. The weights of EB and EG are varied, and their relative strengthscan be estimated by evaluating the distance at which the axesintercept the straight line between the B and G corners of thehexagon. For example, when the weight for EB is 1 and that for EG
is 0, as in the lower hexagon symbol, the axis will run through theB corner. When both weights are equal (0.5, as in the centralhexagon symbol), the axis will cut the straight line between the Band G corners into two equal portions.
. 184
hexagon [i.e. x1 = −z3/2 and y1 = −0.5 ineqn (11)]. For the M vs. SL opponent mechanism, allaxes run through the upper corner (B) of the hexagon,and for the L vs. SM mechanism, all axes intercept thelower right corner (G). On three levels, thisconvention makes explicit which weighting factors areused for the opponent processes, and how they arevaried: (a) If one of the weighting factors a, b or c inthe equation A= aES + bEM + cEL is 1 or −1, theaxis will run through one of the corners of thehexagon which correspond to the endpoints of the ES,EM or EL vectors. When a=1, this will be the lowerleft corner (the endpoint of the ES vector), and soforth (Fig. 3). If two weighting factors in a singlecolor opponent process are 1 and −1, two corners ofthe hexagon will be connected. (b) When oneweighting factor is constant, and the other two varied,all axes corresponding to the set of opponentprocesses so generated will run through the samecorner of the hexagon. This corner is determined asin (a); (c) the relative strength of the two variedweighting factors can be easily estimated. In Fig. 3,factors b and c are varied from 0 to 1 (or 1 to 0,respectively), these weights are expressed in terms ofwhere the axis intersects the straight line between theendpoints of the EM or EL vectors. For example, ifboth b and c are 0.5, the corresponding axes willintersect this line in the middle.
The difference between two color opponentmechanisms can be estimated by measuring the anglebetween the two hexagon axes corresponding to thesemechanisms (Chittka, 1992). If this angle is small, thetwo mechanisms will render similar values for a givenset of stimuli. In other words, the informationprovided by two color opponent mechanisms is highlyinterdependent, and thus redundant, when anglesbetween axes are minimal. Thus, it is predicted thatnatural color coding systems should use opponentmechanisms whose assigned axes differ significantlywith respect to their orientation in the hexagon.Indeed, when one looks at color opponent systems inseveral species of trichromatic Hymenoptera, onefinds that the axes corresponding to their individualcolor opponent mechanisms are usually large(Chittka et al., 1992).
Model Calculations and Results
If the wavelength position of a photoreceptor isaltered, the two-dimensional distribution of color lociin the color space changes (Fig. 4). Correspondingly,
the perceptual distances between colors change.Detectability is optimal when the color distances of allfloral color loci to their background are maximized.To test which spectral photoreceptor set is optimal forthis purpose, I used a background reflectance curveaveraged from several green leaves (Chittka et al.,1994). I then proceeded to vary the wavelengthpositions of the spectral receptors, to see how thisvariation effects color distances between 180 Israeliflower colors and the green foliage locus in colorspace. Since the three receptor signals are assumed tobe adapted to the background reflectance, the greenfoliage locus comes to lie in the center of color space.
In each of three variations, one receptor was variedin 10 nm steps, and the two others were held constantat the wavelength positions where they occur inHymenoptera. For every such combination ofphotoreceptors all differences between flower colorsand the green foliage point in the hexagon arecalculated and summed up (Fig. 5). The resultingoptima for these sums of perceptual differences at 330,430 and 550 nm agree very well with the photo-receptor wavelength positions as found in the eyes ofHymenoptera (Fig. 5, inset). The calculated optimalphotoreceptors deviate from the most frequent ‘‘real’’receptors by maximally 10 nm.
The trichromatic receptor set of most bee species isalso well adapted for discrimination between flowercolors of different species, when the quality of thesystem is assessed by the sum of all color differencesbetween all objects in question (Chittka & Menzel,1992). Alternatively, one might argue that discrim-inability of objects with large color differences neednot necessarily be maximized. Signals that are locatedfar apart in a color space determined by one set ofsensory inputs will, with some probability, also be farapart in a color space whose sensory inputs have beenaltered. Thus, I also calculated an optimal photo-receptor set by evaluating only the nearest neighborcolor differences in color space.
To this end, I determined the three closest color lociof the flowers of different species from each floralcolor locus. All of these values were summed for eachset of spectral receptor types. As in the modelcalculations described above, the resulting optima forthe S-, M- and L-receptors correspond closely tothose found in trichromatic bees and wasps, and sotheir color vision is also well suited to distinguishflower colors of high similarity, i.e. such signals whichare most likely to be confused (Fig. 6, lines with shortdashes).

185
F. 4. Distribution of 1063 flower color loci in color space, depending on the wavelength positions of receptors. The short wave receptoris fixed at lmax=340 nm, and the long wave receptor at lmax=540 nm. The middle wave (M) receptor is shifted from 360 to 520 nmin 20 nm steps. The irregular polygon inside the hexagon is the spectrum locus, which marks the periphery of the color space outside whichno loci can be reached. It connects the color points generated by monochromatic lights from 300 to 550 nm, in 10 nm steps. Since thelocus of a single wavelength changes with intensity (Backhaus, 1992; Chittka, 1992), intensity is adjusted in each spectral light to generatea maximal distance between color locus and uncolored point. The S and L ends of the spectrum locus are connected by mixing 300 and550 nm in nine mixture ratios. Floral reflectance data from Chittka et al. (1994).
Is this result a consequence of fixing two receptorsand shifting only the third one? Would a shift of theentire receptor set yield unchanged information fordifferent wavelength positions, or is the tuning of theentire set also critical? To answer this question, asimulation was performed in which all three receptorswere shifted in concert, keeping the wavelength
spacing between receptors constant. The differencebetween the lmax of the S receptor and that of the Mreceptor is commonly 090 nm, whereas the differencebetween the S and L receptors is most often 0200 nm(Peitsch et al., 1992). These differences were used inthe simulation. The S-receptor was shifted from 300to 450 nm in 10 nm steps, and the other two assumed

. 186
F. 5. Optimal wavelength positions of photoreceptors fordetection of floral colors against green foliage. In each of threevariations, two receptors were clamped at the wavelength positionswhere they most frequently occur in Hymenoptera (lmax =340, 430,540 nm, see inset), and the third was shifted in 10 nm steps from300 to 400 nm, from 400 to 500 nm or from 500 to 600 nm. Foreach combination of spectral receptor types, distances between allfloral color loci and the green foliage background were determined.All of these distance values were summed up, and plotted in thediagram so that the maximum of each curve equals one. The insetshows the absolute number of photoreceptors recorded at everygiven lmax for 40 different species of Hymenoptera (Peitsch et al.,1992).
Thus, not only the spacing but also the absolutewavelength tuning of the photoreceptor set is criticalfor discrimination of natural objects. The simulationgenerates a secondary peak at the following positions:lmax =430, 520, 630 nm, which is interesting becauseS and M receptor positions close to these values arecommon in many mammals (Jacobs, 1993).
So far I have tested discriminability of objects thatthe individual insect might not necessarily encountersimultaneously, or even during its lifetime. The aboveconsiderations refer to the general concept that ananimal should be able to distinguish as many colorsof biologically relevant objects as precisely aspossible. From an ecological point of view, it islikewise interesting to ask if pollinator color vision isoptimally suited to discern floral colors that occur inclose spatial relationship. For this purpose I selectedsix sets of sympatric plant species which bloomsimultaneously. The distinction of these flowers is atask encountered by any insect that forages in theseplant arrays; successful distinction should be closelylinked to foraging performance.
Optimal photoreceptor wavelength positions weredetermined for each of these habitats by using thecriterion of maximal color distances between all floralcolor loci as above (Fig. 7). The results are consistentfor all the six habitats: the optimal photoreceptorsalways occur at those wavelengths where they arepositioned in trichromatic bees, at around 340, 430and 540 nm. For the flowers that bloom under aclosed forest canopy, such as those from the Germancontinental forest, the illuminant may deviatesubstantially from normfunction D65 (Fig.1). Thus,the same model calculation is performed using aforest shade illumination function from Endler(1993). While the shapes of the curves become flatter,implying that under such conditions the wavelengthpositions are somewhat less critical, the optimalpositions are maintained at similar values:lmax=330, 430 and 560 nm.
Optimal sets of three color receptor types were alsomodeled by shifting all three photoreceptors indepen-dently, using 20 nm steps (Chittka & Menzel, 1992).All three types were moved from 300–660 nm, so thatlmax(M)q lmax(S) and lmax(L)q lmax(M). Thisvariation thus generates 969 sets of photoreceptors.These cover combinations with constant wavelengthspacing as in real sets of insect photoreceptors(0100 nm), but shifted positioning of the entire set.A combination of photoreceptors close to that ofprimate trichromats is also included (lmax= 0 440,
positions with constant distances to the S receptor.Under these conditions, the optimal set (lmax =330,420, 530 nm) is only 10 nm away from the mostcommon ‘‘real’’ set (lmax =340, 430, 540 nm; Fig. 6).
F. 6. Optimal sets of three spectral receptor types for thediscrimination of flower colors. The spread of 180 flower colors wasmeasured depending on which set of spectral photoreceptors wasused. For every such set all the hexagon distances between everypair of color signals were determined. The sums of all thesedistances are plotted for each receptor set tested (result taken fromChittka & Menzel, 1992). The curves with short dashes denote thesums of nearest neighbor color distances only. Both optimalitycriteria yield almost indistinguishable results. Sums of colordistances are also shown for a simulation in which the spacingbetween photoreceptors was kept constant at values mostfrequently found in Hymenoptera, i.e. lmax(M)− lmax(S)=90 nm,and lmax(L)− lmax(M)=110 nm (triangles and long dashes). Theabscissa denotes the S receptor position for this simulation.

187
F. 7. Optimal color receptors for six sets of sympatric andsimultaneously flowering species. As in Figs 5 and 6, the S receptorwas varied while the M and L receptors were held constant, thenthe optimal M receptor was determined with the other two fixed,and so forth. (a) —, Israeli desert (25); – –, Continental forest (13);–w–w–w–, Forest illumination. (b) —, Dry grassland (35); – – –,Brazilian cerrado (31). (c) —, Austrian alpine (27); – – –,Norwegian alpine (43). The Israeli data are taken from Menzel &Shmida (1993), the other from (Chittka, 1993; Chittka et al., 1994).All flowers are assumed to be illuminated by light followingnormfunction D65, except those from the German continentalforest, for which the same calculations were additionally performedusing a forest shade function (Fig. 1, Endler, 1993). Values behindgeographical specifications denote the number of species tested.
(Table 1). The small differences between habitats canprobably be explained by slightly different distri-butions of floral color loci, although the frequenciesin the six color categories in the hexagon (Chittkaet al., 1994) are surprisingly similar between mosthabitats so far tested (Chittka, 1993).
The environment of a photoreceptor consists notonly of the outside world, but also of the brain whichit provides with information. The initial stage of colorinformation processing in the bee and wasp visualsystem is color opponent coding (Chittka et al., 1992).It is possible that the optimal color receptors maychange when the color opponent system is changed,and vice versa. This is likely since the distribution ofcolor loci in color space changes drastically when thecolor opponent processes are altered (Fig. 8). So far,we have used a standardized color opponent space,the color hexagon, for our considerations. We willnow examine if the optimal receptor wavelengthpositions will be maintained when subsequent colorcoding is altered. The same set of 180 Israeli flowercolors is used as above.
Figure 9 shows that, indeed, the optimal receptorwavelength positions do depend on the set ofopponent processes used. The differences for theoptimal S receptor are marginal, although the curveshapes differ somewhat from one color opponentsystem to another. The same is essentially true for theM and L receptor, where in most cases the optimacontinue to agree well with the lmax values ofHymenopteran trichromats. However, both for the Mand L receptor, there is one case of opponent systemwhere the curve becomes rather flat in the long waverange and actually has two optima. This concerns thecase in which one of the color opponent mechanismsis an M-S mechanism without any contribution fromthe L receptor (symbolized by open circles). Thus,while in most cases so far tested the optimal colorreceptors are independent of the opponent codingsystem, there may be exceptions to this rule.
We will now examine this question further, by (a)generating a large range of color opponent systems;and (b) calculating, for each of these systems, theoptimal lmax values for three spectral photo-receptors by varying all three receptors independentlyalong the wavelength scale. Three opponent mechan-isms are considered [see eqns (12–14)]: S vs. ML(eqn 12), M vs. SL (13), and L vs. SM (14), and eachof them with weighting factors varied in five steps (seeMethods). These mechanisms will be combined inpairs 12 & 13, 12 & 14 and 13 & 14, to form
520 and 560 nm).The quality of the photoreceptorsets produced in this variation was assessed as above,by summing all distances between all color loci.Almost invariably, sets with lmax=320, 420,560 nm are better than all other combinations tested

. 188
T 1The optimal wavelength positions of S, M and L-receptors for several
sets of natural colorslmax S lmax M lmax L Illuminant
Norwegian alpine 320 420 560 D65Austrian alpine 320 420 560 D65Continental forest 320 420 560 D65Continental forest 340 440 580 Forest shadeDry grassland 320 420 560 D65Cerrado 340 420 560 D65Desert 340 420 560 D65Green foliage 320 420 560 D65Green foliage 320 440 580 Forest shadeFruits 320 520 580 D65
All three receptors are varied independently in 20 nm steps over the range from 300to 660 nm.
two-dimensional color opponent systems. For each ofthese combinations, there are 25 (5×5) possibilitieswith specific weighting factors.
In Fig. 10, three matrices are shown whichcorrespond to these three combinations, with 5×5possibilities each, corresponding to the specificcombinations of weighting factors. The lmax of theoptimal color receptors are quite insensitive to theparticular color opponent system used. For a widerange of such systems the optimal color receptors areplaced at 320 nm for the S-receptor, 420–440 nm forthe M-receptor, and 540–560 nm for the L-receptor,which matches well with the three types of colorreceptors found in 40 species of Hymenoptera(Peitsch et al., 1992). Only for a single combinationof two color opponent mechanisms do we find atrichromatic set in which the deviation of one of theoptimal lmax from those of real Hymenopteraexceeds 20 nm (right matrix, 5th row, 4th column,where lmax L=580 nm). In a few cases of coloropponent systems, the model calculations find anoptimal solution where two of the lmax are identical,i.e. the optimal receptor set then consists of only twophotoreceptors.
Which systems are these? Figure 10 shows thatdichromacy is favored precisely in those coloropponent systems which revert to the one-dimen-sional condition, i.e. where the angles between thecolor hexagon axes are small, as in lower right cornerof the right and the lower matrix, and the upper rightcorner of the left matrix. The shaded area of Fig. 11can be compared with the shaded areas in Chittkaet al. (1992, fig. 8), which show the range of coloropponent systems that can account for behavioralcolor discrimination data in nine species of beesand wasps. The shaded areas are clearly similar inshape. The implication is that, with the sets of twocolor opponent processes possibly implemented inHymenoptera, the optimal photoreceptor wavelength
positions will remain stable and independent of theprecise weighting factors of the opponent system.
When one searches for the best possible coloropponent system by comparing the total sums ofcolor distances between all flowers (values in bracketsin each square), one finds that this optimum is locatedin the corners marked by thick black arrows, i.e. fora combination of one UV vs. blue mechanism and aUV vs. green mechanism. The distribution of floralcolor loci in a color space whose metrics aredetermined by these two mechanisms is shown inFig. 8 (middle). However, the precise combination ofcolor opponent mechanisms can hardly be consideredcritical, since the total sums of color differences donot differ substantially between squares. The mini-mum of 9347 (lower matrix, third row, fourthcolumn) is only 20% below the maximum at 11 695.
Differences in quality of various color opponentsystems become much more pronounced whenanother optimization criterion is used. Figure 11shows the optimal photoreceptor wavelength pos-itions for the same range of color opponent systemsas Fig. 10, but in this case only the threenearest-neighbor-distances are calculated from eachflower color locus (see above). With this criterion, theoptimal receptor wavelength positions for each coloropponent system are even more stable than when alldistances between color loci are taken into account.Almost invariably, the optimal lmax are 320,420–440 and 540–560 nm. In no cases do thecalculations arrive at an optimum where twophotoreceptors have identical wavelength positions asin Fig.10. There are, however, a few combinationsof color opponent mechanisms where lmax(M)=400 nm, which differs from the most frequent Mreceptors in bees by 30 nm. What is noticeablydifferent in comparison with Fig. 10 is the degree towhich different color opponent systems producedifferent total sums of color distances between floral

189
color loci. The maximum sum of color distances is16.5 (squares shaded dark gray) whereas the minimalsum reaches only 24% of this value, 3.9. Thisminimum occurs in dichromatic cases, where twoidentical opponent mechanisms both combine theinputs from the same two receptor types (lower rightcorner in the right and lower matrix, and the upperleft corner in the upper left matrix).
F. 9. Optimal color receptors for five different color opponentsystems. Two receptors were clamped constant in the threevariations, and the third was varied over the indicated range. Thisprocedure was repeated five times for five different combinationsof color opponent processes. In all of them, one of the processesis an L-S mechanism as indicated by the horizontal axis in the inset.The second axis is an M−(aS+ cL) mechanism, where a+ c=1and a is varied in five steps from 0 to 1, as shown by the five axisthrough the hexagon inset. The curves in the three subfigures linksymbols which correspond to one particular color opponent axis asindicated by the symbols in the inset. The ordinate specifies thetotal sum of all distances between floral color loci.
F. 8. The spread of color loci depends not only on wavelengthposition of color receptors, but also on opponent coding. This isexemplified using three combinations of two color opponentmechanisms. The same set of flower color loci is displayed as inFig. 4. Mechanisms are specified both with weighting factors andby giving their angular orientation in the color hexagon. One of thetwo mechanisms is a B-U mechanism in all three systems; the otheris varied. The spectrum locus is calculated for background lightintensity from 300 to 550 nm. For further explanation see Fig. 4.
As in Fig. 10, the maximal sum of colordistances is found for a combination of an Svs. L opponent mechanism and an S vs. Mmechanism. However, there are several combinationsof other mechanisms which yield sums of colordifferences only marginally below this value. Seven

. 190
F. 10. The range of color opponent systems for which the optimal color receptors are close to those of trichromatic bees. Three matricesare shown which specify the combinations of opponent mechanisms modeled. Each square in the matrices is assigned to one particularcombination of two color opponent mechanisms. The specific weighting factors for each square are denoted by color hexagon symbolsin the margin of the matrix. The matrices are connected because each shares common rows or columns with the two others. Where thisconnection cannot be made directly, by placing the matrices next to each other, this is indicated by arrows. Each color hexagon symbolcontains one axis which specifies the weighting factors for a given color opponent mechanism [see Chittka (1992) for details]. For eachcombination of two color opponent mechanisms, the optimal color receptors are determined by varying all three color receptors freelyalong the wavelength scale from 300 to 660 nm in 20 nm steps, with the only restriction that lmax(L)q lmax(M) and lmax(M)q lmax(S). Thus,969 sets of color receptors are generated for each color opponent system. The lmax of the respective optimal color receptors for eachmodel are given in each square; the value in brackets below denotes the total sum of color distances between all flower colors for thatparticular color opponent system with the color receptors shown above. The shaded area marks the range of color opponent models forwhich none of the three color receptors have lmax with q20 nm difference to the most frequent lmax in trichromatic Hymenoptera (i.e.340, 430, 540 nm; Peitsch et al., 1992).
models of 61 tested are only 1% worse than theoptimum. More than a third (22) of all models lie inthe area shaded light gray, which comprises allsystems with color discriminability up to10% below the optimum.
-
Finally, optimal wavelength positions are deter-mined for the discrimination of two sets of non-floralobjects, using the ‘‘nearest-neighbor optimality

191
F. 11. Optimal receptor wavelength positions for the same range of color opponent systems as in Fig. 9. Values in brackets show thesum of all sets of three nearest-neighbor-distances from all flower colors. The dark gray area marks the combination of color opponentmechanisms with the highest such sum. The area shaded light gray encompasses all color opponent systems which generate a sum of colordistances maximally 10% below the optimum. For further explanations see Fig. 10.
F. 12. Optimal sets of color receptors for discrimination ofleaves and fruits. For green foliage, the procedure is repeated for twoillumination functions (D65 and forest shade) whereas for fruits,only D65 is employed. See Figs 5–7 for more explanation. Key: —,leaves (230); – – –, fruits (35), vvv, leaves, forest illuminated.
criterion’’. For distinguishing the shades of greenfoliage, the same set of color receptors is optimal asfor flower colors. Depending on whether an insect isflying within forest shade or open space, differentwavelength positions of photoreceptors might beoptimal. However, the best possible sets of photo-receptors are independent of whether the normfunc-tion D65 or the forest shade function (Endler, 1993)is used as illuminant. For the sample of fruitsemployed here, only the S receptor variation has anoptimum comparable to that yielded by flower andleaf colors. The M receptor position has little effecton the spread of these fruit colors in color space,and the effectiveness of the L receptor increasesmonotonously towards longer wavelengths (Fig. 12).For the set of leaf colors, I then increased the numberof independently varied photoreceptors, in a similar
. 192
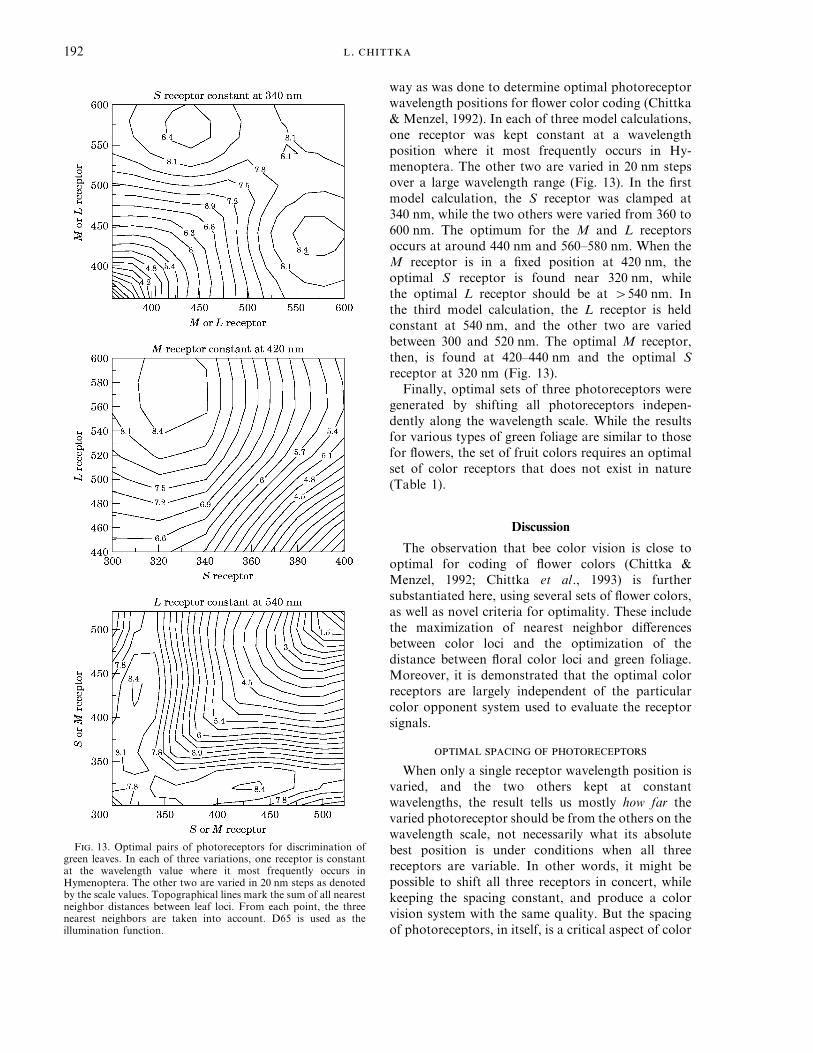
way as was done to determine optimal photoreceptorwavelength positions for flower color coding (Chittka& Menzel, 1992). In each of three model calculations,one receptor was kept constant at a wavelengthposition where it most frequently occurs in Hy-menoptera. The other two are varied in 20 nm stepsover a large wavelength range (Fig. 13). In the firstmodel calculation, the S receptor was clamped at340 nm, while the two others were varied from 360 to600 nm. The optimum for the M and L receptorsoccurs at around 440 nm and 560–580 nm. When theM receptor is in a fixed position at 420 nm, theoptimal S receptor is found near 320 nm, whilethe optimal L receptor should be at q540 nm. Inthe third model calculation, the L receptor is heldconstant at 540 nm, and the other two are variedbetween 300 and 520 nm. The optimal M receptor,then, is found at 420–440 nm and the optimal Sreceptor at 320 nm (Fig. 13).
Finally, optimal sets of three photoreceptors weregenerated by shifting all photoreceptors indepen-dently along the wavelength scale. While the resultsfor various types of green foliage are similar to thosefor flowers, the set of fruit colors requires an optimalset of color receptors that does not exist in nature(Table 1).
Discussion
The observation that bee color vision is close tooptimal for coding of flower colors (Chittka &Menzel, 1992; Chittka et al., 1993) is furthersubstantiated here, using several sets of flower colors,as well as novel criteria for optimality. These includethe maximization of nearest neighbor differencesbetween color loci and the optimization of thedistance between floral color loci and green foliage.Moreover, it is demonstrated that the optimal colorreceptors are largely independent of the particularcolor opponent system used to evaluate the receptorsignals.
When only a single receptor wavelength position isvaried, and the two others kept at constantwavelengths, the result tells us mostly how far thevaried photoreceptor should be from the others on thewavelength scale, not necessarily what its absolutebest position is under conditions when all threereceptors are variable. In other words, it might bepossible to shift all three receptors in concert, whilekeeping the spacing constant, and produce a colorvision system with the same quality. But the spacingof photoreceptors, in itself, is a critical aspect of color
F. 13. Optimal pairs of photoreceptors for discrimination ofgreen leaves. In each of three variations, one receptor is constantat the wavelength value where it most frequently occurs inHymenoptera. The other two are varied in 20 nm steps as denotedby the scale values. Topographical lines mark the sum of all nearestneighbor distances between leaf loci. From each point, the threenearest neighbors are taken into account. D65 is used as theillumination function.

193
vision, and so it will be discussed separately in thissection.
When plotted over a wavelength scale, photo-receptors have a roughly Gaussian sensitivity witha halfband width of about 100 nm (e.g. Menzel &Backhaus, 1991). According to Shannon & Weaver(1963), sampling units with Gaussian propertiesshould have peak sensitivities separated by a valuethat corresponds to their halfband width. Thiscondition is well met by photoreceptor sets of mostinsects (Menzel & Backhaus, 1991), as well as themodeled results presented here. However, whencoding of natural objects with broad reflectancefunctions is concerned, it is not quite so obvious whythis should be the case. If reflectance functions wererandomly distributed, two photoreceptors shouldprovide maximally independent information (andthus, best discrimination performance) when theirsensitivities overlap minimally, or not at all. In thissense, it is not surprising that the optimal M—receptor is located halfway between fixed S- andL-receptors. By placing the M receptor midwaysbetween the two other receptors, overlap with bothperipheral receptors is minimized, and the receptorwill provide maximally independent information fromthe two other types. However, for the S and L-receptors, one might expect performance to increasemonotonically as they are shifted further away fromthe M receptor. This is not the case. The informat-ional value in the L-receptor decreases, if onlyslightly, at wavelengths above the optimum of 550–560 nm. The same is found for the S-receptors pos-itioned below 330 nm. Reflectance falls off drasticallyin many UV-reflecting flowers below 340 nm (Chittkaet al., 1994), and so a shift of the S-receptors toshorter wavelengths may not pay off. It is less easy tosee why the L-receptor should not be shifted to longerwavelengths than 560 nm. Actually, reflectance inmost flowers is constant or even increases above600 nm (Chittka et al., 1994). However, the longwavelength reflectance in all but the pure red flowersis invariably coupled with reflectance in other spectraldomains (the UV, blue, or green part of the spectrum,Chittka et al., 1994) and so moving the L-receptor tolonger wavelengths might actually decrease its valuerather than providing additional information.
In summary, spacing of photoreceptors on thewavelength scale is a trade-off between shifting peaksensitivities as far apart as possible to code forindependent information, and making maximal use ofthe information provided by the spectral character-istics of a given class of objects. In nature, thistrade-off appears to produce a result which can bepredicted by the model calculations presented here.
When all three photoreceptors are shifted along thewavelength scale independently, the model calcu-lations find similar optima as when only singlereceptors are varied. This indicates that not only thespacing, but also the absolute positions of threephotoreceptors types are critical for color coding. Thebest fit is obtained for the M-receptor. In all modelcalculations, the optimal M-receptor lies at 420–430 nm, which corresponds very closely to most insectM receptors (Menzel & Backhaus, 1991; Chittka,1996). Even when only the M-receptor is varied, thismodel calculation is evolutionarily relevant, sinceearly Arthropods might only have had UV and greenreceptors (Menzel, 1979; Chittka, 1996), and requiredan adaptive positioning of blue receptors at somepoint.
In the other two receptors, the fit between optimaland real photoreceptor wavelength positions is notquite as accurate. In several model calculations, theoptimal S receptors are positioned at somewhatshorter wavelengths (320–330 nm) than the mostfrequent S-receptors in insects (0lmax=340–350 nm). Likewise, insect green receptors are consist-ently found at somewhat shorter wavelengths(0lmax=540 nm) than the optimal ones producedby the models (550–560 nm). The reasons for thisdiscrepancy are elusive. Certainly there is nointensity limitation in that range of the spectrum,as might be the case for the short wavelength margin.It has been suggested that the L-receptor might beadapted to match green foliage background (Menzel& Backhaus, 1991, Chittka & Menzel, 1992).However, green leaves reflect maximally at 550 nm,which is likewise longer than the maximal sensitivityin most insect green receptors. Thus, it is hard to seewhy, over several 100 million years of insectevolution, the L receptors have not been matchedmore perfectly to green foliage, if backgroundmatching is at all a fitness-limiting task (see alsoGoldsmith, 1990). Nevertheless, the deviations be-tween optimal and actual photoreceptor wavelengthpositions appear small when one considers the widerange of models that were generated. Moreover, thepositions of real bees’ S and L receptors (at around340 and 540 nm) yield discriminability of naturalobjects which is only slightly below that of theoptimal positions (Q5% in all cases).
?
The search for a set of two color opponentprocesses which maximize the discriminability of

. 194
floral colors provides less unambiguous results. Fordetermination of such a system, I used a strategywhich was already adopted for tackling the coloropponent systems most likely to underlie colordiscrimination of several species of Hymenoptera(Chittka et al., 1992). That is, instead of determiningonly a single best model, a whole range of differentmodels is generated, and their effectiveness in codingcolor (or in explaining color choices in the 1992 study)is compared. This method is advantageous because itallows us to judge whether a given model is trulybetter than other, similar models, or whether thedifference is insignificant.
Opponent systems with orthogonal axes, bydefinition, should contain the highest amount ofinformation. However, since the color loci areunevenly dispersed in a general color space such as thehexagon, it is necessary to test whether there is anyset of two color opponent axes that optimizes thespread of color loci in such a way that discriminationof all stimuli will be favored. In case there is no suchspecific system, it is interesting to see if the algorithmwill select as best all those color opponent systemswhose axes are orthogonal in the hexagon.
With both optimality criteria [maximizing (1) allcolor distances or (2) only those of nearest neighbors],the best possible color opponent system fordiscriminating a set of 180 flower colors consists ofone UV vs. blue and one UV vs. green mechanism.However, this pair of opponent mechanisms cannotbe considered substantially better than a whole rangeof other such pairs. The different color opponentmodels generated in this study are simply lineartransformations of one another. Thus, they willproduce sets of color distances that will often differonly marginally from one system to another (Chittkaet al., 1992). In this sense it is hardly surprising thatthere is no single combination of color opponentmechanisms that is significantly better than all othersfor distinguishing a given set of objects. The qualityof a color opponent system for this task can beassessed by measuring the degree of orthogonality ofcolor opponent axes in the hexagon, rather than theprecise weighting factors of the single opponentprocesses (Chittka, 1992).
Does the range of color opponent systemsgenerating large color distances between naturalcolors in Fig. 11 comprise combinations of coloropponent mechanisms whose assigned axes makelarge angles in the hexagon? Yes. The shaded area inFig. 11 (which includes the best possible models andthose which generate color discriminability up to 10%below this optimum) includes only models with coloropponent axes whose angles are 60° or larger. Thus,
for the task of maximizing color differences betweenextremely similar flower colors, it is critical to possesstwo color opponent mechanisms which differ stronglyin their weighting factors, and, correspondingly,whose axes differ substantially in terms of theirorientation in the hexagon.
Finally, it is interesting to compare the coloropponent models that flower visitors should havefor theoretical purposes with those models thatbest explain behavioral color discrimination data inHymenopterous insects. To this end, Fig. 11 can bematched with Fig. 7 in Chittka et al. (1992). In thatfigure, the shaded areas mark those models that aremost likely to account for color discrimination in therespective insects, whereas Fig. 11 shows modelswhich code natural colors most efficiently. In bothfigures, these areas are noticeably similar in shape;they only comprise models whose color opponentaxes have large angles in the hexagon. Hence, coloropponent coding in trichromatic bees and wasps iswell suited for the task of maximizing distinctivenessof flower colors.
?
Bee color vision is close to optimal for codingflower colors on several distinct levels. Since detectionand discrimination of floral colors are of vital interestfor obligatory flower visitors such as many species ofbee, selection will certainly stabilize bee color visionwith its current traits. Any series of mutation eventsgenerating a color vision system whose componentsdiffer from the optima determined in this study willimpair foraging success, and consequently, fitness.But do these results mean that bee color vision wasevolutionarily tuned to discriminate between flowercolors in the first place? The general problem withevolutionary optimization procedures of the kinddescribed here is that one can only disprove ahypothesis conclusively, not confirm it. In otherwords, had the optimal photoreceptors as derivedfrom the model calculations been radically differentfrom the ones found in ‘‘real animals’’, this wouldhave been sound evidence that evolution has notoptimized the photoreceptors according to the samecriteria. At the very least it would mean that there areother, more important criteria, or that evolutionaryconstraints might have hindered the animal fromevolutionarily proceeding along the same lines as themodel calculations. The fact that the calculationsarrive at similar color vision systems as nature istempting, but it does not necessarily imply that onehas found the criterion which has driven the evolutionof bee color vision. There might be other criteria that

195
are equally or more important for the respectiveorganism (and which arrive or have earlier arrived atthe same optimal solution) or the photoreceptorsfound in Hymenoptera might simply be an effect ofevolutionary constraints (Goldsmith, 1990), and justhappen to be optimal for an arbitrarily picked task.
In fact, sets of color receptors similar to those ofbees occur in animals which occupy entirely differentecological niches, such as the beach isopod Ligia(Hariyama et al., 1993) the backswimmer Notonecta(Bruckmoser, 1968), nocturnal hawkmoths (Whiteet al., 1994), and the larval ocelli of some Lepidoptera(Ichikawa & Tateda, 1982). This indicates thatArthropod color receptor positions actually predatethe evolution of flower color. The observation thatbee color vision is optimally suited to code flowercolor can probably be explained when one assumesthat flower colors adapted to insect vision, and that,as a consequence, they contain the information aboutthe receiver to which they were addressed.
Even though the wavelength positions of insectUV, blue and green receptors appear to beevolutionarily inert, it is inconceivable that sensitivityof these receptors has been maintained for a very longtime without stabilizing selection. As few as threeamino acid substitutions can cause a shift of 30 nm inpeak spectral sensitivity (Neitz et al., 1991), and so theevolutionary stability of the respective visual pig-ments is likely to have an adaptive explanation. Sincephylogenetic analyses show that bee color vision isprobably older than flowers (Chittka, 1996), we mustlook for visual tasks relevant to animals in apre-angiosperm world.
One such task is the discrimination of green leaves.Lythgoe & Partridge (1989) have determined theoptimal set of two visual pigments for this task, andfound that the best solution is a receptor atlmax=420–450 nm in combination with a secondreceptor maximally sensitive at 480–560 nm. Here, anoptimal third receptor is determined as well. Theoptimal M and L receptors found here (lmax(M)= 420–460 nm; −lmax(L)=540–580 nm) are ingood agreement with the two types found by Lythgoe& Partridge (1989), although the short wavelengthend of the range of the optimal L receptor occursat noticeably longer wavelengths in the presentstudy. The optimal third receptor is located atlmax=320 nm in all model calculations. Thus, thebest possible photoreceptor set for leaf discriminationis also in good agreement with those normally foundin trichromatic Hymenoptera, with the same devi-ations as when flower discrimination is concerned.This raises the possibility that sets of UV–blue–greenreceptors constitute an ancient adaptation which is
optimal for several classes of natural objects, so longas these are not specifically adapted to a differentvisual system, as are fruits. Further model calcu-lations with other classes of natural objects, such assand and stones, are necessary to test this possibility.
I wish to thank Drs R. Menzel and M. Vorobyev forstimulating discussions in the early phase of this work, andDr J. Endler for the forest shade illumination spectrum inFig. 1. The helpful criticism of the two anonymous refereesis gratefully appreciated.
REFERENCES
A, I. & G, J. (1994). Color appearance: On seeingred—or yellow, or green, or blue. Annu. Rev. Psychol. 45,451–485.
B, W. (1991). Color opponent coding in the visual systemof the honeybee. Vision Res. 31, 1381–1397.
B, W. (1992). The Bezold-Brucke effect in the color visionsystem of the honeybee. Vision Res. 32, 1425–1431.
B, R., B, W., D, M. & M, R. (1993).Simulation of threshold spectral sensitivity according to the colortheory for the honeybee. In: Gene—Brain—Behaviour. Proceed-ings of the 21st Gottingen Neurobiology Conference (Elsner, N. &Heisenberg, M., eds), p. 374. Stuttgart: Georg Thieme Verlag.
B, P. (1968). Die spektrale Empfindlichkeit einzelnerSehzellen des Ruckenschwimmers Notonecta glauca L.(Heteroptera). Z. vergl. Physiol. 59, 187–204.
C, L. (1992). The color hexagon: a chromaticity diagrambased on photoreceptor excitations as a generalized represen-tation of colour opponency. J. Comp. Physiol. [A] 170, 533–543.
C, L. (1993). The colour perception of hymenoptera, thecolours of flowers, and their evolutionary and ecologicalrelationship. PhD thesis, FU Berlin.
C, L. (1996). Does bee colour vision predate the evolutionof flower colour? Naturwissenschaften 83, 136–138.
C, L., B, W., H, H., S, E. & M, R.(1992). Opponent colour coding is a universal strategy toevaluate the photoreceptor inputs in hymentoptera. J. Comp.Physiol. [A] 170, 545–563.
C, L. & M, R. (1992). The Evolutionary Adaptation ofFlower Colors and the Insect Pollinators’ Color Vision Systems.J. Comp. Physiol. [A] 171, 171–181.
C, L., V, M., S, A. & M, R. (1993). Beecolour vision—the optimal system for the discrimination offlower colours with three spectral photoreceptor types? In:Sensory Systems of Arthropods (Wiese, K., Gribakin F.G.,Popov, A. V. & Renninger, G., eds), pp. 211–218. Basel/Switzer-land: Birkhauser Verlag.
C, L., S, A., T, N. & Menzel, R. (1994).Ultraviolet as a component of flower reflections, and the colourperception of hymenoptera. Vision Res. 34, 1489–1508.
D, K. (1958). Blumenfarben wie sie die Bienen sehen. Z.vergl. Physiol. 41, 49–110.
D, M. (1995). A quantitative model of successive colorinduction in the honeybee. J. Comp. Physiol. A 177, 219–234.
E, J. A. (1992). Signals, signal conditions, and the directionof evolution. American Naturalist 139, 125–153.
E, J. A. (1993). The color of light in forests and itsimplications. Ecological Monographs 63, 1–27.
F, P. (1987). Effects of plant species on each other’spollination: is community structure influenced? TREE 2,123–126.
G, M., N, J., C, L. & M, R. (1995). Colourchoice of flower-naive honeybees. J. Comp. Physiol. A 177,247–259.
G, T. H. (1990). Optimization, constraint, and history inthe evolution of eyes. Quart. Rev. Biol. 65, 281–322.
. 196
H, T., T, Y. & M-R, V. B. (1993).Spectral responses, including a UV-sensitive cell type, in the eyeof the isopod Ligia exotica. Naturwissenschaften 80, 233–235.
H, O.. (1972). Zur spektralen Unterschiedsempfi-ndlichkeit der Honigbiene. J. Comp. Physiol. 80, 439–472.
I, T. & T, H. (1982). Distribution of ColorReceptors in the Larval Eyes of Four Species of Lepidoptera.J. Comp. Physiol. 149, 317–324.
J, G. H. (1993). The distribution and nature of colour visionamong the mammals. Biol. Rev. 68, 413–471.
K, P. G. & B, H. G. (1983). Insects as flower visitors andpollinators. Annu. Rev. Entomol. 28, 407–453.
L, S. B. (1989). The role of sensory adaptation in theretina. J. Exp. Biol. 146, 39–62.
L, L. E. (1971). The Relation of Physiological andPsychological Aspects of Sensory Intensity. In: Handbook ofSensory Physiology (Loewenstein, W. R., ed.), pp. 192–225.Berlin: Springer.
L, J. N. (1979). The Ecology of Vision. Oxford: ClarendonPress.
L, J. N. & P, J. C. (1989). Visual pigments and theacquisition of visual information. J. Exp. Biol. 146, 1–20.
L, J.N.&P, J. C. (1991). The modelling of optimalvisual pigments of dichromatic teleosts in green coastal waters.Vision Res. 31, 361–371.
M, R. (1979). Spectral sensitivity and colour vision ininvertebrates. In: Invertebrate photoreceptors (Handbook ofSensory Physiology, Vol.VII/6A) (Autrum, H., ed.), pp. 503–580.Berlin: Springer.
M, R. & B, W. (1991). Colour Vision in Insects. In:Vision and Visual Dysfunction. The Perception of Colour (Gouras,P., ed.), pp. 262–288. London: Macmillan Press.
M, R.&S, A. (1993). The ecology of flower colours andthe natural colour vision of insect pollinators: The Israeli floraas a study case. Biol. Rev. 68, 81–120.
N, M. G. & O, D. (1993). The tuning of humanphotopigments may minimize red-green chromatic signals innatural conditions. Proc. R. Soc. Lond. B 252, 209–213.
N, K. I. & R, W. A. H. (1966). S-potentials from colourunits in the retina of fish (Cyprinidae). J. Physiol. 185, 536–555.
N, M., N, J. & J, G. H. (1991). Spectral Tuning ofPigments Underlying Red-Green Color Vision. Science 252,971–974.
P, D., F, A., H, H., S, J., V, D. F. &M, R. (1992). The spectral input systems of hymenopteraninsects and their receptor-based colour vision. J. Comp. Physiol.[A] 170, 23–40.
S, C. E. & W, W. (1963). The Mathematical Theory ofCommunication, Urbana; University of Illinois Press.
S, D. G., S, R. P. & H, B. J. (1993). Simpleexponential functions describing the absorbance bands of visualpigment spectra. Vision Res. 33, 1011–1017.
V, A., S, T., L, B. B. & T, J. (1986). Reconstructionof equidistant color space from responses of visual neurones inmacaques. J. Opt. Soc. Am. A 3, 1726–1734.
W, N. M., C, L., P, M. V., W, N. &O, J. (1996). Generalization in pollination systems, andwhy it matters. Ecology 77, 1043–1060.
W, R. H., S, R. D., B, R. R. & C, D. E.(1994). Wavelength discrimination and the role of ultravioletvision in the feeding behavior of hawkmoths. Biotropica 26,427–435.
W, G. & S, W. S. (1982). Color Science, Concepts andMethods, Quantitative Data and Formulae, New York: Wiley.