
Optical Constants Correlated Electrons-Spin of Micro Doughnuts of
35
1 Optical Constants Correlated Electrons-Spin of Micro Doughnuts of Mn-doped ZnO films S.S Nkosi 1,2,3 , I. Kortidis 4 , D.E. Motaung 3,* , J. Keartland 2 , E. Sideras-Haddad 2,† , A. Forbes 1,2 , B.W. Mwakikunga 3,‡ , G. Kiriakidis 4 , S. Sinha-Ray 3 1 CSIR-National Laser Centre, 627 Meiring Naude Rd, Brummeria, Pretoria 0001, RSA 2 School of Physics, University of Witwatersrand, Private Bag X3, Johannesburg 2030, RSA 3 DST/CSIR Nanotechnology Innovation Centre, National Centre for Nano-Structured Materials, Council for Scientific and Industrial Research, P.O. Box 395, Pretoria, 0001, RSA 4 Transparent Conductive Materials Lab, Institute of Electronic Structure and Laser, Foundation for Research and Technology Hellas, 100 N. Plastira str., Vassilika Vouton, 70013 Heraklion, Crete, Greece ABSTRACT Diluted magnetic semiconductor (DMS) Mn:ZnO thin films with “ring-like or doughnut-like” structures were grown using aerosol spray pyrolysis for 20 and 30 min. Electron paramagnetic resonance revealed the ferromagnetic ordering which varies with Mn concentration. These ferromagnetic films obtained coexist with dielectric state. Spectroscopic ellipsometry results showed that the dielectric constants ε 1 and ε 2 also vary in definite pattern as Mn concentration. We used and fitted Bruggeman theory to explain these trends and to find ε 1 and ε 2 for both ZnO and Mn which compare well with literature. The results showed that the structural, * Corresponding Author: Dr. David Motaung; E-mail: [email protected]; Tel.: (+27)12-8414775 † Corresponding Author: Prof. Elias Sideras-Haddad; E-mail: [email protected] ‡ Corresponding Author: Dr. Bonex Mwakikunga; E-mail: [email protected]; Tel.: (+27)12-8414771
Transcript of Optical Constants Correlated Electrons-Spin of Micro Doughnuts of

1
Optical Constants Correlated Electrons-Spin of Micro
Doughnuts of Mn-doped ZnO films
SS Nkosi123 I Kortidis4 DE Motaung3 J Keartland2 E Sideras-Haddad2dagger A Forbes12
BW Mwakikunga3Dagger G Kiriakidis4 S Sinha-Ray3
1CSIR-National Laser Centre 627 Meiring Naude Rd Brummeria Pretoria 0001 RSA
2School of Physics University of Witwatersrand Private Bag X3 Johannesburg 2030 RSA
3DSTCSIR Nanotechnology Innovation Centre National Centre for Nano-Structured
Materials Council for Scientific and Industrial Research PO Box 395 Pretoria 0001 RSA
4Transparent Conductive Materials Lab Institute of Electronic Structure and Laser
Foundation for Research and Technology Hellas 100 N Plastira str Vassilika Vouton
70013 Heraklion Crete Greece
ABSTRACT
Diluted magnetic semiconductor (DMS) MnZnO thin films with ldquoring-like or
doughnut-likerdquo structures were grown using aerosol spray pyrolysis for 20 and 30
min Electron paramagnetic resonance revealed the ferromagnetic ordering which
varies with Mn concentration These ferromagnetic films obtained coexist with
dielectric state Spectroscopic ellipsometry results showed that the dielectric
constants ε1 and ε2 also vary in definite pattern as Mn concentration We used and
fitted Bruggeman theory to explain these trends and to find ε1 and ε2 for both ZnO
and Mn which compare well with literature The results showed that the structural
Corresponding Author Dr David Motaung
E-mail dmotaungcsircoza Tel (+27)12-8414775 dagger Corresponding Author Prof Elias Sideras-Haddad
E-mail eliasSideras-Haddadwitsacza Dagger Corresponding Author Dr Bonex Mwakikunga
E-mail bmwakikungacsircoza Tel (+27)12-8414771
2
optical and magnetic properties of these DMSs are strongly sensitive to the
preparation parameters It is unambiguously demonstrated that the room-
temperature ferromagnetism is strongly correlated with dielectric constants The
Effective medium approach Bruggeman model used to fit our experimental data
demonstrated a decrease in the dielectric constant with the addition of Mn
concentration These findings revealed that the refractive index of the films increases
with ferromagnetic ordering while the extinction coefficient reduces This indicates
that when the MnZnO film becomes more opaque (high reflecting) to UV (~ 370 nm)
and absorbs less of that light the ferromagnetic ordering is enhanced A relatively
new phenomenon of d-band resonance at 335 eV (~ 370 nm polarized light) from
Zn-OO-Mn molecule at 025 at Mn was observed for both 20 (thinner film) and 30
minutes (thicker film) deposited MnZnO films A good correlation between
ferromagnetic intensity signal with its width and angular dependence for the films
was also observed
Keywords Aerosol spray pyrolysis Zinc oxide DMS Optical constants EPR
1 INTRODUCTION
Diluted magnetic semiconductors (DMSs) have attracted intense interest due to
their potential applications such as spintronics devices which utilize both the charge
and spin of electrons to create new functionalities beyond conventional
semiconductors [1-3] DMSs are semiconductor solid solutions where a small
percentage of cations are replaced by magnetic impurities such as Mn Due to the
host sp-Mn d interactions in these DMSs ferromagnetism can be produced [3 4]
3
The main challenge for this kind of novel materials is to preserve their magnetic
character at room temperature and above in order to be useful for technological
applications According to the ferromagnetic exchange coupling theory an ideal
DMS should have a homogeneous distribution of the magnetic dopants The
presence of any magnetic precipitate in the host semiconductors in the form of
secondary phases of the magnetic impurities is detrimental to the real applications of
DMSs and therefore should be avoided [5] In the exploration of the specific
materials zinc oxide (ZnO) has been identified as an excellent candidate host
semiconductor for supporting room-temperature ferromagnetism when doped with
variety of 3d transition metal ions particularly Mn2+ [6] Scientists have verified these
predictions in some cases with ferromagnetism above room-temperature reported
for ZnO doped with cobalt (Co) [7] iron (Fe) [8] and vanadium (V) [9] prepared by
vacuum deposition methods such as pulsed laser deposition (PLD) Room-
temperature ferromagnetism for Mn doped ZnO was first reported by Sharma et al
[10 11] even though this DMS was specifically highlighted in theoretical studies for
its high-Tc (Curie temperature) ferromagnetism potential [6]
This led to these p-conducting III-V and II-VI DMS being studied due to their
wide band gap energies as prospective DMSs for achieving magnetic ordering at
ambient temperatures and above For example a Curie temperature above room-
temperature 940 K has been reported for these p-conducting (Ga Mn)N [12] Since
metallic manganese (Mn) is paramagnetic any ferromagnetism detected in Mn
doped ZnO cannot be due to Mn clusters formed during the growth process
Ferromagnetism near or above room temperature has already been reported for Mn-
doped ZnO nanocrystals pellets and thin films [10 13-14] whereas in other studies
4
only paramagnetic behaviour was reported [15-17] among others However in all
these previous works it has been difficult to implement homogeneous doping
through various fabrication approaches In the same area of ferromagnetism a
relatively new phenomenon called ldquolow-field microwave absorptionrdquo has been
observed in ferromagnetic materials and other various materials such as high
temperature superconductors ferrites manganites doped silicate glasses and soft
magnetic materials Different interpretations have been put forward to try and explain
this phenomenon
Recently Xu et al [18] and Coey et al [19] showed that the undoped ZnO
exhibit intrinsic room temperature ferromagnetism This finding shed more light on
the ideas and the observations that the room temperature ferromagnetism is due to
the dopant carrier in ZnO materials They showed that defects related to oxygen
vacancies (Vo) and zinc interstitials clusters are magnetic Probably the dopants in
ZnO induce the ferromagnetism along with defects in the ZnO structure It is worth
pointing out that a large number of edge dislocations which were directly observed
by HRTEM enhanced the concentration of Vo andor Zni point defects and thus
increased the room temperature ferromagnetism intensity of transition metal doped
ZnO films [20 21] As mentioned earlier substitution of transition metal ions are
necessary but not sufficient condition for ferromagnetism ordering and large
variations in carrier concentration and magnetic properties have been reported for
otherwise similar samples indicating a strong dependence of room temperature
ferromagnetism on the synthesis and processing parameters [22 23] It is therefore
important to design a series of experiments to distinguish the variation of carriers
and structural defects and thus to identify the nature of the room temperature
5
ferromagnetism Without any loss of generality we shall consider the study of the
effective dielectric constants for a system made up of spherical multicomponent
inclusions with different arbitrary dielectric constants The properties under
consideration are usually the conductivity σ or the dielectric constant ε of the
medium These parameters are interchangeable in the formulas in a whole range of
models due to wide applicability of the Laplace equation These effective medium
approximations physical models describe the macroscopic properties of a medium
based on the properties and relative fractions of its components Then the
Bruggeman formula takes the form
(1)
In a system of Euclidean spatial dimension n that has arbitrary number
components [24] the sum is made all over the constituents δi and εi are respectively
the fraction and the dielectric constant of each component and εeff is the effective
dielectric constant of the medium (The sum over the δirsquos is unity)
In this work an aerosol spray pyrolysis (ASP) technique was used for
preparation of metal oxide nano-materials due to its advantages of implementation of
doping at the same time of metrical crystal growth process This technique has been
used to produce good ZnO nanostructures for photo-catalytic and gas sensing
application [25-27] Herein we report on the observation of room-temperature
ferromagnetism of Mn doped ZnO films grown by ASP at various Mn atomic
percentages and deposition times (20 min and 30 min) (thin and thick films)
correlated to dielectric constants An observation by spectroscopic ellipsometry
0
1
i effi
effi
in
6
revealed that the dielectric constant varies in definite pattern with Mn concentration
We discuss the observed correlation between the number of spins and the dielectric
constant Interestingly these films possess some low-field magnetic features
Furthermore angular dependence of the ferromagnetism in Mn doped ZnO films
together with the low-field magnetic anomalies are also studied The structural
morphological and optical properties of the undoped and Mn doped ZnO DMS
materials are also investigated in detail Additionally surface analysis reveals that
MnZnO films contain ldquoring-like or doughnut-likerdquo structures
2 EXPERIMENTAL DETAILS
21 Synthesis of undoped and Mn doped ZnO films grown by aerosol spray
pyrolysis
The undoped and Mn doped ZnO films were fabricated in a home-made
aerosol spray pyrolysis system [18 25] The spray solution was prepared by
dissolving appropriate volumes of solution containing 01 M zinc nitrate dehydrate
Zn(NO3)2 (purity gt 99 Sigma-Aldrich) and different dopant concentrations of Mn
(01 025 05 1 and 2 at) in distilled water The solutions were stirred at room
temperature for a few minutes to yield a clear and homogeneous solution The films
were deposited at a constant flow rate of 300 ml h-1 by means of a nozzle assisted
by a nitrogen carrier gas at 05 bar over a heated corning glass substrate The
distance between the tip of the nozzle and the substrate was kept at 28 cm The
atomization of the solution in the fine droplets was affected by spray nozzle with the
help of compressed air during the course of spray The average diameter of the
7
misted droplet generated from the vibration of the transducer can be approximately
calculated from an expression given as [28]
(2)
where Ddrop is the expected diameter of the droplet diameter (μm) γ the solution
surface tension (σ = 696 gcm-1s-2) ρ the liquid density (ρ = 1gcm-3) and f the
frequency of the transducer (f = 18 MHz) The solvent diameter of the resulting ZnO
particles DZnO can be estimated from Kelvinrsquos relation [29] to be around DZnO =
031μm
(3)
where MZnO is the molecular weight of ZnO and ρZnO is the density of ZnO The
un-doped and Mn doped ZnO films were deposited for 20 and 30 min at a substrate
temperature of 350 ˚C It is worthy to point out that the films deposited for 20 min
resulted to thinner films while the 30 min deposited films resulted to thicker films in
spite of Mn concentration Temperature of the heating plate and substrate was
recorded by a K-type thermocouple and controlled by a Eurotherm400 temperature
controller All the films have been prepared by varying the Mn concentration Prior to
deposition corning 1737 F glass substrates (254times254 mm2) were ultrasonically
cleaned with acetone ethanol and deionized water
31
2
8340
fDdrop
drop
ZnO
ZnOZnO D
CMD
31
8
22 Characterization
To study the surface morphology polarized optical microscope (POM)
technique was used Thin films were placed between two covering glasses and
placed on a Linkam hot-stage (Linkam Scientific Instruments Ltd UK) mounted on a
POM instrument Raman spectra were collected using a Horiba Jobin-Yvon HR800
Raman microscope equipped with an Olympus BX-41 microscope attachment An
Ar+ laser (5145 nm) with energy setting 12 mW from a Coherent Innova Model 308
was used as an excitation source The Variable angle spectroscopic ellipsometry
(VASE) spectra () and () were obtained in the range of 250-1000 nm at room
temperature by using a rotating-compensator instrument (JA Woollam M-2000) at
multi-angles of incidence (AOI) (65 70 and 75deg) For clarity we displayed spectra
only at 75deg AOI since they behave similarly at different AOI The films were regarded
as a homogeneous material with film thickness modelled using Cauchy model [30]
A B-Spline model [31 32] was then used to extract the refractive index (n) and
extinction coefficient (k) over the absorption range from 300 to 900 nm Employing
the ellipsometric parameters (Ψ) and (Δ) the thickness refractive index (n) and the
extinction coefficient (k) of the unknown layer onto known substrate could be
extracted The microwave absorption measurements were carried out using JEOL
electron spin resonance (ESR) spectrometer operated at 94 GHz (x-band) For the
analysis the films were mounted in the cavity centre at position where the
microwave magnetic field is the maximum The DC static field HDC was slowly swept
between 0 and 500 mT The microwave power was kept at 5 mW to avoid saturation
The DC field was modulated with a superposed ac field whose amplitude was varied
between 1 mT and 6 mT at 100 kHz frequency The microwave response was
9
measured as a derivative of microwave absorption signal It should be pointed out
that the measurements were carried out at room temperature (298 K)
3 RESULTS AND DISCUSSION
Fig 1 shows the optical microscopy micrographs of Mn (2at ) doped ZnO
films deposited for 20 and 30 min by spray pyrolysis It is shown in Fig 1a that the
thinner film deposited for 20 min shows ldquoring-likerdquo structures that are attached to
each other with diameters ranging from 80 to 150 μm The thicker film deposited for
30 min Fig 1b shows more concentrated ldquoring or sphere-likerdquo structures that are
covering the entire film surface with diameters much smaller than their counterparts
Fig 1 The optical microscope images for the Mn (2 at) doped ZnO structures
with different films (a) thinner and (b) thicker films
(a) (b)
100 μm 100 μm
10
For a systematic and more detailed optical imaging of these structures
polarized optical microscopy analysis was performed on various films For the
thinner film as shown in Fig 2a it is noticed that at lower concentration 01 at
Mn no ldquoring-likerdquo spheres are observed on the film surface However at 05 at
Mn (Fig 2b) the formation of ldquoring-likerdquo structures become visible across the film
with small diameters in the range of 5-20 microm A change in colour contrast is also
observed for these films depending on the carrier concentration of Mn
The micrograph in Fig 2c shows that upon increasing the Mn doping level to 2
at Mn these ldquoring-likerdquo structures become more visible throughout the film It is
evident that these structures are due to the presence of Mn Both thinner and thicker
films of the un-doped ZnO films did not show any of these structures or features [33]
The thicker film with a doping concentration of 01 Mn shows an abundant amount
of these ldquoring or sphere-likerdquo structures which are clustered together Increasing the
doping level of Mn to 05 at a dark visible spots forming circular orientations
across the film are observed These dark visible spots diminish at higher Mn
concentration (2 at Mn) forming thicker circular orientations with much bigger
diameters (Fig 2f) This points out that the diameters of these structures are
depending more on the Mn concentration
11
Fig 2 Polarized optical microscope images of Mn doped ZnO structures of thin
(a-c) and thick films (d-f) The Mn concentrations used were 01 05 and
1at for both thinner and thicker films
(f)
100 μm
(a)
100 μm
(d)
100 μm
(b)
100 μm
(c)
100 μm
(e)
100 μm
12
Fig 3 shows SEM micrographs of undoped and Mn doped ZnO films deposited
at different film thicknesses as indicated earlier The undoped ZnO with a thinner film
shows well adherent and smooth film with smaller ZnO particles ranging from 5 to 10
nm (Fig 3a) Upon introducing the 01 at of Mn (Fig 3b) in the ZnO matrix the
ldquoring or sphere-likerdquo structures as seen by the optical microscopy are now appearing
as ldquodoughnuts-likerdquo or ldquoring-likerdquo structures with thick edges across the film in SEM
By using the in-lens detector (high magnification) in the SEM the edge of these
ldquodoughnuts-likerdquo contains nanoparticles which are 30-50 nm in diameter range
(Fig3b inset) When increasing the Mn (1 at) further (Fig 3c) the diameter of the
doughnuts or rings structures reduce while their edges becomes thicker At higher
magnification as shown in the inset of Fig 3c the particle size increases with an
increase in Mn dopant at the edge of the doughnut and are more compact Fig 3d
shows the undoped ZnO nanorods with a thicker film The results show that ZnO
nanorods are grown perpendicular to the substrate entangled to one another
forming ldquospaghetti-likerdquo structures These ldquospaghetti-likerdquo structures were previously
observed in our SEM results with an average diameter in the range of 25-35 nm [31]
Again when Mn ions (01 at) are inserted in the host matrix still ldquodoughnuts-likerdquo
structures are preserved with diameter ranging from 20 to 40 microm The higher
magnification analysis (see inset Fig3e) shows an alteration on the surface
morphology as compared to the undoped ZnO (Fig 3d) We observed formation of
nanoparticles rather than the ldquospaghetti-likerdquo structures The inset of Fig 3f shows
that the size of the nanoparticles decreases further with an increase in Mn doping
level (1 at ) This comes with an increase in the doughnuts diameters as evident in
(Fig3f) SEM image
13
Fig 3 SEM micrographs of (a) undoped ZnO with a thinner film (b) 01at (c)
1at Mn doped ZnO with thinner films (d) undoped ZnO with a thicker
film (b) 01at (c) 1at Mn doped ZnO with thicker films
10 microm
300 nm
(b)
100 nm
10 microm
(a)
300 nm
30 microm
(e)
10 microm
300 nm
(f)
(d)
100 nm
100 nm
10 microm
(c)
14
Therefore the incorporation of Mn does not only promote formation of the
doughnuts but also completely modify the ZnO structure This is consistent with our
atomic force microscopy (AFM) analysis where the surface roughness of the thinner
films increases while it decreases for thicker films with Mn concentration (results not
shown) We believe that the nature of the growth process adopted by the present
experimental set-up which points out that the observed irregularities are
characteristic of the ultrasonic nature of the atomization process and the
thermodynamic environment as the droplets strike the substrate More specifically
we attribute the early stage irregularities with the thermal gradient and the repelling
thermophoretic forces on the on-coming droplets from the high temperature (350˚C)
substrate particularly for droplets smaller than 2 μm diameters that experience a very
high evaporation rate However as the deposition process proceeds the
temperature gradient and the evaporation rate get reduced and spreading of droplets
prevails [34 35] These processes may explain the observed significant variations in
the film structure We performed an electron backscattering measurements (EBS) to
investigate whether these ldquodoughnut-likerdquo structures are of different phases The
electron backscattered analysis shown in Fig 4 also confirms the formation of
ldquodoughnut or ring likerdquo structures The results in Fig 4a and b denote that both
thinner and thicker films have two phases 1 and 2 as indicated in Fig 4a This
suggests that phase 2 is highly concentrated with the MnZnO materials than phase
1 Energy dispersive x-ray spectroscopy (EDS) mapping (see Fig S1 of the
supplementary information) showed that Mn is homogenously distributed in a
proportional ratio throughout the film without showing any clusters
15
Fig 4 EBS-Detector micrographs of Mn doped ZnO (1 at) with thinner and
thicker films deposited for (a) 20 min and (b) 30 min indicate different
phases on the surface of MnZnO films
Fig 5 shows the Raman scattering spectra of the Mn ZnO with thinner and
thicker films deposited for (a) 20 and (b) 30 min respectively measured at room
temperature The Mn ions induce disorder even if perfectly incorporated on Zn sites
inherent to the mixture of Zn and Mn on the cation sub-lattice The origin of these
features such as isolated impurity modes disorder-induced silent modes or phonon
modes by precipitates is still controversial Table 1 shows the summary of phonons
observed for both thinner and thicker films It is observed from Fig 5 and Table 1
that the FWHM of the E2H for both films reduces with increasing Mn concentration
This is probably due to the suppression of the ZnO sub-lattice induced by
incorporation of Mn2+ into Zn2+ host matrix The slight shift in E2H modes to higher
wavenumber ∆ν (cm-1) is due to non-stoichiometry and strain effects The red-
shifting normally indicates tensile strain of the oxides The high and low Raman
10 microm
(b)
10 microm
(a)
1
2
16
intensities of the vibrational modes are indicative of donor defects-induced into the
ZnO system The intrinsic lower intensity regardless of Mn concentration of the
vibrational modes at 1439 cm-1 for both thinner and thicker films indicates optical
overtones process and is associated with the 2nd order Raman active modes The
vibrational modes at 790 and 1081 cm-1 especially for the thicker films which is due
to longitudinal acoustic and transverse-optical (LA+TO) and transverse optical and
longitudinal optical stretching modes (TO+LO) respectively are defect related It can
be noticed that the modes phonon at 790 cm-1 (LA+TO) is suppressed upon addition
of Mn It is also observed that the vibrational modes at 1081 cm-1 (TO+LO) enhances
upon the addition of Mn concentration Similarly for the thinner films the same
vibrational modes at 1091 cm-1 which is red-shifted for the thicker films enhances on
increasing the Mn concentration We can conclude that it is due to the present of Mn
on Zn sub-lattice However this 1091 cm-1 mode is more resolved and excited higher
in intensity on the thinner films than on the thicker films which appears to be
suppressed or less excited The Raman phonon intensification and broadening are
an effect of disorders created during growth and the incorporation of Mn with the
local structure Extrinsic Froumlhlich scattering should not be overlooked especially for
the longitudinal optical modes
17
Fig 5 Raman spectra of MnZnO films at various concentration of Mn for both (a)
thinner and (b) thicker deposited films respectively
(a)
(b)
18
Defects and impurities magnetic correlation has been previously observed in
many cases to help understand the nature and origin of RTFM more especially in
these DMSO systems Previous results reported by Nkosi et al [36] revealed that
Mn doped ZnO films prepared by ASP possess three absorption peaks in associated
with three processes one centred at HDC asymp 6 mT (low field signal) another at ~ 150
mT (paramagnetic feature) and lastly at ~ 300 mT (ferromagnetic field resonance)
Ferromagnetic resonance (FMR) is due to the absorption in the full saturation state
while the low field absorption process is usually originating from magnetization
process far from the saturation state These results confirmed the appearance of
FMR at room temperature Fig 6 shows the effect of Mn concentration on the FMR
intensity (extracted from FMR peaks) and peak-to-peak width (∆HFMR) at different
film orientation to the applied magnetic field In Fig 6a it is noticed that the FMR
intensity signal is high at relatively low Mn concentration and reduces upon
increasing the Mn doping in the host A significant rise which is quite comparable to
that of 01 at Mn is achieved at 5 at of Mn Moreover it is observed that the
width (∆HFMR) also decreases when increasing Mn concentration On the other hand
when the films are titled normal to the applied field the FMR intensity and the width
(∆HFMR) signals decrease with an increase in Mn up to 2at However at higher
Mn (gt2at ) both FMR intensity and the width (∆HFMR) signals increase as shown in
Fig 6b It is observed from Fig 6c that the FMR intensity signal increases at higher
Mn concentration (1-5 at ) while width (∆HFMR) decreases However when the
film is measured perpendicular to the field (90 ˚) a similar behaviour is observed
(Fig 6d) This also is consistent with the surface morphology analyses
19
Fig 6 The dependence of RTFM intensity and peak-to-peak width at various Mn
concentrations (a) magnetic field parallel to the film and (b) when the
magnetic field is perpendicular to the film It should be pointed out that (a-b)
correspond to the thinner films deposited for 20 min and (c-d) thicker films
deposited for 30 min
The increase in FMR intensity from 2 at is due to the fact that the
ferromagnetism signals transform to a sharper peak related to paramagnetism This
(a) (b)
(c) (d)
20
indicates that a doping level of Mn 01-2 at results to FMR while the doping level
above 2 at resulting to a paramagnetism [36] A similar transition has been
observed by Nkosi et al [37] for nickel oxide at room temperature induced by
substrate annealing Furthermore upon increasing the doping level of Mn (5 at)
the ferromagnetism completely disappears to another form of magnetism related to
paramagnetic The spins become randomly orientated at higher atomic percentages
of Mn Moreover the optical constants (presented in Fig 8) indicate an increase in
refractive index and a decrease in extinction coefficient with increasing Mn
concentration This suggests that at higher Mn concentration the film become more
reflective to the electromagnetic radiation This alone we believe could results in
reduction in the magnetic ordering ferromagnetism However Sharma et al [10]
reported that the decrease in ferromagnetic ordering above 2 Mn doped ZnO films
was attributed to Mn clustering which resulted in shorter Mn-Mn distances This
however is in contrast with the present study as evidenced by EDX mapping analysis
(see supplementary information) It is further observed that the linewidth with the Mn
concentration change decrease which could be due to an exchange narrowing of the
ESR signal However the mechanism for intrinsic ferromagnetism in Mn-doped ZnO
thin films still remains uncertain and therefore more work is in process for illustrating
the fundamental physical processes in Mn-doped ZnO DMSs
Fig 7 shows the dependence of FMR spins with Mn concentration It is noticed
that the total number of spins for the thinner films deposited for 20 min reduce
drastically with increasing the Mn concentration However the thicker films deposited
for 30 min show an increase in number of spins at higher Mn concentration (1-2 at
) This type of reversal behaviour at higher Mn concentration is consistent with
21
surface roughness and films thickness (results not shown) Since metallic Mn is
paramagnetic any ferromagnetism detected in Mn doped ZnO cannot be due to Mn
clusters formed during the growth process Therefore we expect to see a reduction in
the number of spins with the addition of Mn However there exist some
controversies on the origin of this RTFM in the diluted magnetic semiconductors [22
23 38]
Fig 7 The dependence of number of spins (Ns) of the ferromagnetic ordering as
a function of Mn concentration
Doped ZnO films are either conducting or semiconducting as characterized by
strong coupling between localized d electrons of the transition-metal ions and the
ZnO structure characterized by highly dispersive-parabolic shape s orbitals of Zn and
22
rather localized with small dispersion p orbitals of O Thus the carriers are spin-
polarized and can mediate ferromagnetism ordering of the magnetic moments of
transition-metal ions doped into the oxide lattice ie transition-metal replace Zn2+
sites Furthermore additional electron doping such as Co Al Sn Cu Ga etc to
name a few as well as hole doping such as Co Li N Mn Fe etc has been
investigated to further examine the carriers effect on RTFM [39 40] It was
importantly noted that addition of carrier doping had no significant impact on RTFM
enhancement and some films even showed RTFM with an inverse correlation
between magnetization and electron density [3 41] Thus inconsistent phenomena
and conclusions have been obtained indicating that the intrinsic RTFM of transition-
metal doped ZnO systems remains a wide open question It is hence of vital
importance to clarify the correlation if any between carriers and the mechanism of
ferromagnetic inherent to this class of diluted magnetic semiconductors On the other
hand defects are supposed to play a primary role on ferromagnetic ordering in
transition-metal ZnO [18-21] Song et al [42] found that in Co-doped ZnO is strongly
correlated with structural defects In their case these defects are introduced by
increasing carriers (electron concentration) On the other hand an insulating nature
in these diluted magnetic materials especially Co-doped ZnO is significant in a
magnetic coupling interaction other than carrier-mediated exchange which is
apparently operative So again defects which are also normally caused by
incorporation of dopants play an important role in the system An electron
associated with a particular defect confined in a hydrogenic orbital comes with
dielectric constant as found by Song et al [43] Hence high dielectric constant
results in large hydrogenic orbital radius This is consistent with our results
presented in Fig 9 which indicate that the increase in in RTFM is induced by
23
increasing in refractive index Therefore according to the Raman results and ref
[43] this can be attributed to the structural disordering caused by ion (Mn in our
case) incorporation This will mean that the paramagnetic films (MnZnO) are
transparent to UV light and become opaque when are ferromagnetic
Fig 8 shows the refractive index (n) and extinction coefficient (k) as function of
Mn concentration It is evident that the n decrease for both films (thinner and thicker)
while the k increases with increasing the Mn concentration in the ZnO matrix There
is a hump indicated by an arrow in both films (Fig 8a and b) for the extinction
coefficient (k) This hump is observed at the same concentration of 025 at of Mn
for both thinner and thicker films However the origin and interpretation of this
observation will be discussed later in the paper
Fig 8 The dependence of optical constants n and k with Mn concentration for
the (a) thinner and (b) thicker films
(b) (a)
24
The optical constants show some interesting correlation with the FMR spins
origin Fig 9a and b show the dependence of n and k on the ferromagnetic ordering
in terms of its intensity number of spins for both thinner and thicker films
respectively It is very fascinating to note that both films show that the refractive
index (n) increases with ferromagnetic ordering while extinction coefficient (k)
reduces This suggests that when the MnZnO films become more opaque (high
reflectance) to UV (~ 370 nm) and absorbs less of that light the RTFM ordering is
enhanced Again if that is the case it would also mean that super-paramagnetic
films are more transparent to UV light
Fig 9 The dependence of optical constants with the number of ferromagnetic
spins for both (a) thinner and (b) thicker MnZnO films
(a) (b)
25
To further elucidate in detail the effect of Mn doping on the ZnO we carried out
effective medium approach (EMA) for inhomogeneous materials In keeping up with
our data the eq 1 can be re-written as follows
01
effZnO
effZnO
Mn
effMn
effMn
Mn
(4)
Only two components Mn and ZnO are considered here Solving for εeff results
into two possible solutions as
222422
2
1ZnOZnOMnMnZnOMnZnOZnOMnMneff
222422
2
1ZnOZnOMnMnZnOMnZnOZnOMnMneff
In terms of the more fundamental optical properties of ZnO there have been a
number of comprehensive studies to determine the refractive index and dielectric
constant of this material [19 44-46] The measurements were all carried out using
spectroscopic ellipsometry technique Plotting the effective dielectric properties
shown in Fig 10 solution under any given concentration values it shows that the
dielectric properties decrease with increasing concentration This agrees well with
our curves in Fig 8 especially for the refractive index
26
Fig 10 Mathematica plot fit An application of the effective medium approach to
our experimental data points to extract parameters The δMn concentration
fraction can go up 100 atomic percentage depending on experimental
condition The Mn doping in our case could go up to 1 at
This agrees well with Lichtenekerrsquos empirical logarithmic mixing rule equation
[47] often employed by other workers [48] to mix the dielectric properties of
mixtures of varying proportions mixed at room temperature decreases with amount
concentration added In order to understand a decreasing behaviour observed from
refractive index mathematica software was used to do a non-linear-model fit in our
experimental data Therefore by using the EMA model the values of n for both ZnO
and Mn were obtained as shown in Table 2 These values are in good agreement
with the ones observed from the literature [17 44-46]
27
Table 2 Summary of dielectric constant for ZnO and Mn
Estimate Std error t-Statistics P-Value R2
εZnO
εMn
211095
431666
0351447
0390812
600644
110454
000924475
000158951
0996589
The dielectric constant (ε) is normally composed of real (ε) and complex (ε)
given as follows
2ikni complexreal (5)
Expanding eq 5 further leads to
22 2 kinkni complexreal (6)
This will mean that
22 knreal and nkcomplex 2 (7)
Therefore with some simplification the refractive index (n) and extinction
coefficient (k) are given by
21
22
2
realcomplexrealn
21
22
2
realcomplexrealk
(8)
The EMA model from Bruggeman nor Maxwell-Garnet cannot justify the hump
noticed on the extinction coefficient (k) with Mn concentration (Fig 7a and b) The
28
only possible and accurate answer could be found in Drudel model of the optical
properties of metals The model does not only explain the appearance of the hump
but also explains a possible shift in energy of photon for different metals Such
behaviour is only noticed in transition-metal compounds and is said to be due to a d-
band resonance at about 3351 eV (~370 nm) The d-band lie below the Fermi
energy of the conduction band fairly narrow band of energies around ħω0 = EF - Ed
which can be modelled as additional Lorentz oscillator The combined effects of the
free-electrons (Drude model) and the inter-band transitions due to bound d-electrons
(Lorentz model) influence the reflectance properties of the metal [49] Reddy et al
[50] showed that the reflectance of Cu co-doped samples decreased with increase in
Cu concentration
4 CONCLUSION
We have successfully synthesized MnZnO films of novel structures using
aerosol spray pyrolysis at different deposition times Magnetic properties of MnZnO
films revealed ferromagnetic ordering with some low-field magnetic absorption
observed in certain concentration of Mn The effect of Mn concentration on the FMR
intensity signal and its width was successfully studied The angular dependence of
this latter was studied The results revealed that Mn concentration seems to directly
affect the dielectric constants the same way as the FMR width showing that the
refractive index decreases (including the width) as a function of Mn concentration
The obtained dielectric constants were correlated with the ferromagnetic ordering
The effect of Mn carrier concentration to ferromagnetic ordering was also studied A
d-band resonance at 335 eV was found in these MnZnO films at 025 at Mn
29
which was due to the transition-metal Bruggeman EMA model was also used in an
attempt to explain the variation of the dielectric properties (real and complex part)
and the model fit was successfully correlated with the dielectric constant for ZnO and
Mn
5 ACKNOWLEDGEMENTS
This work was supported by the Department of Science and Council for
Scientific and Industrial Research (Project Numbers LHIE100 HGER28P and
HGER27S) and WIROX project (PIRSES-GA-2011-295216) a Marie Curie
International Research Staff Exchange Scheme Fellowship within the 7th European
Community Framework Programme and lsquoORAMArsquo Oxide Materials Towards a
Matured Post-silicon Electronics ERA FP7-NMP - CONTRACT Ndeg 246334 SS
Nkosi wishes to acknowledge the SERA project (HGER29X) for the traveling costs
The authors are also thankful to the equipment supplied by the NCNSMs and
FORTH institute for the analysis
30
6 REFERENCES
[1] XY Mao W Zhong YW Du Journal of Magnetism and Magnetic Materials
320 (2008) 1102
[2] I Zutic J Fabian SD Sama Reviews of Modern Physics 76 (2004) 323
[3] C Jing Y Jiang W Bai J Chu A Liu Journal of Magnetism and Magnetic
Materials 322 (2010) 2395
[4] E Chikoidze Y Dumont HJ Bardeleben W Pacuski O Gorochov
Superlattices and Microstructures 42 (1-6) (2007) 176
[5] RQ Wu GW Peng L Liu YP Feng ZG Huang QY Wu Appl Phys Lett
89 (2006) 062505
[6] T Dietl H Ohno F Matsukura J Cibert D Ferrand Science 287 (2000)
1019
[7] K Ueda H Tabata T Kawai Appl Phys Lett 79 (7) (2001) 988
[8] YQ Wang SL Yuan L Liu P Li XX Lan ZM Tian JH He SY Yin J
Magnetism and Magnetic Materials 320 (2008) 1423
[9] H Saeki H Tabata T Kawai Solid State Communications 120 (11) (2001)
439
[10] P Sharma A Gupta KV Rao FJ Owens R Sharma R Ahuja JMO
Guillen B Johansson GA Gehring Nature Materials 2 (2003) 673
[11] P Sharma A Gupta FJ Owens A Inoue KV Rao J Magnetism and
Magnetic Materials 282 (2004) 115
[12] H Hori S Sonoda T Sasaki Y Yamamoto S Shimizu Ken-inchi Suga K
Kindo Physica B 324 (2002) 142
31
[13] DP Norton SJ Pearton AF Hebard N Theodoropoulou LA Boatner R
G Wilson Appl Phys Lett 82 (2003) 239
[14] KR Kittilstved NS Norberg DR Gamlin Phys Rev Lett 94 (2005) 147209
[15] SS Kim JH Moon B-T Lee Oh S Song J Ho Je J Appl Phys 95 (2004)
454
[16] T Fukumura Z Jin M Kawasaki T Shono T Hasegawa S Koshihara H
Koinuma Appl Phys Lett 78 (2001) 958
[17] A Tiwari C Jin A Kvit D Kumar JF Muth J Narayan Solid State
Communications 121 (2002) 371
[18] X Xu C Xu J Dai J Hu Fengji Li S Zhang J Physical Chemistry C 116
(2012) 8813
[19] JMD Coey M Venkatesan CB Fitzgerald Nat Mater 4 (2005) 173
[20] YB Zhang Q Liu T Sritharan CL Gan S Li Appl Phys Lett 89 (2006)
042510
[21] TS Herneg SP Lau SF Yu HY Yang XH Ji JS Chen N Yasui H
Inaba J Appl Phys 99 (2006) 086101
[22] W Prellier A Foucher B Mercy J Phys Condens Matter 15 (2003) R1583
[23] SJ Pearton DP Norton MP Ivill AF Hebard JM Zavada WM Chen
IA Buyanova J Electron Mater 36 (2007) 462
[24] D Stroud Phys Rev B 12 (1975) 3368
[25] G Kenanakis Z Giannakoudakis D Vernardou C Savvakis N Katsarakis
Catalysis Today 151 (2010) 34
[26] I Kortidis K Moschovis FA Mahmoud G Kiriakidis Thin Solid Films 518
(2009) 1208
[27] G Kiriakidis K Moschovis I Kortidis V Binas Vacuum 86 (2012) 495
32
[28] RJ Lang J Acoust Soc Am 34 (1962) 6
[29] W Thomson (Kelvin) Philos Mag 42 448 (1871)
[30] JA Woollam Inc Complete EaseTM Data Analysis Manual June 15 2008
[31] B Johs JS Hale Phys Status Solidi A 205 (2008) 715
[32] DE Motaung GF Malgas CJ Arendse SE Mavundla Mater Chem Phys
135 (2012) 401
[33] DE Motaung GH Mhlongo I Kortidis SS Nkosi GF Malgas BW
Mwakikunga S Sinha-Ray G Kiriakidis Applied Surface Science (2013)
submitted for publication
[34] D Perednis LJ Gauckler J Electroceramics 14 (2005) 103
[35] LA Patil AR Bari MD Shinde V Deo Sensors and Actuators B 30 (2010)
290
[36] SS Nkosi I Kortidis DE Motaung GH Mhlongo GF Malgas J Keartland
E Sideras-Haddad A Forbes BW Mwakikunga S Sinha-Ray G Kiriakidis
J Alloys and Compounds (2013) accepted
[37] SS Nkosi B Yalisi DE Motaung J Keartland E Sideras-Haddad A
Forbes BW Mwakikunga Appl Surf Sci 265 (2013) 860
[38] Usman IIyas RS Rawat Y Wang TL Tan P Lee R Chen HD Sun
Fengji Li Sam Zhang Appl Surf Sci 258 (2012) 6373
[39] Y-H Lin M Ying M Li X Wang X Wang C-H Nan Appl Phys Lett 90
(2007) 222110
[40] NH Hong V Brize J Sakai Appl Phys Lett 86 (2005) 082505
[41] M Ivill SJ Pearton YW Heo J Kelly AF Hebard DP Norton J Appl
Phys 101 (2007) 123909
33
[42] C Song SN Pan XJ Liu XW Li F Zeng WS Yan B He F Pan J
Phys Condens Matter 19 (2007) 176229
[43] C Song KW Geng F Zeng XB Wang YX Shen F Pan Phys Rev B 73
(2006) 024405
[44] H Yoshikawa S Adachi Jpn J Appl Phys 36 (1997) 6237
[45] N Ashkenov B M Mbenkum C Bundesmann V Riede M Lorenz D
Spemann E M Kaidashev A Kasic M Schubert M Grundmann G Wanger
H Neumann V Darakchieva H Arwin B Monemar J Appl Phys 93 (2003)
126
[46] XW Sun H S Kwok J Appl Phys 86 (1999) 408
[47] K Lichteneker Physik Z 27 (1926) 115
[48] NH Langton AMBritIRE AInstP D Matthews ANCRT DPI Br J
Appl Phys 9 (1958) 453
[49] DJ Hagan and PG Kik OSE5312-Light Matter Interaction CREOL The
College of Optics and Photonics University of Central Florida (2011) pp52
[50] DA Reddy G Murali B Poornaprakash RP Vijayalakshmi BK Reddy
Appl Surf Sci 258 (2012) 5206
34
FIGURE CAPTIONS AND TABLES
Table 1 Summary of Raman modes of Mn doped ZnO nanostructures with thinner
and thicker films
Table 2 Summary of the estimated dielectric constant for ZnO and Mn
Fig 1 The optical microscope images for the Mn (2 at) doped ZnO structures
with different films (a) thinner and (b) thicker films
Fig 2 Polarized optical microscope images of Mn doped ZnO structures of thin
(a-c) and thick films (d-f) The Mn concentrations used were 01 05 and
1at for both thinner and thicker films
Fig 3 SEM micrographs of (a) undoped ZnO with a thinner film (b) 01at (c)
1at Mn doped ZnO with thinner films (d) undoped ZnO with a thicker
film (b) 01at (c) 1at Mn doped ZnO with thicker films
Fig 4 EBS-Detector micrographs of Mn doped ZnO (1 at) with thinner and
thicker films deposited for (a) 20 min and (b) 30 min indicate different
phases on the surface of MnZnO films
Fig 5 Raman spectra of MnZnO films at various concentration of Mn for both
(a) thinner and (b) thicker deposited films respectively
Fig 6 The dependence of RTFM intensity and peak-to-peak width at various Mn
concentrations (a) magnetic field parallel to the film and (b) when the
magnetic field is perpendicular to the film It should be pointed out that (a-
b) correspond to the thinner films deposited for 20 min and (c-d) thicker
films deposited for 30 min
35
Fig 7 The dependence of number of spins (Ns) of the ferromagnetic ordering as
a function of Mn concentration
Fig 8 The dependence of optical constants n and k with Mn concentration for
the (a) thinner and (b) thicker films
Fig 9 The dependence of optical constants with the number of ferromagnetic
spins for both (a) thinner and (b) thicker MnZnO films
Fig 10 Mathematica plot fit An application of the effective medium approach to
our experimental data points to extract parameters The δMn concentration
fraction can go up 100 atomic percentage depending on experimental
condition The Mn doping in our case could go up to 1 at

2
optical and magnetic properties of these DMSs are strongly sensitive to the
preparation parameters It is unambiguously demonstrated that the room-
temperature ferromagnetism is strongly correlated with dielectric constants The
Effective medium approach Bruggeman model used to fit our experimental data
demonstrated a decrease in the dielectric constant with the addition of Mn
concentration These findings revealed that the refractive index of the films increases
with ferromagnetic ordering while the extinction coefficient reduces This indicates
that when the MnZnO film becomes more opaque (high reflecting) to UV (~ 370 nm)
and absorbs less of that light the ferromagnetic ordering is enhanced A relatively
new phenomenon of d-band resonance at 335 eV (~ 370 nm polarized light) from
Zn-OO-Mn molecule at 025 at Mn was observed for both 20 (thinner film) and 30
minutes (thicker film) deposited MnZnO films A good correlation between
ferromagnetic intensity signal with its width and angular dependence for the films
was also observed
Keywords Aerosol spray pyrolysis Zinc oxide DMS Optical constants EPR
1 INTRODUCTION
Diluted magnetic semiconductors (DMSs) have attracted intense interest due to
their potential applications such as spintronics devices which utilize both the charge
and spin of electrons to create new functionalities beyond conventional
semiconductors [1-3] DMSs are semiconductor solid solutions where a small
percentage of cations are replaced by magnetic impurities such as Mn Due to the
host sp-Mn d interactions in these DMSs ferromagnetism can be produced [3 4]
3
The main challenge for this kind of novel materials is to preserve their magnetic
character at room temperature and above in order to be useful for technological
applications According to the ferromagnetic exchange coupling theory an ideal
DMS should have a homogeneous distribution of the magnetic dopants The
presence of any magnetic precipitate in the host semiconductors in the form of
secondary phases of the magnetic impurities is detrimental to the real applications of
DMSs and therefore should be avoided [5] In the exploration of the specific
materials zinc oxide (ZnO) has been identified as an excellent candidate host
semiconductor for supporting room-temperature ferromagnetism when doped with
variety of 3d transition metal ions particularly Mn2+ [6] Scientists have verified these
predictions in some cases with ferromagnetism above room-temperature reported
for ZnO doped with cobalt (Co) [7] iron (Fe) [8] and vanadium (V) [9] prepared by
vacuum deposition methods such as pulsed laser deposition (PLD) Room-
temperature ferromagnetism for Mn doped ZnO was first reported by Sharma et al
[10 11] even though this DMS was specifically highlighted in theoretical studies for
its high-Tc (Curie temperature) ferromagnetism potential [6]
This led to these p-conducting III-V and II-VI DMS being studied due to their
wide band gap energies as prospective DMSs for achieving magnetic ordering at
ambient temperatures and above For example a Curie temperature above room-
temperature 940 K has been reported for these p-conducting (Ga Mn)N [12] Since
metallic manganese (Mn) is paramagnetic any ferromagnetism detected in Mn
doped ZnO cannot be due to Mn clusters formed during the growth process
Ferromagnetism near or above room temperature has already been reported for Mn-
doped ZnO nanocrystals pellets and thin films [10 13-14] whereas in other studies
4
only paramagnetic behaviour was reported [15-17] among others However in all
these previous works it has been difficult to implement homogeneous doping
through various fabrication approaches In the same area of ferromagnetism a
relatively new phenomenon called ldquolow-field microwave absorptionrdquo has been
observed in ferromagnetic materials and other various materials such as high
temperature superconductors ferrites manganites doped silicate glasses and soft
magnetic materials Different interpretations have been put forward to try and explain
this phenomenon
Recently Xu et al [18] and Coey et al [19] showed that the undoped ZnO
exhibit intrinsic room temperature ferromagnetism This finding shed more light on
the ideas and the observations that the room temperature ferromagnetism is due to
the dopant carrier in ZnO materials They showed that defects related to oxygen
vacancies (Vo) and zinc interstitials clusters are magnetic Probably the dopants in
ZnO induce the ferromagnetism along with defects in the ZnO structure It is worth
pointing out that a large number of edge dislocations which were directly observed
by HRTEM enhanced the concentration of Vo andor Zni point defects and thus
increased the room temperature ferromagnetism intensity of transition metal doped
ZnO films [20 21] As mentioned earlier substitution of transition metal ions are
necessary but not sufficient condition for ferromagnetism ordering and large
variations in carrier concentration and magnetic properties have been reported for
otherwise similar samples indicating a strong dependence of room temperature
ferromagnetism on the synthesis and processing parameters [22 23] It is therefore
important to design a series of experiments to distinguish the variation of carriers
and structural defects and thus to identify the nature of the room temperature
5
ferromagnetism Without any loss of generality we shall consider the study of the
effective dielectric constants for a system made up of spherical multicomponent
inclusions with different arbitrary dielectric constants The properties under
consideration are usually the conductivity σ or the dielectric constant ε of the
medium These parameters are interchangeable in the formulas in a whole range of
models due to wide applicability of the Laplace equation These effective medium
approximations physical models describe the macroscopic properties of a medium
based on the properties and relative fractions of its components Then the
Bruggeman formula takes the form
(1)
In a system of Euclidean spatial dimension n that has arbitrary number
components [24] the sum is made all over the constituents δi and εi are respectively
the fraction and the dielectric constant of each component and εeff is the effective
dielectric constant of the medium (The sum over the δirsquos is unity)
In this work an aerosol spray pyrolysis (ASP) technique was used for
preparation of metal oxide nano-materials due to its advantages of implementation of
doping at the same time of metrical crystal growth process This technique has been
used to produce good ZnO nanostructures for photo-catalytic and gas sensing
application [25-27] Herein we report on the observation of room-temperature
ferromagnetism of Mn doped ZnO films grown by ASP at various Mn atomic
percentages and deposition times (20 min and 30 min) (thin and thick films)
correlated to dielectric constants An observation by spectroscopic ellipsometry
0
1
i effi
effi
in
6
revealed that the dielectric constant varies in definite pattern with Mn concentration
We discuss the observed correlation between the number of spins and the dielectric
constant Interestingly these films possess some low-field magnetic features
Furthermore angular dependence of the ferromagnetism in Mn doped ZnO films
together with the low-field magnetic anomalies are also studied The structural
morphological and optical properties of the undoped and Mn doped ZnO DMS
materials are also investigated in detail Additionally surface analysis reveals that
MnZnO films contain ldquoring-like or doughnut-likerdquo structures
2 EXPERIMENTAL DETAILS
21 Synthesis of undoped and Mn doped ZnO films grown by aerosol spray
pyrolysis
The undoped and Mn doped ZnO films were fabricated in a home-made
aerosol spray pyrolysis system [18 25] The spray solution was prepared by
dissolving appropriate volumes of solution containing 01 M zinc nitrate dehydrate
Zn(NO3)2 (purity gt 99 Sigma-Aldrich) and different dopant concentrations of Mn
(01 025 05 1 and 2 at) in distilled water The solutions were stirred at room
temperature for a few minutes to yield a clear and homogeneous solution The films
were deposited at a constant flow rate of 300 ml h-1 by means of a nozzle assisted
by a nitrogen carrier gas at 05 bar over a heated corning glass substrate The
distance between the tip of the nozzle and the substrate was kept at 28 cm The
atomization of the solution in the fine droplets was affected by spray nozzle with the
help of compressed air during the course of spray The average diameter of the
7
misted droplet generated from the vibration of the transducer can be approximately
calculated from an expression given as [28]
(2)
where Ddrop is the expected diameter of the droplet diameter (μm) γ the solution
surface tension (σ = 696 gcm-1s-2) ρ the liquid density (ρ = 1gcm-3) and f the
frequency of the transducer (f = 18 MHz) The solvent diameter of the resulting ZnO
particles DZnO can be estimated from Kelvinrsquos relation [29] to be around DZnO =
031μm
(3)
where MZnO is the molecular weight of ZnO and ρZnO is the density of ZnO The
un-doped and Mn doped ZnO films were deposited for 20 and 30 min at a substrate
temperature of 350 ˚C It is worthy to point out that the films deposited for 20 min
resulted to thinner films while the 30 min deposited films resulted to thicker films in
spite of Mn concentration Temperature of the heating plate and substrate was
recorded by a K-type thermocouple and controlled by a Eurotherm400 temperature
controller All the films have been prepared by varying the Mn concentration Prior to
deposition corning 1737 F glass substrates (254times254 mm2) were ultrasonically
cleaned with acetone ethanol and deionized water
31
2
8340
fDdrop
drop
ZnO
ZnOZnO D
CMD
31
8
22 Characterization
To study the surface morphology polarized optical microscope (POM)
technique was used Thin films were placed between two covering glasses and
placed on a Linkam hot-stage (Linkam Scientific Instruments Ltd UK) mounted on a
POM instrument Raman spectra were collected using a Horiba Jobin-Yvon HR800
Raman microscope equipped with an Olympus BX-41 microscope attachment An
Ar+ laser (5145 nm) with energy setting 12 mW from a Coherent Innova Model 308
was used as an excitation source The Variable angle spectroscopic ellipsometry
(VASE) spectra () and () were obtained in the range of 250-1000 nm at room
temperature by using a rotating-compensator instrument (JA Woollam M-2000) at
multi-angles of incidence (AOI) (65 70 and 75deg) For clarity we displayed spectra
only at 75deg AOI since they behave similarly at different AOI The films were regarded
as a homogeneous material with film thickness modelled using Cauchy model [30]
A B-Spline model [31 32] was then used to extract the refractive index (n) and
extinction coefficient (k) over the absorption range from 300 to 900 nm Employing
the ellipsometric parameters (Ψ) and (Δ) the thickness refractive index (n) and the
extinction coefficient (k) of the unknown layer onto known substrate could be
extracted The microwave absorption measurements were carried out using JEOL
electron spin resonance (ESR) spectrometer operated at 94 GHz (x-band) For the
analysis the films were mounted in the cavity centre at position where the
microwave magnetic field is the maximum The DC static field HDC was slowly swept
between 0 and 500 mT The microwave power was kept at 5 mW to avoid saturation
The DC field was modulated with a superposed ac field whose amplitude was varied
between 1 mT and 6 mT at 100 kHz frequency The microwave response was
9
measured as a derivative of microwave absorption signal It should be pointed out
that the measurements were carried out at room temperature (298 K)
3 RESULTS AND DISCUSSION
Fig 1 shows the optical microscopy micrographs of Mn (2at ) doped ZnO
films deposited for 20 and 30 min by spray pyrolysis It is shown in Fig 1a that the
thinner film deposited for 20 min shows ldquoring-likerdquo structures that are attached to
each other with diameters ranging from 80 to 150 μm The thicker film deposited for
30 min Fig 1b shows more concentrated ldquoring or sphere-likerdquo structures that are
covering the entire film surface with diameters much smaller than their counterparts
Fig 1 The optical microscope images for the Mn (2 at) doped ZnO structures
with different films (a) thinner and (b) thicker films
(a) (b)
100 μm 100 μm
10
For a systematic and more detailed optical imaging of these structures
polarized optical microscopy analysis was performed on various films For the
thinner film as shown in Fig 2a it is noticed that at lower concentration 01 at
Mn no ldquoring-likerdquo spheres are observed on the film surface However at 05 at
Mn (Fig 2b) the formation of ldquoring-likerdquo structures become visible across the film
with small diameters in the range of 5-20 microm A change in colour contrast is also
observed for these films depending on the carrier concentration of Mn
The micrograph in Fig 2c shows that upon increasing the Mn doping level to 2
at Mn these ldquoring-likerdquo structures become more visible throughout the film It is
evident that these structures are due to the presence of Mn Both thinner and thicker
films of the un-doped ZnO films did not show any of these structures or features [33]
The thicker film with a doping concentration of 01 Mn shows an abundant amount
of these ldquoring or sphere-likerdquo structures which are clustered together Increasing the
doping level of Mn to 05 at a dark visible spots forming circular orientations
across the film are observed These dark visible spots diminish at higher Mn
concentration (2 at Mn) forming thicker circular orientations with much bigger
diameters (Fig 2f) This points out that the diameters of these structures are
depending more on the Mn concentration
11
Fig 2 Polarized optical microscope images of Mn doped ZnO structures of thin
(a-c) and thick films (d-f) The Mn concentrations used were 01 05 and
1at for both thinner and thicker films
(f)
100 μm
(a)
100 μm
(d)
100 μm
(b)
100 μm
(c)
100 μm
(e)
100 μm
12
Fig 3 shows SEM micrographs of undoped and Mn doped ZnO films deposited
at different film thicknesses as indicated earlier The undoped ZnO with a thinner film
shows well adherent and smooth film with smaller ZnO particles ranging from 5 to 10
nm (Fig 3a) Upon introducing the 01 at of Mn (Fig 3b) in the ZnO matrix the
ldquoring or sphere-likerdquo structures as seen by the optical microscopy are now appearing
as ldquodoughnuts-likerdquo or ldquoring-likerdquo structures with thick edges across the film in SEM
By using the in-lens detector (high magnification) in the SEM the edge of these
ldquodoughnuts-likerdquo contains nanoparticles which are 30-50 nm in diameter range
(Fig3b inset) When increasing the Mn (1 at) further (Fig 3c) the diameter of the
doughnuts or rings structures reduce while their edges becomes thicker At higher
magnification as shown in the inset of Fig 3c the particle size increases with an
increase in Mn dopant at the edge of the doughnut and are more compact Fig 3d
shows the undoped ZnO nanorods with a thicker film The results show that ZnO
nanorods are grown perpendicular to the substrate entangled to one another
forming ldquospaghetti-likerdquo structures These ldquospaghetti-likerdquo structures were previously
observed in our SEM results with an average diameter in the range of 25-35 nm [31]
Again when Mn ions (01 at) are inserted in the host matrix still ldquodoughnuts-likerdquo
structures are preserved with diameter ranging from 20 to 40 microm The higher
magnification analysis (see inset Fig3e) shows an alteration on the surface
morphology as compared to the undoped ZnO (Fig 3d) We observed formation of
nanoparticles rather than the ldquospaghetti-likerdquo structures The inset of Fig 3f shows
that the size of the nanoparticles decreases further with an increase in Mn doping
level (1 at ) This comes with an increase in the doughnuts diameters as evident in
(Fig3f) SEM image
13
Fig 3 SEM micrographs of (a) undoped ZnO with a thinner film (b) 01at (c)
1at Mn doped ZnO with thinner films (d) undoped ZnO with a thicker
film (b) 01at (c) 1at Mn doped ZnO with thicker films
10 microm
300 nm
(b)
100 nm
10 microm
(a)
300 nm
30 microm
(e)
10 microm
300 nm
(f)
(d)
100 nm
100 nm
10 microm
(c)
14
Therefore the incorporation of Mn does not only promote formation of the
doughnuts but also completely modify the ZnO structure This is consistent with our
atomic force microscopy (AFM) analysis where the surface roughness of the thinner
films increases while it decreases for thicker films with Mn concentration (results not
shown) We believe that the nature of the growth process adopted by the present
experimental set-up which points out that the observed irregularities are
characteristic of the ultrasonic nature of the atomization process and the
thermodynamic environment as the droplets strike the substrate More specifically
we attribute the early stage irregularities with the thermal gradient and the repelling
thermophoretic forces on the on-coming droplets from the high temperature (350˚C)
substrate particularly for droplets smaller than 2 μm diameters that experience a very
high evaporation rate However as the deposition process proceeds the
temperature gradient and the evaporation rate get reduced and spreading of droplets
prevails [34 35] These processes may explain the observed significant variations in
the film structure We performed an electron backscattering measurements (EBS) to
investigate whether these ldquodoughnut-likerdquo structures are of different phases The
electron backscattered analysis shown in Fig 4 also confirms the formation of
ldquodoughnut or ring likerdquo structures The results in Fig 4a and b denote that both
thinner and thicker films have two phases 1 and 2 as indicated in Fig 4a This
suggests that phase 2 is highly concentrated with the MnZnO materials than phase
1 Energy dispersive x-ray spectroscopy (EDS) mapping (see Fig S1 of the
supplementary information) showed that Mn is homogenously distributed in a
proportional ratio throughout the film without showing any clusters
15
Fig 4 EBS-Detector micrographs of Mn doped ZnO (1 at) with thinner and
thicker films deposited for (a) 20 min and (b) 30 min indicate different
phases on the surface of MnZnO films
Fig 5 shows the Raman scattering spectra of the Mn ZnO with thinner and
thicker films deposited for (a) 20 and (b) 30 min respectively measured at room
temperature The Mn ions induce disorder even if perfectly incorporated on Zn sites
inherent to the mixture of Zn and Mn on the cation sub-lattice The origin of these
features such as isolated impurity modes disorder-induced silent modes or phonon
modes by precipitates is still controversial Table 1 shows the summary of phonons
observed for both thinner and thicker films It is observed from Fig 5 and Table 1
that the FWHM of the E2H for both films reduces with increasing Mn concentration
This is probably due to the suppression of the ZnO sub-lattice induced by
incorporation of Mn2+ into Zn2+ host matrix The slight shift in E2H modes to higher
wavenumber ∆ν (cm-1) is due to non-stoichiometry and strain effects The red-
shifting normally indicates tensile strain of the oxides The high and low Raman
10 microm
(b)
10 microm
(a)
1
2
16
intensities of the vibrational modes are indicative of donor defects-induced into the
ZnO system The intrinsic lower intensity regardless of Mn concentration of the
vibrational modes at 1439 cm-1 for both thinner and thicker films indicates optical
overtones process and is associated with the 2nd order Raman active modes The
vibrational modes at 790 and 1081 cm-1 especially for the thicker films which is due
to longitudinal acoustic and transverse-optical (LA+TO) and transverse optical and
longitudinal optical stretching modes (TO+LO) respectively are defect related It can
be noticed that the modes phonon at 790 cm-1 (LA+TO) is suppressed upon addition
of Mn It is also observed that the vibrational modes at 1081 cm-1 (TO+LO) enhances
upon the addition of Mn concentration Similarly for the thinner films the same
vibrational modes at 1091 cm-1 which is red-shifted for the thicker films enhances on
increasing the Mn concentration We can conclude that it is due to the present of Mn
on Zn sub-lattice However this 1091 cm-1 mode is more resolved and excited higher
in intensity on the thinner films than on the thicker films which appears to be
suppressed or less excited The Raman phonon intensification and broadening are
an effect of disorders created during growth and the incorporation of Mn with the
local structure Extrinsic Froumlhlich scattering should not be overlooked especially for
the longitudinal optical modes
17
Fig 5 Raman spectra of MnZnO films at various concentration of Mn for both (a)
thinner and (b) thicker deposited films respectively
(a)
(b)
18
Defects and impurities magnetic correlation has been previously observed in
many cases to help understand the nature and origin of RTFM more especially in
these DMSO systems Previous results reported by Nkosi et al [36] revealed that
Mn doped ZnO films prepared by ASP possess three absorption peaks in associated
with three processes one centred at HDC asymp 6 mT (low field signal) another at ~ 150
mT (paramagnetic feature) and lastly at ~ 300 mT (ferromagnetic field resonance)
Ferromagnetic resonance (FMR) is due to the absorption in the full saturation state
while the low field absorption process is usually originating from magnetization
process far from the saturation state These results confirmed the appearance of
FMR at room temperature Fig 6 shows the effect of Mn concentration on the FMR
intensity (extracted from FMR peaks) and peak-to-peak width (∆HFMR) at different
film orientation to the applied magnetic field In Fig 6a it is noticed that the FMR
intensity signal is high at relatively low Mn concentration and reduces upon
increasing the Mn doping in the host A significant rise which is quite comparable to
that of 01 at Mn is achieved at 5 at of Mn Moreover it is observed that the
width (∆HFMR) also decreases when increasing Mn concentration On the other hand
when the films are titled normal to the applied field the FMR intensity and the width
(∆HFMR) signals decrease with an increase in Mn up to 2at However at higher
Mn (gt2at ) both FMR intensity and the width (∆HFMR) signals increase as shown in
Fig 6b It is observed from Fig 6c that the FMR intensity signal increases at higher
Mn concentration (1-5 at ) while width (∆HFMR) decreases However when the
film is measured perpendicular to the field (90 ˚) a similar behaviour is observed
(Fig 6d) This also is consistent with the surface morphology analyses
19
Fig 6 The dependence of RTFM intensity and peak-to-peak width at various Mn
concentrations (a) magnetic field parallel to the film and (b) when the
magnetic field is perpendicular to the film It should be pointed out that (a-b)
correspond to the thinner films deposited for 20 min and (c-d) thicker films
deposited for 30 min
The increase in FMR intensity from 2 at is due to the fact that the
ferromagnetism signals transform to a sharper peak related to paramagnetism This
(a) (b)
(c) (d)
20
indicates that a doping level of Mn 01-2 at results to FMR while the doping level
above 2 at resulting to a paramagnetism [36] A similar transition has been
observed by Nkosi et al [37] for nickel oxide at room temperature induced by
substrate annealing Furthermore upon increasing the doping level of Mn (5 at)
the ferromagnetism completely disappears to another form of magnetism related to
paramagnetic The spins become randomly orientated at higher atomic percentages
of Mn Moreover the optical constants (presented in Fig 8) indicate an increase in
refractive index and a decrease in extinction coefficient with increasing Mn
concentration This suggests that at higher Mn concentration the film become more
reflective to the electromagnetic radiation This alone we believe could results in
reduction in the magnetic ordering ferromagnetism However Sharma et al [10]
reported that the decrease in ferromagnetic ordering above 2 Mn doped ZnO films
was attributed to Mn clustering which resulted in shorter Mn-Mn distances This
however is in contrast with the present study as evidenced by EDX mapping analysis
(see supplementary information) It is further observed that the linewidth with the Mn
concentration change decrease which could be due to an exchange narrowing of the
ESR signal However the mechanism for intrinsic ferromagnetism in Mn-doped ZnO
thin films still remains uncertain and therefore more work is in process for illustrating
the fundamental physical processes in Mn-doped ZnO DMSs
Fig 7 shows the dependence of FMR spins with Mn concentration It is noticed
that the total number of spins for the thinner films deposited for 20 min reduce
drastically with increasing the Mn concentration However the thicker films deposited
for 30 min show an increase in number of spins at higher Mn concentration (1-2 at
) This type of reversal behaviour at higher Mn concentration is consistent with
21
surface roughness and films thickness (results not shown) Since metallic Mn is
paramagnetic any ferromagnetism detected in Mn doped ZnO cannot be due to Mn
clusters formed during the growth process Therefore we expect to see a reduction in
the number of spins with the addition of Mn However there exist some
controversies on the origin of this RTFM in the diluted magnetic semiconductors [22
23 38]
Fig 7 The dependence of number of spins (Ns) of the ferromagnetic ordering as
a function of Mn concentration
Doped ZnO films are either conducting or semiconducting as characterized by
strong coupling between localized d electrons of the transition-metal ions and the
ZnO structure characterized by highly dispersive-parabolic shape s orbitals of Zn and
22
rather localized with small dispersion p orbitals of O Thus the carriers are spin-
polarized and can mediate ferromagnetism ordering of the magnetic moments of
transition-metal ions doped into the oxide lattice ie transition-metal replace Zn2+
sites Furthermore additional electron doping such as Co Al Sn Cu Ga etc to
name a few as well as hole doping such as Co Li N Mn Fe etc has been
investigated to further examine the carriers effect on RTFM [39 40] It was
importantly noted that addition of carrier doping had no significant impact on RTFM
enhancement and some films even showed RTFM with an inverse correlation
between magnetization and electron density [3 41] Thus inconsistent phenomena
and conclusions have been obtained indicating that the intrinsic RTFM of transition-
metal doped ZnO systems remains a wide open question It is hence of vital
importance to clarify the correlation if any between carriers and the mechanism of
ferromagnetic inherent to this class of diluted magnetic semiconductors On the other
hand defects are supposed to play a primary role on ferromagnetic ordering in
transition-metal ZnO [18-21] Song et al [42] found that in Co-doped ZnO is strongly
correlated with structural defects In their case these defects are introduced by
increasing carriers (electron concentration) On the other hand an insulating nature
in these diluted magnetic materials especially Co-doped ZnO is significant in a
magnetic coupling interaction other than carrier-mediated exchange which is
apparently operative So again defects which are also normally caused by
incorporation of dopants play an important role in the system An electron
associated with a particular defect confined in a hydrogenic orbital comes with
dielectric constant as found by Song et al [43] Hence high dielectric constant
results in large hydrogenic orbital radius This is consistent with our results
presented in Fig 9 which indicate that the increase in in RTFM is induced by
23
increasing in refractive index Therefore according to the Raman results and ref
[43] this can be attributed to the structural disordering caused by ion (Mn in our
case) incorporation This will mean that the paramagnetic films (MnZnO) are
transparent to UV light and become opaque when are ferromagnetic
Fig 8 shows the refractive index (n) and extinction coefficient (k) as function of
Mn concentration It is evident that the n decrease for both films (thinner and thicker)
while the k increases with increasing the Mn concentration in the ZnO matrix There
is a hump indicated by an arrow in both films (Fig 8a and b) for the extinction
coefficient (k) This hump is observed at the same concentration of 025 at of Mn
for both thinner and thicker films However the origin and interpretation of this
observation will be discussed later in the paper
Fig 8 The dependence of optical constants n and k with Mn concentration for
the (a) thinner and (b) thicker films
(b) (a)
24
The optical constants show some interesting correlation with the FMR spins
origin Fig 9a and b show the dependence of n and k on the ferromagnetic ordering
in terms of its intensity number of spins for both thinner and thicker films
respectively It is very fascinating to note that both films show that the refractive
index (n) increases with ferromagnetic ordering while extinction coefficient (k)
reduces This suggests that when the MnZnO films become more opaque (high
reflectance) to UV (~ 370 nm) and absorbs less of that light the RTFM ordering is
enhanced Again if that is the case it would also mean that super-paramagnetic
films are more transparent to UV light
Fig 9 The dependence of optical constants with the number of ferromagnetic
spins for both (a) thinner and (b) thicker MnZnO films
(a) (b)
25
To further elucidate in detail the effect of Mn doping on the ZnO we carried out
effective medium approach (EMA) for inhomogeneous materials In keeping up with
our data the eq 1 can be re-written as follows
01
effZnO
effZnO
Mn
effMn
effMn
Mn
(4)
Only two components Mn and ZnO are considered here Solving for εeff results
into two possible solutions as
222422
2
1ZnOZnOMnMnZnOMnZnOZnOMnMneff
222422
2
1ZnOZnOMnMnZnOMnZnOZnOMnMneff
In terms of the more fundamental optical properties of ZnO there have been a
number of comprehensive studies to determine the refractive index and dielectric
constant of this material [19 44-46] The measurements were all carried out using
spectroscopic ellipsometry technique Plotting the effective dielectric properties
shown in Fig 10 solution under any given concentration values it shows that the
dielectric properties decrease with increasing concentration This agrees well with
our curves in Fig 8 especially for the refractive index
26
Fig 10 Mathematica plot fit An application of the effective medium approach to
our experimental data points to extract parameters The δMn concentration
fraction can go up 100 atomic percentage depending on experimental
condition The Mn doping in our case could go up to 1 at
This agrees well with Lichtenekerrsquos empirical logarithmic mixing rule equation
[47] often employed by other workers [48] to mix the dielectric properties of
mixtures of varying proportions mixed at room temperature decreases with amount
concentration added In order to understand a decreasing behaviour observed from
refractive index mathematica software was used to do a non-linear-model fit in our
experimental data Therefore by using the EMA model the values of n for both ZnO
and Mn were obtained as shown in Table 2 These values are in good agreement
with the ones observed from the literature [17 44-46]
27
Table 2 Summary of dielectric constant for ZnO and Mn
Estimate Std error t-Statistics P-Value R2
εZnO
εMn
211095
431666
0351447
0390812
600644
110454
000924475
000158951
0996589
The dielectric constant (ε) is normally composed of real (ε) and complex (ε)
given as follows
2ikni complexreal (5)
Expanding eq 5 further leads to
22 2 kinkni complexreal (6)
This will mean that
22 knreal and nkcomplex 2 (7)
Therefore with some simplification the refractive index (n) and extinction
coefficient (k) are given by
21
22
2
realcomplexrealn
21
22
2
realcomplexrealk
(8)
The EMA model from Bruggeman nor Maxwell-Garnet cannot justify the hump
noticed on the extinction coefficient (k) with Mn concentration (Fig 7a and b) The
28
only possible and accurate answer could be found in Drudel model of the optical
properties of metals The model does not only explain the appearance of the hump
but also explains a possible shift in energy of photon for different metals Such
behaviour is only noticed in transition-metal compounds and is said to be due to a d-
band resonance at about 3351 eV (~370 nm) The d-band lie below the Fermi
energy of the conduction band fairly narrow band of energies around ħω0 = EF - Ed
which can be modelled as additional Lorentz oscillator The combined effects of the
free-electrons (Drude model) and the inter-band transitions due to bound d-electrons
(Lorentz model) influence the reflectance properties of the metal [49] Reddy et al
[50] showed that the reflectance of Cu co-doped samples decreased with increase in
Cu concentration
4 CONCLUSION
We have successfully synthesized MnZnO films of novel structures using
aerosol spray pyrolysis at different deposition times Magnetic properties of MnZnO
films revealed ferromagnetic ordering with some low-field magnetic absorption
observed in certain concentration of Mn The effect of Mn concentration on the FMR
intensity signal and its width was successfully studied The angular dependence of
this latter was studied The results revealed that Mn concentration seems to directly
affect the dielectric constants the same way as the FMR width showing that the
refractive index decreases (including the width) as a function of Mn concentration
The obtained dielectric constants were correlated with the ferromagnetic ordering
The effect of Mn carrier concentration to ferromagnetic ordering was also studied A
d-band resonance at 335 eV was found in these MnZnO films at 025 at Mn
29
which was due to the transition-metal Bruggeman EMA model was also used in an
attempt to explain the variation of the dielectric properties (real and complex part)
and the model fit was successfully correlated with the dielectric constant for ZnO and
Mn
5 ACKNOWLEDGEMENTS
This work was supported by the Department of Science and Council for
Scientific and Industrial Research (Project Numbers LHIE100 HGER28P and
HGER27S) and WIROX project (PIRSES-GA-2011-295216) a Marie Curie
International Research Staff Exchange Scheme Fellowship within the 7th European
Community Framework Programme and lsquoORAMArsquo Oxide Materials Towards a
Matured Post-silicon Electronics ERA FP7-NMP - CONTRACT Ndeg 246334 SS
Nkosi wishes to acknowledge the SERA project (HGER29X) for the traveling costs
The authors are also thankful to the equipment supplied by the NCNSMs and
FORTH institute for the analysis
30
6 REFERENCES
[1] XY Mao W Zhong YW Du Journal of Magnetism and Magnetic Materials
320 (2008) 1102
[2] I Zutic J Fabian SD Sama Reviews of Modern Physics 76 (2004) 323
[3] C Jing Y Jiang W Bai J Chu A Liu Journal of Magnetism and Magnetic
Materials 322 (2010) 2395
[4] E Chikoidze Y Dumont HJ Bardeleben W Pacuski O Gorochov
Superlattices and Microstructures 42 (1-6) (2007) 176
[5] RQ Wu GW Peng L Liu YP Feng ZG Huang QY Wu Appl Phys Lett
89 (2006) 062505
[6] T Dietl H Ohno F Matsukura J Cibert D Ferrand Science 287 (2000)
1019
[7] K Ueda H Tabata T Kawai Appl Phys Lett 79 (7) (2001) 988
[8] YQ Wang SL Yuan L Liu P Li XX Lan ZM Tian JH He SY Yin J
Magnetism and Magnetic Materials 320 (2008) 1423
[9] H Saeki H Tabata T Kawai Solid State Communications 120 (11) (2001)
439
[10] P Sharma A Gupta KV Rao FJ Owens R Sharma R Ahuja JMO
Guillen B Johansson GA Gehring Nature Materials 2 (2003) 673
[11] P Sharma A Gupta FJ Owens A Inoue KV Rao J Magnetism and
Magnetic Materials 282 (2004) 115
[12] H Hori S Sonoda T Sasaki Y Yamamoto S Shimizu Ken-inchi Suga K
Kindo Physica B 324 (2002) 142
31
[13] DP Norton SJ Pearton AF Hebard N Theodoropoulou LA Boatner R
G Wilson Appl Phys Lett 82 (2003) 239
[14] KR Kittilstved NS Norberg DR Gamlin Phys Rev Lett 94 (2005) 147209
[15] SS Kim JH Moon B-T Lee Oh S Song J Ho Je J Appl Phys 95 (2004)
454
[16] T Fukumura Z Jin M Kawasaki T Shono T Hasegawa S Koshihara H
Koinuma Appl Phys Lett 78 (2001) 958
[17] A Tiwari C Jin A Kvit D Kumar JF Muth J Narayan Solid State
Communications 121 (2002) 371
[18] X Xu C Xu J Dai J Hu Fengji Li S Zhang J Physical Chemistry C 116
(2012) 8813
[19] JMD Coey M Venkatesan CB Fitzgerald Nat Mater 4 (2005) 173
[20] YB Zhang Q Liu T Sritharan CL Gan S Li Appl Phys Lett 89 (2006)
042510
[21] TS Herneg SP Lau SF Yu HY Yang XH Ji JS Chen N Yasui H
Inaba J Appl Phys 99 (2006) 086101
[22] W Prellier A Foucher B Mercy J Phys Condens Matter 15 (2003) R1583
[23] SJ Pearton DP Norton MP Ivill AF Hebard JM Zavada WM Chen
IA Buyanova J Electron Mater 36 (2007) 462
[24] D Stroud Phys Rev B 12 (1975) 3368
[25] G Kenanakis Z Giannakoudakis D Vernardou C Savvakis N Katsarakis
Catalysis Today 151 (2010) 34
[26] I Kortidis K Moschovis FA Mahmoud G Kiriakidis Thin Solid Films 518
(2009) 1208
[27] G Kiriakidis K Moschovis I Kortidis V Binas Vacuum 86 (2012) 495
32
[28] RJ Lang J Acoust Soc Am 34 (1962) 6
[29] W Thomson (Kelvin) Philos Mag 42 448 (1871)
[30] JA Woollam Inc Complete EaseTM Data Analysis Manual June 15 2008
[31] B Johs JS Hale Phys Status Solidi A 205 (2008) 715
[32] DE Motaung GF Malgas CJ Arendse SE Mavundla Mater Chem Phys
135 (2012) 401
[33] DE Motaung GH Mhlongo I Kortidis SS Nkosi GF Malgas BW
Mwakikunga S Sinha-Ray G Kiriakidis Applied Surface Science (2013)
submitted for publication
[34] D Perednis LJ Gauckler J Electroceramics 14 (2005) 103
[35] LA Patil AR Bari MD Shinde V Deo Sensors and Actuators B 30 (2010)
290
[36] SS Nkosi I Kortidis DE Motaung GH Mhlongo GF Malgas J Keartland
E Sideras-Haddad A Forbes BW Mwakikunga S Sinha-Ray G Kiriakidis
J Alloys and Compounds (2013) accepted
[37] SS Nkosi B Yalisi DE Motaung J Keartland E Sideras-Haddad A
Forbes BW Mwakikunga Appl Surf Sci 265 (2013) 860
[38] Usman IIyas RS Rawat Y Wang TL Tan P Lee R Chen HD Sun
Fengji Li Sam Zhang Appl Surf Sci 258 (2012) 6373
[39] Y-H Lin M Ying M Li X Wang X Wang C-H Nan Appl Phys Lett 90
(2007) 222110
[40] NH Hong V Brize J Sakai Appl Phys Lett 86 (2005) 082505
[41] M Ivill SJ Pearton YW Heo J Kelly AF Hebard DP Norton J Appl
Phys 101 (2007) 123909
33
[42] C Song SN Pan XJ Liu XW Li F Zeng WS Yan B He F Pan J
Phys Condens Matter 19 (2007) 176229
[43] C Song KW Geng F Zeng XB Wang YX Shen F Pan Phys Rev B 73
(2006) 024405
[44] H Yoshikawa S Adachi Jpn J Appl Phys 36 (1997) 6237
[45] N Ashkenov B M Mbenkum C Bundesmann V Riede M Lorenz D
Spemann E M Kaidashev A Kasic M Schubert M Grundmann G Wanger
H Neumann V Darakchieva H Arwin B Monemar J Appl Phys 93 (2003)
126
[46] XW Sun H S Kwok J Appl Phys 86 (1999) 408
[47] K Lichteneker Physik Z 27 (1926) 115
[48] NH Langton AMBritIRE AInstP D Matthews ANCRT DPI Br J
Appl Phys 9 (1958) 453
[49] DJ Hagan and PG Kik OSE5312-Light Matter Interaction CREOL The
College of Optics and Photonics University of Central Florida (2011) pp52
[50] DA Reddy G Murali B Poornaprakash RP Vijayalakshmi BK Reddy
Appl Surf Sci 258 (2012) 5206
34
FIGURE CAPTIONS AND TABLES
Table 1 Summary of Raman modes of Mn doped ZnO nanostructures with thinner
and thicker films
Table 2 Summary of the estimated dielectric constant for ZnO and Mn
Fig 1 The optical microscope images for the Mn (2 at) doped ZnO structures
with different films (a) thinner and (b) thicker films
Fig 2 Polarized optical microscope images of Mn doped ZnO structures of thin
(a-c) and thick films (d-f) The Mn concentrations used were 01 05 and
1at for both thinner and thicker films
Fig 3 SEM micrographs of (a) undoped ZnO with a thinner film (b) 01at (c)
1at Mn doped ZnO with thinner films (d) undoped ZnO with a thicker
film (b) 01at (c) 1at Mn doped ZnO with thicker films
Fig 4 EBS-Detector micrographs of Mn doped ZnO (1 at) with thinner and
thicker films deposited for (a) 20 min and (b) 30 min indicate different
phases on the surface of MnZnO films
Fig 5 Raman spectra of MnZnO films at various concentration of Mn for both
(a) thinner and (b) thicker deposited films respectively
Fig 6 The dependence of RTFM intensity and peak-to-peak width at various Mn
concentrations (a) magnetic field parallel to the film and (b) when the
magnetic field is perpendicular to the film It should be pointed out that (a-
b) correspond to the thinner films deposited for 20 min and (c-d) thicker
films deposited for 30 min
35
Fig 7 The dependence of number of spins (Ns) of the ferromagnetic ordering as
a function of Mn concentration
Fig 8 The dependence of optical constants n and k with Mn concentration for
the (a) thinner and (b) thicker films
Fig 9 The dependence of optical constants with the number of ferromagnetic
spins for both (a) thinner and (b) thicker MnZnO films
Fig 10 Mathematica plot fit An application of the effective medium approach to
our experimental data points to extract parameters The δMn concentration
fraction can go up 100 atomic percentage depending on experimental
condition The Mn doping in our case could go up to 1 at
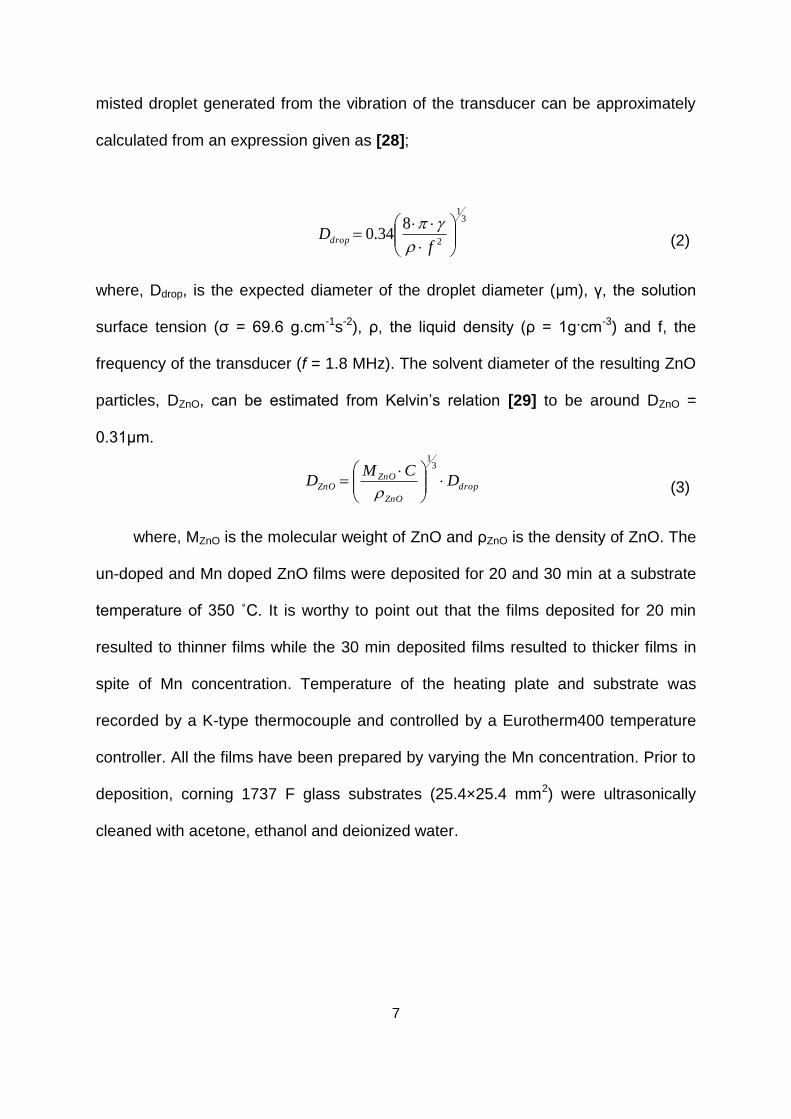
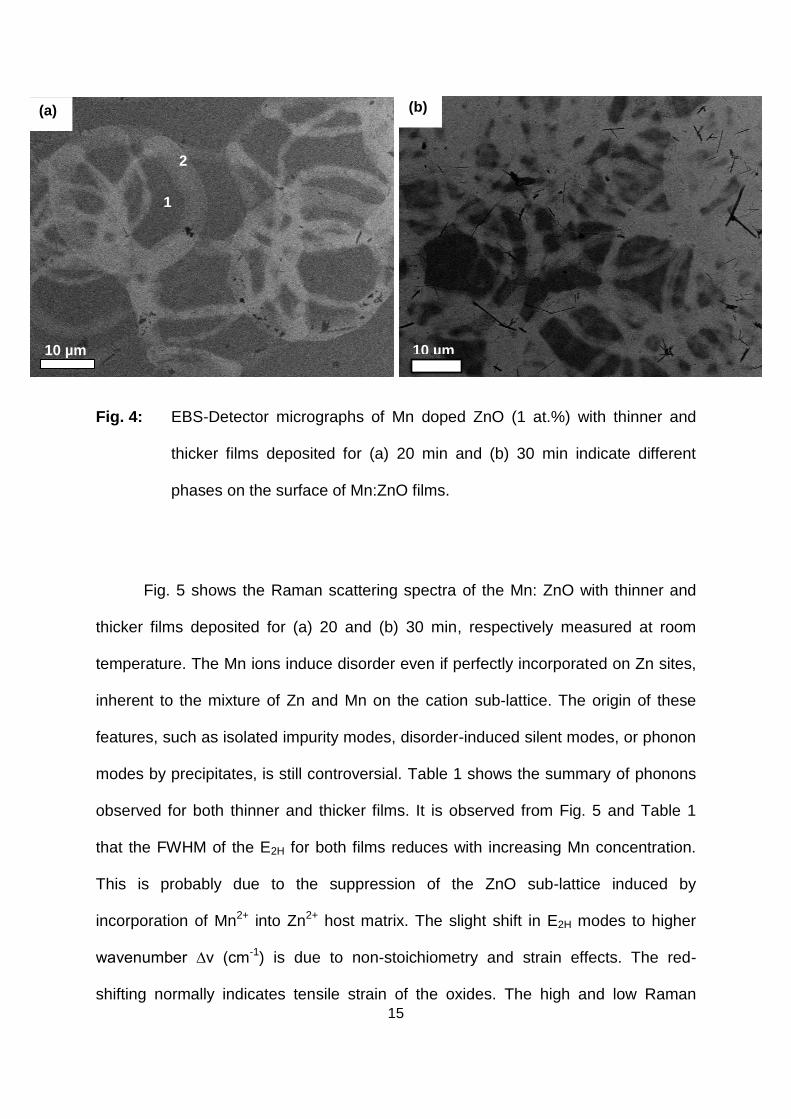
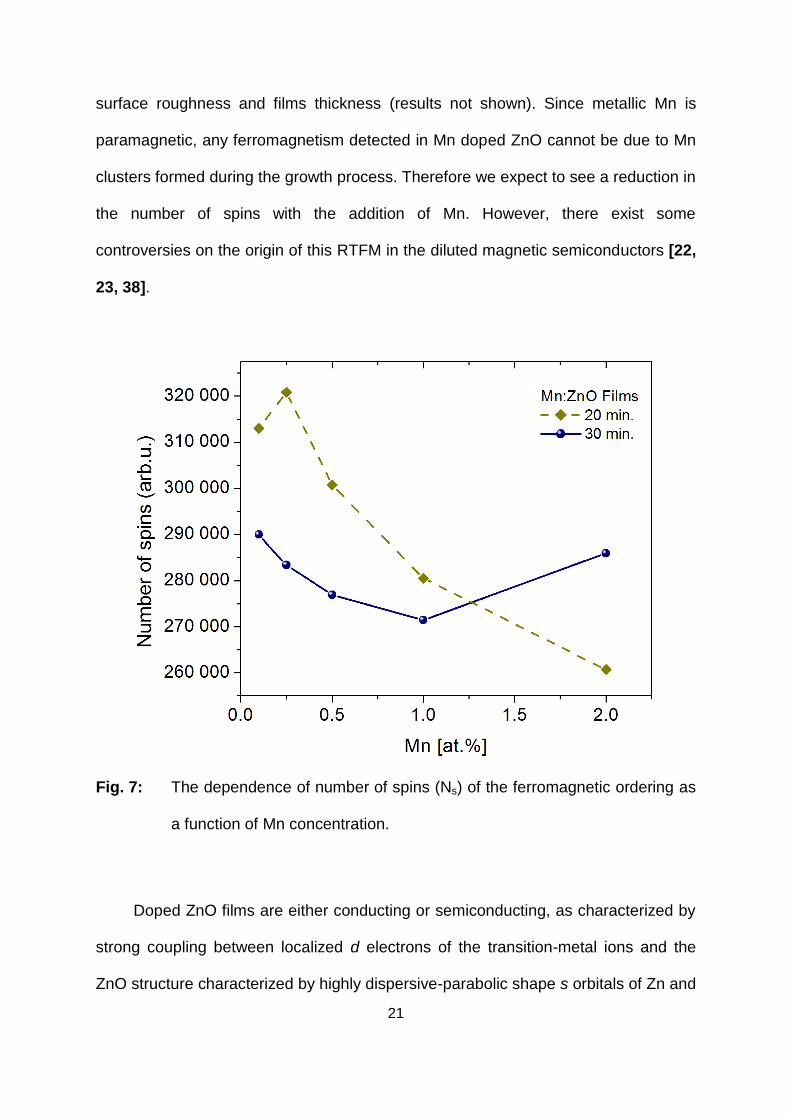
21
surface roughness and films thickness (results not shown) Since metallic Mn is
paramagnetic any ferromagnetism detected in Mn doped ZnO cannot be due to Mn
clusters formed during the growth process Therefore we expect to see a reduction in
the number of spins with the addition of Mn However there exist some
controversies on the origin of this RTFM in the diluted magnetic semiconductors [22
23 38]
Fig 7 The dependence of number of spins (Ns) of the ferromagnetic ordering as
a function of Mn concentration
Doped ZnO films are either conducting or semiconducting as characterized by
strong coupling between localized d electrons of the transition-metal ions and the
ZnO structure characterized by highly dispersive-parabolic shape s orbitals of Zn and
22
rather localized with small dispersion p orbitals of O Thus the carriers are spin-
polarized and can mediate ferromagnetism ordering of the magnetic moments of
transition-metal ions doped into the oxide lattice ie transition-metal replace Zn2+
sites Furthermore additional electron doping such as Co Al Sn Cu Ga etc to
name a few as well as hole doping such as Co Li N Mn Fe etc has been
investigated to further examine the carriers effect on RTFM [39 40] It was
importantly noted that addition of carrier doping had no significant impact on RTFM
enhancement and some films even showed RTFM with an inverse correlation
between magnetization and electron density [3 41] Thus inconsistent phenomena
and conclusions have been obtained indicating that the intrinsic RTFM of transition-
metal doped ZnO systems remains a wide open question It is hence of vital
importance to clarify the correlation if any between carriers and the mechanism of
ferromagnetic inherent to this class of diluted magnetic semiconductors On the other
hand defects are supposed to play a primary role on ferromagnetic ordering in
transition-metal ZnO [18-21] Song et al [42] found that in Co-doped ZnO is strongly
correlated with structural defects In their case these defects are introduced by
increasing carriers (electron concentration) On the other hand an insulating nature
in these diluted magnetic materials especially Co-doped ZnO is significant in a
magnetic coupling interaction other than carrier-mediated exchange which is
apparently operative So again defects which are also normally caused by
incorporation of dopants play an important role in the system An electron
associated with a particular defect confined in a hydrogenic orbital comes with
dielectric constant as found by Song et al [43] Hence high dielectric constant
results in large hydrogenic orbital radius This is consistent with our results
presented in Fig 9 which indicate that the increase in in RTFM is induced by
23
increasing in refractive index Therefore according to the Raman results and ref
[43] this can be attributed to the structural disordering caused by ion (Mn in our
case) incorporation This will mean that the paramagnetic films (MnZnO) are
transparent to UV light and become opaque when are ferromagnetic
Fig 8 shows the refractive index (n) and extinction coefficient (k) as function of
Mn concentration It is evident that the n decrease for both films (thinner and thicker)
while the k increases with increasing the Mn concentration in the ZnO matrix There
is a hump indicated by an arrow in both films (Fig 8a and b) for the extinction
coefficient (k) This hump is observed at the same concentration of 025 at of Mn
for both thinner and thicker films However the origin and interpretation of this
observation will be discussed later in the paper
Fig 8 The dependence of optical constants n and k with Mn concentration for
the (a) thinner and (b) thicker films
(b) (a)
24
The optical constants show some interesting correlation with the FMR spins
origin Fig 9a and b show the dependence of n and k on the ferromagnetic ordering
in terms of its intensity number of spins for both thinner and thicker films
respectively It is very fascinating to note that both films show that the refractive
index (n) increases with ferromagnetic ordering while extinction coefficient (k)
reduces This suggests that when the MnZnO films become more opaque (high
reflectance) to UV (~ 370 nm) and absorbs less of that light the RTFM ordering is
enhanced Again if that is the case it would also mean that super-paramagnetic
films are more transparent to UV light
Fig 9 The dependence of optical constants with the number of ferromagnetic
spins for both (a) thinner and (b) thicker MnZnO films
(a) (b)
25
To further elucidate in detail the effect of Mn doping on the ZnO we carried out
effective medium approach (EMA) for inhomogeneous materials In keeping up with
our data the eq 1 can be re-written as follows
01
effZnO
effZnO
Mn
effMn
effMn
Mn
(4)
Only two components Mn and ZnO are considered here Solving for εeff results
into two possible solutions as
222422
2
1ZnOZnOMnMnZnOMnZnOZnOMnMneff
222422
2
1ZnOZnOMnMnZnOMnZnOZnOMnMneff
In terms of the more fundamental optical properties of ZnO there have been a
number of comprehensive studies to determine the refractive index and dielectric
constant of this material [19 44-46] The measurements were all carried out using
spectroscopic ellipsometry technique Plotting the effective dielectric properties
shown in Fig 10 solution under any given concentration values it shows that the
dielectric properties decrease with increasing concentration This agrees well with
our curves in Fig 8 especially for the refractive index
26
Fig 10 Mathematica plot fit An application of the effective medium approach to
our experimental data points to extract parameters The δMn concentration
fraction can go up 100 atomic percentage depending on experimental
condition The Mn doping in our case could go up to 1 at
This agrees well with Lichtenekerrsquos empirical logarithmic mixing rule equation
[47] often employed by other workers [48] to mix the dielectric properties of
mixtures of varying proportions mixed at room temperature decreases with amount
concentration added In order to understand a decreasing behaviour observed from
refractive index mathematica software was used to do a non-linear-model fit in our
experimental data Therefore by using the EMA model the values of n for both ZnO
and Mn were obtained as shown in Table 2 These values are in good agreement
with the ones observed from the literature [17 44-46]
27
Table 2 Summary of dielectric constant for ZnO and Mn
Estimate Std error t-Statistics P-Value R2
εZnO
εMn
211095
431666
0351447
0390812
600644
110454
000924475
000158951
0996589
The dielectric constant (ε) is normally composed of real (ε) and complex (ε)
given as follows
2ikni complexreal (5)
Expanding eq 5 further leads to
22 2 kinkni complexreal (6)
This will mean that
22 knreal and nkcomplex 2 (7)
Therefore with some simplification the refractive index (n) and extinction
coefficient (k) are given by
21
22
2
realcomplexrealn
21
22
2
realcomplexrealk
(8)
The EMA model from Bruggeman nor Maxwell-Garnet cannot justify the hump
noticed on the extinction coefficient (k) with Mn concentration (Fig 7a and b) The
28
only possible and accurate answer could be found in Drudel model of the optical
properties of metals The model does not only explain the appearance of the hump
but also explains a possible shift in energy of photon for different metals Such
behaviour is only noticed in transition-metal compounds and is said to be due to a d-
band resonance at about 3351 eV (~370 nm) The d-band lie below the Fermi
energy of the conduction band fairly narrow band of energies around ħω0 = EF - Ed
which can be modelled as additional Lorentz oscillator The combined effects of the
free-electrons (Drude model) and the inter-band transitions due to bound d-electrons
(Lorentz model) influence the reflectance properties of the metal [49] Reddy et al
[50] showed that the reflectance of Cu co-doped samples decreased with increase in
Cu concentration
4 CONCLUSION
We have successfully synthesized MnZnO films of novel structures using
aerosol spray pyrolysis at different deposition times Magnetic properties of MnZnO
films revealed ferromagnetic ordering with some low-field magnetic absorption
observed in certain concentration of Mn The effect of Mn concentration on the FMR
intensity signal and its width was successfully studied The angular dependence of
this latter was studied The results revealed that Mn concentration seems to directly
affect the dielectric constants the same way as the FMR width showing that the
refractive index decreases (including the width) as a function of Mn concentration
The obtained dielectric constants were correlated with the ferromagnetic ordering
The effect of Mn carrier concentration to ferromagnetic ordering was also studied A
d-band resonance at 335 eV was found in these MnZnO films at 025 at Mn
29
which was due to the transition-metal Bruggeman EMA model was also used in an
attempt to explain the variation of the dielectric properties (real and complex part)
and the model fit was successfully correlated with the dielectric constant for ZnO and
Mn
5 ACKNOWLEDGEMENTS
This work was supported by the Department of Science and Council for
Scientific and Industrial Research (Project Numbers LHIE100 HGER28P and
HGER27S) and WIROX project (PIRSES-GA-2011-295216) a Marie Curie
International Research Staff Exchange Scheme Fellowship within the 7th European
Community Framework Programme and lsquoORAMArsquo Oxide Materials Towards a
Matured Post-silicon Electronics ERA FP7-NMP - CONTRACT Ndeg 246334 SS
Nkosi wishes to acknowledge the SERA project (HGER29X) for the traveling costs
The authors are also thankful to the equipment supplied by the NCNSMs and
FORTH institute for the analysis
30
6 REFERENCES
[1] XY Mao W Zhong YW Du Journal of Magnetism and Magnetic Materials
320 (2008) 1102
[2] I Zutic J Fabian SD Sama Reviews of Modern Physics 76 (2004) 323
[3] C Jing Y Jiang W Bai J Chu A Liu Journal of Magnetism and Magnetic
Materials 322 (2010) 2395
[4] E Chikoidze Y Dumont HJ Bardeleben W Pacuski O Gorochov
Superlattices and Microstructures 42 (1-6) (2007) 176
[5] RQ Wu GW Peng L Liu YP Feng ZG Huang QY Wu Appl Phys Lett
89 (2006) 062505
[6] T Dietl H Ohno F Matsukura J Cibert D Ferrand Science 287 (2000)
1019
[7] K Ueda H Tabata T Kawai Appl Phys Lett 79 (7) (2001) 988
[8] YQ Wang SL Yuan L Liu P Li XX Lan ZM Tian JH He SY Yin J
Magnetism and Magnetic Materials 320 (2008) 1423
[9] H Saeki H Tabata T Kawai Solid State Communications 120 (11) (2001)
439
[10] P Sharma A Gupta KV Rao FJ Owens R Sharma R Ahuja JMO
Guillen B Johansson GA Gehring Nature Materials 2 (2003) 673
[11] P Sharma A Gupta FJ Owens A Inoue KV Rao J Magnetism and
Magnetic Materials 282 (2004) 115
[12] H Hori S Sonoda T Sasaki Y Yamamoto S Shimizu Ken-inchi Suga K
Kindo Physica B 324 (2002) 142
31
[13] DP Norton SJ Pearton AF Hebard N Theodoropoulou LA Boatner R
G Wilson Appl Phys Lett 82 (2003) 239
[14] KR Kittilstved NS Norberg DR Gamlin Phys Rev Lett 94 (2005) 147209
[15] SS Kim JH Moon B-T Lee Oh S Song J Ho Je J Appl Phys 95 (2004)
454
[16] T Fukumura Z Jin M Kawasaki T Shono T Hasegawa S Koshihara H
Koinuma Appl Phys Lett 78 (2001) 958
[17] A Tiwari C Jin A Kvit D Kumar JF Muth J Narayan Solid State
Communications 121 (2002) 371
[18] X Xu C Xu J Dai J Hu Fengji Li S Zhang J Physical Chemistry C 116
(2012) 8813
[19] JMD Coey M Venkatesan CB Fitzgerald Nat Mater 4 (2005) 173
[20] YB Zhang Q Liu T Sritharan CL Gan S Li Appl Phys Lett 89 (2006)
042510
[21] TS Herneg SP Lau SF Yu HY Yang XH Ji JS Chen N Yasui H
Inaba J Appl Phys 99 (2006) 086101
[22] W Prellier A Foucher B Mercy J Phys Condens Matter 15 (2003) R1583
[23] SJ Pearton DP Norton MP Ivill AF Hebard JM Zavada WM Chen
IA Buyanova J Electron Mater 36 (2007) 462
[24] D Stroud Phys Rev B 12 (1975) 3368
[25] G Kenanakis Z Giannakoudakis D Vernardou C Savvakis N Katsarakis
Catalysis Today 151 (2010) 34
[26] I Kortidis K Moschovis FA Mahmoud G Kiriakidis Thin Solid Films 518
(2009) 1208
[27] G Kiriakidis K Moschovis I Kortidis V Binas Vacuum 86 (2012) 495
32
[28] RJ Lang J Acoust Soc Am 34 (1962) 6
[29] W Thomson (Kelvin) Philos Mag 42 448 (1871)
[30] JA Woollam Inc Complete EaseTM Data Analysis Manual June 15 2008
[31] B Johs JS Hale Phys Status Solidi A 205 (2008) 715
[32] DE Motaung GF Malgas CJ Arendse SE Mavundla Mater Chem Phys
135 (2012) 401
[33] DE Motaung GH Mhlongo I Kortidis SS Nkosi GF Malgas BW
Mwakikunga S Sinha-Ray G Kiriakidis Applied Surface Science (2013)
submitted for publication
[34] D Perednis LJ Gauckler J Electroceramics 14 (2005) 103
[35] LA Patil AR Bari MD Shinde V Deo Sensors and Actuators B 30 (2010)
290
[36] SS Nkosi I Kortidis DE Motaung GH Mhlongo GF Malgas J Keartland
E Sideras-Haddad A Forbes BW Mwakikunga S Sinha-Ray G Kiriakidis
J Alloys and Compounds (2013) accepted
[37] SS Nkosi B Yalisi DE Motaung J Keartland E Sideras-Haddad A
Forbes BW Mwakikunga Appl Surf Sci 265 (2013) 860
[38] Usman IIyas RS Rawat Y Wang TL Tan P Lee R Chen HD Sun
Fengji Li Sam Zhang Appl Surf Sci 258 (2012) 6373
[39] Y-H Lin M Ying M Li X Wang X Wang C-H Nan Appl Phys Lett 90
(2007) 222110
[40] NH Hong V Brize J Sakai Appl Phys Lett 86 (2005) 082505
[41] M Ivill SJ Pearton YW Heo J Kelly AF Hebard DP Norton J Appl
Phys 101 (2007) 123909
33
[42] C Song SN Pan XJ Liu XW Li F Zeng WS Yan B He F Pan J
Phys Condens Matter 19 (2007) 176229
[43] C Song KW Geng F Zeng XB Wang YX Shen F Pan Phys Rev B 73
(2006) 024405
[44] H Yoshikawa S Adachi Jpn J Appl Phys 36 (1997) 6237
[45] N Ashkenov B M Mbenkum C Bundesmann V Riede M Lorenz D
Spemann E M Kaidashev A Kasic M Schubert M Grundmann G Wanger
H Neumann V Darakchieva H Arwin B Monemar J Appl Phys 93 (2003)
126
[46] XW Sun H S Kwok J Appl Phys 86 (1999) 408
[47] K Lichteneker Physik Z 27 (1926) 115
[48] NH Langton AMBritIRE AInstP D Matthews ANCRT DPI Br J
Appl Phys 9 (1958) 453
[49] DJ Hagan and PG Kik OSE5312-Light Matter Interaction CREOL The
College of Optics and Photonics University of Central Florida (2011) pp52
[50] DA Reddy G Murali B Poornaprakash RP Vijayalakshmi BK Reddy
Appl Surf Sci 258 (2012) 5206
34
FIGURE CAPTIONS AND TABLES
Table 1 Summary of Raman modes of Mn doped ZnO nanostructures with thinner
and thicker films
Table 2 Summary of the estimated dielectric constant for ZnO and Mn
Fig 1 The optical microscope images for the Mn (2 at) doped ZnO structures
with different films (a) thinner and (b) thicker films
Fig 2 Polarized optical microscope images of Mn doped ZnO structures of thin
(a-c) and thick films (d-f) The Mn concentrations used were 01 05 and
1at for both thinner and thicker films
Fig 3 SEM micrographs of (a) undoped ZnO with a thinner film (b) 01at (c)
1at Mn doped ZnO with thinner films (d) undoped ZnO with a thicker
film (b) 01at (c) 1at Mn doped ZnO with thicker films
Fig 4 EBS-Detector micrographs of Mn doped ZnO (1 at) with thinner and
thicker films deposited for (a) 20 min and (b) 30 min indicate different
phases on the surface of MnZnO films
Fig 5 Raman spectra of MnZnO films at various concentration of Mn for both
(a) thinner and (b) thicker deposited films respectively
Fig 6 The dependence of RTFM intensity and peak-to-peak width at various Mn
concentrations (a) magnetic field parallel to the film and (b) when the
magnetic field is perpendicular to the film It should be pointed out that (a-
b) correspond to the thinner films deposited for 20 min and (c-d) thicker
films deposited for 30 min
35
Fig 7 The dependence of number of spins (Ns) of the ferromagnetic ordering as
a function of Mn concentration
Fig 8 The dependence of optical constants n and k with Mn concentration for
the (a) thinner and (b) thicker films
Fig 9 The dependence of optical constants with the number of ferromagnetic
spins for both (a) thinner and (b) thicker MnZnO films
Fig 10 Mathematica plot fit An application of the effective medium approach to
our experimental data points to extract parameters The δMn concentration
fraction can go up 100 atomic percentage depending on experimental
condition The Mn doping in our case could go up to 1 at

22
rather localized with small dispersion p orbitals of O Thus the carriers are spin-
polarized and can mediate ferromagnetism ordering of the magnetic moments of
transition-metal ions doped into the oxide lattice ie transition-metal replace Zn2+
sites Furthermore additional electron doping such as Co Al Sn Cu Ga etc to
name a few as well as hole doping such as Co Li N Mn Fe etc has been
investigated to further examine the carriers effect on RTFM [39 40] It was
importantly noted that addition of carrier doping had no significant impact on RTFM
enhancement and some films even showed RTFM with an inverse correlation
between magnetization and electron density [3 41] Thus inconsistent phenomena
and conclusions have been obtained indicating that the intrinsic RTFM of transition-
metal doped ZnO systems remains a wide open question It is hence of vital
importance to clarify the correlation if any between carriers and the mechanism of
ferromagnetic inherent to this class of diluted magnetic semiconductors On the other
hand defects are supposed to play a primary role on ferromagnetic ordering in
transition-metal ZnO [18-21] Song et al [42] found that in Co-doped ZnO is strongly
correlated with structural defects In their case these defects are introduced by
increasing carriers (electron concentration) On the other hand an insulating nature
in these diluted magnetic materials especially Co-doped ZnO is significant in a
magnetic coupling interaction other than carrier-mediated exchange which is
apparently operative So again defects which are also normally caused by
incorporation of dopants play an important role in the system An electron
associated with a particular defect confined in a hydrogenic orbital comes with
dielectric constant as found by Song et al [43] Hence high dielectric constant
results in large hydrogenic orbital radius This is consistent with our results
presented in Fig 9 which indicate that the increase in in RTFM is induced by
23
increasing in refractive index Therefore according to the Raman results and ref
[43] this can be attributed to the structural disordering caused by ion (Mn in our
case) incorporation This will mean that the paramagnetic films (MnZnO) are
transparent to UV light and become opaque when are ferromagnetic
Fig 8 shows the refractive index (n) and extinction coefficient (k) as function of
Mn concentration It is evident that the n decrease for both films (thinner and thicker)
while the k increases with increasing the Mn concentration in the ZnO matrix There
is a hump indicated by an arrow in both films (Fig 8a and b) for the extinction
coefficient (k) This hump is observed at the same concentration of 025 at of Mn
for both thinner and thicker films However the origin and interpretation of this
observation will be discussed later in the paper
Fig 8 The dependence of optical constants n and k with Mn concentration for
the (a) thinner and (b) thicker films
(b) (a)
24
The optical constants show some interesting correlation with the FMR spins
origin Fig 9a and b show the dependence of n and k on the ferromagnetic ordering
in terms of its intensity number of spins for both thinner and thicker films
respectively It is very fascinating to note that both films show that the refractive
index (n) increases with ferromagnetic ordering while extinction coefficient (k)
reduces This suggests that when the MnZnO films become more opaque (high
reflectance) to UV (~ 370 nm) and absorbs less of that light the RTFM ordering is
enhanced Again if that is the case it would also mean that super-paramagnetic
films are more transparent to UV light
Fig 9 The dependence of optical constants with the number of ferromagnetic
spins for both (a) thinner and (b) thicker MnZnO films
(a) (b)
25
To further elucidate in detail the effect of Mn doping on the ZnO we carried out
effective medium approach (EMA) for inhomogeneous materials In keeping up with
our data the eq 1 can be re-written as follows
01
effZnO
effZnO
Mn
effMn
effMn
Mn
(4)
Only two components Mn and ZnO are considered here Solving for εeff results
into two possible solutions as
222422
2
1ZnOZnOMnMnZnOMnZnOZnOMnMneff
222422
2
1ZnOZnOMnMnZnOMnZnOZnOMnMneff
In terms of the more fundamental optical properties of ZnO there have been a
number of comprehensive studies to determine the refractive index and dielectric
constant of this material [19 44-46] The measurements were all carried out using
spectroscopic ellipsometry technique Plotting the effective dielectric properties
shown in Fig 10 solution under any given concentration values it shows that the
dielectric properties decrease with increasing concentration This agrees well with
our curves in Fig 8 especially for the refractive index
26
Fig 10 Mathematica plot fit An application of the effective medium approach to
our experimental data points to extract parameters The δMn concentration
fraction can go up 100 atomic percentage depending on experimental
condition The Mn doping in our case could go up to 1 at
This agrees well with Lichtenekerrsquos empirical logarithmic mixing rule equation
[47] often employed by other workers [48] to mix the dielectric properties of
mixtures of varying proportions mixed at room temperature decreases with amount
concentration added In order to understand a decreasing behaviour observed from
refractive index mathematica software was used to do a non-linear-model fit in our
experimental data Therefore by using the EMA model the values of n for both ZnO
and Mn were obtained as shown in Table 2 These values are in good agreement
with the ones observed from the literature [17 44-46]
27
Table 2 Summary of dielectric constant for ZnO and Mn
Estimate Std error t-Statistics P-Value R2
εZnO
εMn
211095
431666
0351447
0390812
600644
110454
000924475
000158951
0996589
The dielectric constant (ε) is normally composed of real (ε) and complex (ε)
given as follows
2ikni complexreal (5)
Expanding eq 5 further leads to
22 2 kinkni complexreal (6)
This will mean that
22 knreal and nkcomplex 2 (7)
Therefore with some simplification the refractive index (n) and extinction
coefficient (k) are given by
21
22
2
realcomplexrealn
21
22
2
realcomplexrealk
(8)
The EMA model from Bruggeman nor Maxwell-Garnet cannot justify the hump
noticed on the extinction coefficient (k) with Mn concentration (Fig 7a and b) The
28
only possible and accurate answer could be found in Drudel model of the optical
properties of metals The model does not only explain the appearance of the hump
but also explains a possible shift in energy of photon for different metals Such
behaviour is only noticed in transition-metal compounds and is said to be due to a d-
band resonance at about 3351 eV (~370 nm) The d-band lie below the Fermi
energy of the conduction band fairly narrow band of energies around ħω0 = EF - Ed
which can be modelled as additional Lorentz oscillator The combined effects of the
free-electrons (Drude model) and the inter-band transitions due to bound d-electrons
(Lorentz model) influence the reflectance properties of the metal [49] Reddy et al
[50] showed that the reflectance of Cu co-doped samples decreased with increase in
Cu concentration
4 CONCLUSION
We have successfully synthesized MnZnO films of novel structures using
aerosol spray pyrolysis at different deposition times Magnetic properties of MnZnO
films revealed ferromagnetic ordering with some low-field magnetic absorption
observed in certain concentration of Mn The effect of Mn concentration on the FMR
intensity signal and its width was successfully studied The angular dependence of
this latter was studied The results revealed that Mn concentration seems to directly
affect the dielectric constants the same way as the FMR width showing that the
refractive index decreases (including the width) as a function of Mn concentration
The obtained dielectric constants were correlated with the ferromagnetic ordering
The effect of Mn carrier concentration to ferromagnetic ordering was also studied A
d-band resonance at 335 eV was found in these MnZnO films at 025 at Mn
29
which was due to the transition-metal Bruggeman EMA model was also used in an
attempt to explain the variation of the dielectric properties (real and complex part)
and the model fit was successfully correlated with the dielectric constant for ZnO and
Mn
5 ACKNOWLEDGEMENTS
This work was supported by the Department of Science and Council for
Scientific and Industrial Research (Project Numbers LHIE100 HGER28P and
HGER27S) and WIROX project (PIRSES-GA-2011-295216) a Marie Curie
International Research Staff Exchange Scheme Fellowship within the 7th European
Community Framework Programme and lsquoORAMArsquo Oxide Materials Towards a
Matured Post-silicon Electronics ERA FP7-NMP - CONTRACT Ndeg 246334 SS
Nkosi wishes to acknowledge the SERA project (HGER29X) for the traveling costs
The authors are also thankful to the equipment supplied by the NCNSMs and
FORTH institute for the analysis
30
6 REFERENCES
[1] XY Mao W Zhong YW Du Journal of Magnetism and Magnetic Materials
320 (2008) 1102
[2] I Zutic J Fabian SD Sama Reviews of Modern Physics 76 (2004) 323
[3] C Jing Y Jiang W Bai J Chu A Liu Journal of Magnetism and Magnetic
Materials 322 (2010) 2395
[4] E Chikoidze Y Dumont HJ Bardeleben W Pacuski O Gorochov
Superlattices and Microstructures 42 (1-6) (2007) 176
[5] RQ Wu GW Peng L Liu YP Feng ZG Huang QY Wu Appl Phys Lett
89 (2006) 062505
[6] T Dietl H Ohno F Matsukura J Cibert D Ferrand Science 287 (2000)
1019
[7] K Ueda H Tabata T Kawai Appl Phys Lett 79 (7) (2001) 988
[8] YQ Wang SL Yuan L Liu P Li XX Lan ZM Tian JH He SY Yin J
Magnetism and Magnetic Materials 320 (2008) 1423
[9] H Saeki H Tabata T Kawai Solid State Communications 120 (11) (2001)
439
[10] P Sharma A Gupta KV Rao FJ Owens R Sharma R Ahuja JMO
Guillen B Johansson GA Gehring Nature Materials 2 (2003) 673
[11] P Sharma A Gupta FJ Owens A Inoue KV Rao J Magnetism and
Magnetic Materials 282 (2004) 115
[12] H Hori S Sonoda T Sasaki Y Yamamoto S Shimizu Ken-inchi Suga K
Kindo Physica B 324 (2002) 142
31
[13] DP Norton SJ Pearton AF Hebard N Theodoropoulou LA Boatner R
G Wilson Appl Phys Lett 82 (2003) 239
[14] KR Kittilstved NS Norberg DR Gamlin Phys Rev Lett 94 (2005) 147209
[15] SS Kim JH Moon B-T Lee Oh S Song J Ho Je J Appl Phys 95 (2004)
454
[16] T Fukumura Z Jin M Kawasaki T Shono T Hasegawa S Koshihara H
Koinuma Appl Phys Lett 78 (2001) 958
[17] A Tiwari C Jin A Kvit D Kumar JF Muth J Narayan Solid State
Communications 121 (2002) 371
[18] X Xu C Xu J Dai J Hu Fengji Li S Zhang J Physical Chemistry C 116
(2012) 8813
[19] JMD Coey M Venkatesan CB Fitzgerald Nat Mater 4 (2005) 173
[20] YB Zhang Q Liu T Sritharan CL Gan S Li Appl Phys Lett 89 (2006)
042510
[21] TS Herneg SP Lau SF Yu HY Yang XH Ji JS Chen N Yasui H
Inaba J Appl Phys 99 (2006) 086101
[22] W Prellier A Foucher B Mercy J Phys Condens Matter 15 (2003) R1583
[23] SJ Pearton DP Norton MP Ivill AF Hebard JM Zavada WM Chen
IA Buyanova J Electron Mater 36 (2007) 462
[24] D Stroud Phys Rev B 12 (1975) 3368
[25] G Kenanakis Z Giannakoudakis D Vernardou C Savvakis N Katsarakis
Catalysis Today 151 (2010) 34
[26] I Kortidis K Moschovis FA Mahmoud G Kiriakidis Thin Solid Films 518
(2009) 1208
[27] G Kiriakidis K Moschovis I Kortidis V Binas Vacuum 86 (2012) 495
32
[28] RJ Lang J Acoust Soc Am 34 (1962) 6
[29] W Thomson (Kelvin) Philos Mag 42 448 (1871)
[30] JA Woollam Inc Complete EaseTM Data Analysis Manual June 15 2008
[31] B Johs JS Hale Phys Status Solidi A 205 (2008) 715
[32] DE Motaung GF Malgas CJ Arendse SE Mavundla Mater Chem Phys
135 (2012) 401
[33] DE Motaung GH Mhlongo I Kortidis SS Nkosi GF Malgas BW
Mwakikunga S Sinha-Ray G Kiriakidis Applied Surface Science (2013)
submitted for publication
[34] D Perednis LJ Gauckler J Electroceramics 14 (2005) 103
[35] LA Patil AR Bari MD Shinde V Deo Sensors and Actuators B 30 (2010)
290
[36] SS Nkosi I Kortidis DE Motaung GH Mhlongo GF Malgas J Keartland
E Sideras-Haddad A Forbes BW Mwakikunga S Sinha-Ray G Kiriakidis
J Alloys and Compounds (2013) accepted
[37] SS Nkosi B Yalisi DE Motaung J Keartland E Sideras-Haddad A
Forbes BW Mwakikunga Appl Surf Sci 265 (2013) 860
[38] Usman IIyas RS Rawat Y Wang TL Tan P Lee R Chen HD Sun
Fengji Li Sam Zhang Appl Surf Sci 258 (2012) 6373
[39] Y-H Lin M Ying M Li X Wang X Wang C-H Nan Appl Phys Lett 90
(2007) 222110
[40] NH Hong V Brize J Sakai Appl Phys Lett 86 (2005) 082505
[41] M Ivill SJ Pearton YW Heo J Kelly AF Hebard DP Norton J Appl
Phys 101 (2007) 123909
33
[42] C Song SN Pan XJ Liu XW Li F Zeng WS Yan B He F Pan J
Phys Condens Matter 19 (2007) 176229
[43] C Song KW Geng F Zeng XB Wang YX Shen F Pan Phys Rev B 73
(2006) 024405
[44] H Yoshikawa S Adachi Jpn J Appl Phys 36 (1997) 6237
[45] N Ashkenov B M Mbenkum C Bundesmann V Riede M Lorenz D
Spemann E M Kaidashev A Kasic M Schubert M Grundmann G Wanger
H Neumann V Darakchieva H Arwin B Monemar J Appl Phys 93 (2003)
126
[46] XW Sun H S Kwok J Appl Phys 86 (1999) 408
[47] K Lichteneker Physik Z 27 (1926) 115
[48] NH Langton AMBritIRE AInstP D Matthews ANCRT DPI Br J
Appl Phys 9 (1958) 453
[49] DJ Hagan and PG Kik OSE5312-Light Matter Interaction CREOL The
College of Optics and Photonics University of Central Florida (2011) pp52
[50] DA Reddy G Murali B Poornaprakash RP Vijayalakshmi BK Reddy
Appl Surf Sci 258 (2012) 5206
34
FIGURE CAPTIONS AND TABLES
Table 1 Summary of Raman modes of Mn doped ZnO nanostructures with thinner
and thicker films
Table 2 Summary of the estimated dielectric constant for ZnO and Mn
Fig 1 The optical microscope images for the Mn (2 at) doped ZnO structures
with different films (a) thinner and (b) thicker films
Fig 2 Polarized optical microscope images of Mn doped ZnO structures of thin
(a-c) and thick films (d-f) The Mn concentrations used were 01 05 and
1at for both thinner and thicker films
Fig 3 SEM micrographs of (a) undoped ZnO with a thinner film (b) 01at (c)
1at Mn doped ZnO with thinner films (d) undoped ZnO with a thicker
film (b) 01at (c) 1at Mn doped ZnO with thicker films
Fig 4 EBS-Detector micrographs of Mn doped ZnO (1 at) with thinner and
thicker films deposited for (a) 20 min and (b) 30 min indicate different
phases on the surface of MnZnO films
Fig 5 Raman spectra of MnZnO films at various concentration of Mn for both
(a) thinner and (b) thicker deposited films respectively
Fig 6 The dependence of RTFM intensity and peak-to-peak width at various Mn
concentrations (a) magnetic field parallel to the film and (b) when the
magnetic field is perpendicular to the film It should be pointed out that (a-
b) correspond to the thinner films deposited for 20 min and (c-d) thicker
films deposited for 30 min
35
Fig 7 The dependence of number of spins (Ns) of the ferromagnetic ordering as
a function of Mn concentration
Fig 8 The dependence of optical constants n and k with Mn concentration for
the (a) thinner and (b) thicker films
Fig 9 The dependence of optical constants with the number of ferromagnetic
spins for both (a) thinner and (b) thicker MnZnO films
Fig 10 Mathematica plot fit An application of the effective medium approach to
our experimental data points to extract parameters The δMn concentration
fraction can go up 100 atomic percentage depending on experimental
condition The Mn doping in our case could go up to 1 at
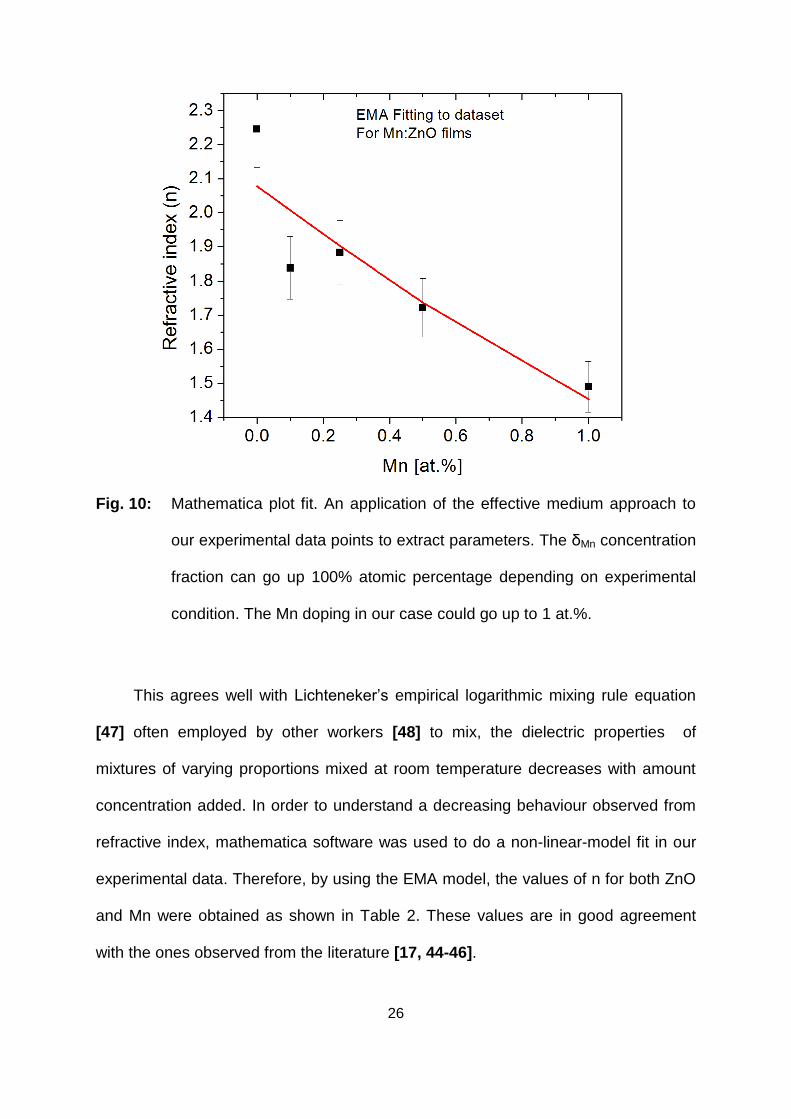